


Features
- 6 Unique slides
- Fully editable and easy to edit in Microsoft Powerpoint, Keynote and Google Slides
- 16:9 widescreen layout
- Clean and professional designs
- Export to JPG, PDF or send by email


Do you have any questions?
Recommend


4 slides
Content Calendar and Engagement Plan Presentation
Plan and track content effectively with this calendar-style engagement layout. Visualize posting frequency, engagement goals, and campaign performance in a single view. Ideal for content strategists and marketers managing social or editorial schedules. Fully editable in PowerPoint, Keynote, or Google Slides to suit your unique workflow and branding needs.


6 slides
Time Management Benefits Infographics
Unlock the benefits of effective time management with our Time Management Benefits infographic template. This template is fully compatible with popular presentation software like PowerPoint, Keynote, and Google Slides, allowing you to easily customize it to illustrate and communicate the advantages of mastering your time. The Time Management Benefits infographic template offers a visually engaging platform to highlight the positive outcomes of efficient time management, including increased productivity, reduced stress, improved work-life balance, and more. Whether you're a professional, student, or anyone looking to make the most of their time, this template provides a user-friendly canvas to create informative presentations and educational materials. Optimize your time management skills with this SEO-optimized Time Management Benefits infographic template, thoughtfully designed for clarity and ease of use. Customize it to showcase specific benefits, time-saving techniques, tools, and strategies for effective time management, ensuring that your audience understands the value of this essential skill. Start crafting your personalized infographic today to reap the rewards of improved time management.


8 slides
Team Roles & Skills Chart Presentation
Bring your team’s strengths to life with this clean, engaging slide designed to highlight individual roles, skill levels, and key capabilities. It helps teams clearly visualize expertise, compare competencies, and communicate responsibilities with ease. Fully editable and compatible with PowerPoint, Keynote, and Google Slides.

20 slides
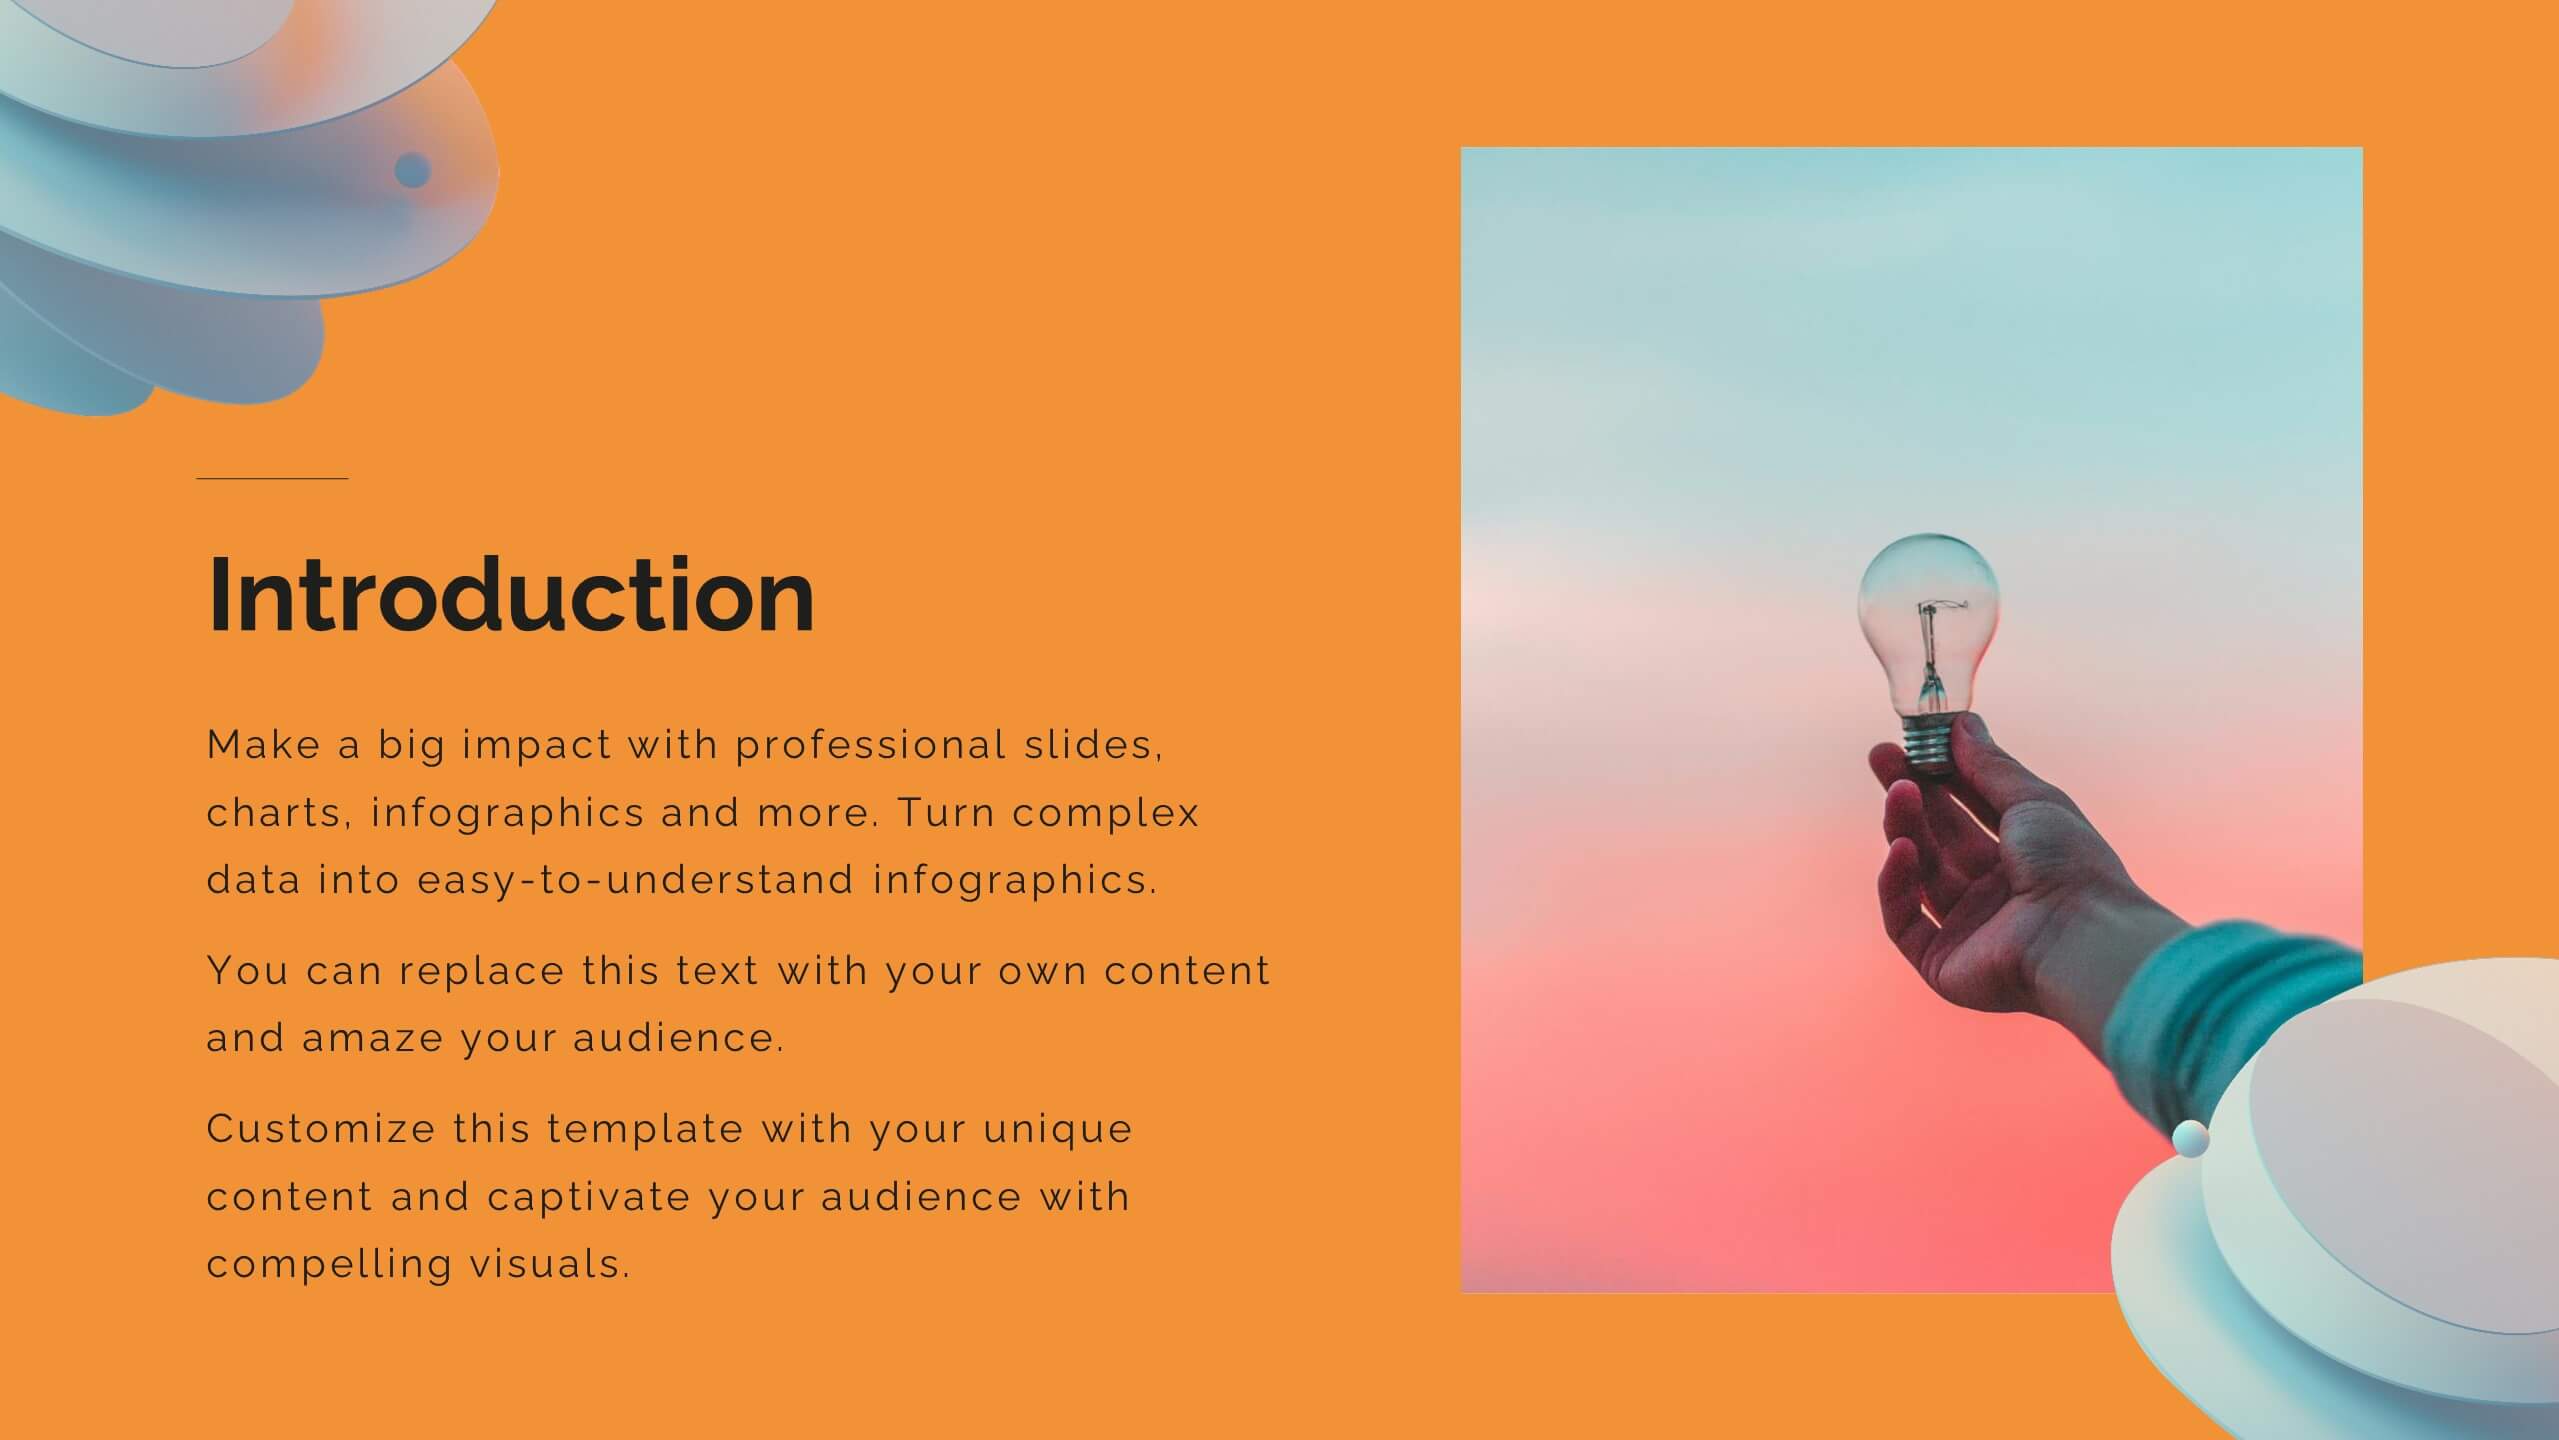
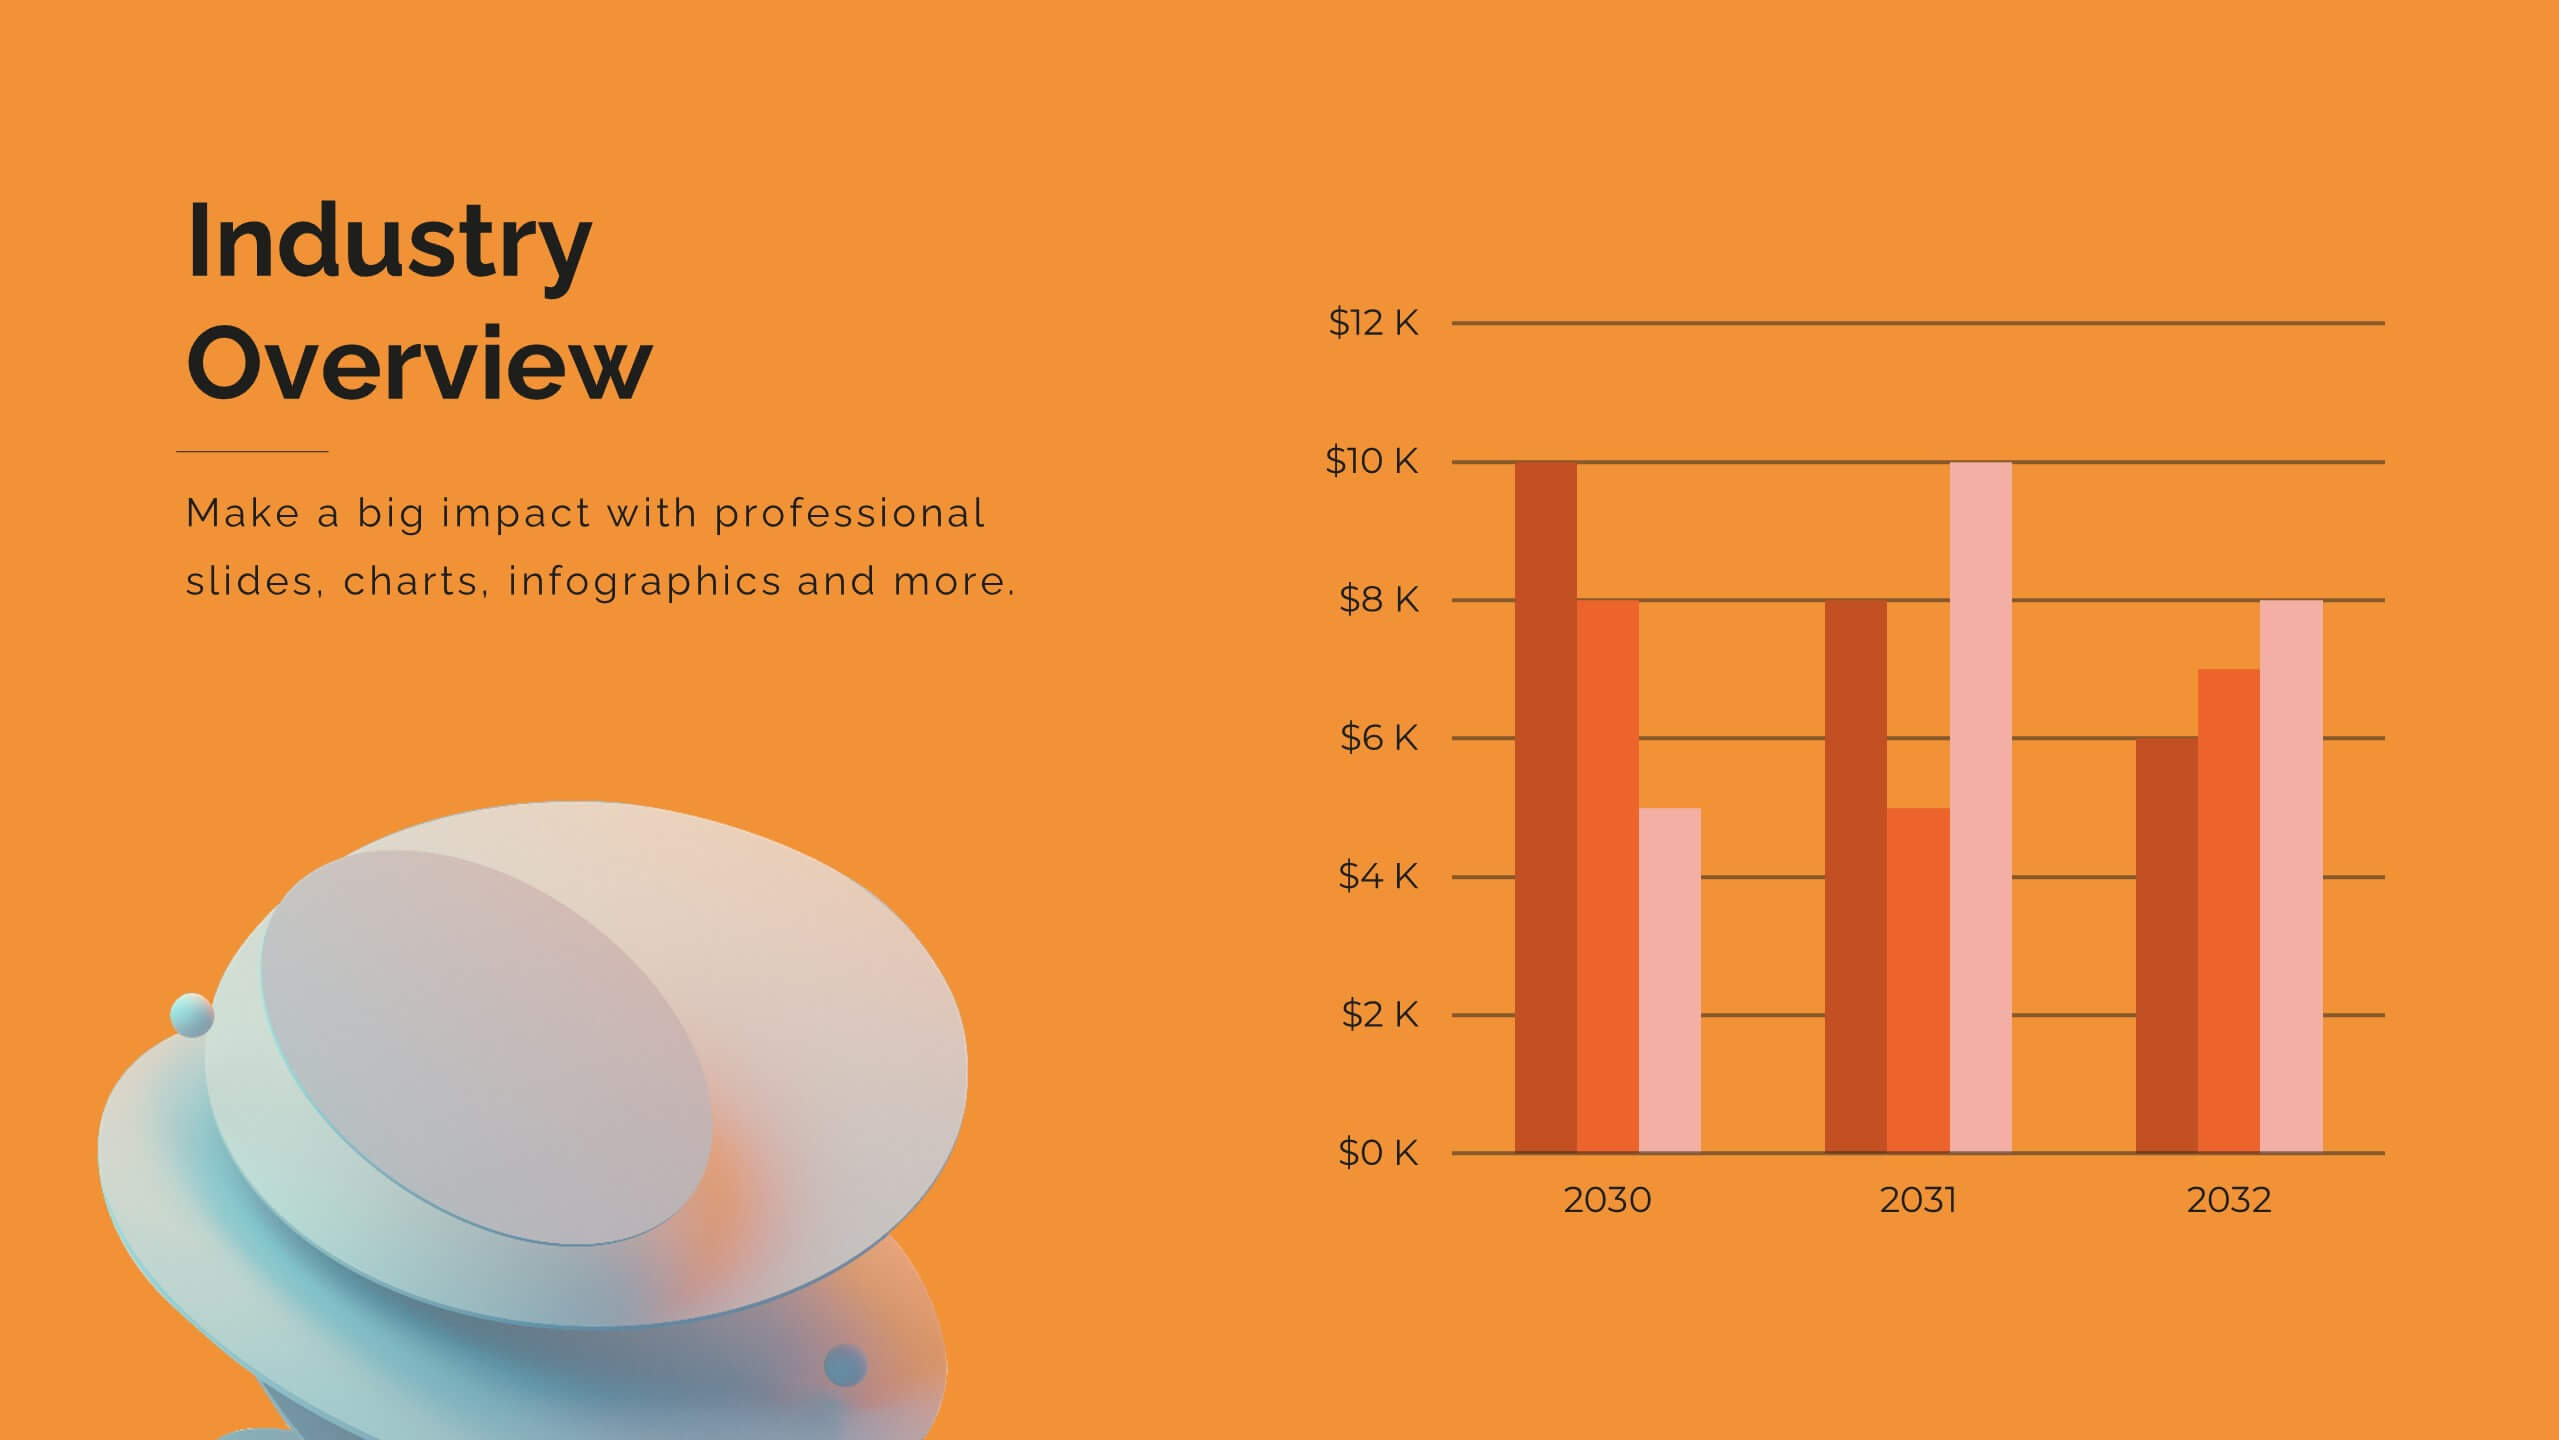
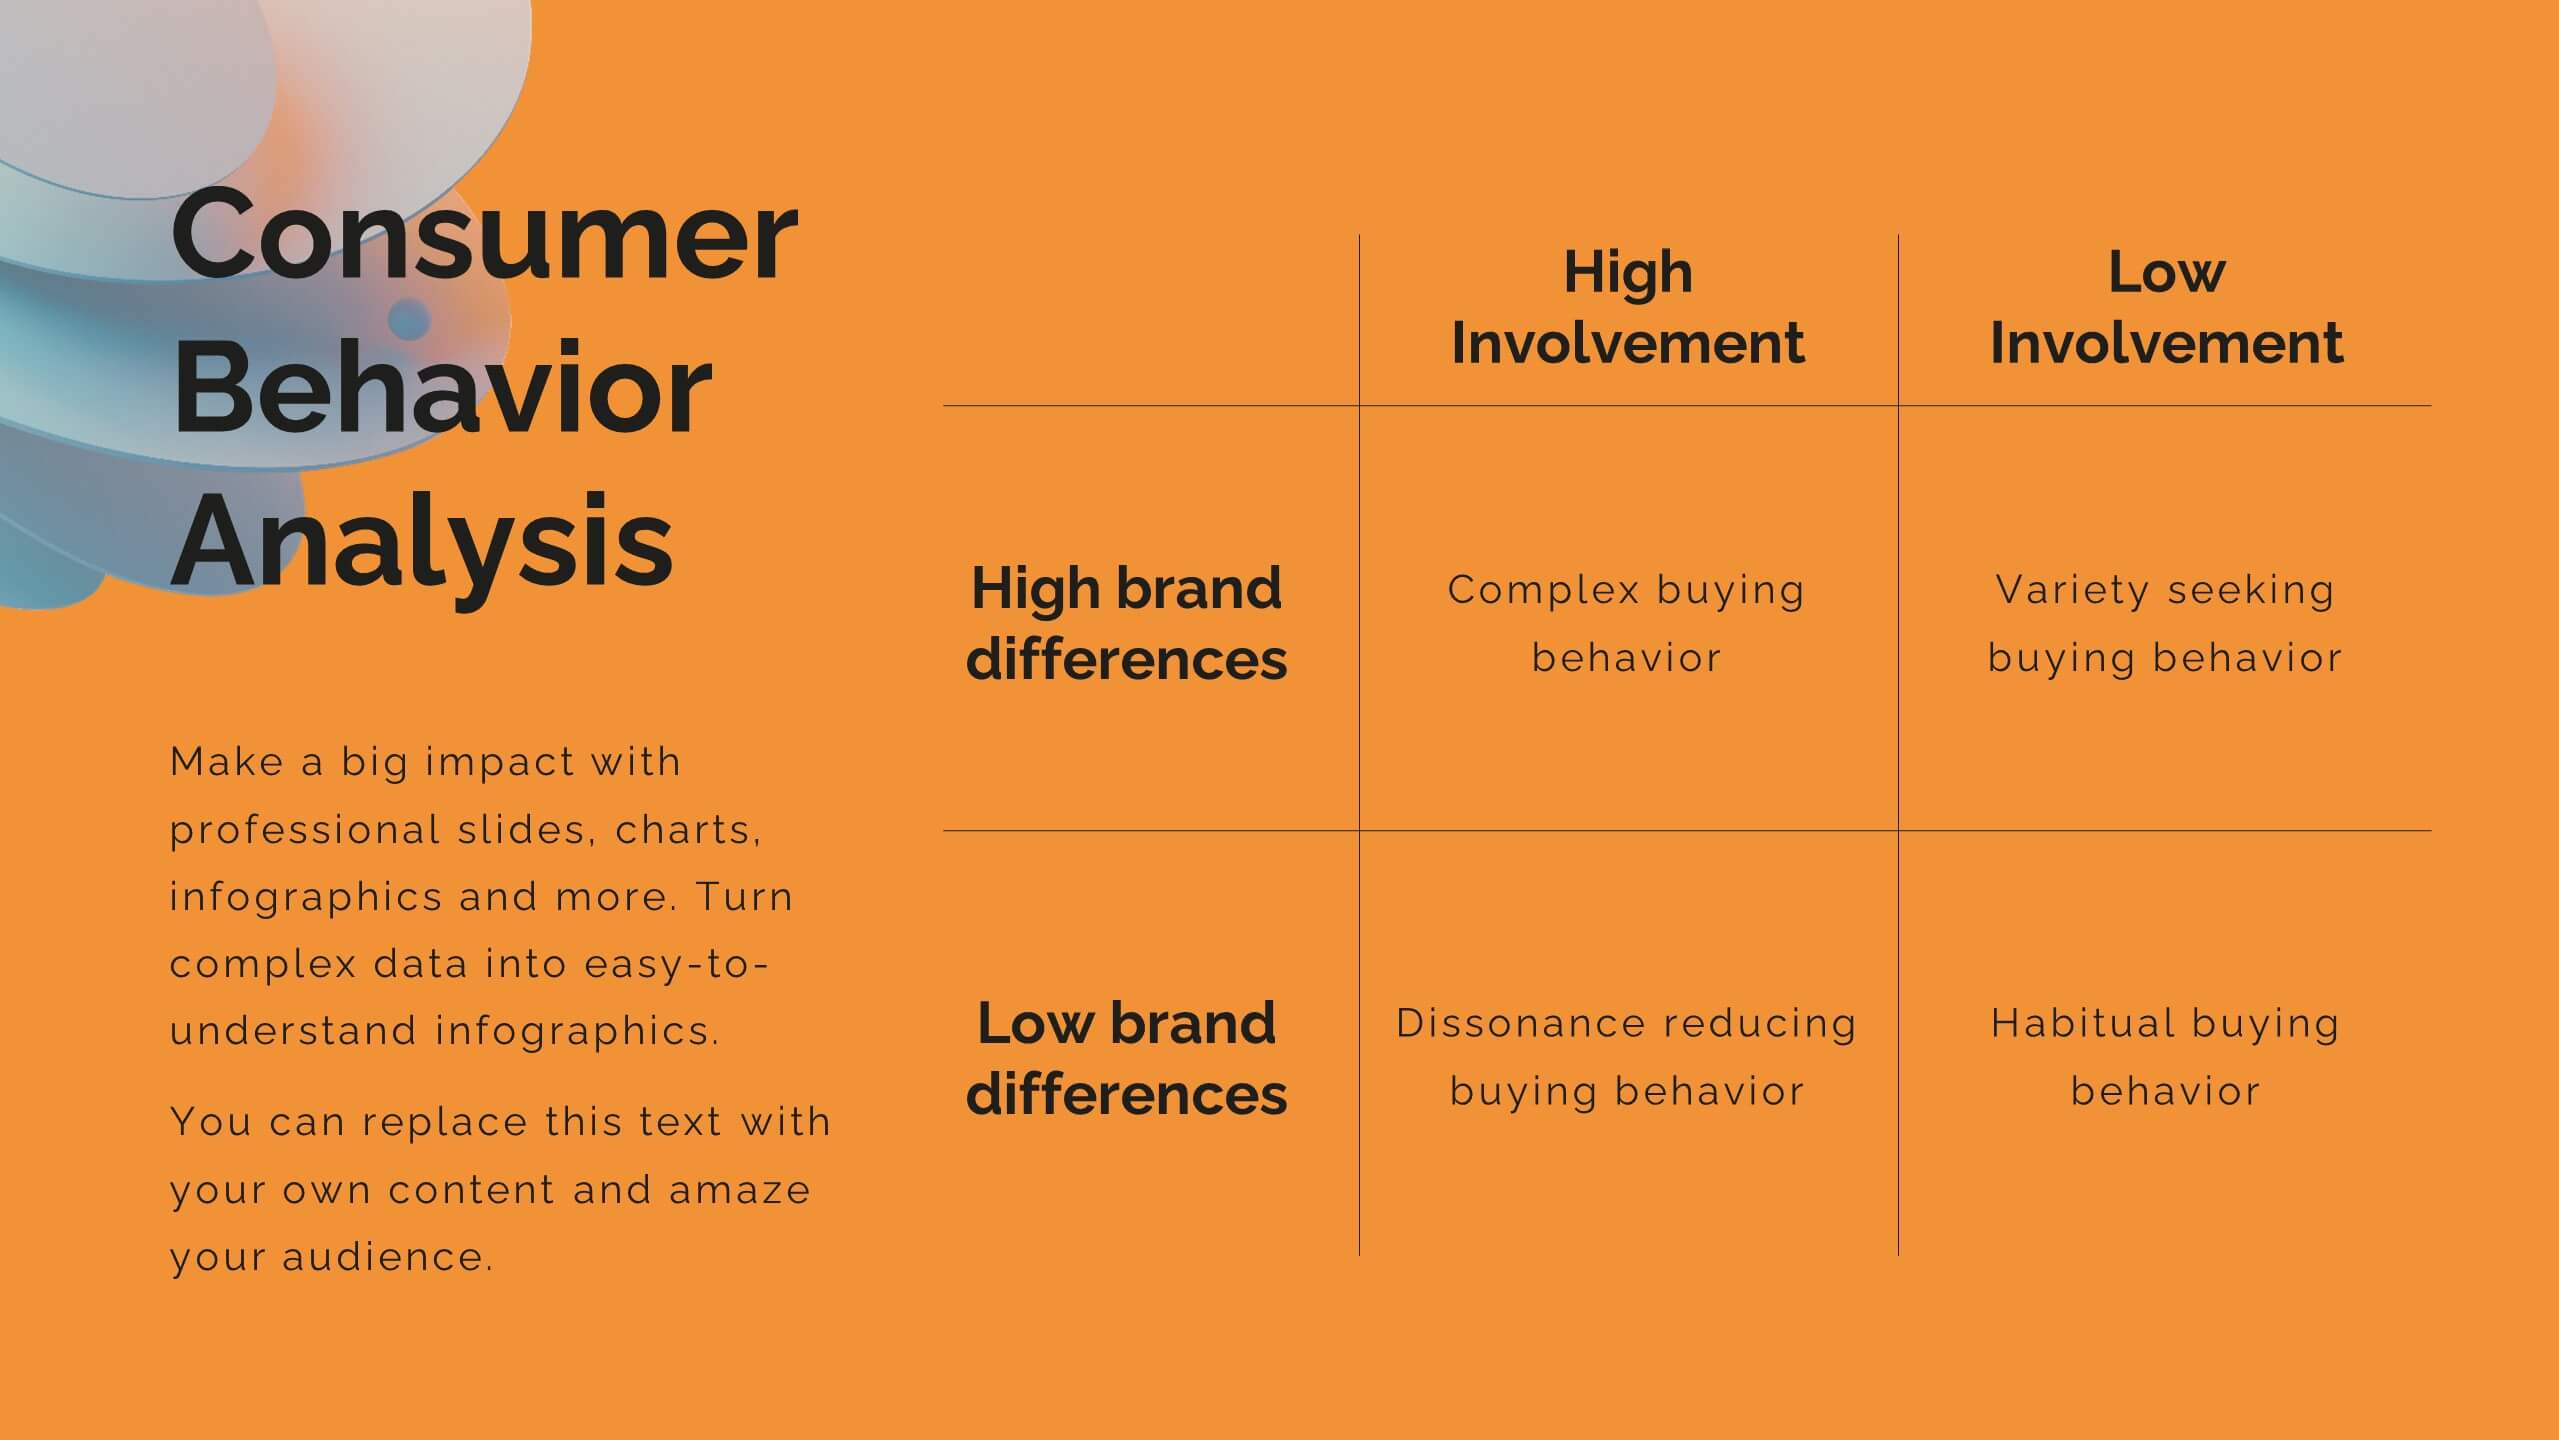
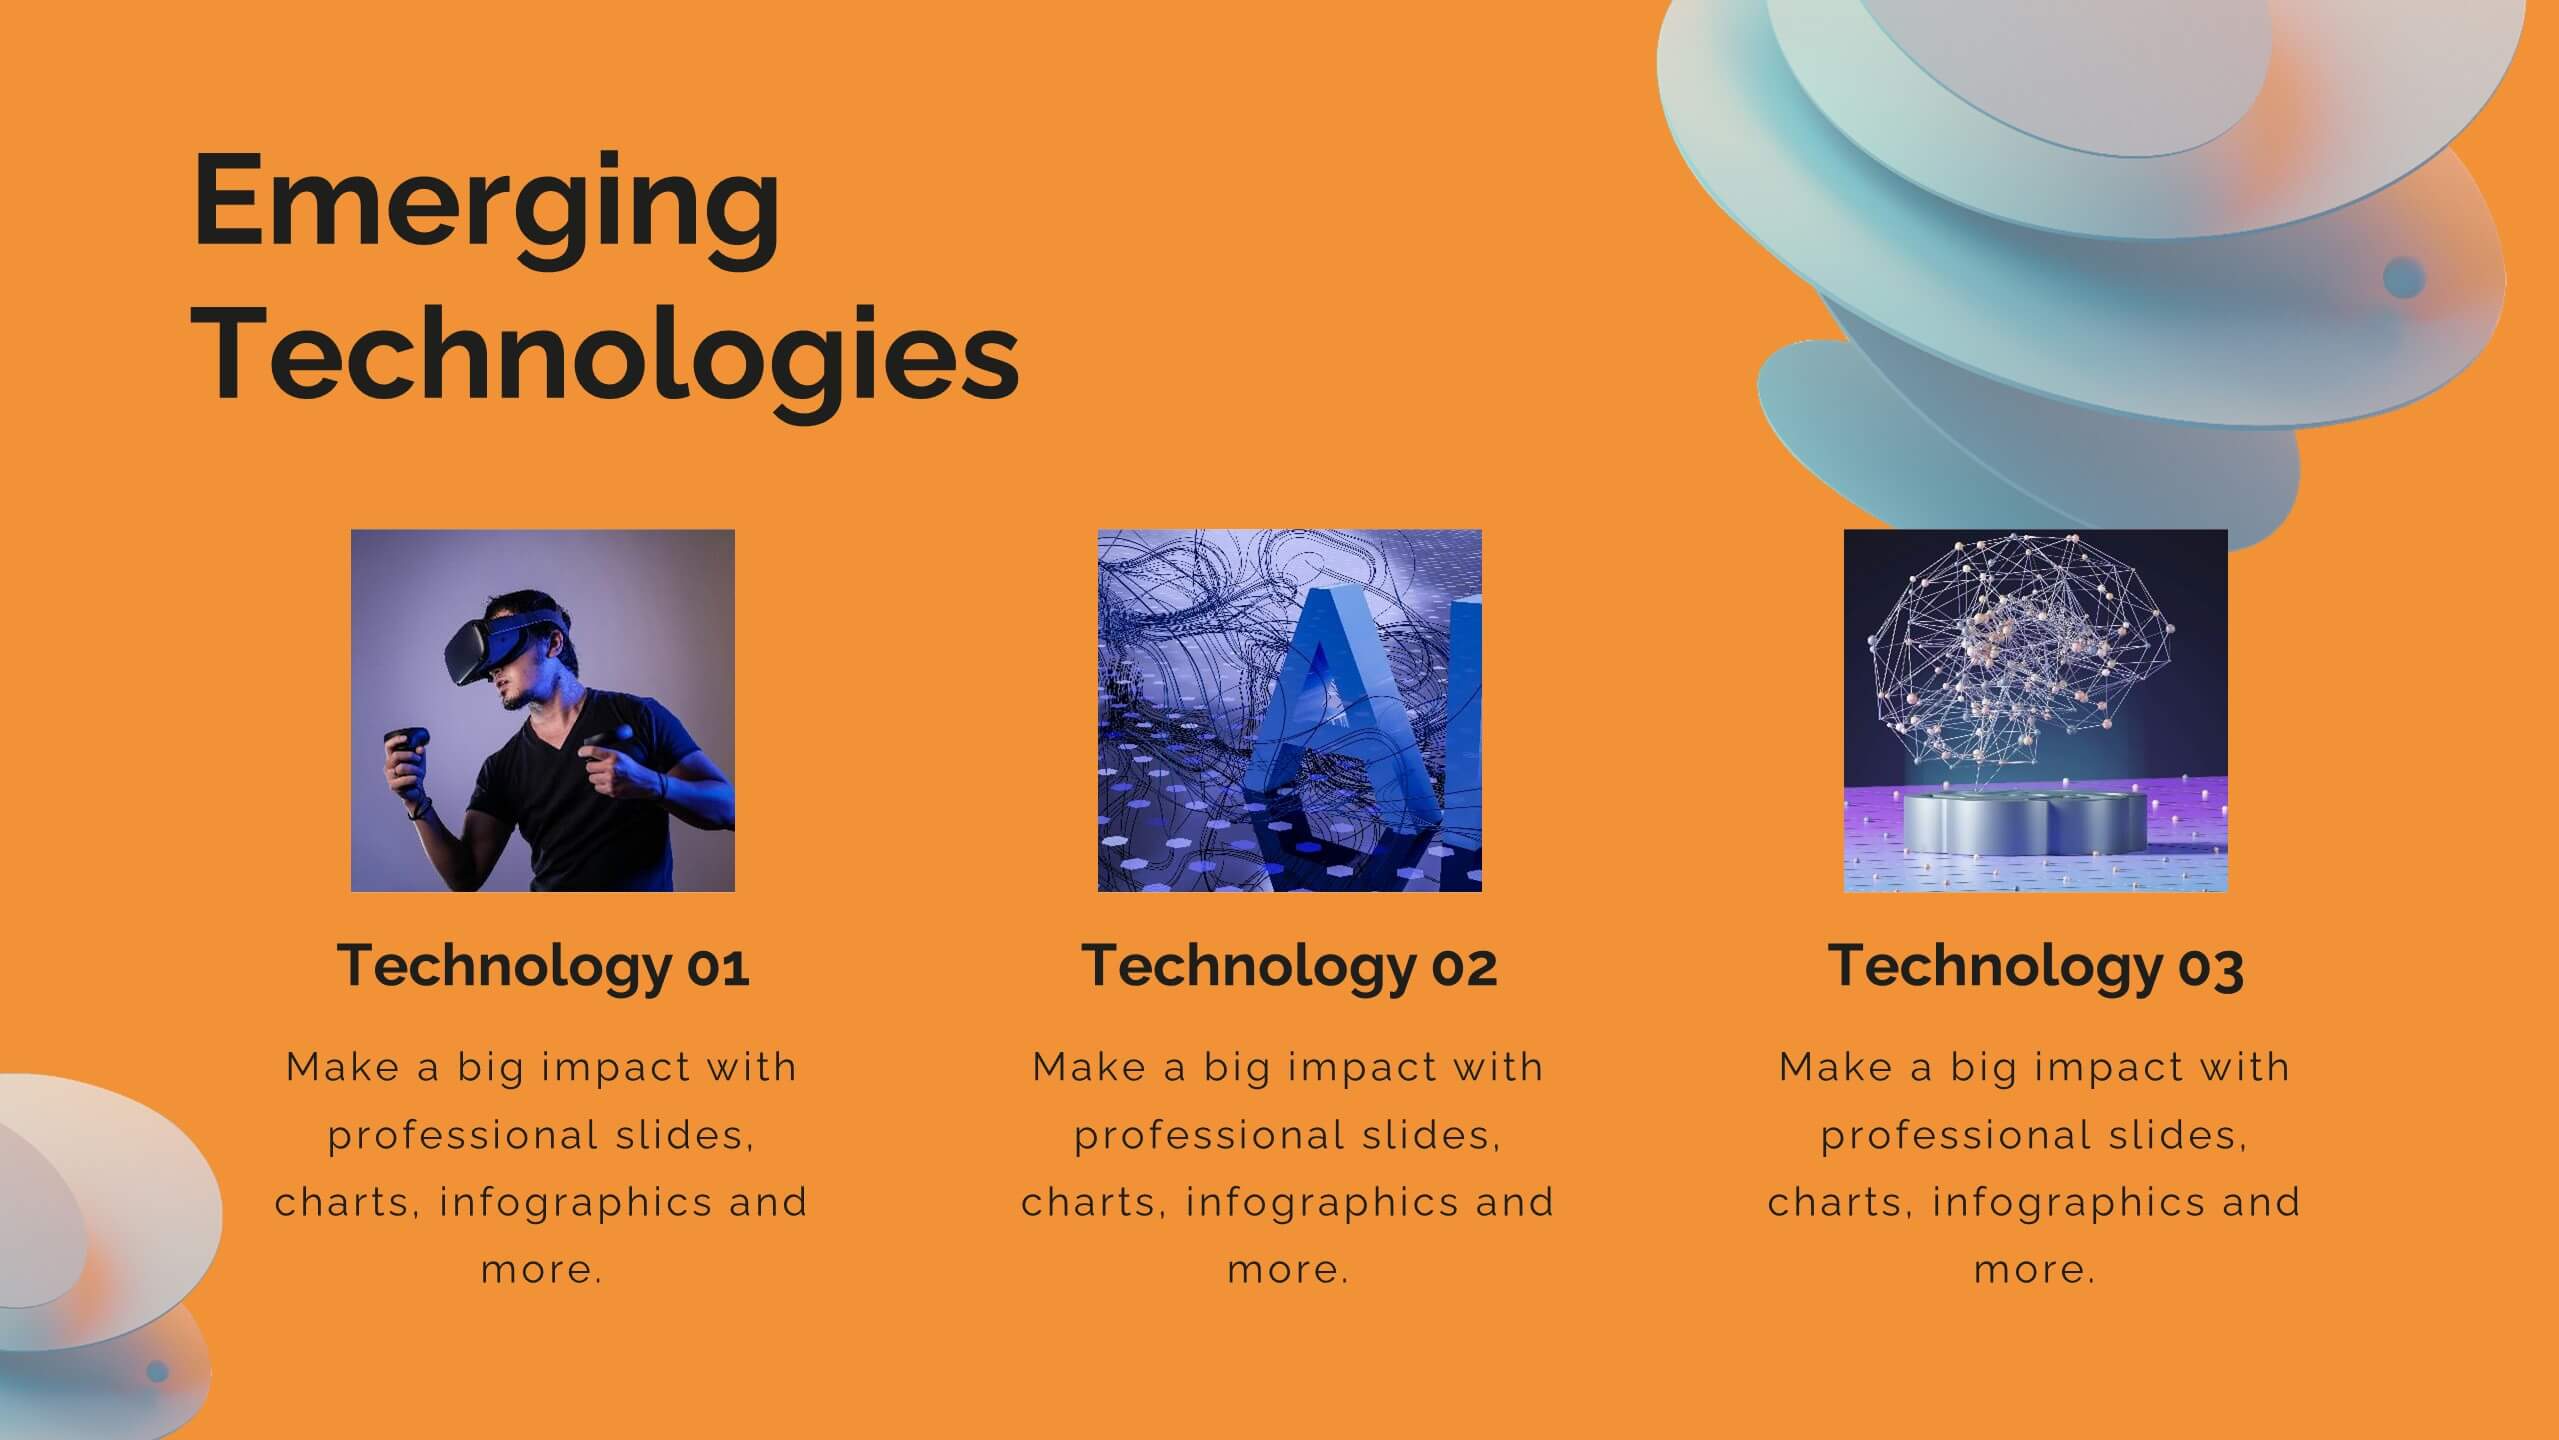
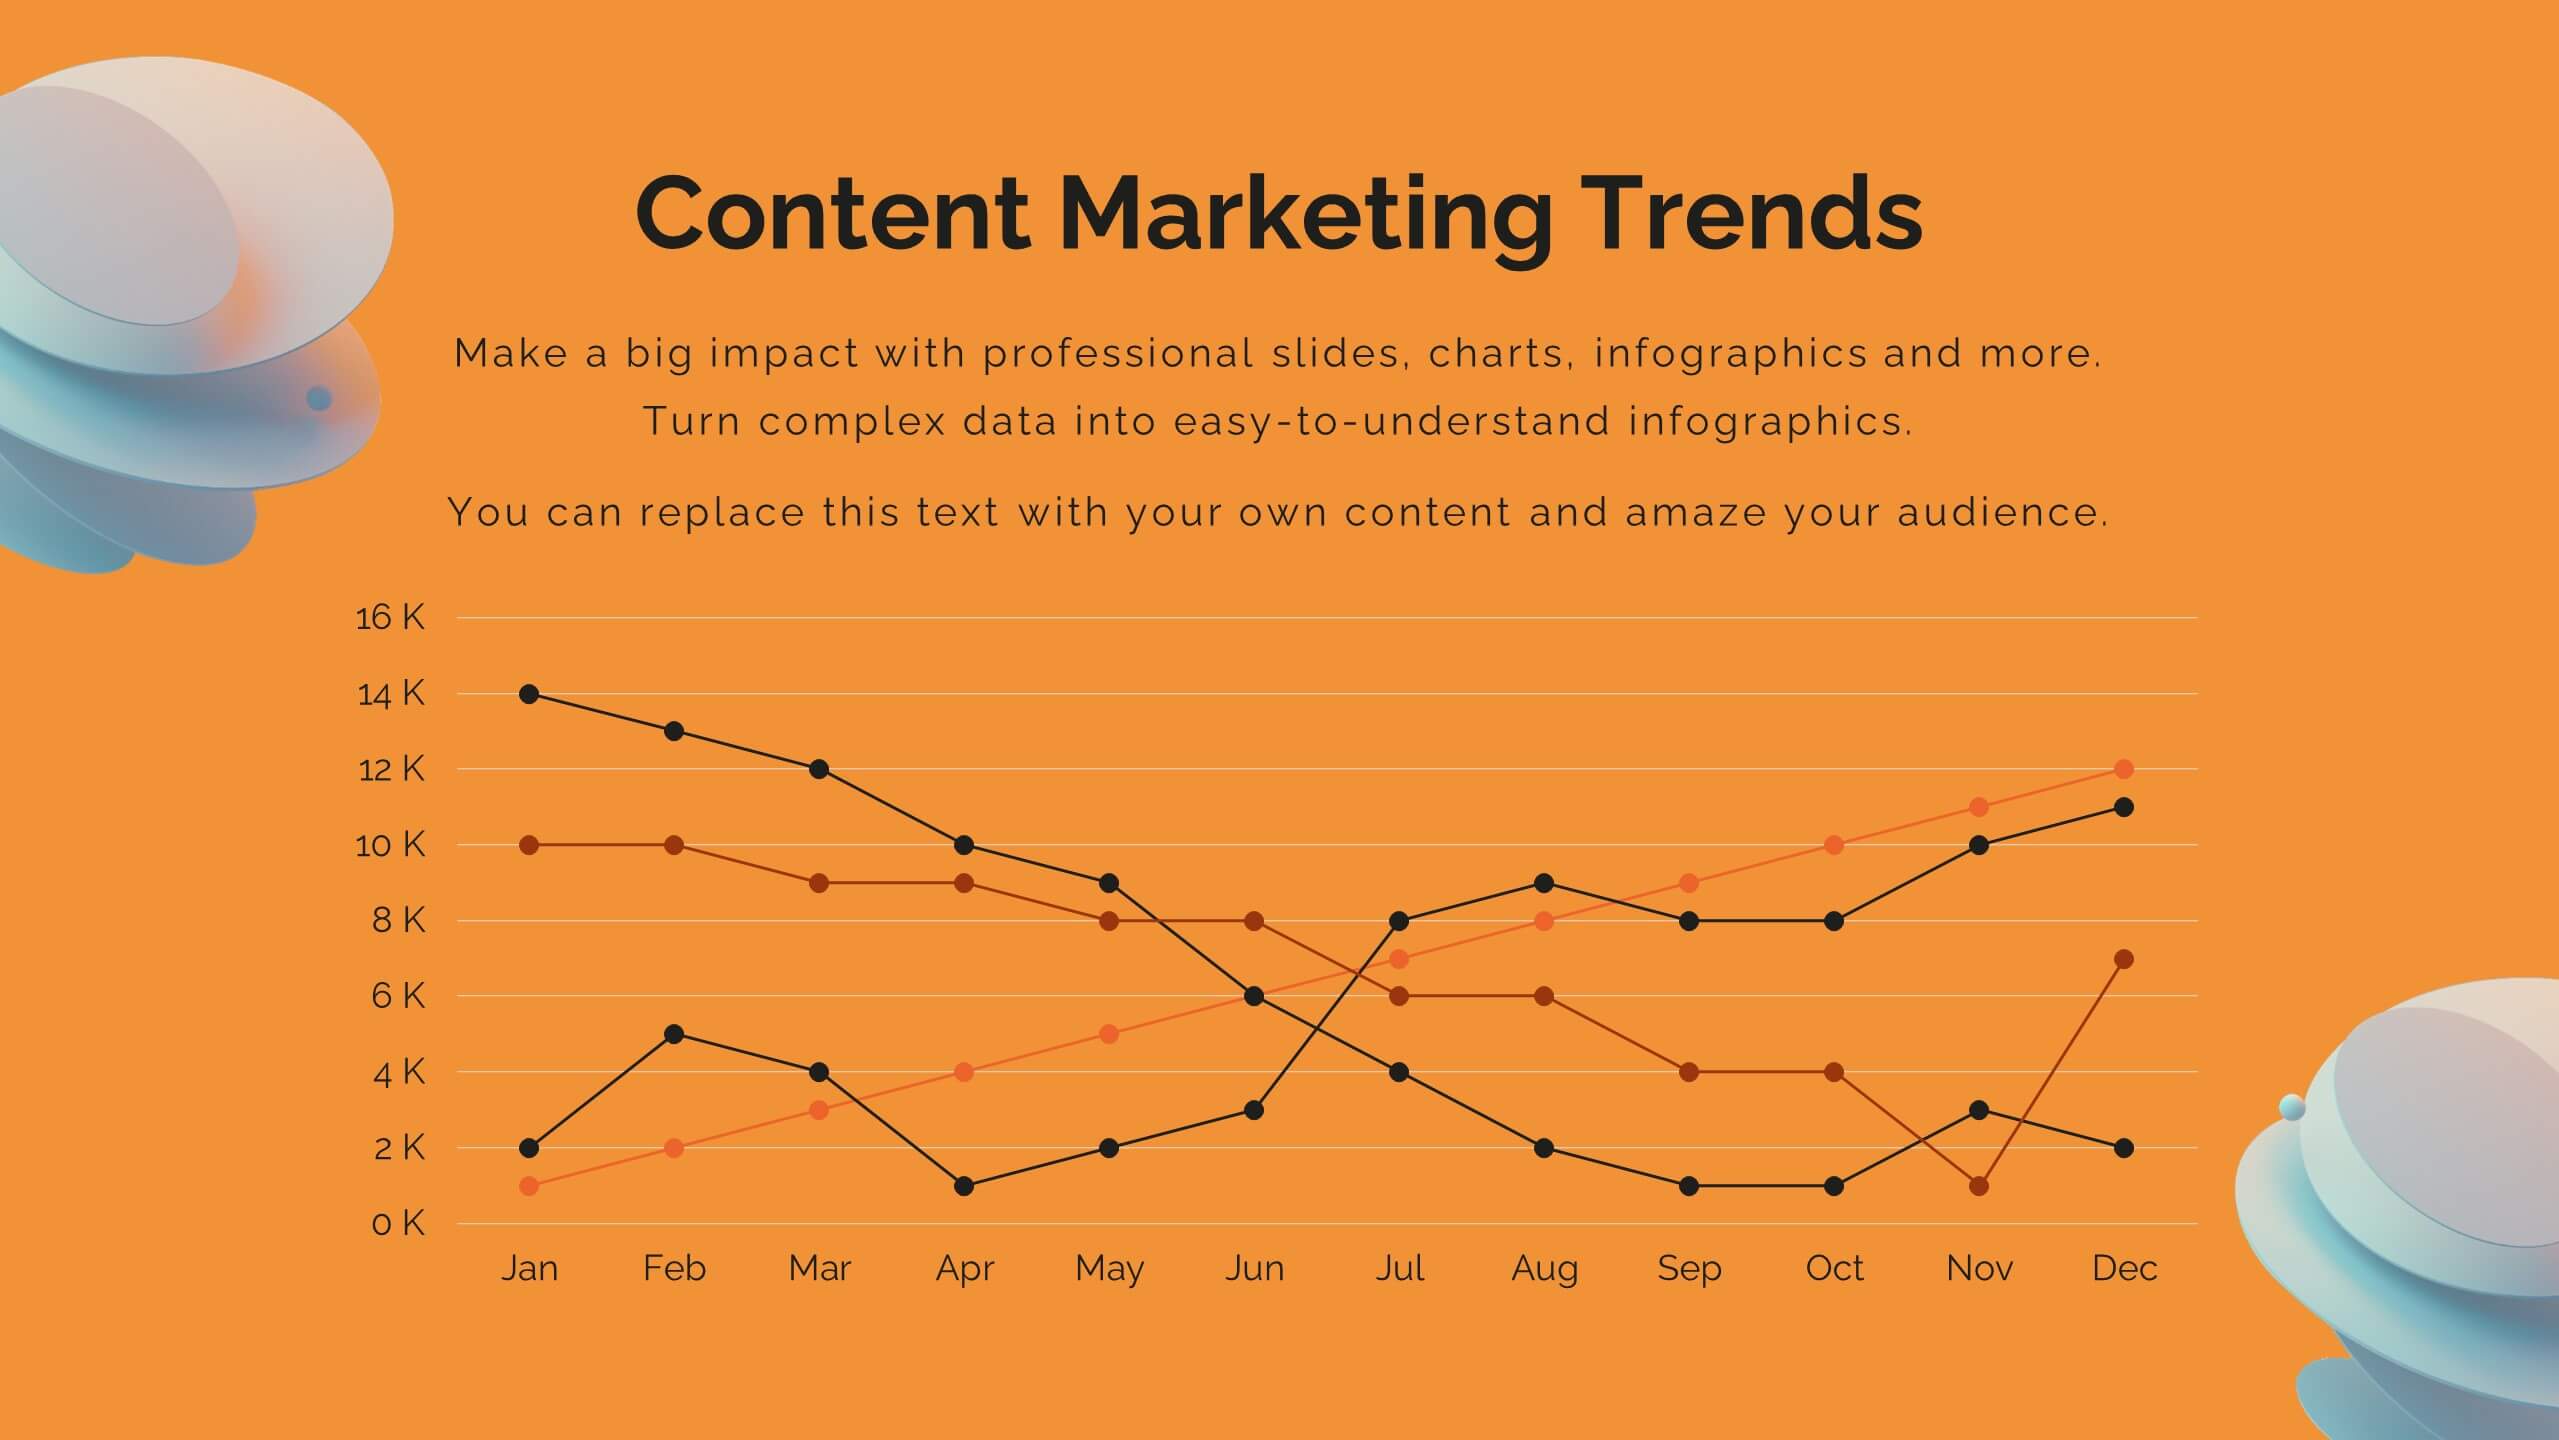
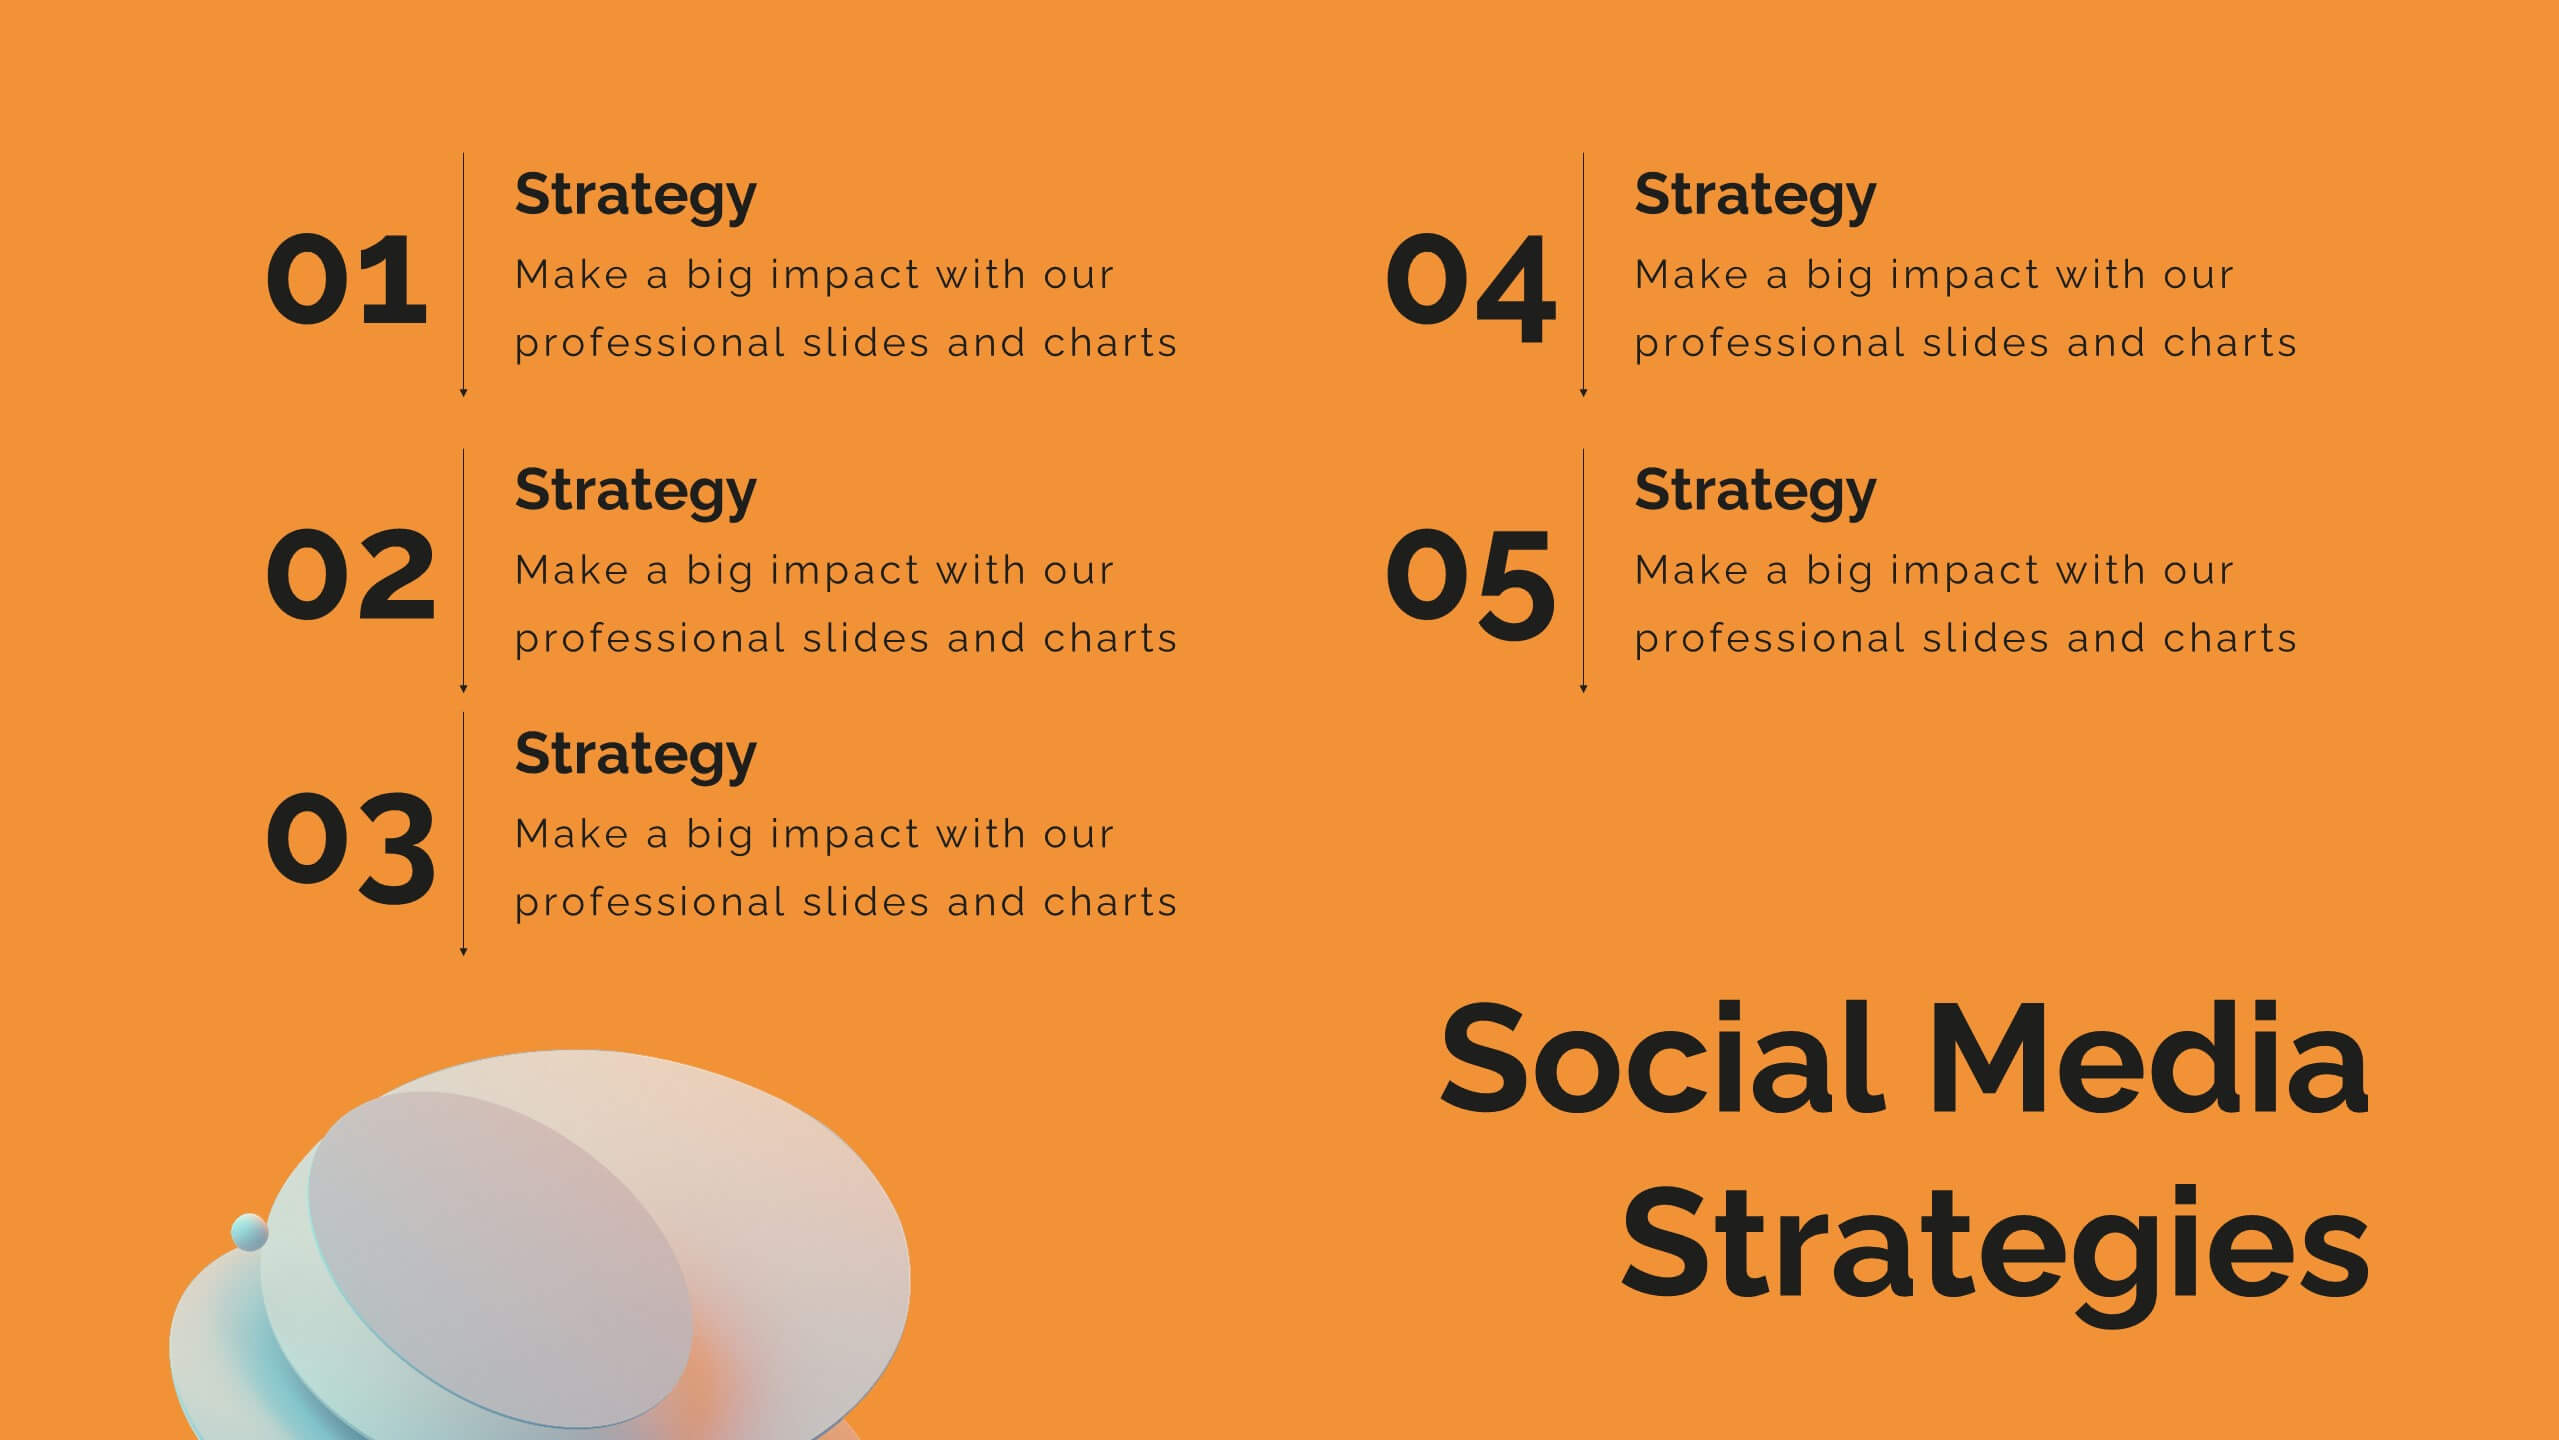
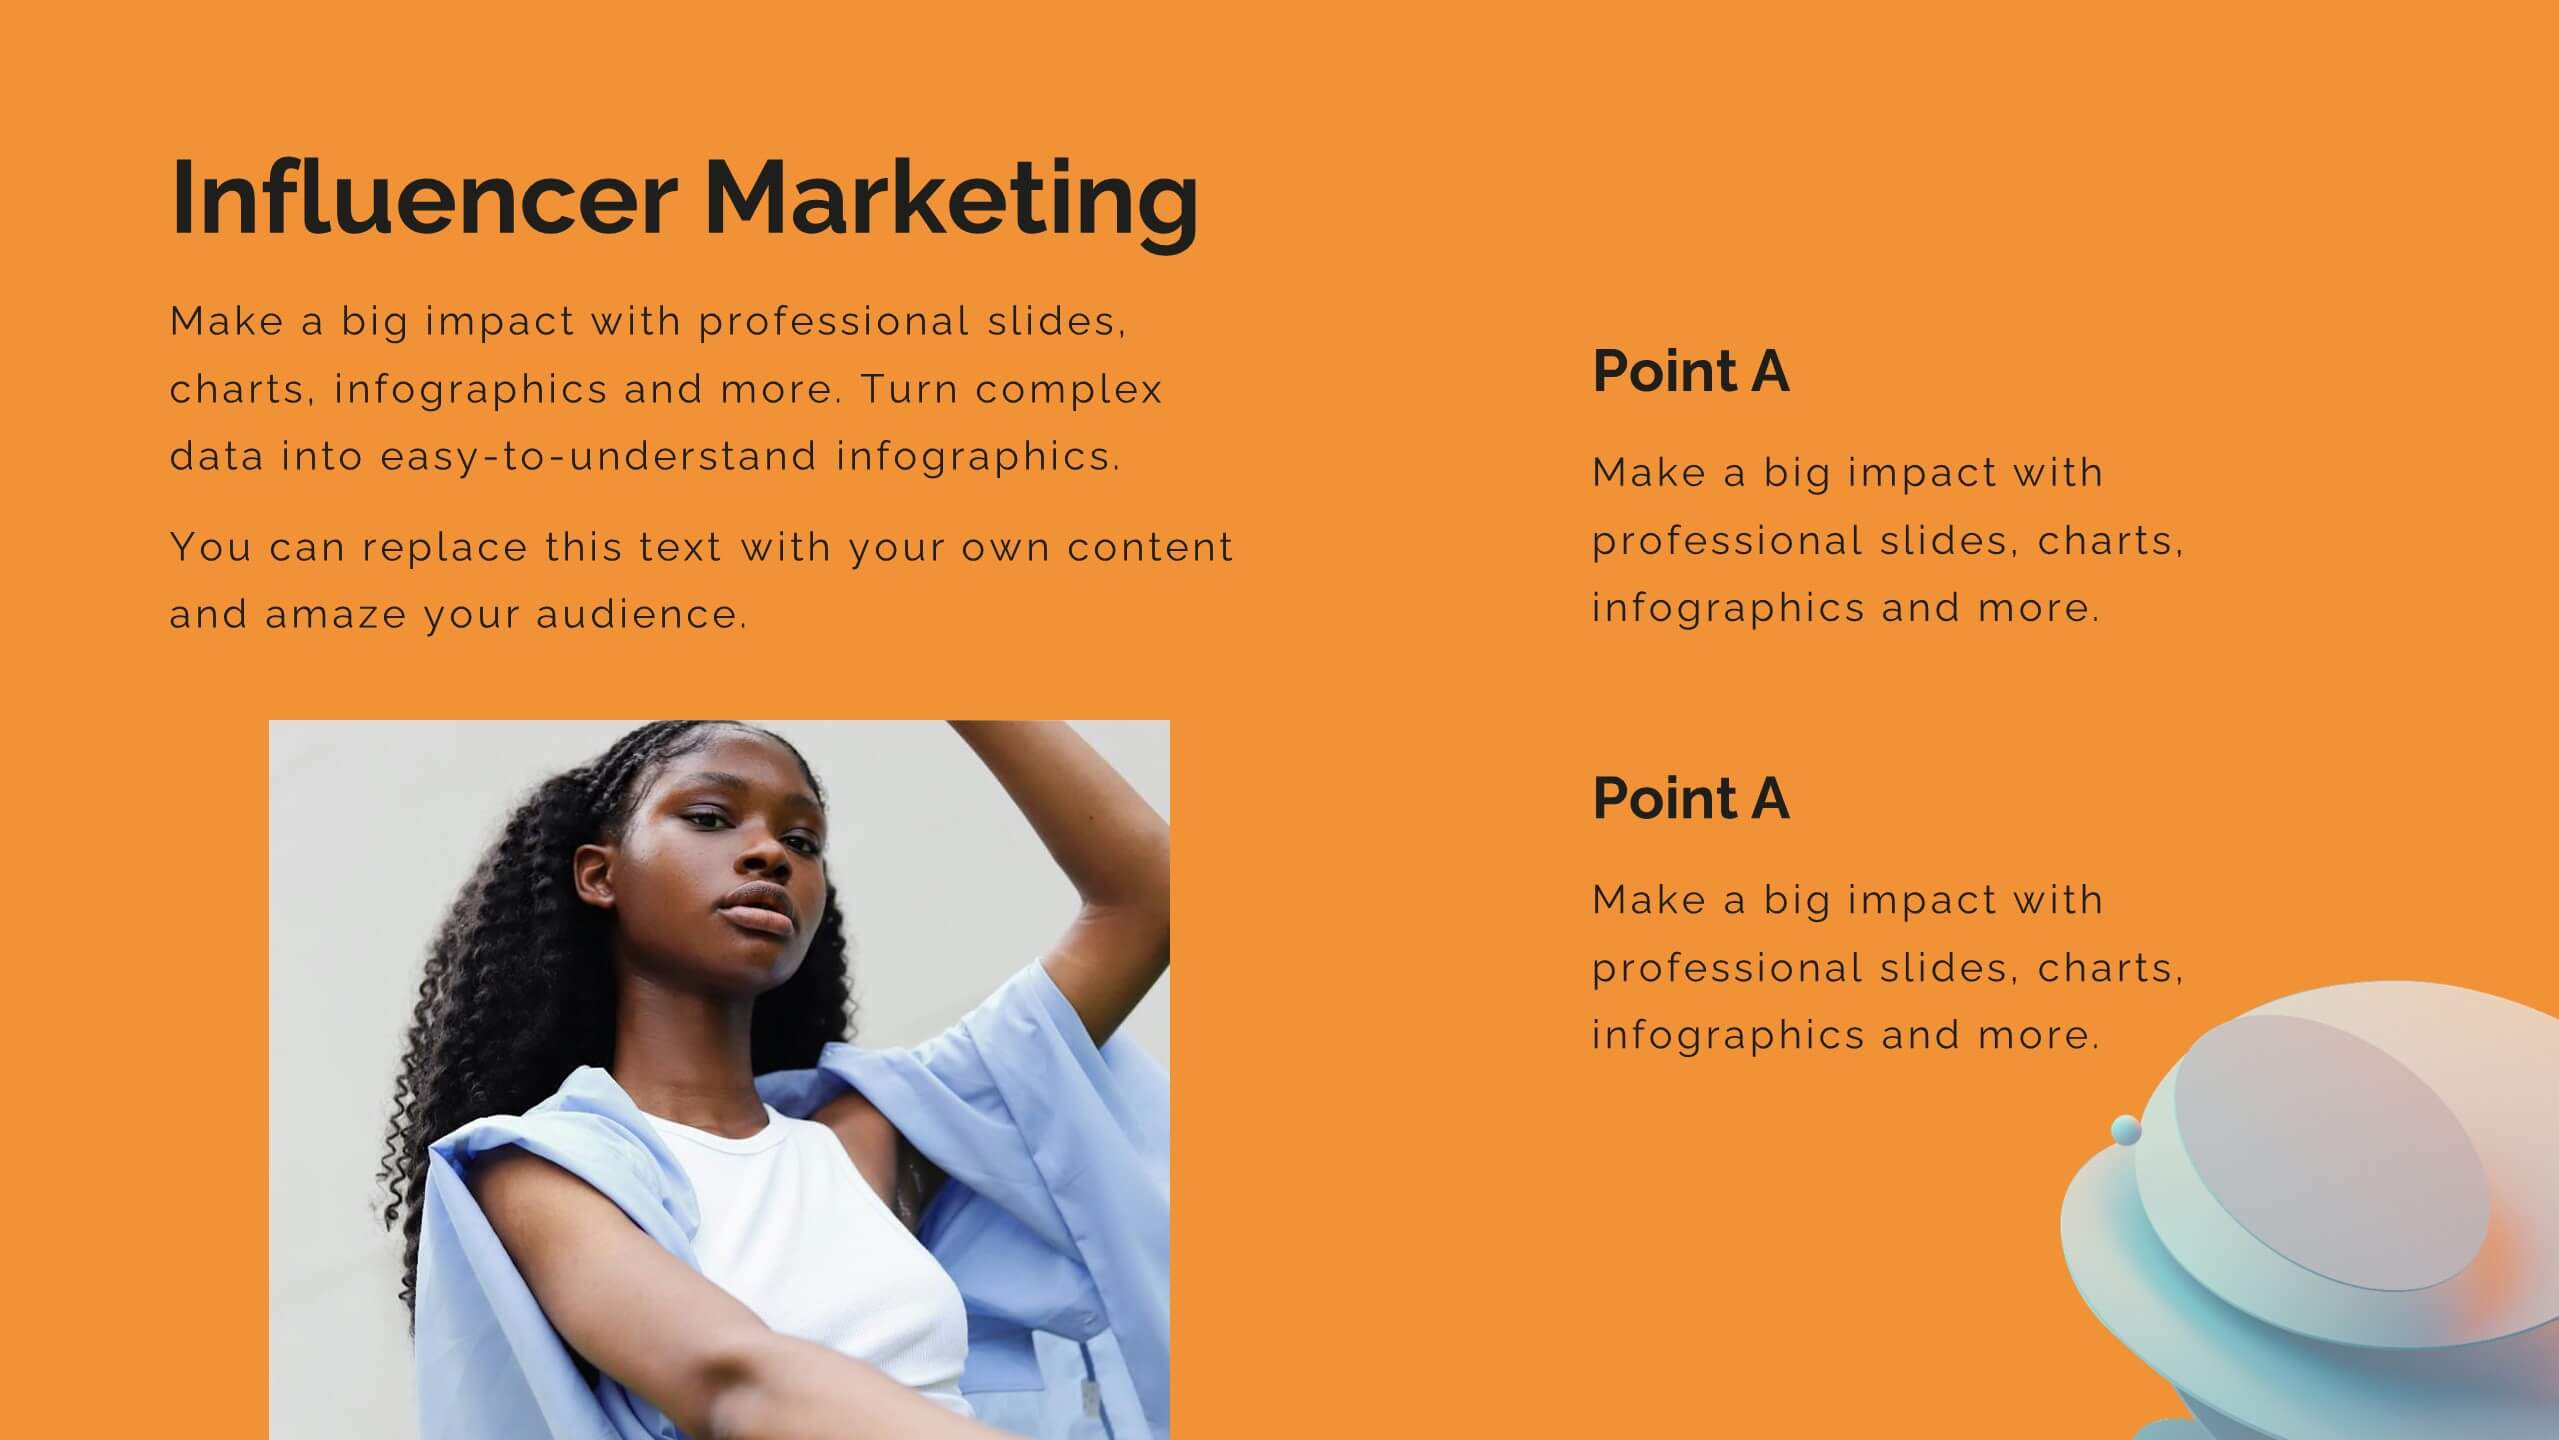
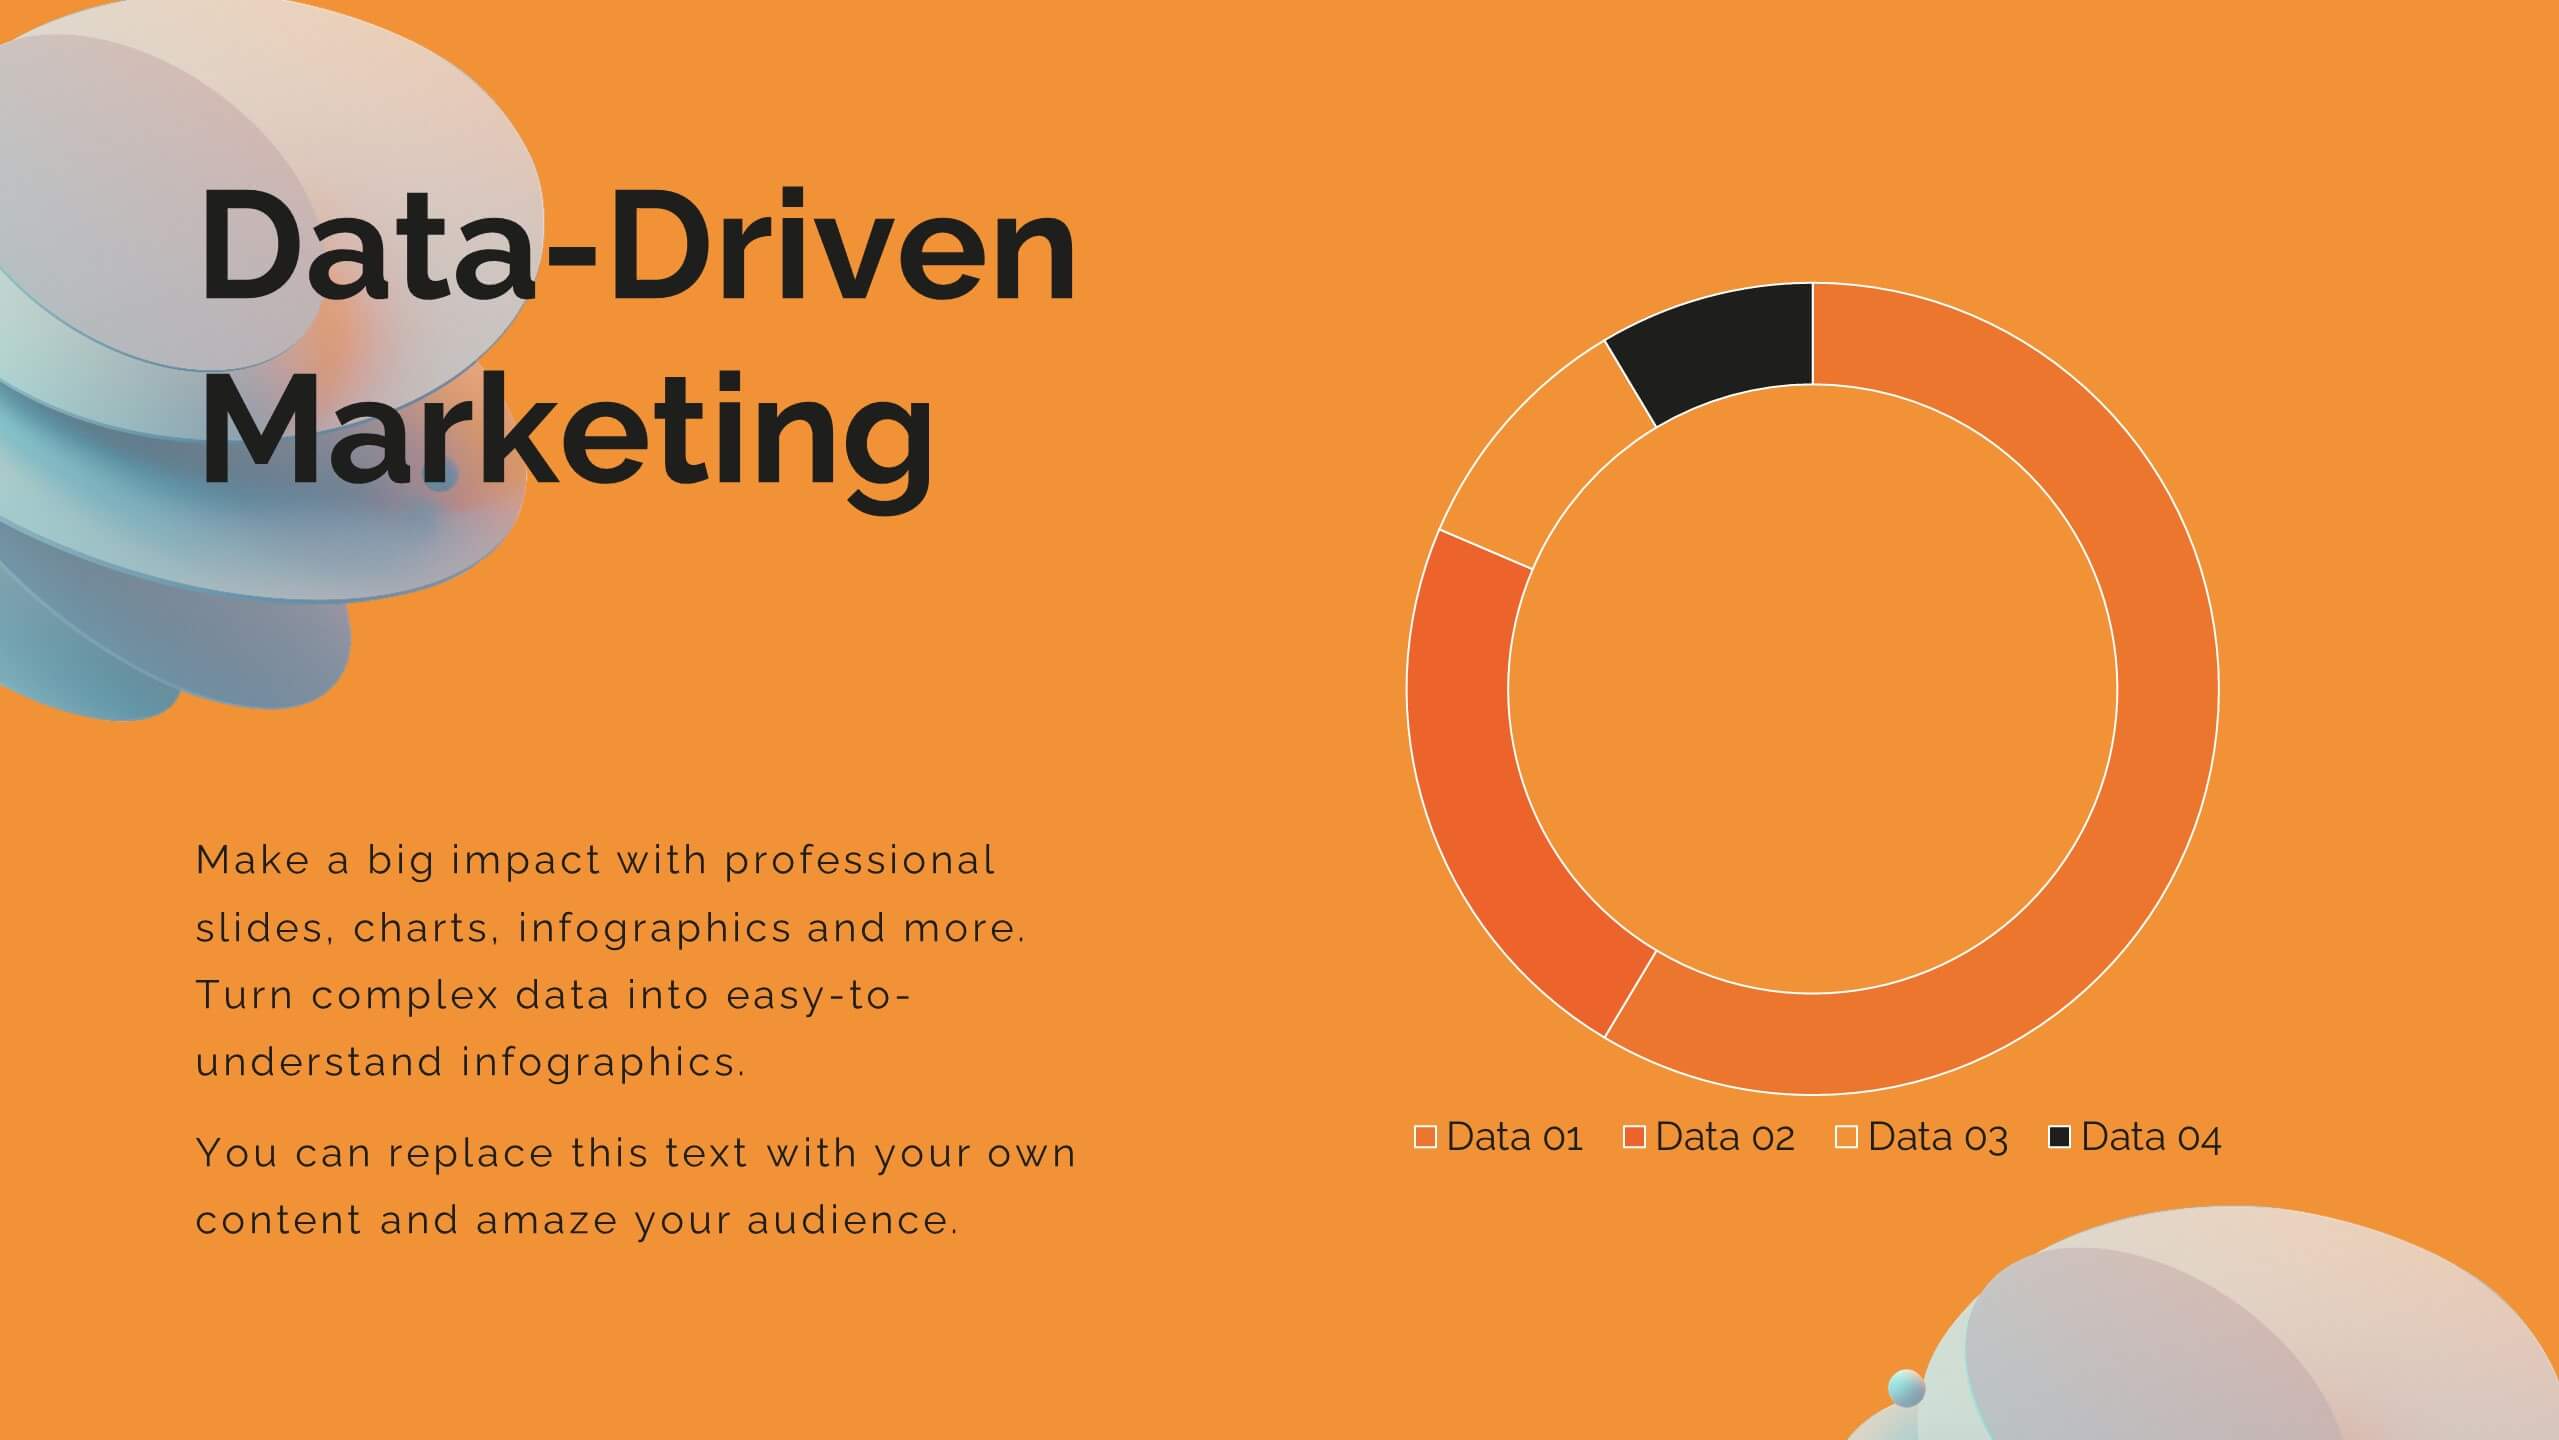
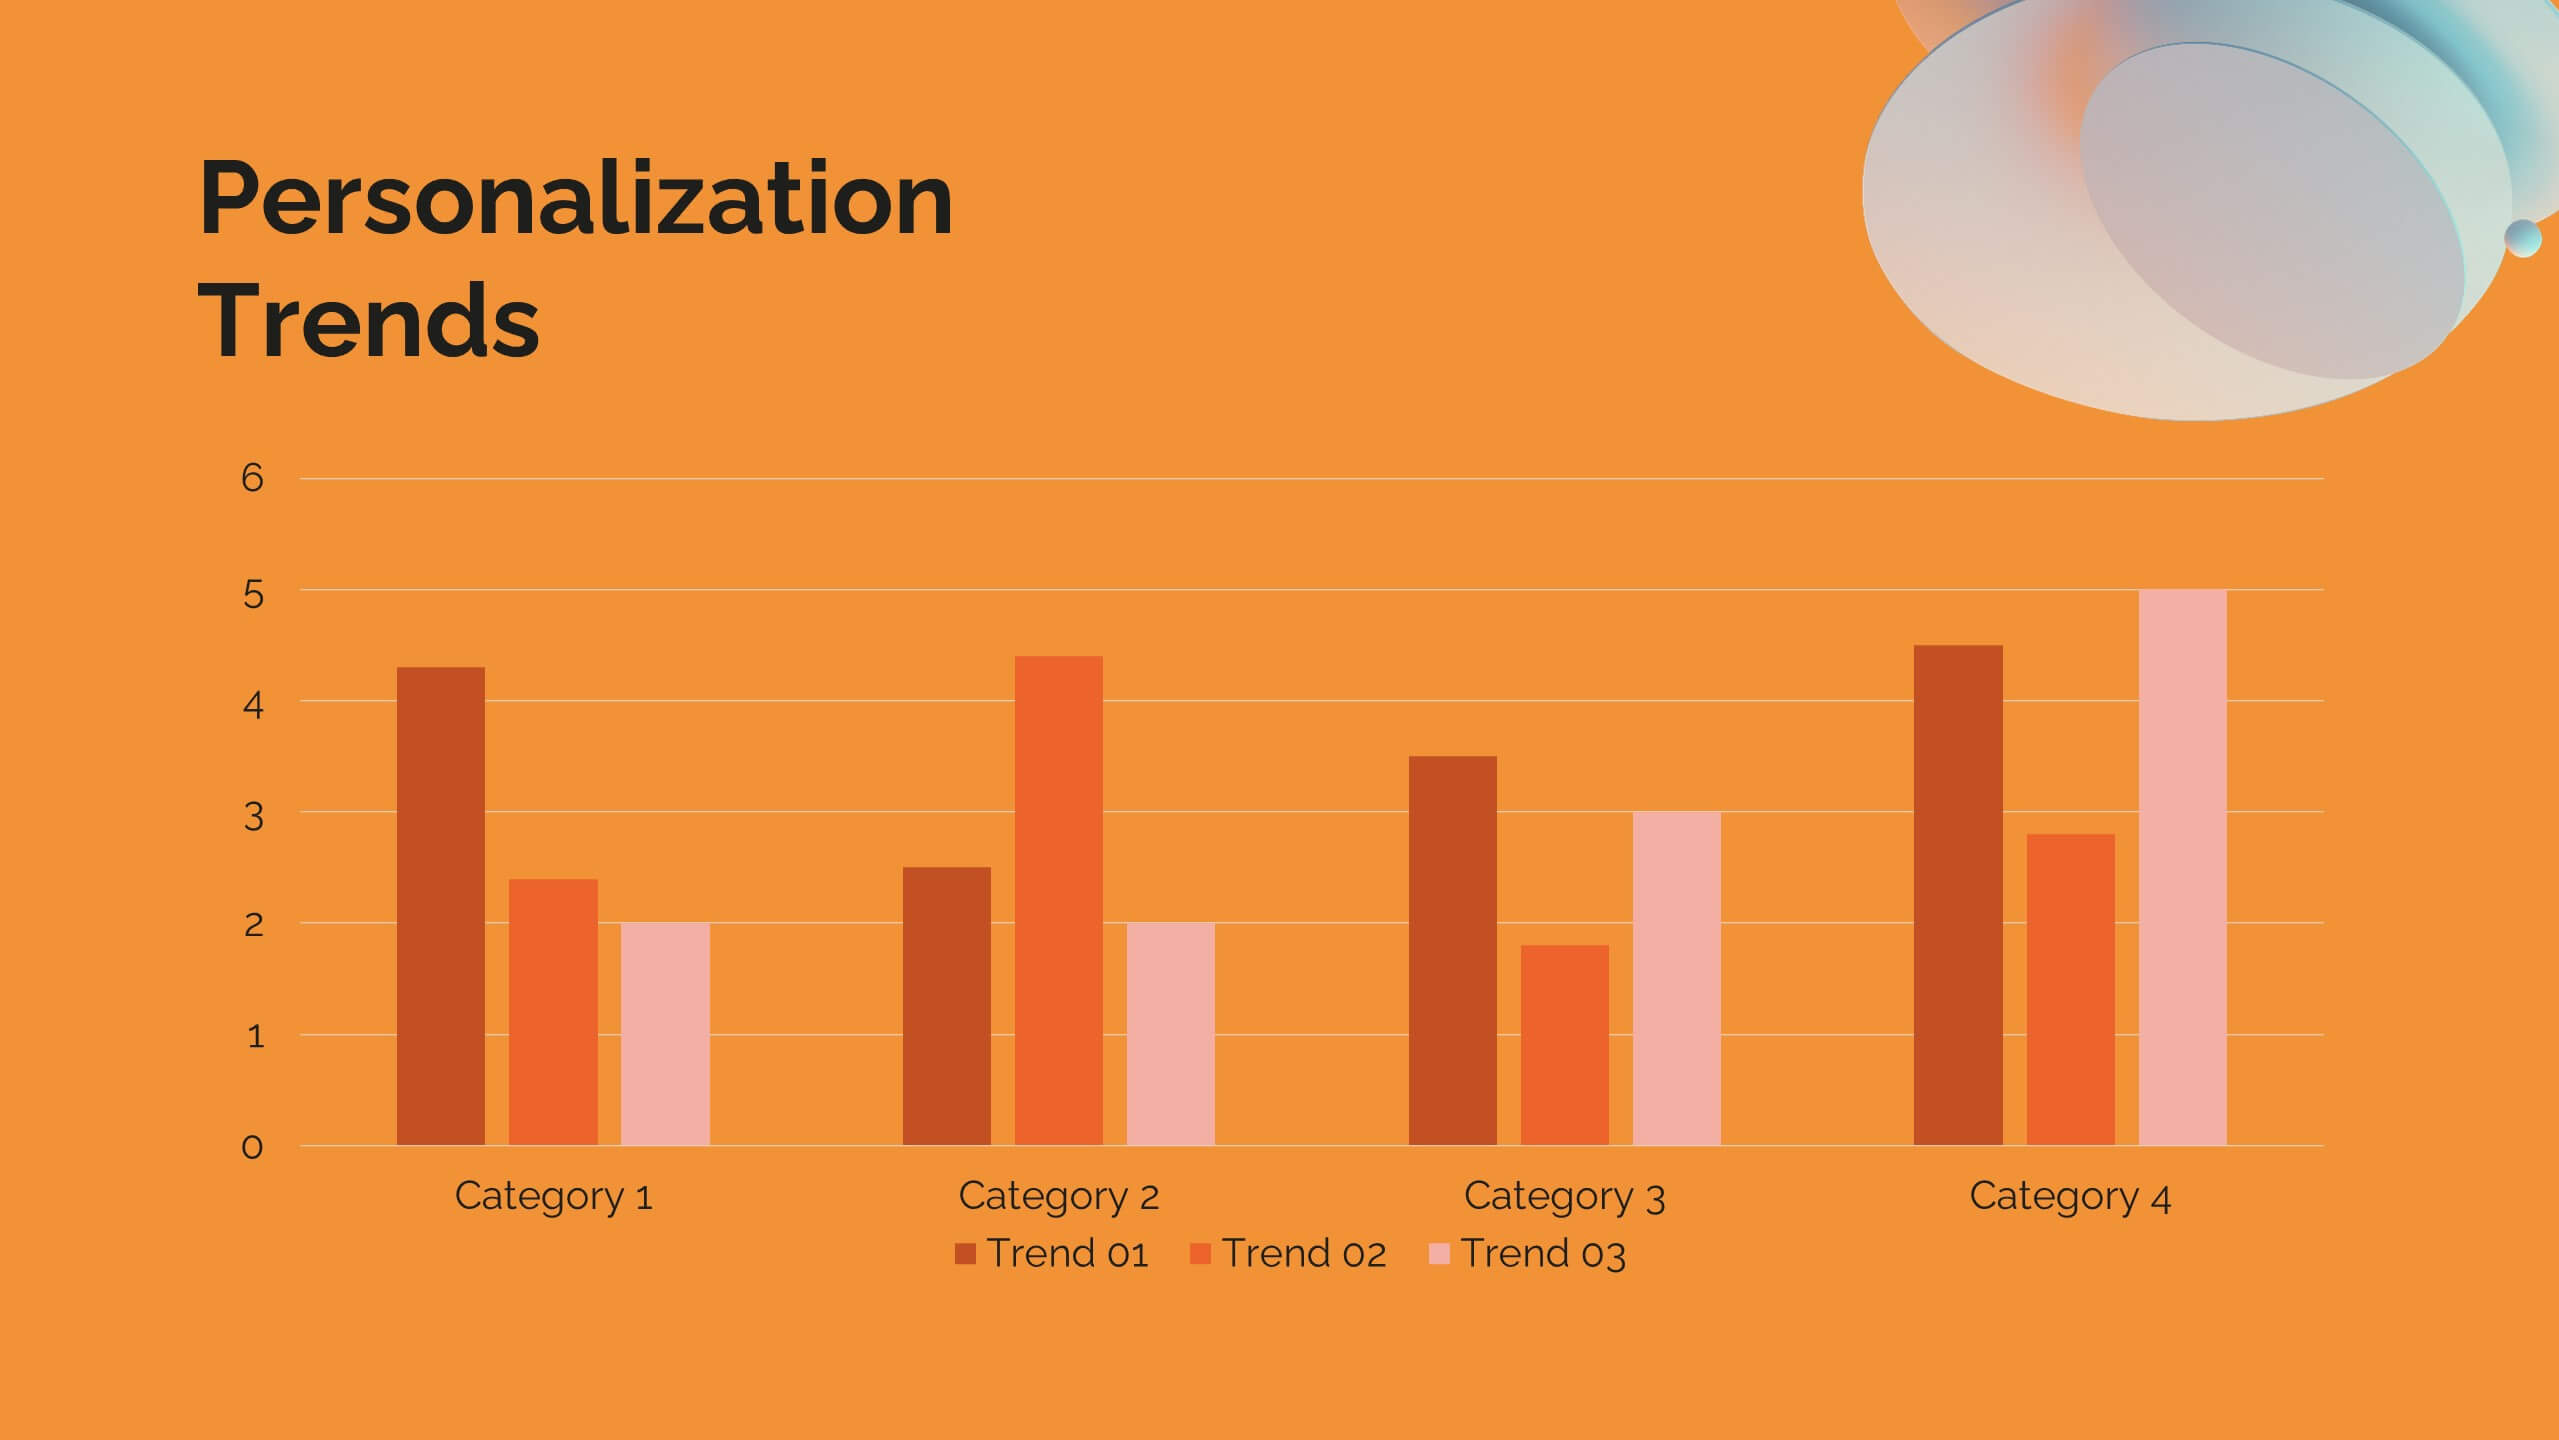
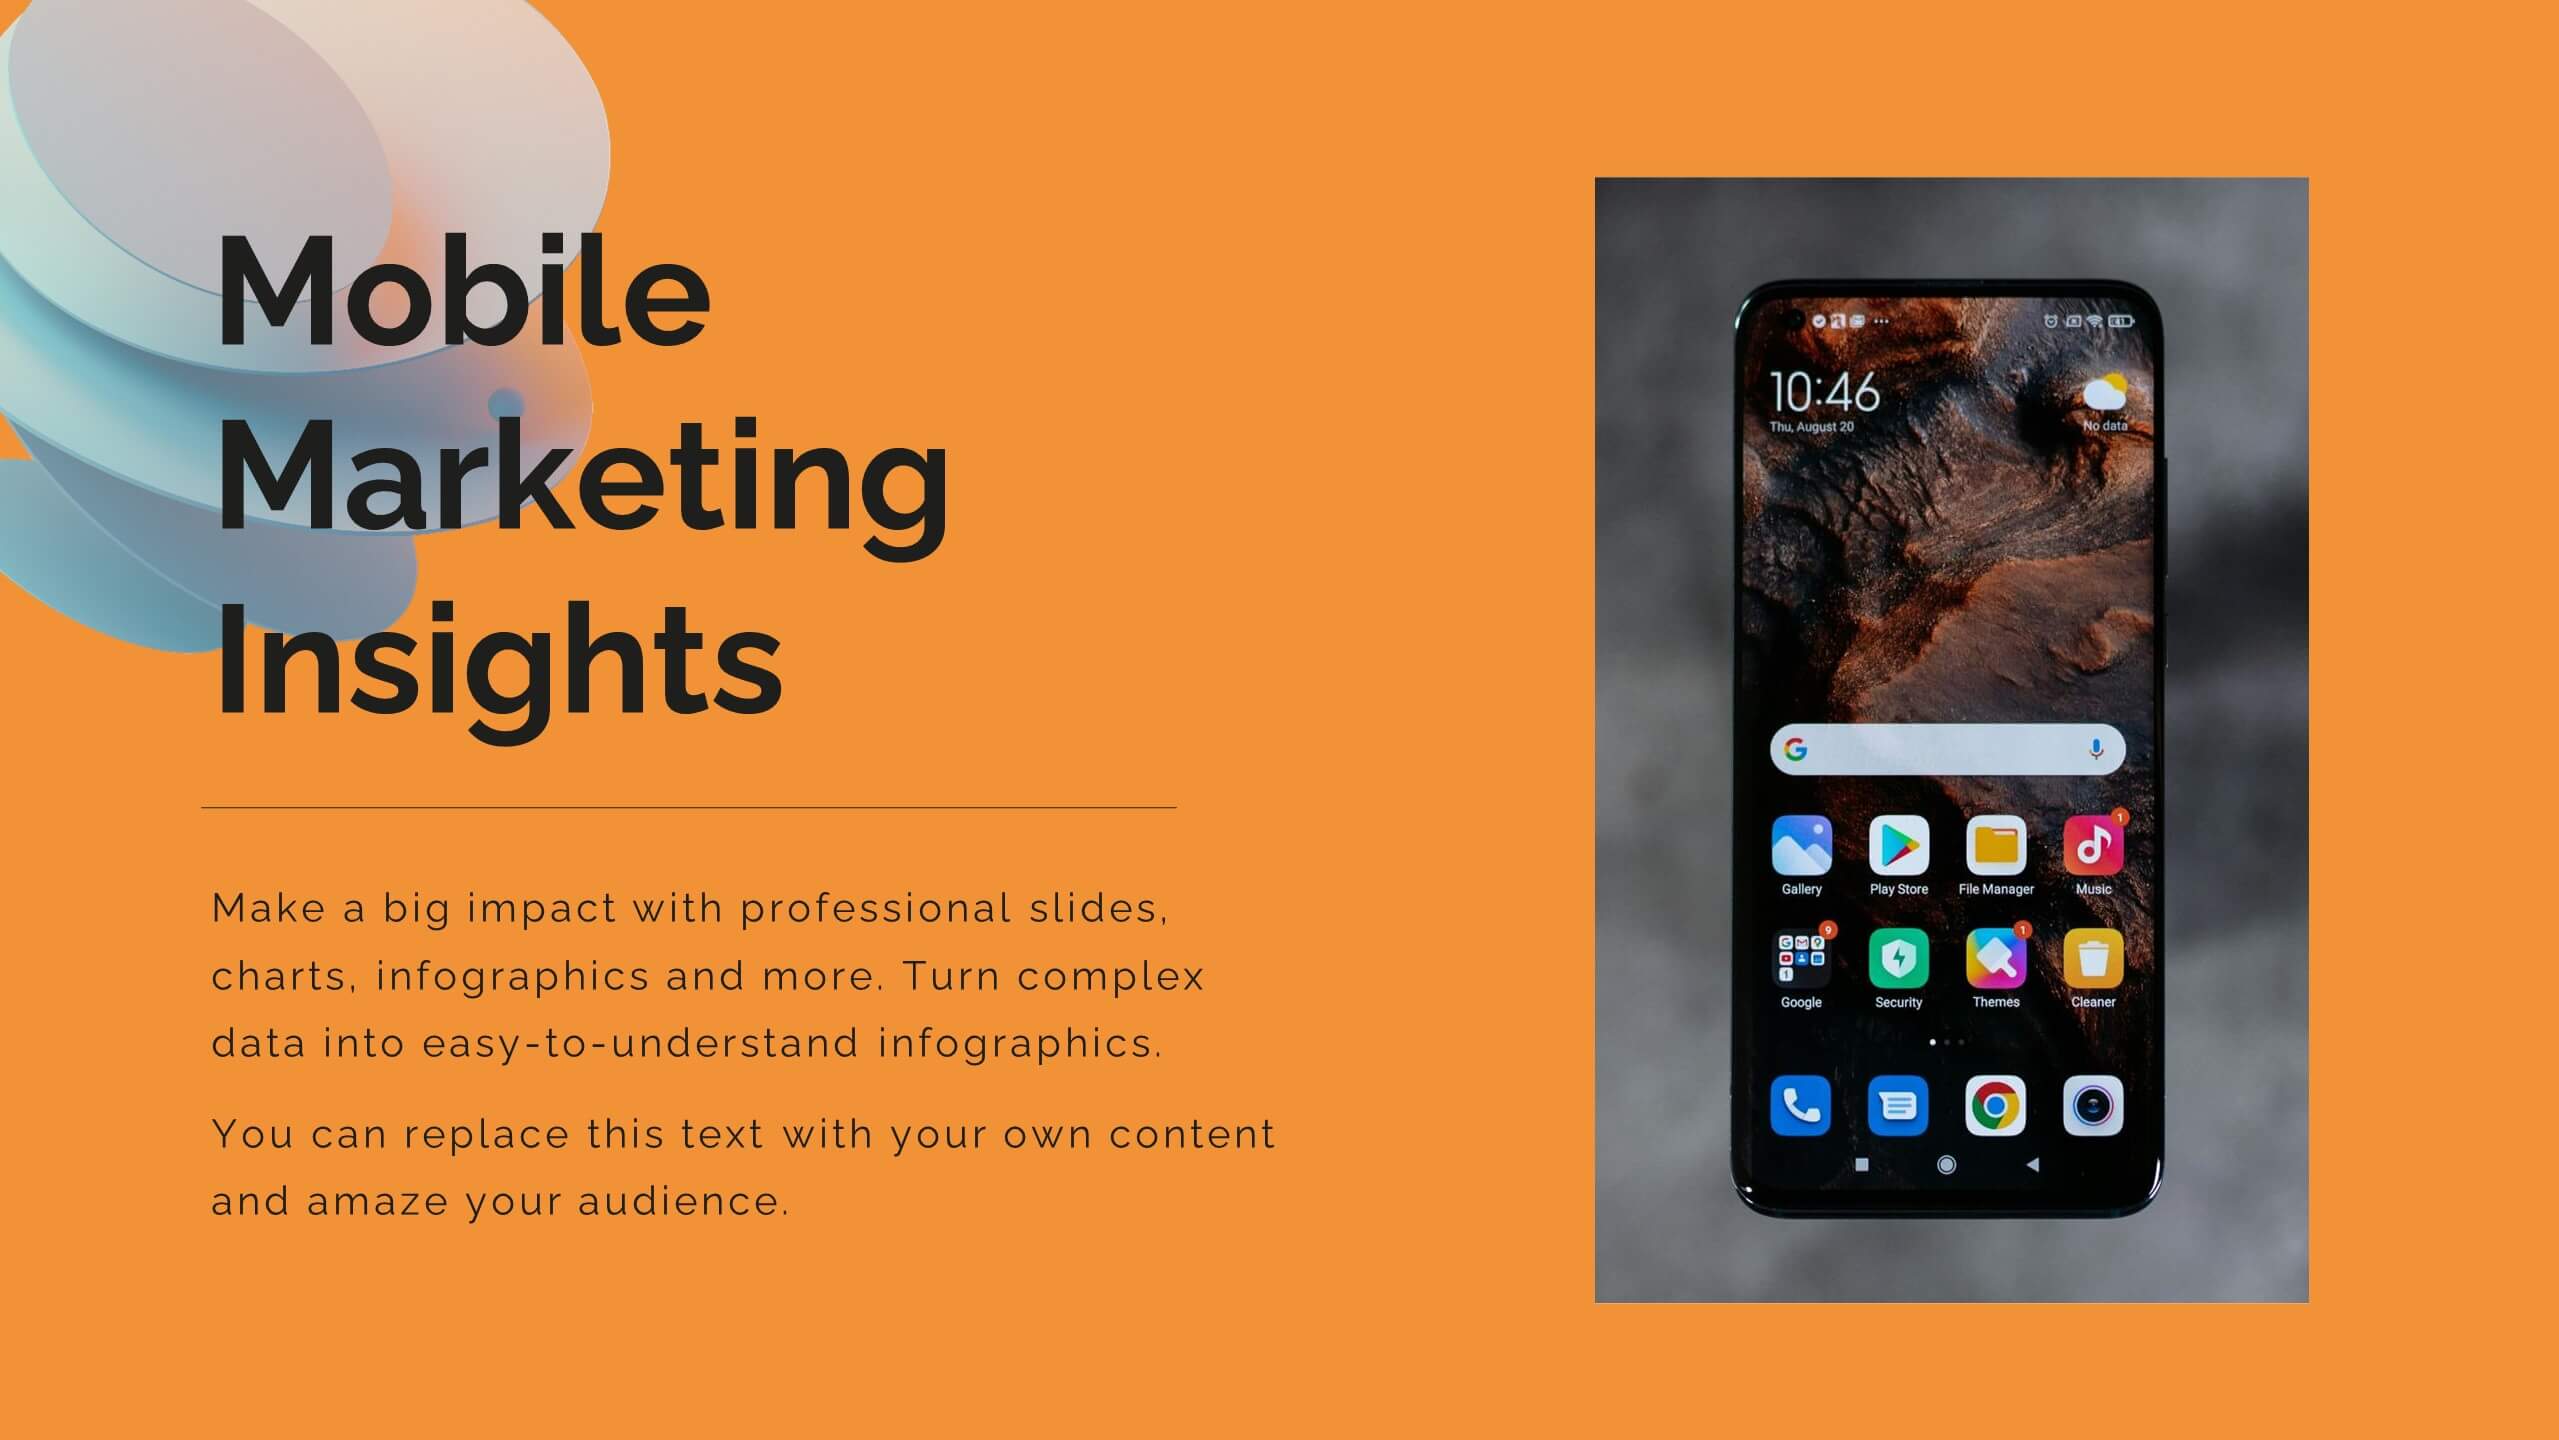
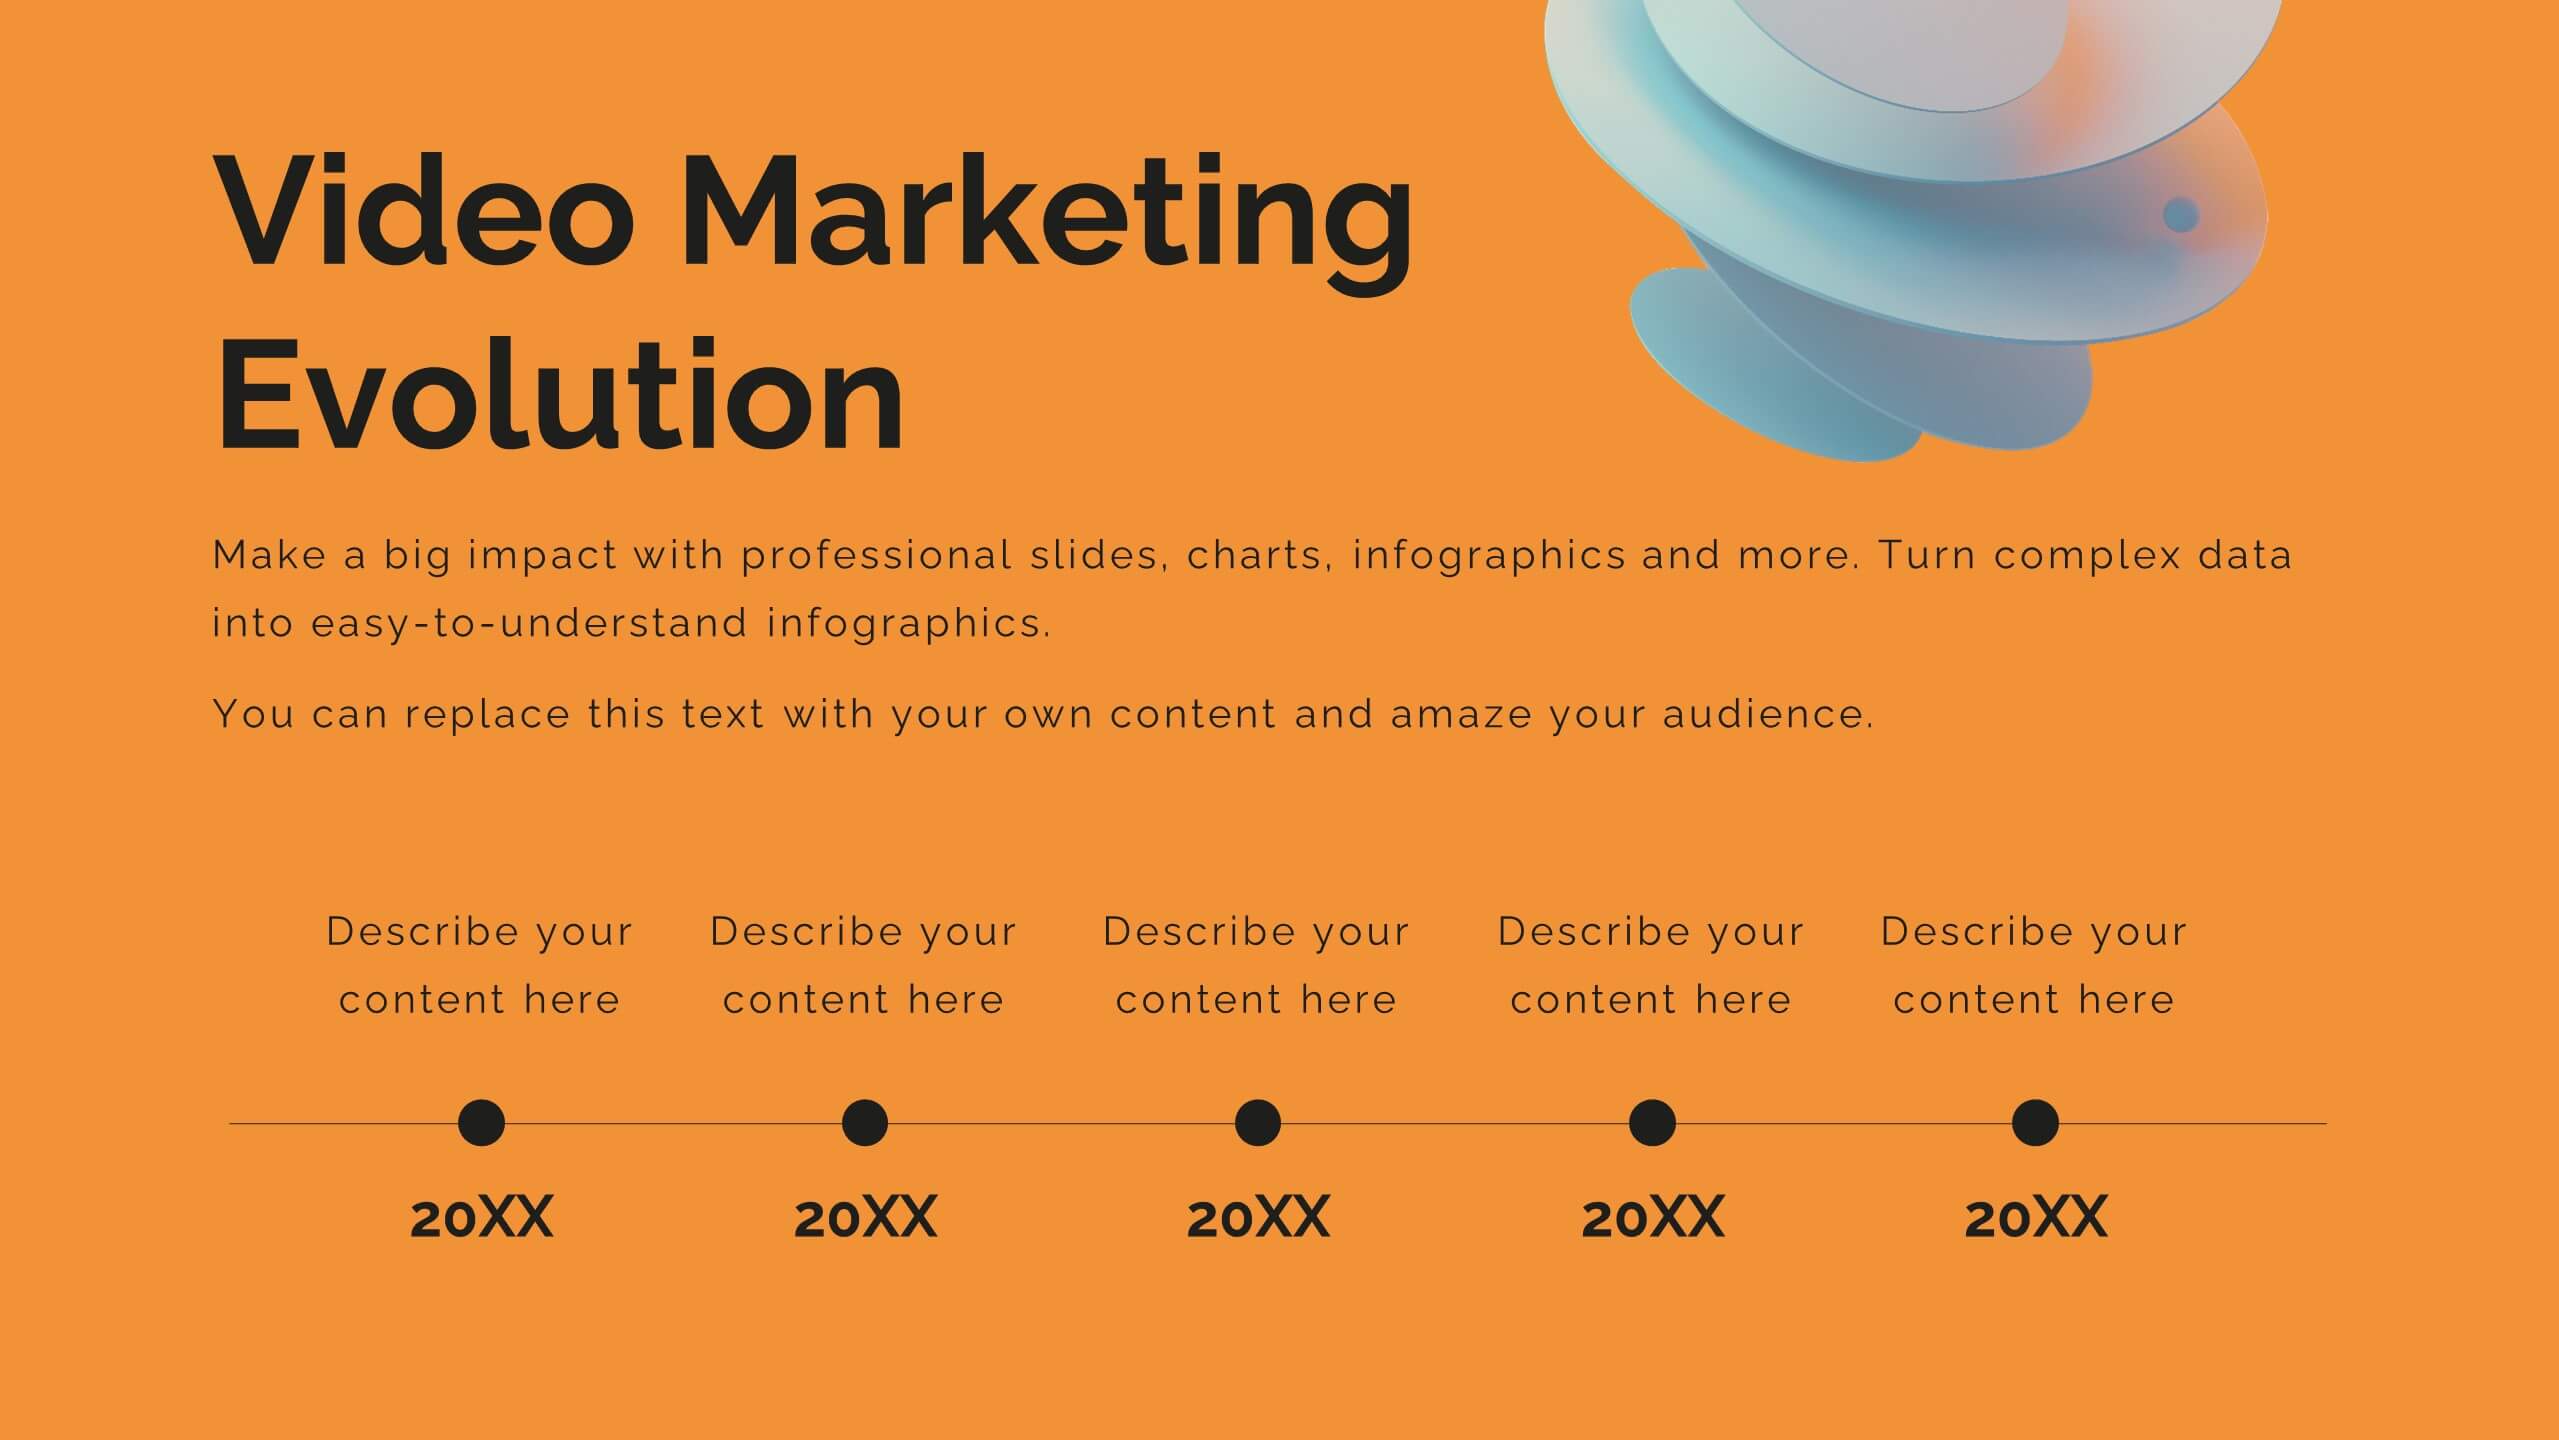
Breeze Content Marketing Pitch Deck Presentation
Elevate your content marketing strategy with this vibrant pitch deck! Perfect for outlining industry trends, consumer behavior, and innovative techniques. Ideal for marketers aiming to impress clients and stakeholders. Compatible with PowerPoint, Keynote, and Google Slides, this template ensures your pitch is engaging, persuasive, and professional. Achieve marketing success today!


24 slides
Zenith Investor Pitch Presentation
Impress your investors with this sleek, modern pitch deck presentation template. Perfect for detailing problem statements, solutions, business models, and revenue projections, it features a professional design with a cohesive color scheme. Highlight key elements like market opportunities, competitive landscapes, and financials to captivate your audience. Compatible with PowerPoint, Keynote, and Google Slides, it ensures seamless presentations on any platform.
5 slides
Performance Progress Tracking Presentation
Monitor performance with precision using this Performance Progress Tracking template. This visually engaging dashboard helps you track progress across multiple stages, from planning to testing. With interactive bar graphs and percentage indicators, you can evaluate real-time performance, identify bottlenecks, and make data-driven decisions. Fully customizable for PowerPoint, Keynote, and Google Slides, ensuring seamless adaptability.


10 slides
Cause and Effect Fishbone Presentation
Visualize root causes and streamline analysis with this Cause and Effect Fishbone infographic. Ideal for identifying issues across categories, it helps present logical flows clearly. Fully editable and perfect for business, strategy, or process improvement discussions. Compatible with PowerPoint, Keynote, and Google Slides for effortless customization.


22 slides
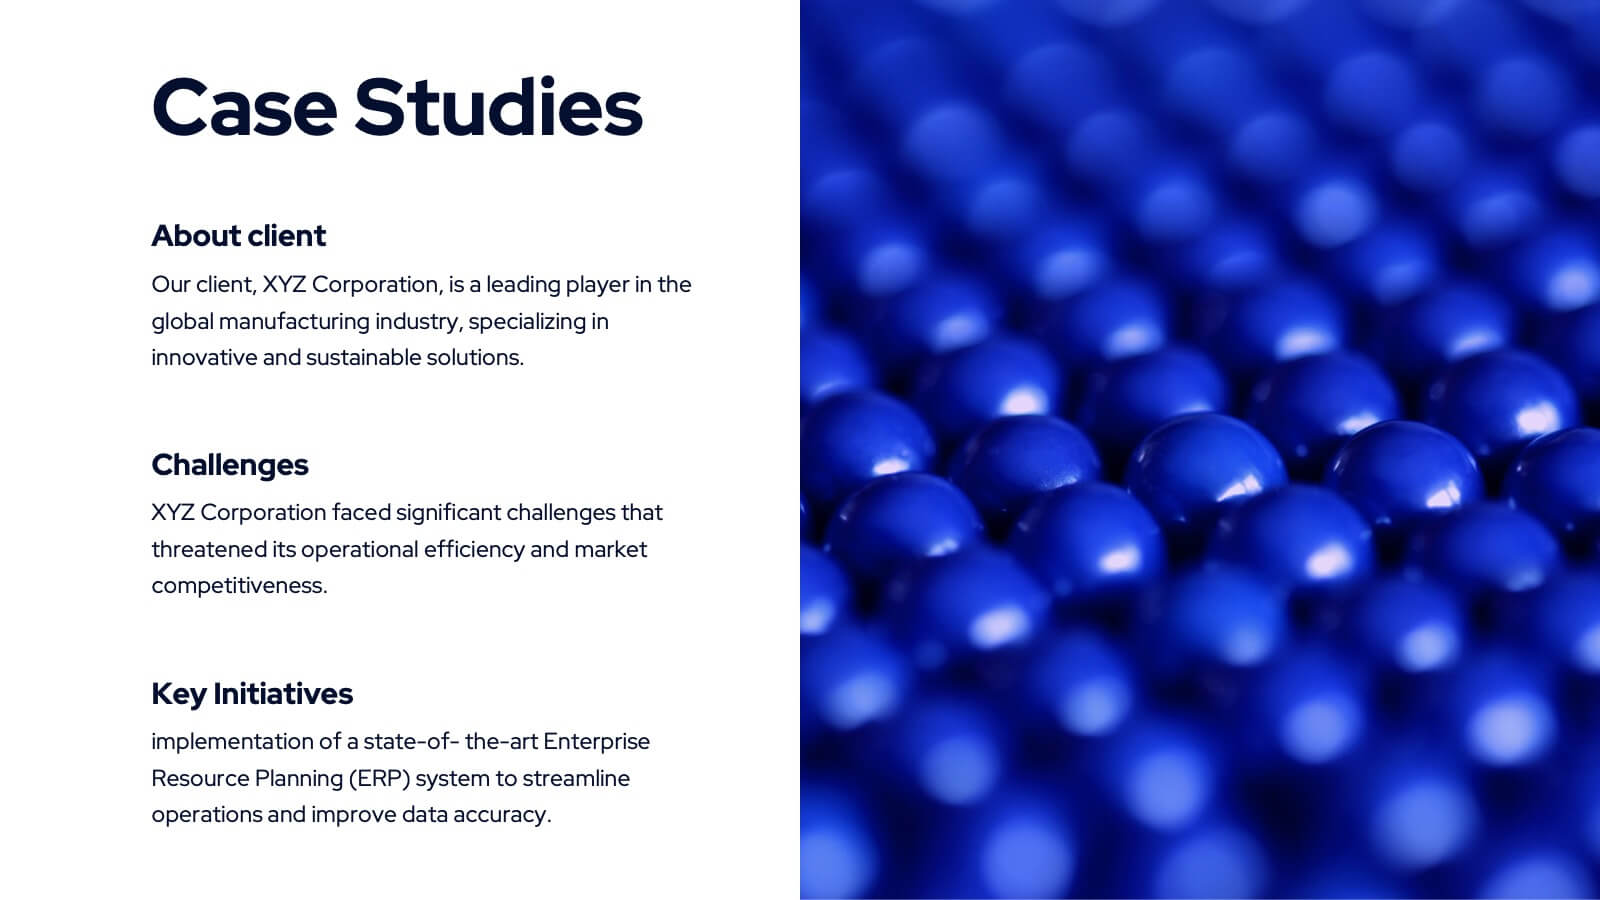
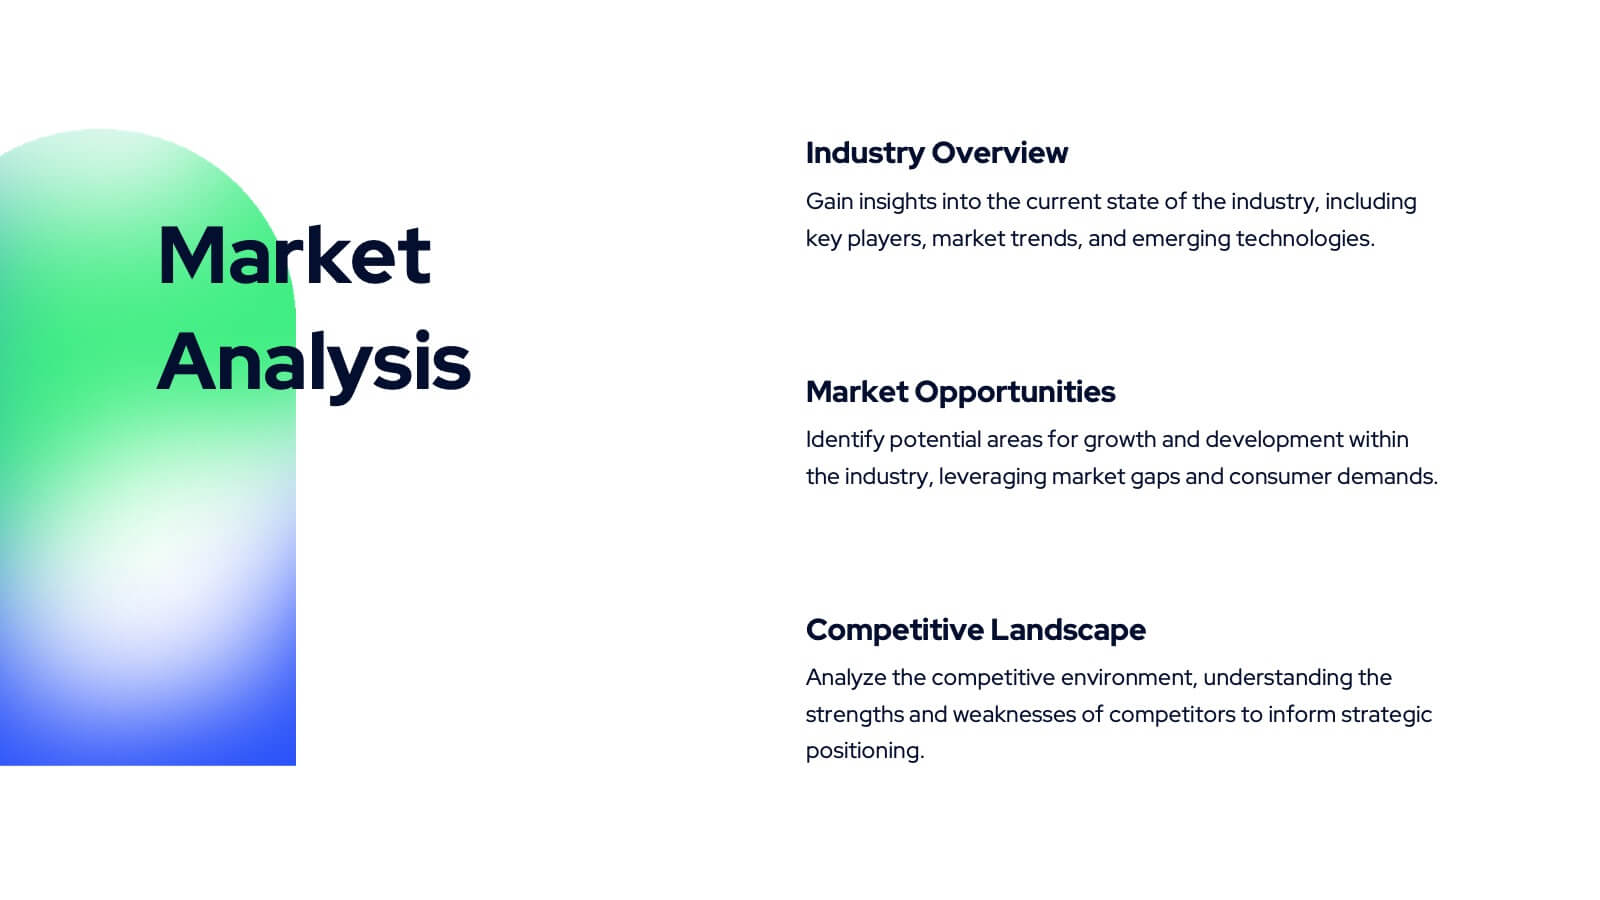
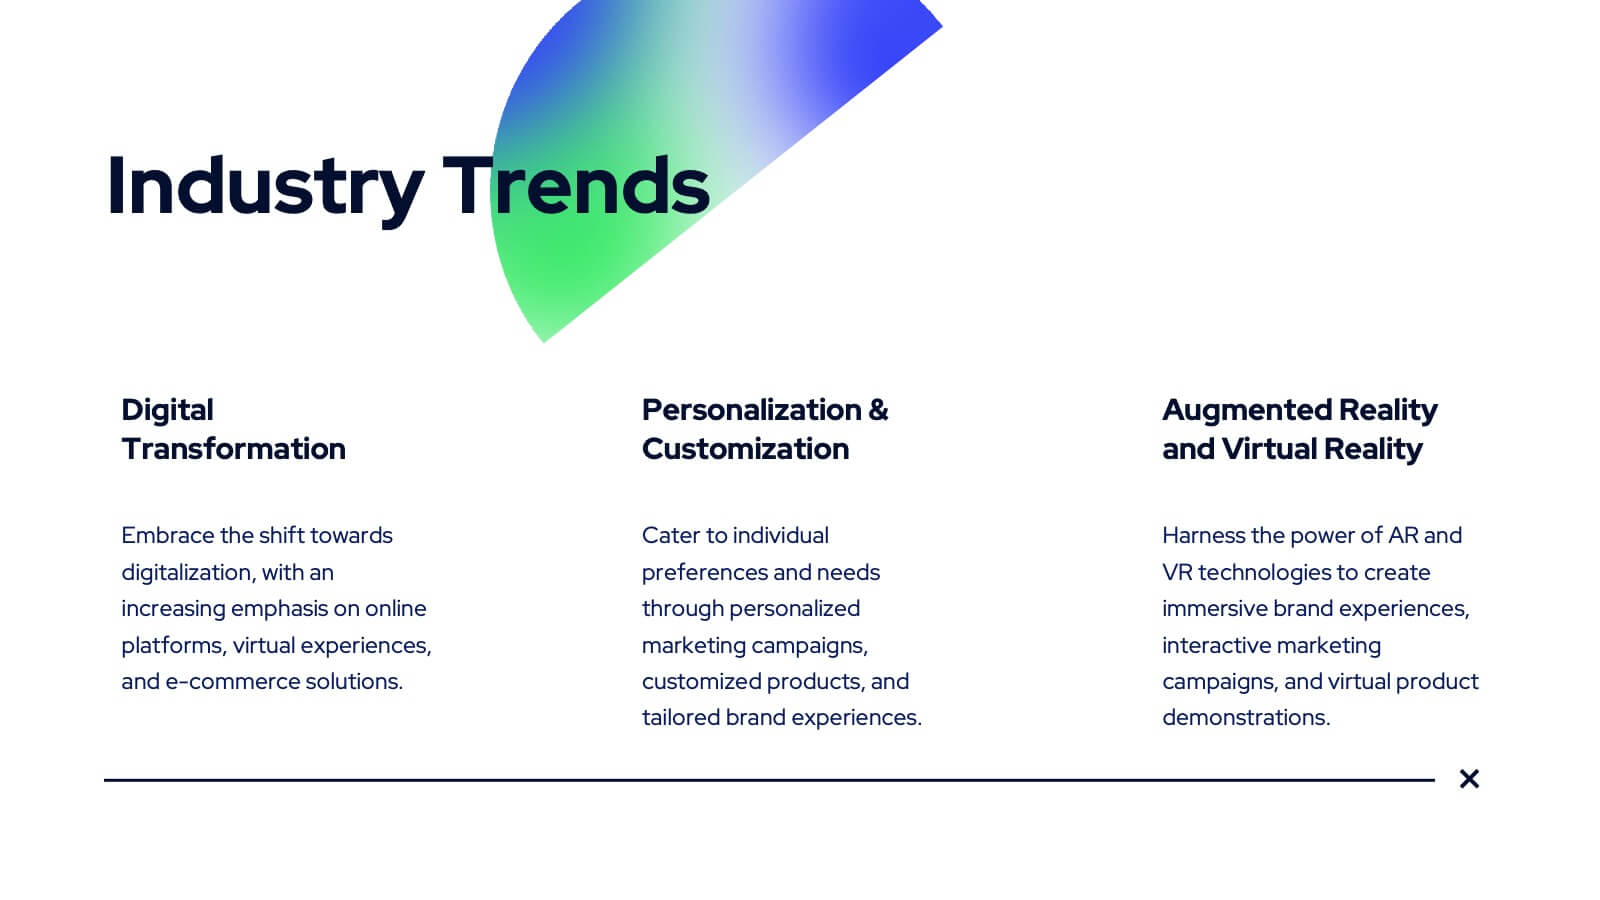
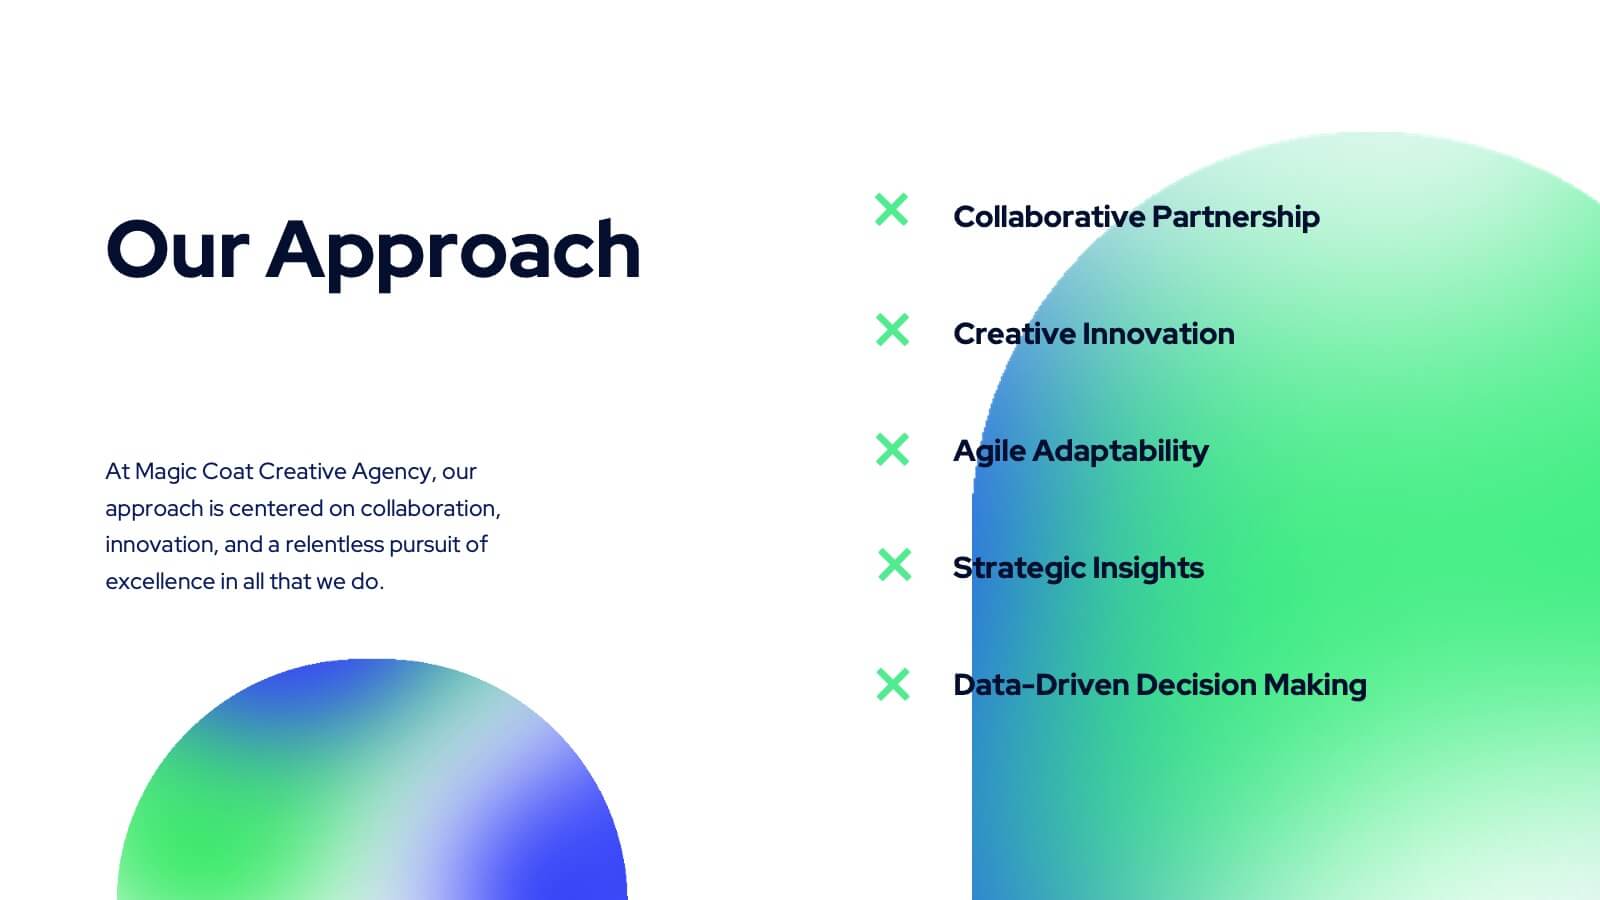
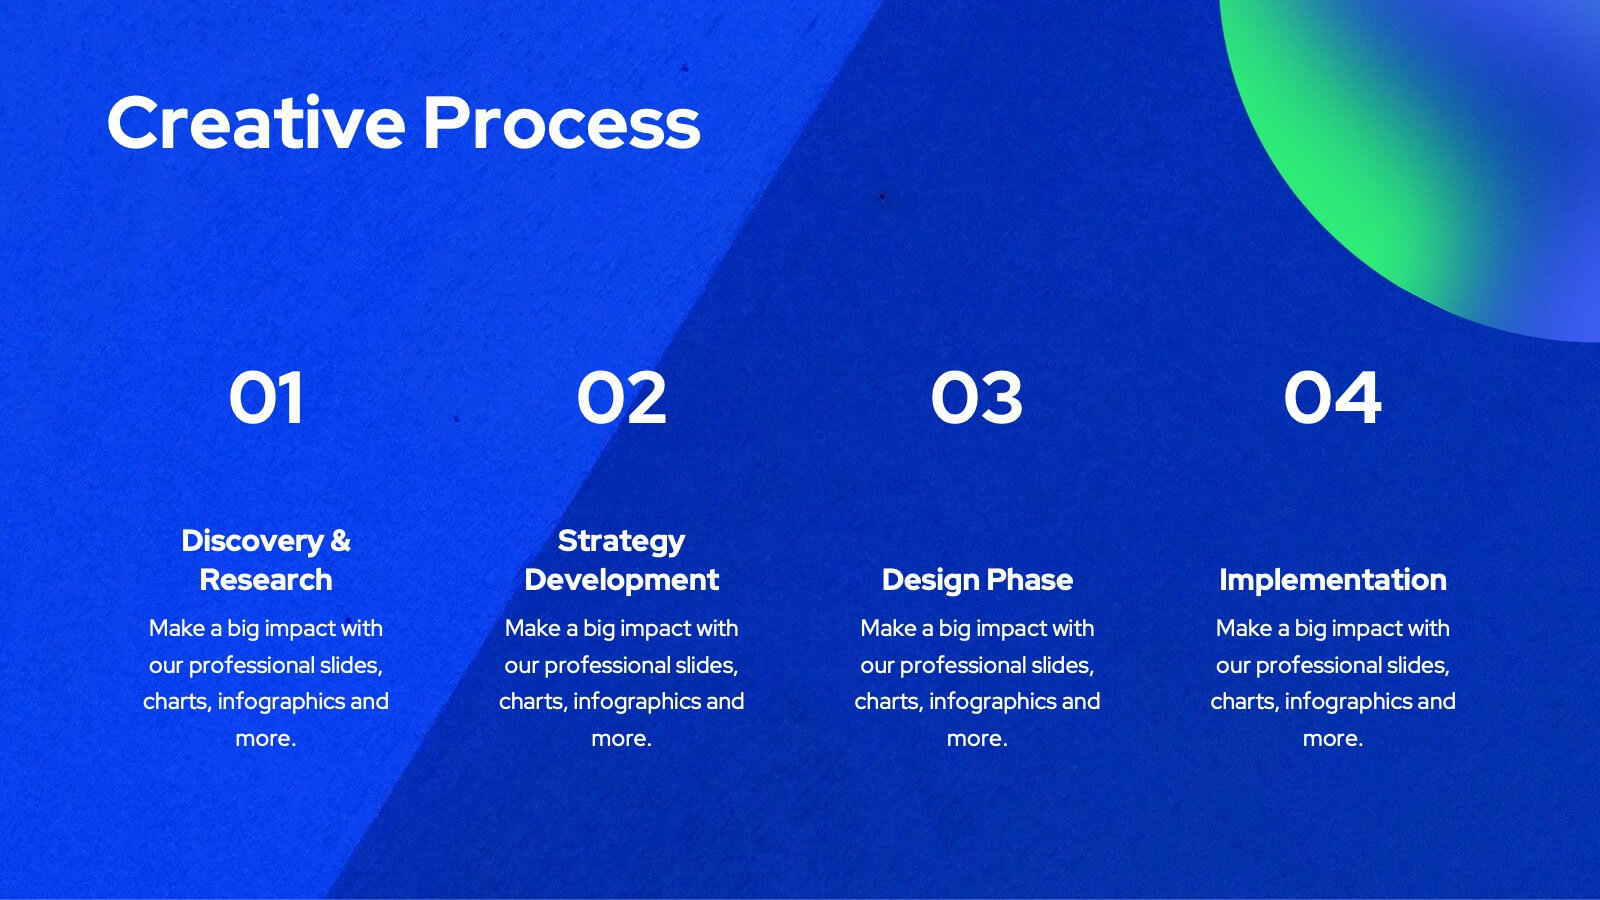
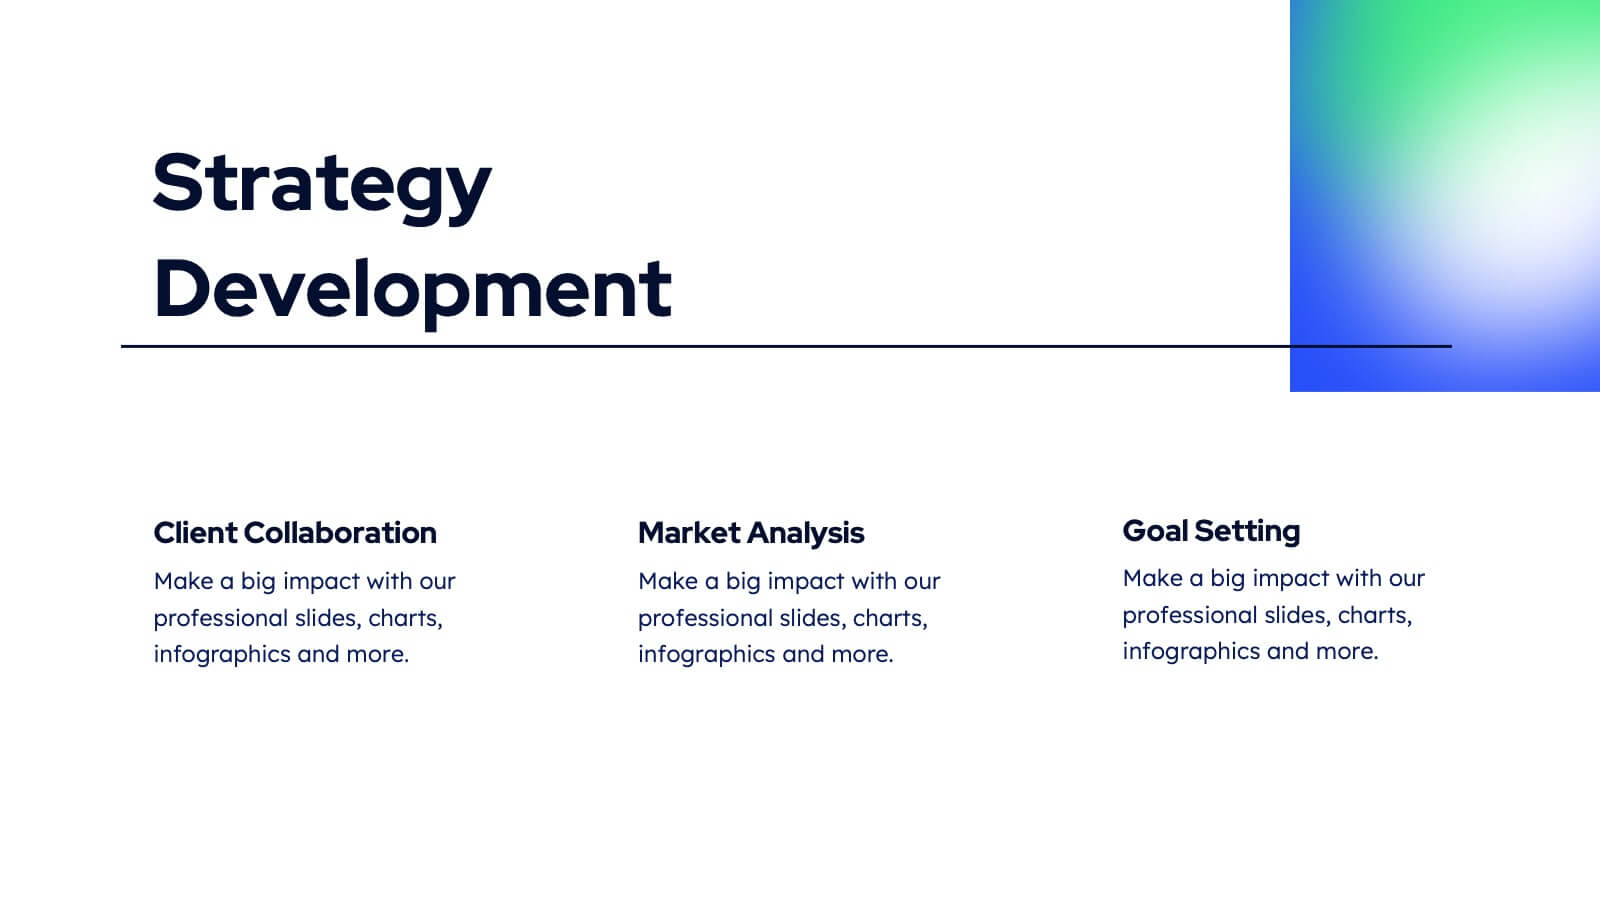
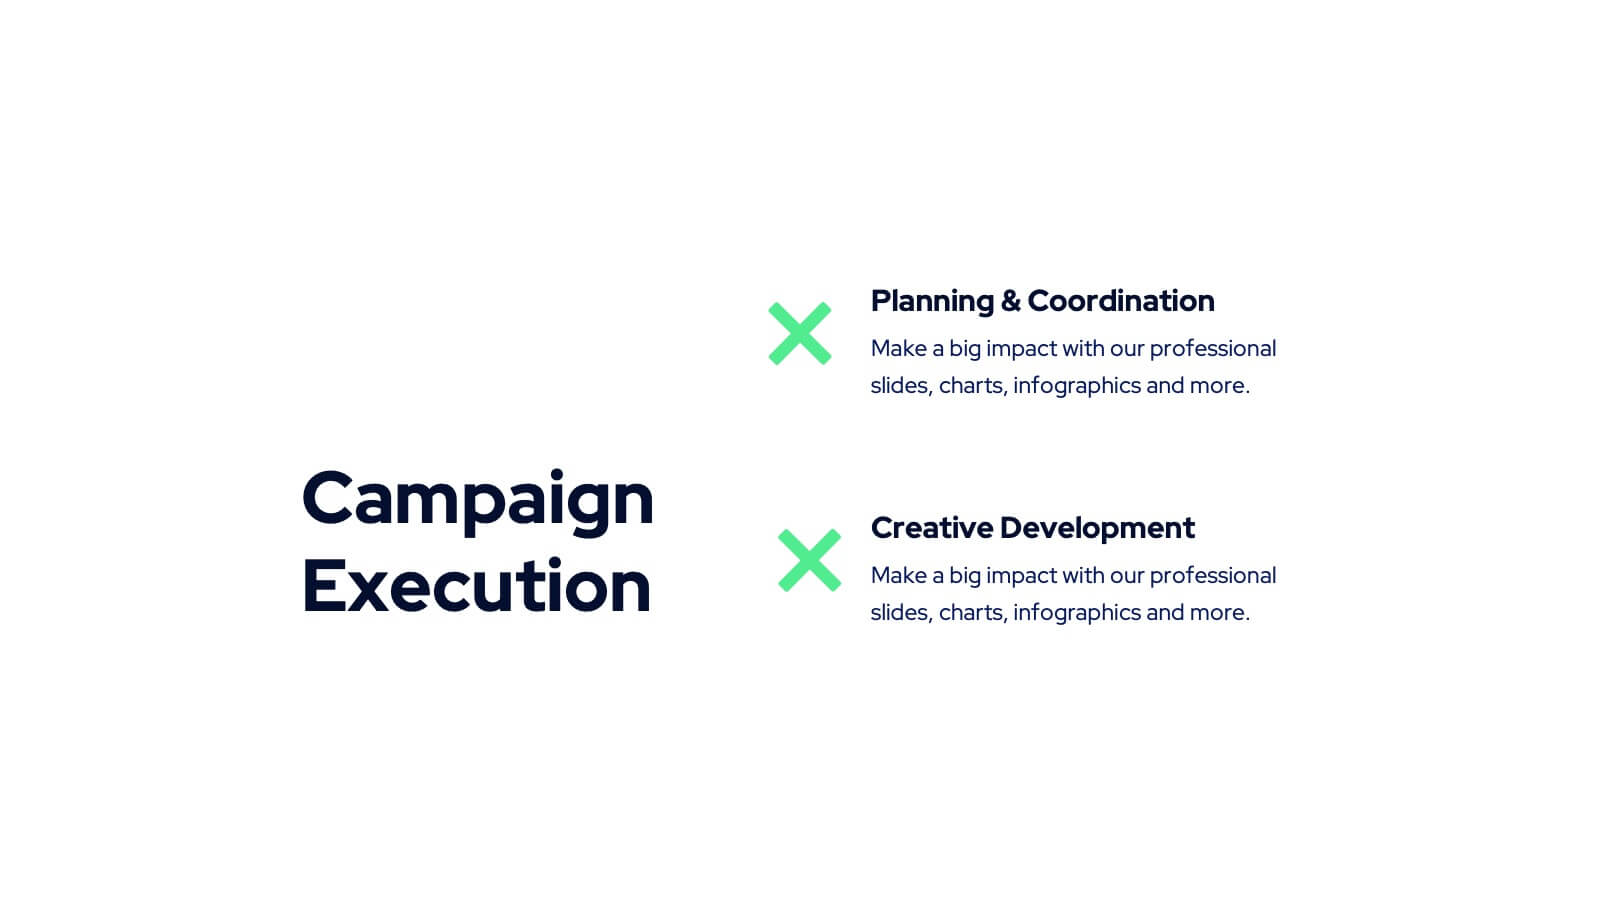
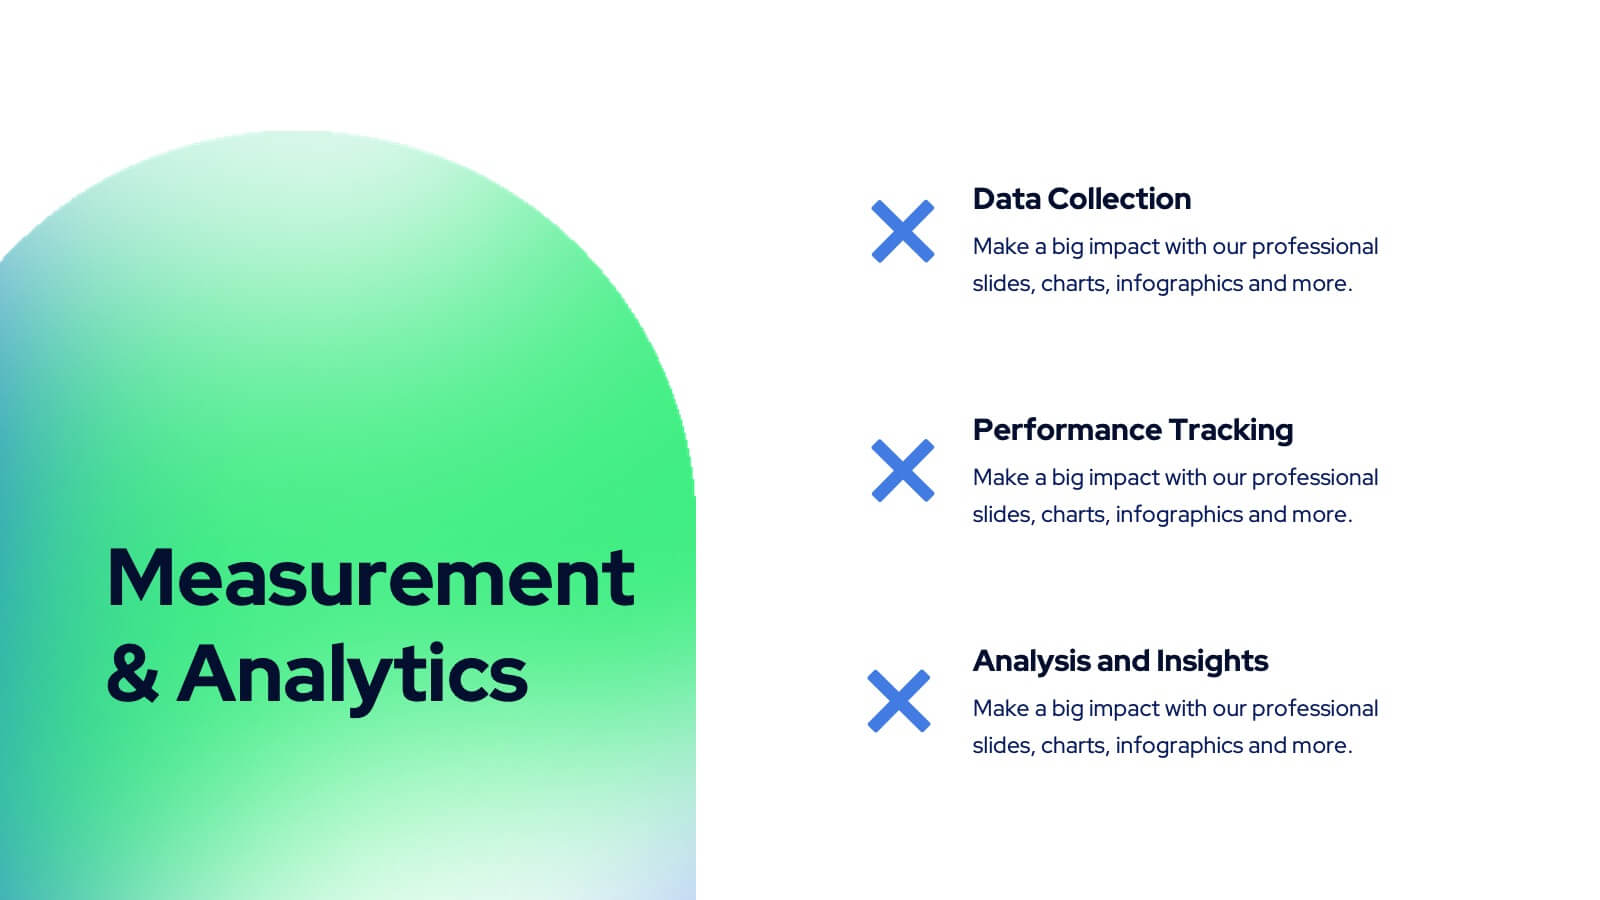
Tanzanite Full-Service Agency Project Plan Presentation
Showcase your agency's strengths with this bold and modern portfolio presentation template! From client success stories and case studies to market analysis and strategy development, this template highlights your expertise and approach. Perfect for agencies looking to present their services, creative processes, and partnerships. Compatible with PowerPoint, Keynote, and Google Slides, making it easy to impress any audience.


6 slides
RACI Responsibilities Assignment Matrix Presentation
Bring clarity and structure to your workflow with a clean layout that instantly shows who’s doing what and when. This presentation helps you assign ownership, improve communication, and eliminate confusion across projects using a simple visual matrix. Fully editable and compatible with PowerPoint, Keynote, and Google Slides.


4 slides
Comparison Table Slide Presentation
Quickly highlight the differences between options with the Comparison Table Slide Presentation. This layout features a clean, structured table with checkmarks and Xs to visually compare features, services, or product tiers. Ideal for pricing plans, feature breakdowns, or side-by-side evaluations. Each column is color-coded for clarity and impact. Fully customizable in PowerPoint, Keynote, and Google Slides.


6 slides
Pricing Table Infographic
Present your pricing structures clearly with our Pricing Table Infographic, compatible with Powerpoint, Google Slides, and Keynote. This template is designed for businesses of all sizes to display different pricing tiers and package options. Color-coded for ease of comparison, each column provides a visual breakdown of features, costs, and benefits, making it perfect for sales presentations and marketing materials. With customizable rows and icons, you can tailor the information to match your services or products, ensuring your audience understands the value at each price point.


5 slides
Editable Asia Region Map Slide Presentation
Explore data across countries with a sleek regional map designed to visualize insights and connections in a clear, professional way. Perfect for presenting market trends, business reach, or project highlights across Asia, this editable layout is fully compatible with PowerPoint, Keynote, and Google Slides for easy customization.


21 slides
Phoenix Design Portfolio Presentation
Elevate your design presentations with this stylish, contemporary template. Perfect for showcasing design portfolios, concept development, and project timelines, it features a modern layout with vibrant colors. Highlight key elements like color palettes, textures, and design processes to captivate your audience. Compatible with PowerPoint, Keynote, and Google Slides, it ensures seamless presentations on any platform.


7 slides
Goals Infographic Presentation Template
A goals infographic is a set of goals, objectives, or plans, often used for personal or organizational planning and development. This template allows you to include information about your specific goals, the steps required to achieve them, the timeline for completion, and any relevant metrics or targets. The purpose of our goals infographic is to help you provide a clear and concise overview of what is to be accomplished, and help you keep focus on achieving those goals. This well-designed infographic can help you prioritize and track progress, and can serve as a visual reminder.


6 slides
IT Architecture Diagram Presentation
Turn complex system structures into clear visual stories with this professional presentation. Perfect for mapping processes, software layers, or organizational workflows, it helps communicate how technology components connect and operate. Fully editable and compatible with PowerPoint, Keynote, and Google Slides for seamless customization and engaging technical presentations.


7 slides
Watercolor Strategy Infographic
Dive into a cascade of strategic insights with our watercolor strategy infographic. Presented on a crisp white canvas, the splash of yellow, green, and blue emanates a fluidity that mirrors the dynamic nature of business strategies. Each hue merges seamlessly to provide a visual treat while retaining the core informational value. Tailored for Powerpoint, Keynote, and Google Slides, this template is embellished with customizable graphics, intricate icons, and flexible image placeholders, making it an ideal choice for any strategic visualization. Let your strategy flow, vivid and vibrant, just like watercolors on paper.


5 slides
Medical Anatomy Chart Slide Presentation
Present body systems or organ-related topics with this anatomy chart slide. Designed with pinpoint callouts linked to a human silhouette, it helps explain up to four body parts or functions. Ideal for health, biology, or patient education presentations. Fully editable in PowerPoint, Keynote, or Google Slides for clean, visual storytelling.