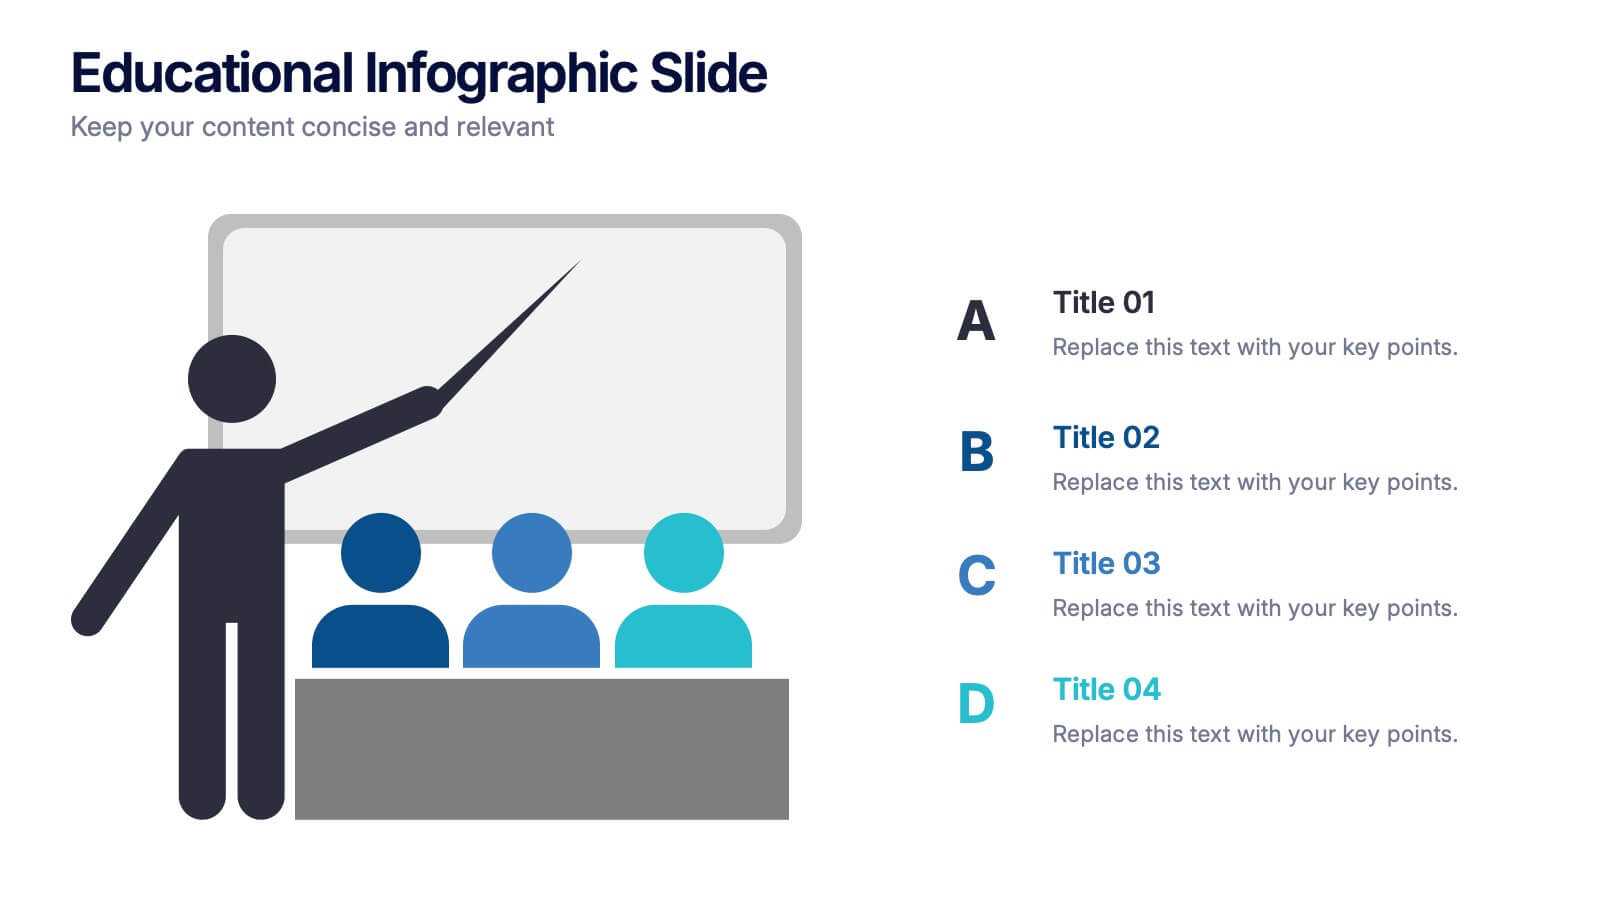
Educational Infographic Slide Presentation
PowerPoint Template and Google Slides Theme
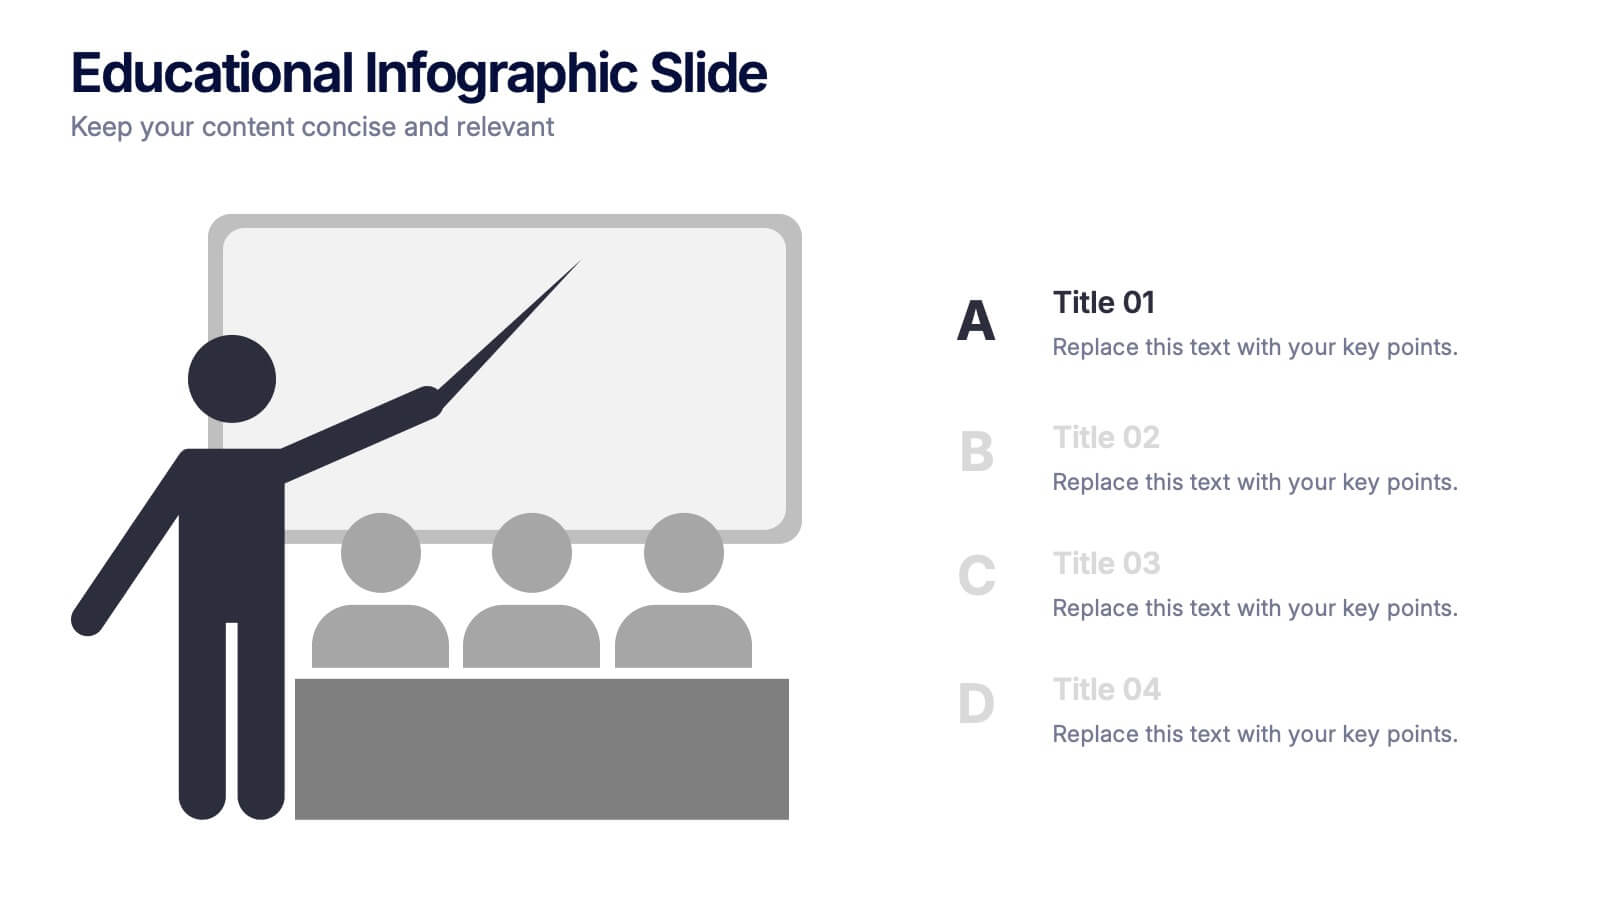
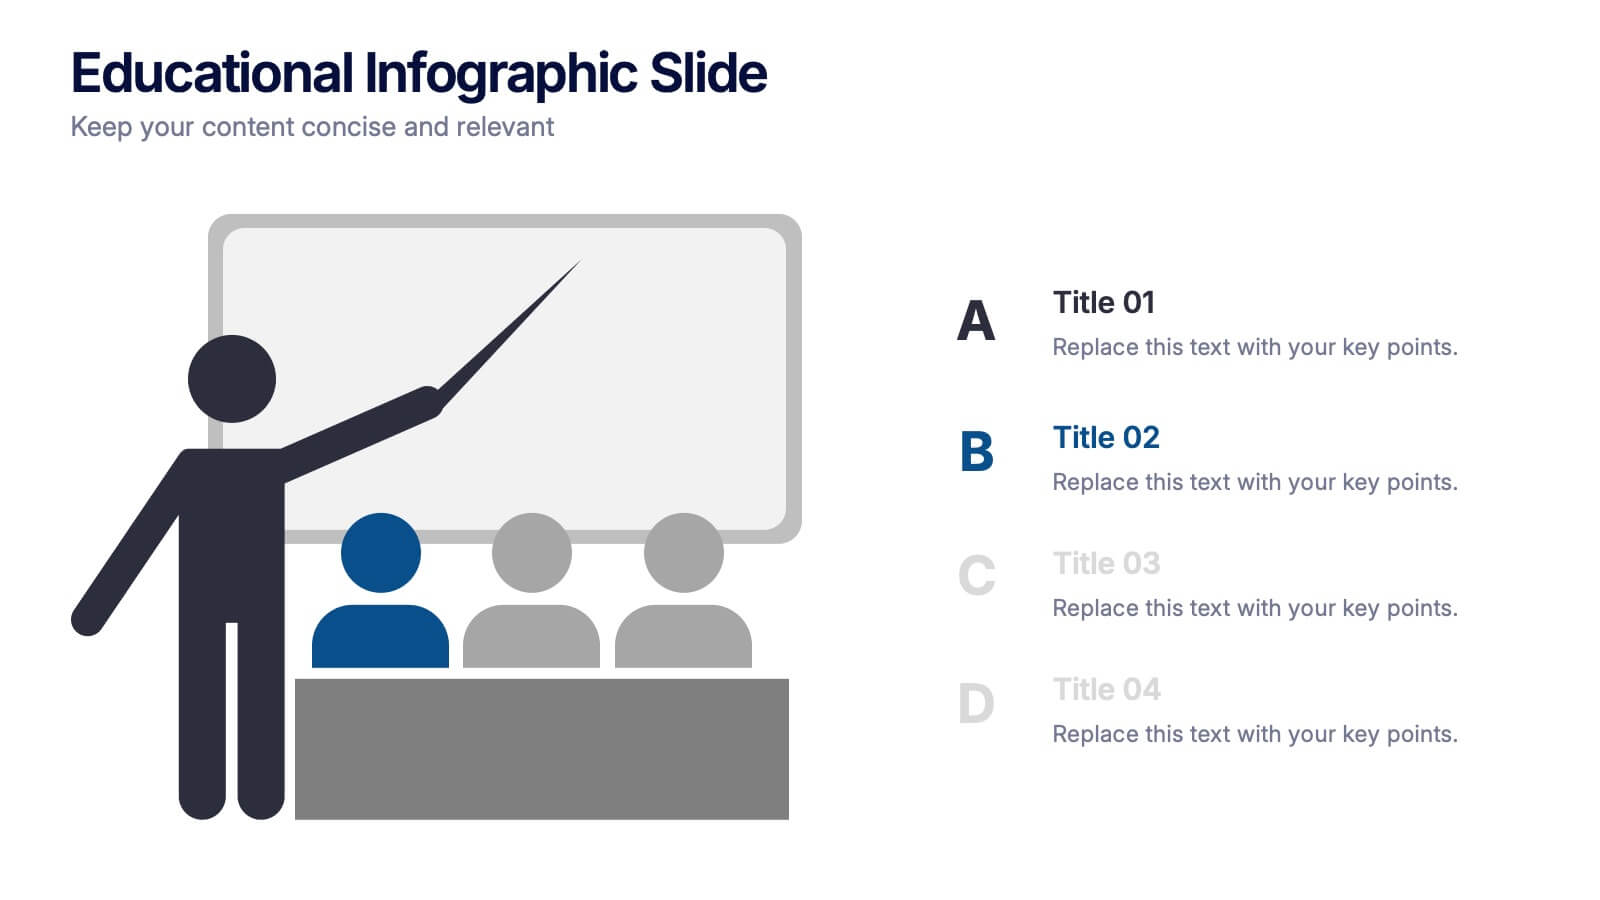
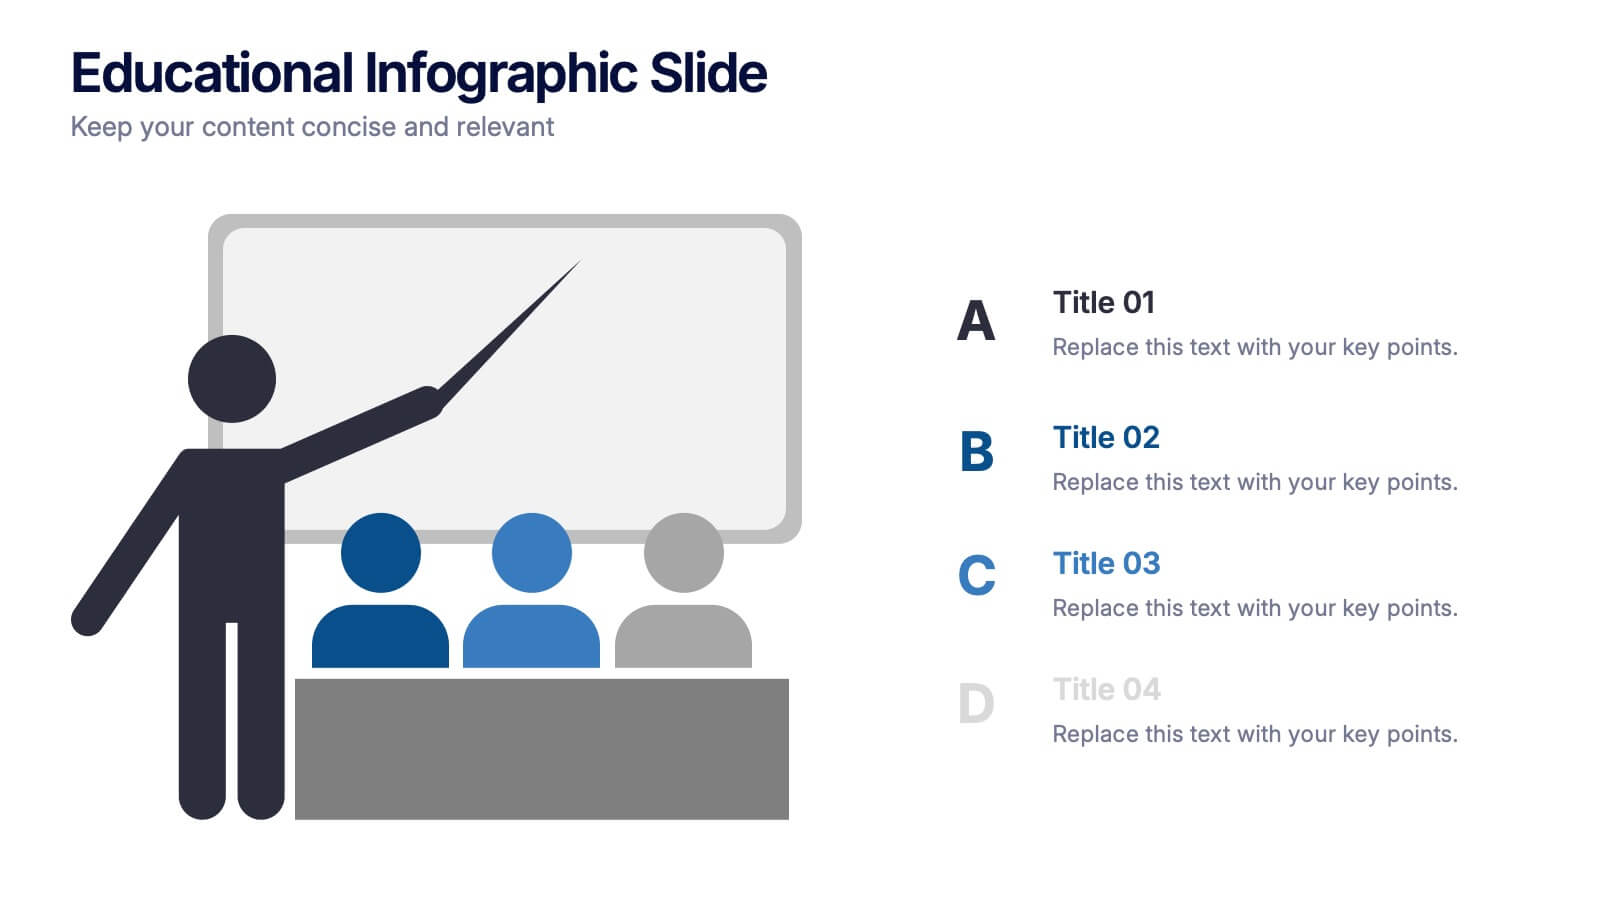
Features
- 4 Unique slides
- Fully editable and easy to edit in Microsoft Powerpoint, Keynote and Google Slides
- 16:9 widescreen layout
- Clean and professional designs
- Export to JPG, PDF or send by email
- Remove from favorites
Powerpoint Template
1 MB
Google Slides Template
External link
Keynote Template
1 MB
Recommend
- Remove from favorites
Powerpoint Template
1 MB
Google Slides Template
External link
Keynote Template
2 MB
7 slides
Market Research Data Insights
Present insights with impact using this Market Research Data Insights slide. Featuring six circular data points with icons and space for strategic commentary, it's ideal for showcasing key findings, trends, or survey results. Fully editable in PowerPoint, Keynote, and Google Slides for versatile use.
- Remove from favorites
Powerpoint Template
20 MB
Google Slides Template
External link
Keynote Template
14 MB
26 slides
Reflecting on Our Nation's Heroes Presentation
This presentation template is a dynamic and respectful tribute to Memorial Day, designed to evoke deep respect and remembrance. It incorporates elements of the American flag across impactful slides, starting with a powerful title slide. The journey through America's military heritage unfolds with meticulously crafted slides that blend historical data and modern design, presenting a visual timeline of key events. Infographics and quote slides like "Heroes Never Fade: They Live on Forever in Our Hearts" feature iconic imagery and poignant quotes to stir emotions. Interactive elements, such as clickable parts in the "Process Infographic," allow for engaging exploration of military strategies. Ideal for educational settings or community gatherings, this template informs and inspires appreciation for the sacrifices that define Memorial Day, promoting values of courage and patriotism. It’s a tool that not only looks back with gratitude but also inspires future generations.
- Remove from favorites
Powerpoint Template
1 MB
Google Slides Template
External link
Keynote Template
2 MB
7 slides
McKinsey 7S Model Strategy Presentation
Bring clarity to complex organizational relationships with a clean, structured layout that highlights how key elements connect and influence performance. This presentation helps you explain core components, identify alignment gaps, and guide strategic decision-making with confidence. Easy to customize and fully compatible with PowerPoint, Keynote, and Google Slides.
- Remove from favorites
Powerpoint Template
7 MB
Google Slides Template
External link
Keynote Template
8 MB
26 slides
Artificial Intelligence Neon Gradient Presentation
Illuminate the cutting-edge world of artificial intelligence with our neon-inspired template, where the glow of innovation meets the rhythm of algorithms. Bathed in electrifying shades of neon purple, futuristic green, and fiery orange, the design captures the pulse of AI advancements. Augmented with tech-centric graphics, neon-lit icons, and visionary image placeholders, it's a dynamic gateway to the digital realm. Flawlessly engineered for Powerpoint, Keynote, or Google Slides. An indispensable interface for AI researchers, tech innovators, digital transformers, or anyone eager to tread the neon pathways of machine intelligence. Power up; let AI's neon future unfold.
- Remove from favorites
Powerpoint Template
1 MB
Google Slides Template
External link
Keynote Template
2 MB
6 slides
Project Planning and Task Allocation Presentation
Streamline your project timelines with the Project Planning and Task Allocation Presentation. This template uses a clear horizontal flow to map out six key tasks or stages, making it ideal for visualizing schedules, assigning responsibilities, or showcasing milestones. Fully editable in PowerPoint, Google Slides, Keynote, and Canva.
- Remove from favorites
Powerpoint Template
7 MB
Google Slides Template
External link
Keynote Template
9 MB
26 slides
Book Reading Creative Lesson Presentation
A book reading lesson is an educational activity designed to improve students' reading skills and comprehension. This presentation template aims to foster a love for reading and enhance students' ability to understand and interpret written text. This template is designed to spark the love for reading and literature among students. With its colorful and interactive design, this presentation's goal is to make the learning experience enjoyable and memorable for young learners. Colorful elements that represent the magic of reading are used throughout the presentation. This template is fully customizable and compatible with Powerpoint, Keynote, and Google Slides.
- Remove from favorites
Powerpoint Template
1 MB
Google Slides Template
External link
Keynote Template
1 MB
6 slides
Project Status Analysis Infographics
Analyze your project's status effectively with our Project Status Analysis infographic template. This template is fully compatible with popular presentation software like PowerPoint, Keynote, and Google Slides, allowing you to easily customize it to illustrate and communicate the key elements of project status analysis. The Project Status Analysis infographic template offers a visually engaging platform to depict project progress, milestones, risks, and key performance indicators. Whether you're a project manager, team leader, or business professional, this template provides a user-friendly canvas to create informative presentations and reports on your project's status. Optimize your project management and reporting with this SEO-optimized Project Status Analysis infographic template, thoughtfully designed for clarity and ease of use. Customize it to showcase project timelines, status updates, issue tracking, and strategies for project success, ensuring that your audience gains a comprehensive understanding of the project's current situation. Start crafting your personalized infographic today to excel in project status analysis.
- Remove from favorites
Powerpoint Template
1 MB
Google Slides Template
External link
Keynote Template
1 MB
6 slides
Iceberg Business Infographic
Delve beneath the surface with our Iceberg Business Infographic, perfect for Powerpoint, Google Slides, and Keynote. This infographic is designed to illustrate the underlying factors that impact an organization's success. The iceberg metaphor visually represents the concept that only a small part of a company's situation is visible above the surface, while much more is hidden below. The customizable segments can be used to detail various aspects of business operations, risks, and opportunities that are not immediately apparent. By employing this Iceberg Business infographic, you can effectively communicate the complexities of business strategies.
- Remove from favorites
Powerpoint Template
1 MB
Google Slides Template
External link
Keynote Template
1 MB
7 slides
McKinsey Business Infographic
The McKinsey 7S Model is a management model developed by consulting company McKinsey & Company. This infographic template offers a framework to analyze and align various internal aspects of an organization to ensure its success and effectiveness. Compatible with Powerpoint, Keynote, and Google Slides. Customize the content, design, and visuals to craft an engaging and informative infographic that showcases McKinsey & Company's global impact and expertise in transforming businesses. This business infographic should serve as a snapshot of McKinsey's core strengths and values.
- Remove from favorites
Powerpoint Template
1 MB
Google Slides Template
External link
Keynote Template
1 MB
4 slides
5G Tech Use Cases and Industry Impact Presentation
Step into the future with this modern, tech-focused layout designed to simplify complex 5G use case presentations. Ideal for showcasing industry-specific impacts, this infographic-style slide makes your data look clean and professional. Fully editable and compatible with PowerPoint, Keynote, and Google Slides for seamless customization.
- Remove from favorites
Powerpoint Template
3 MB
Google Slides Template
External link
Keynote Template
2 MB
3 slides
Company Mission Overview Presentation
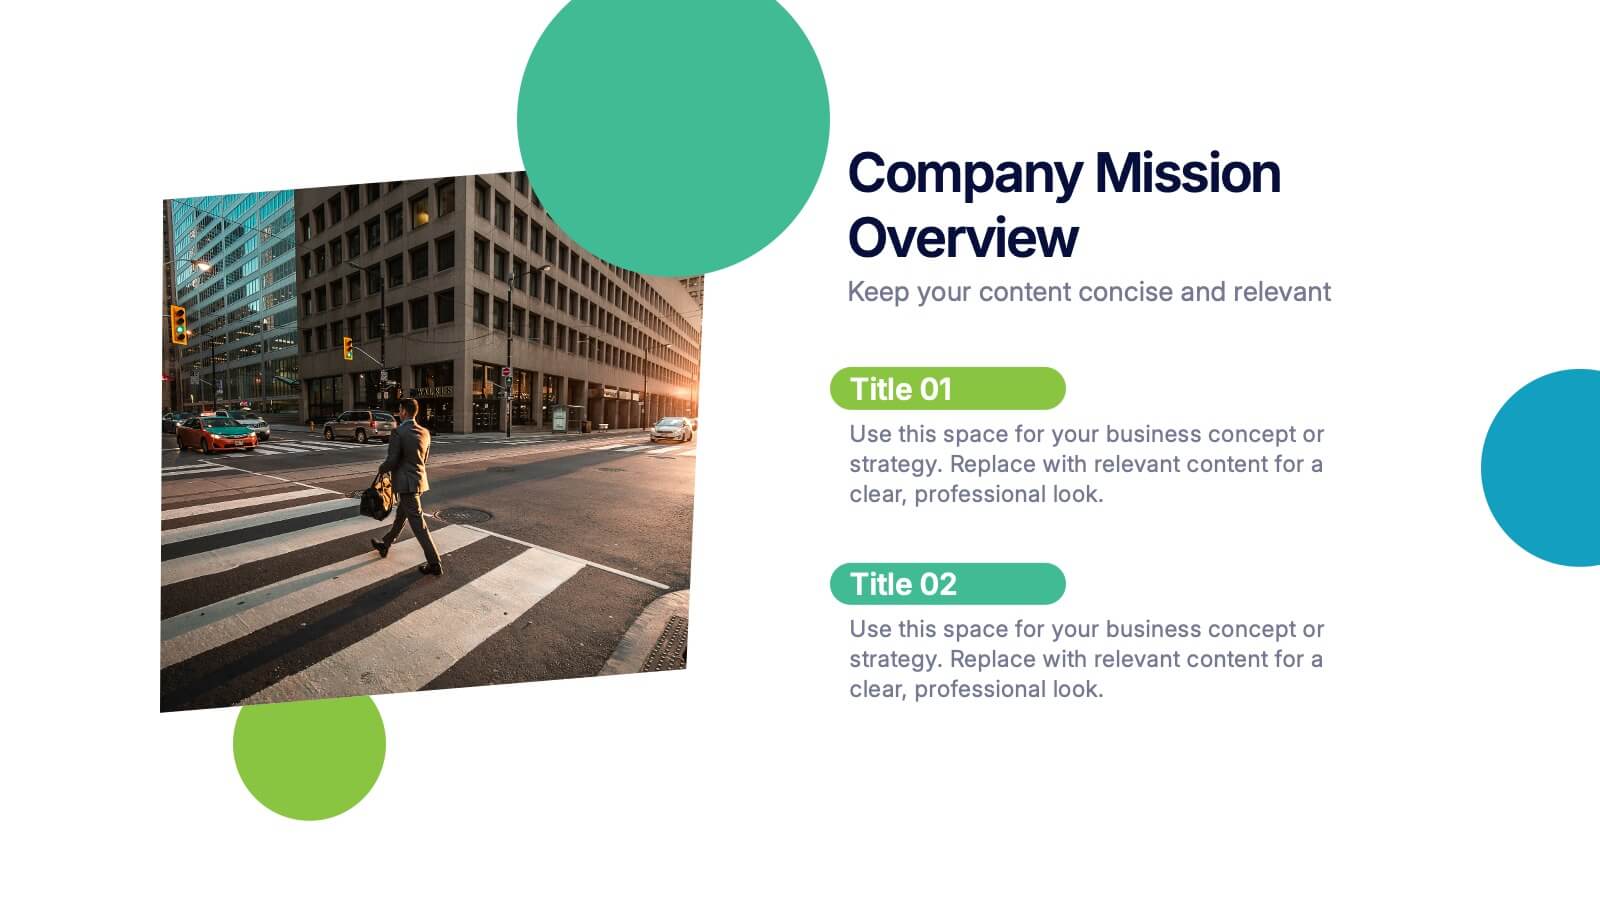
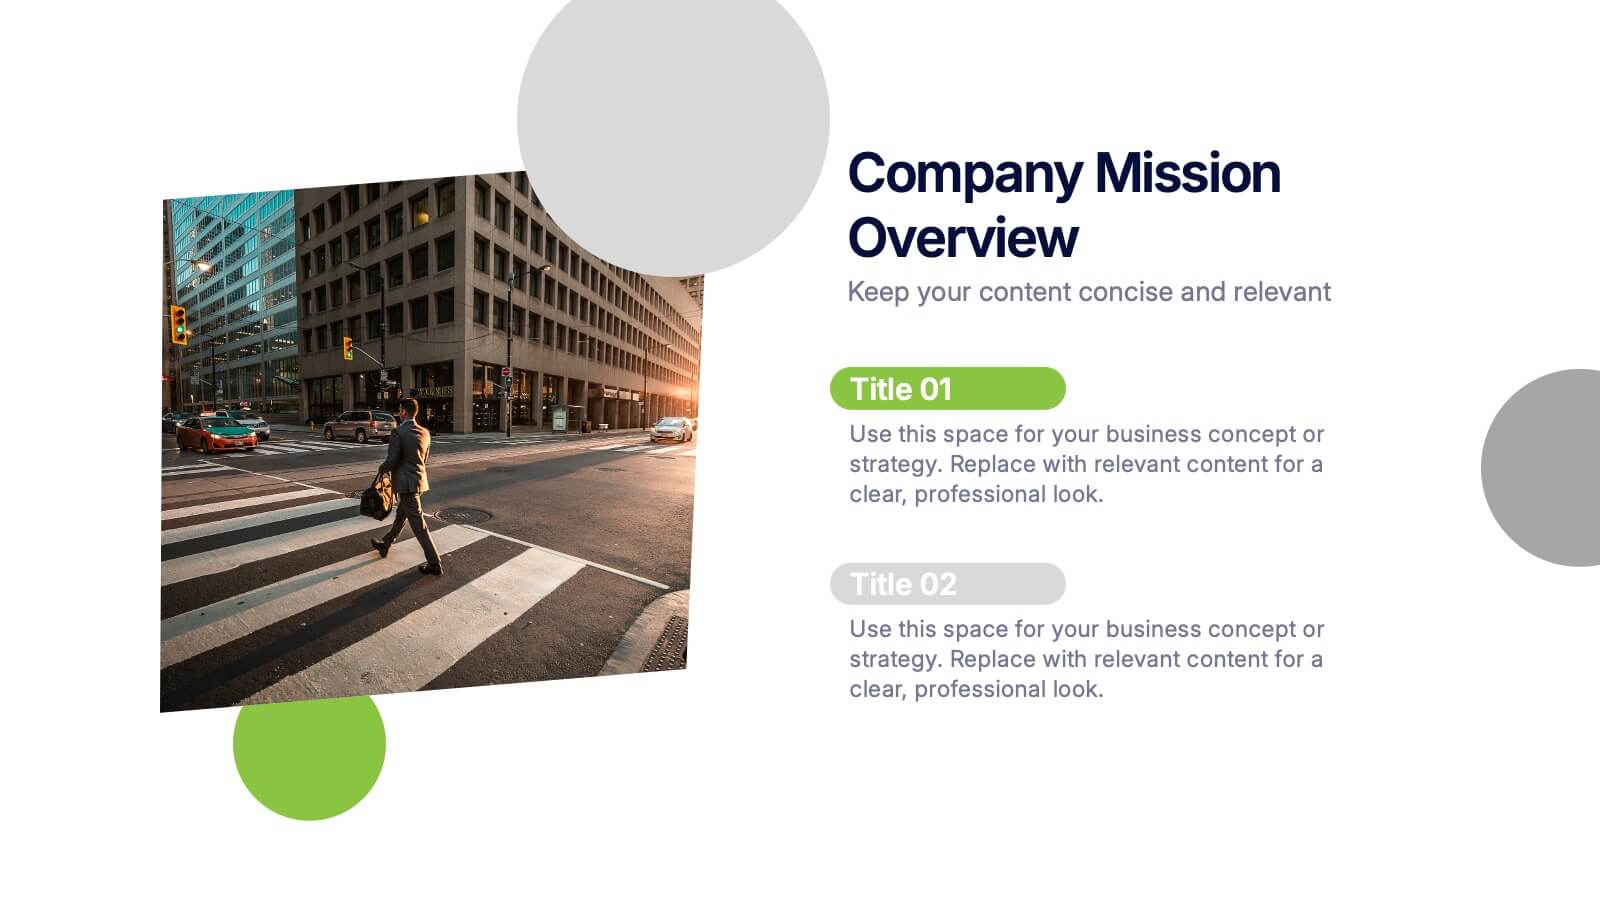
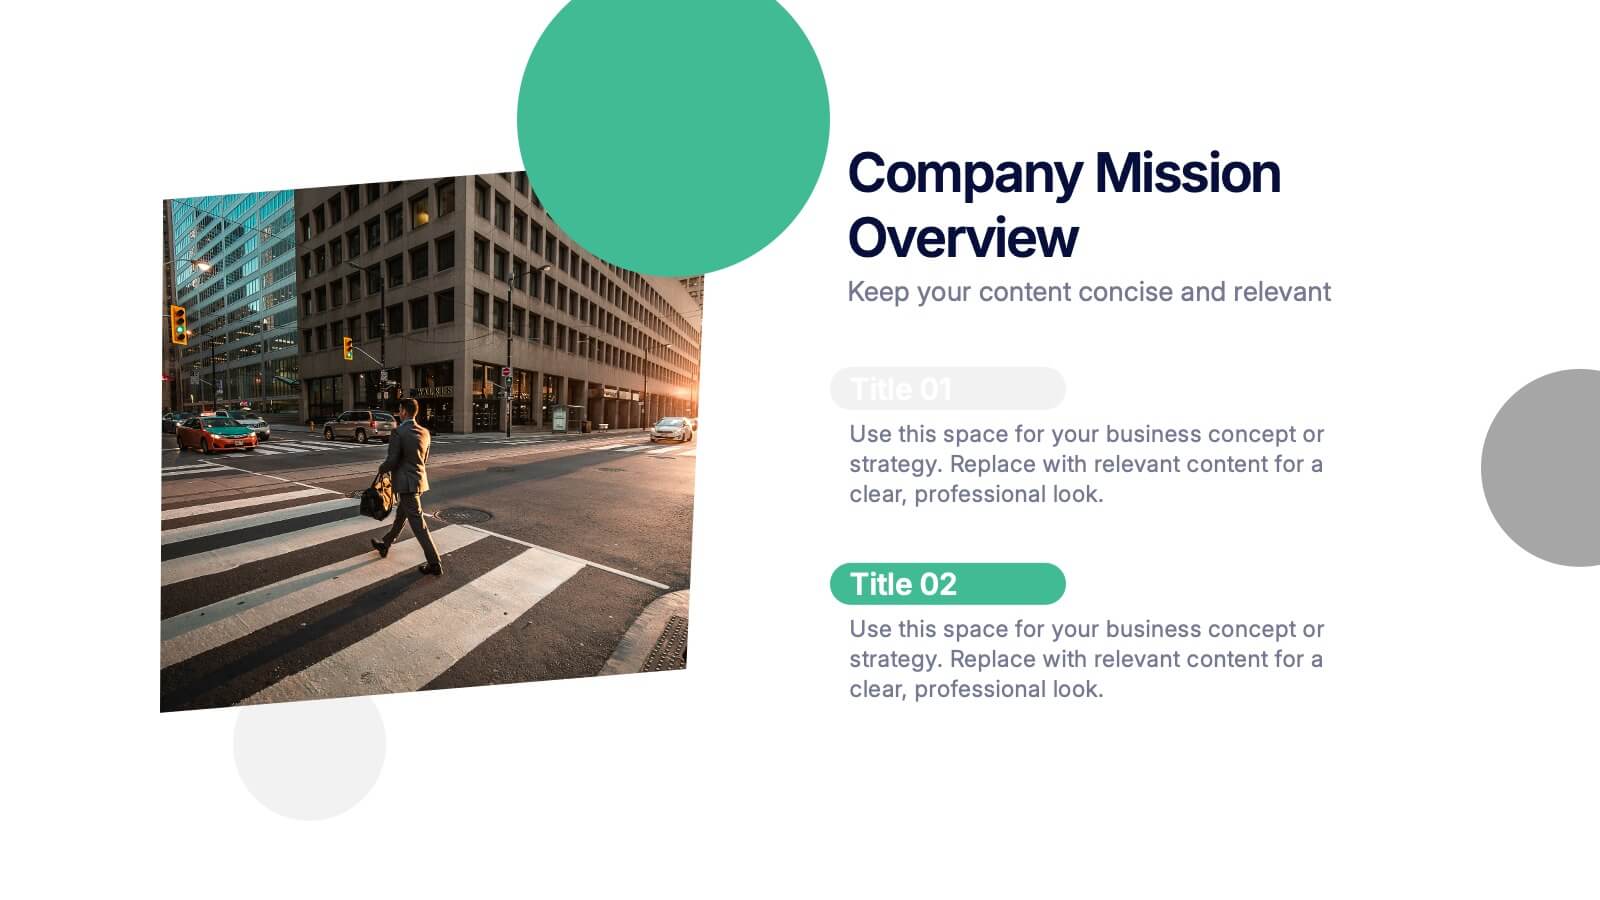
Bring your message to life with a bright, modern slide that highlights purpose, direction, and organizational goals in a clean, engaging layout. This presentation helps you communicate mission-driven insights with clarity and visual impact, making it ideal for internal teams or stakeholders. Fully compatible with PowerPoint, Keynote, and Google Slides.
- Remove from favorites
Powerpoint Template
1 MB
Google Slides Template
External link
Keynote Template
1 MB
7 slides
Remote Work Guidelines and Setup Presentation
Bring clarity to your remote work setup with this sleek visual guide—designed to communicate processes, tools, and best practices in one easy-to-follow layout. Whether you're onboarding a team or streamlining operations, this slide helps break it all down step by step. Fully compatible with PowerPoint, Keynote, and Google Slides.
- Remove from favorites
Powerpoint Template
1 MB
Google Slides Template
External link
Keynote Template
1 MB
8 slides
Medical Case Study Presentation
Elevate your medical presentations with our "Medical Case Study Presentation" template. This infographic is expertly designed to outline medical case studies or healthcare data, showcasing a central image flanked by related statistics and information. Each segment is linked to a visually distinct icon, representing different health metrics or case points, making it easier to digest complex medical information. This template is perfect for medical professionals, educators, and healthcare analysts, providing a structured way to present findings, research, or patient data effectively. Compatible with PowerPoint, Keynote, and Google Slides, it ensures your medical data is communicated clearly and professionally.
- Remove from favorites
Powerpoint Template
1 MB
Google Slides Template
External link
Keynote Template
1 MB
4 slides
Agricultural Market Trends Presentation
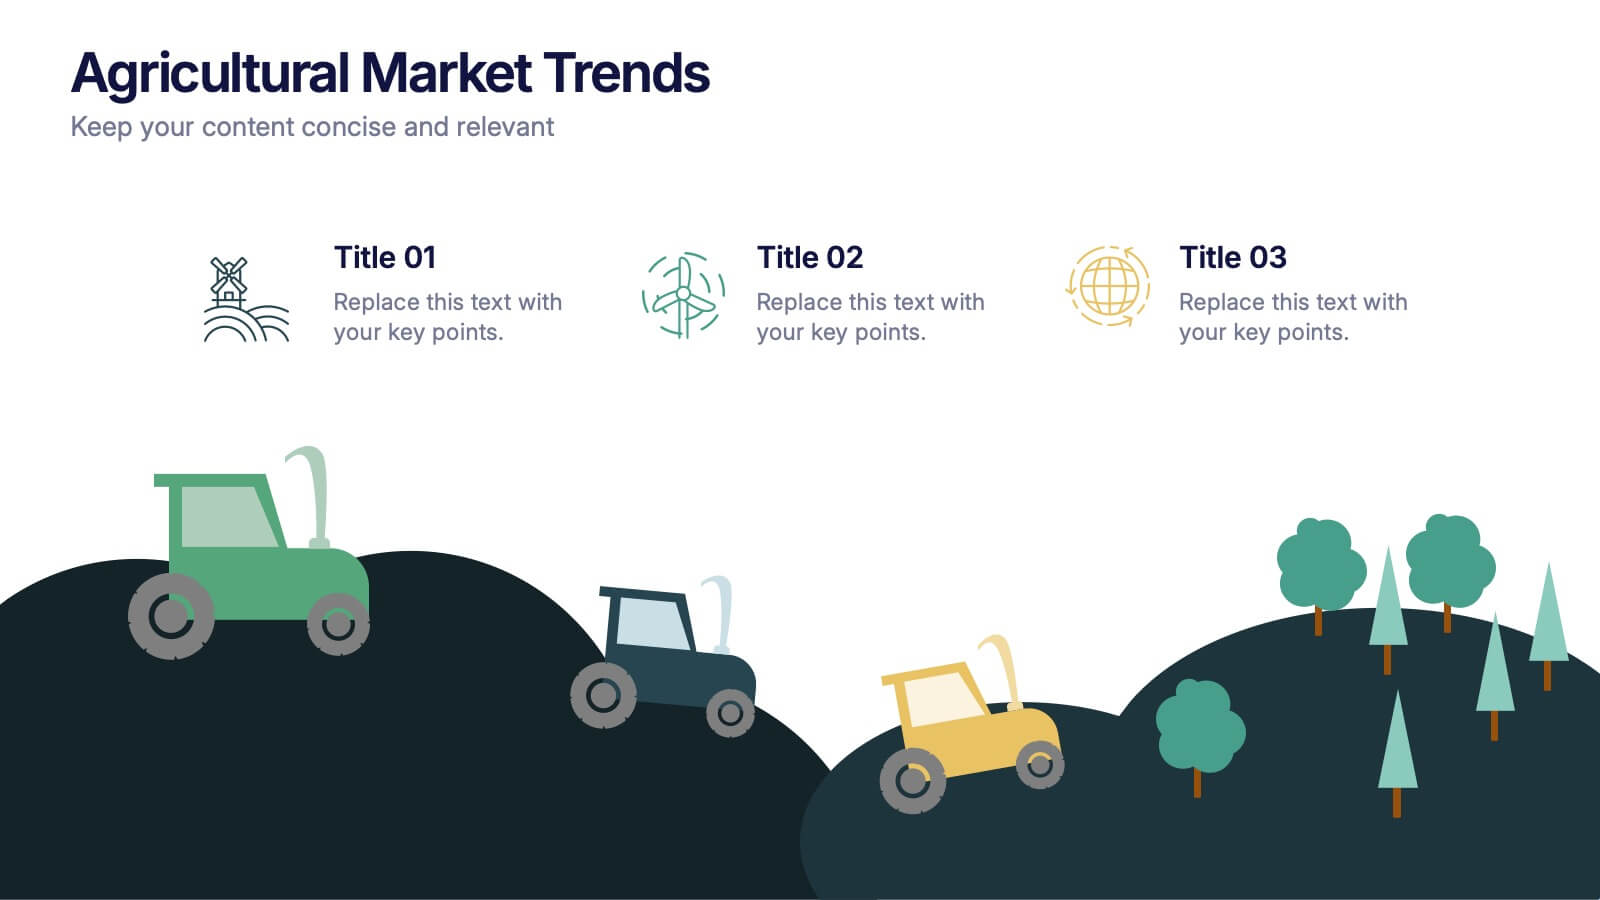
Highlight industry insights with this Agricultural Market Trends presentation template, featuring tractor and landscape graphics for a modern, rural-inspired look. Perfect for market reports, crop production analysis, or agribusiness proposals. Fully editable in Canva, PowerPoint, and Google Slides, allowing you to customize icons, text, and colors to match your brand.
- Remove from favorites
Powerpoint Template
1 MB
Google Slides Template
External link
Keynote Template
1 MB
4 slides
Interactive Data Dashboard Display Presentation
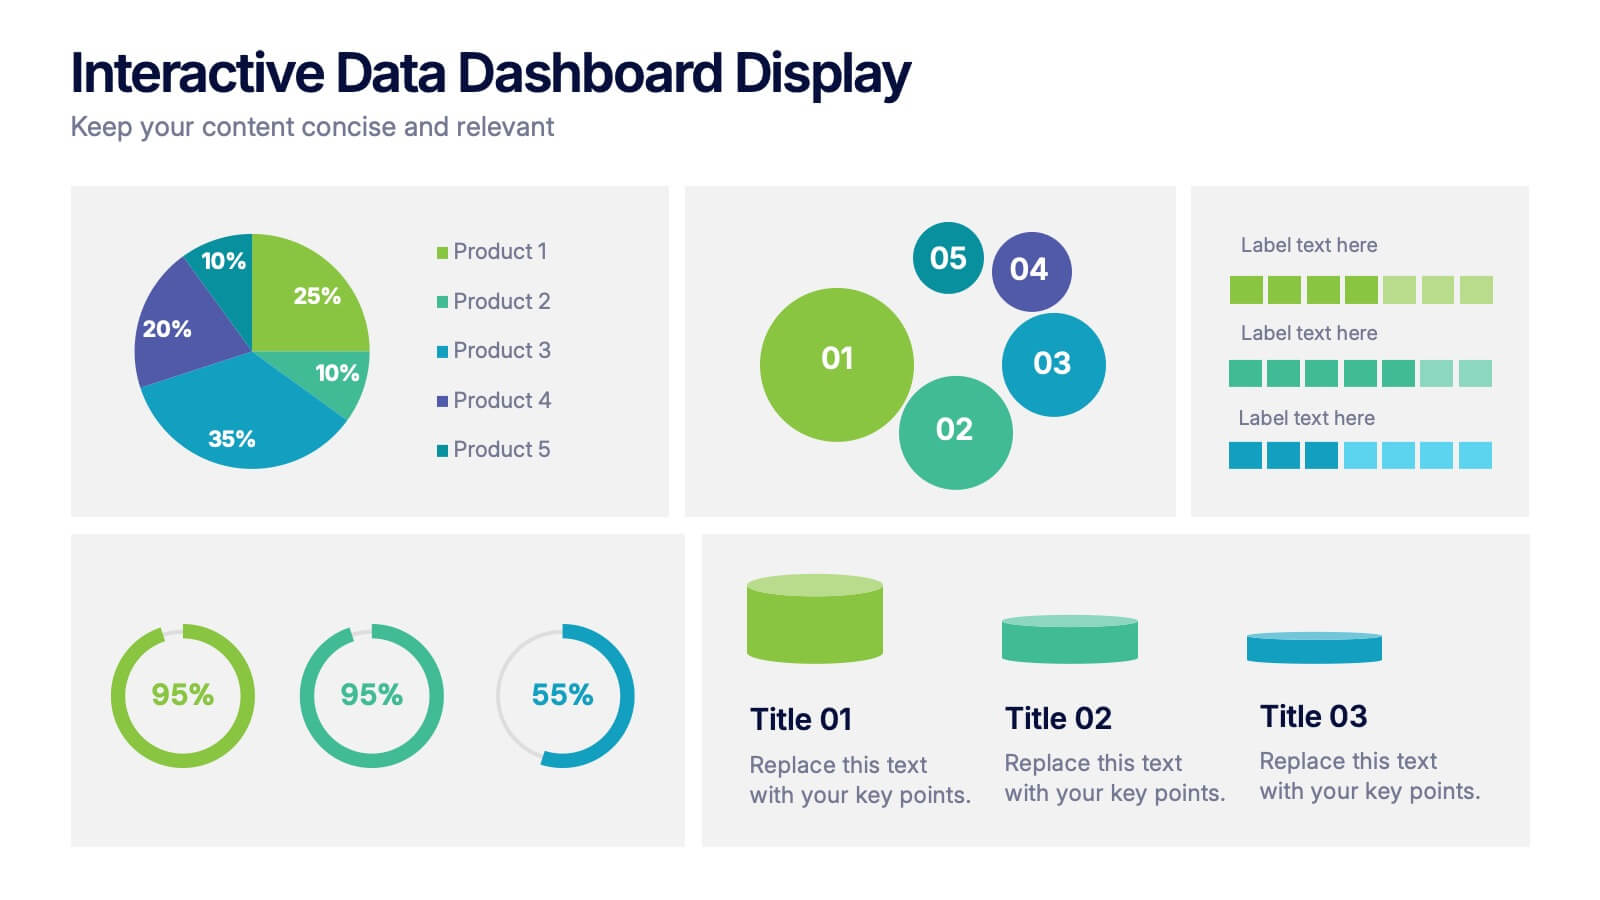
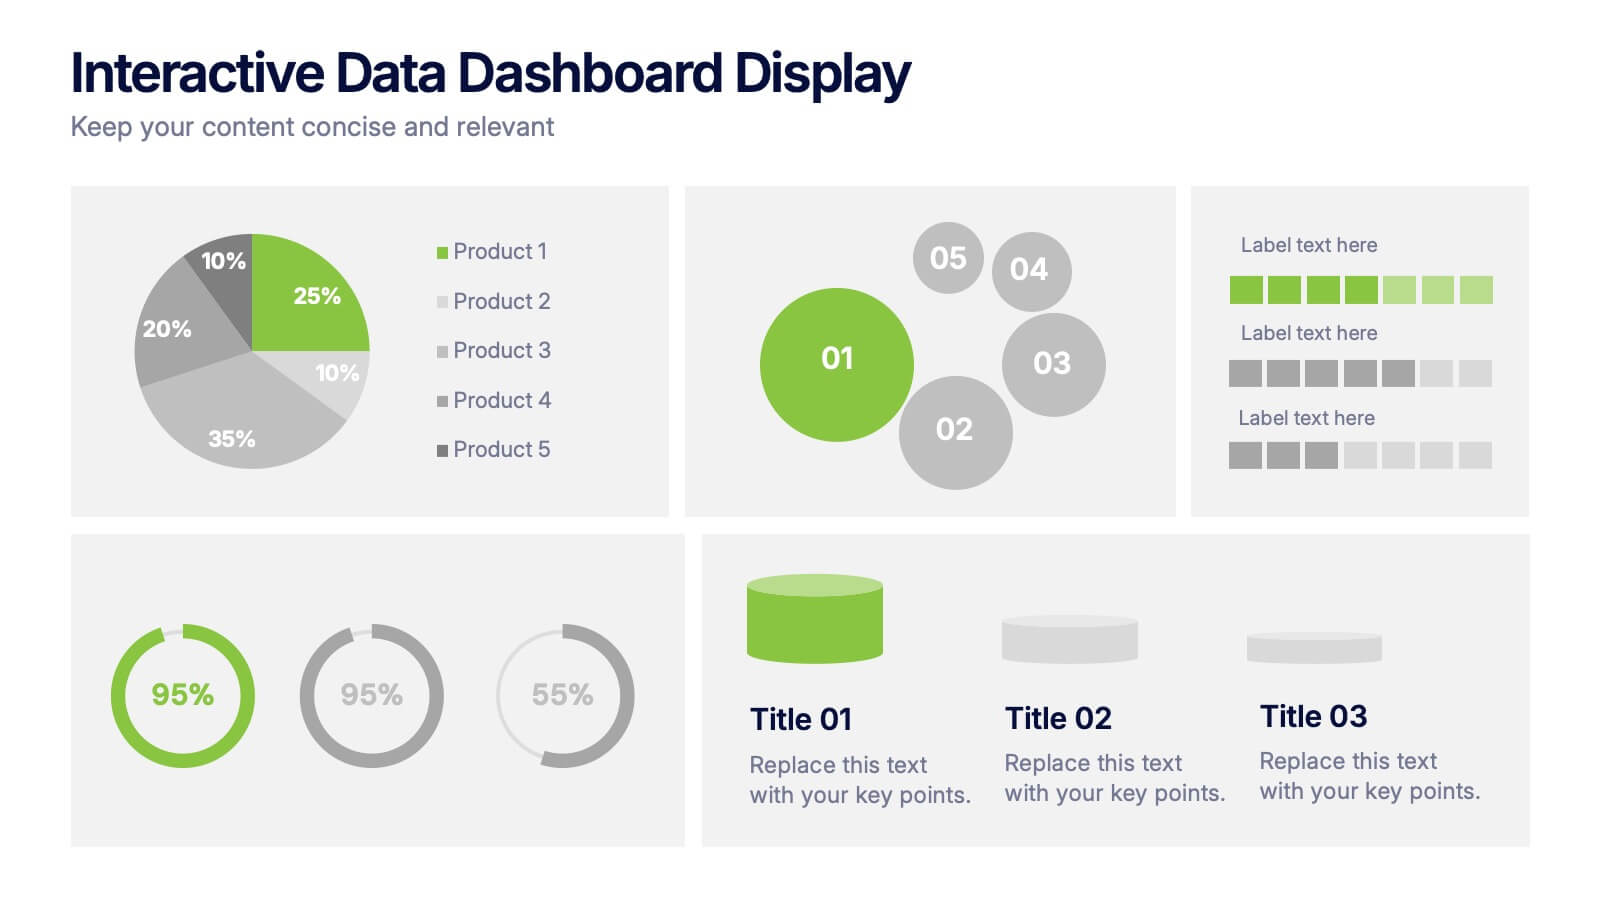
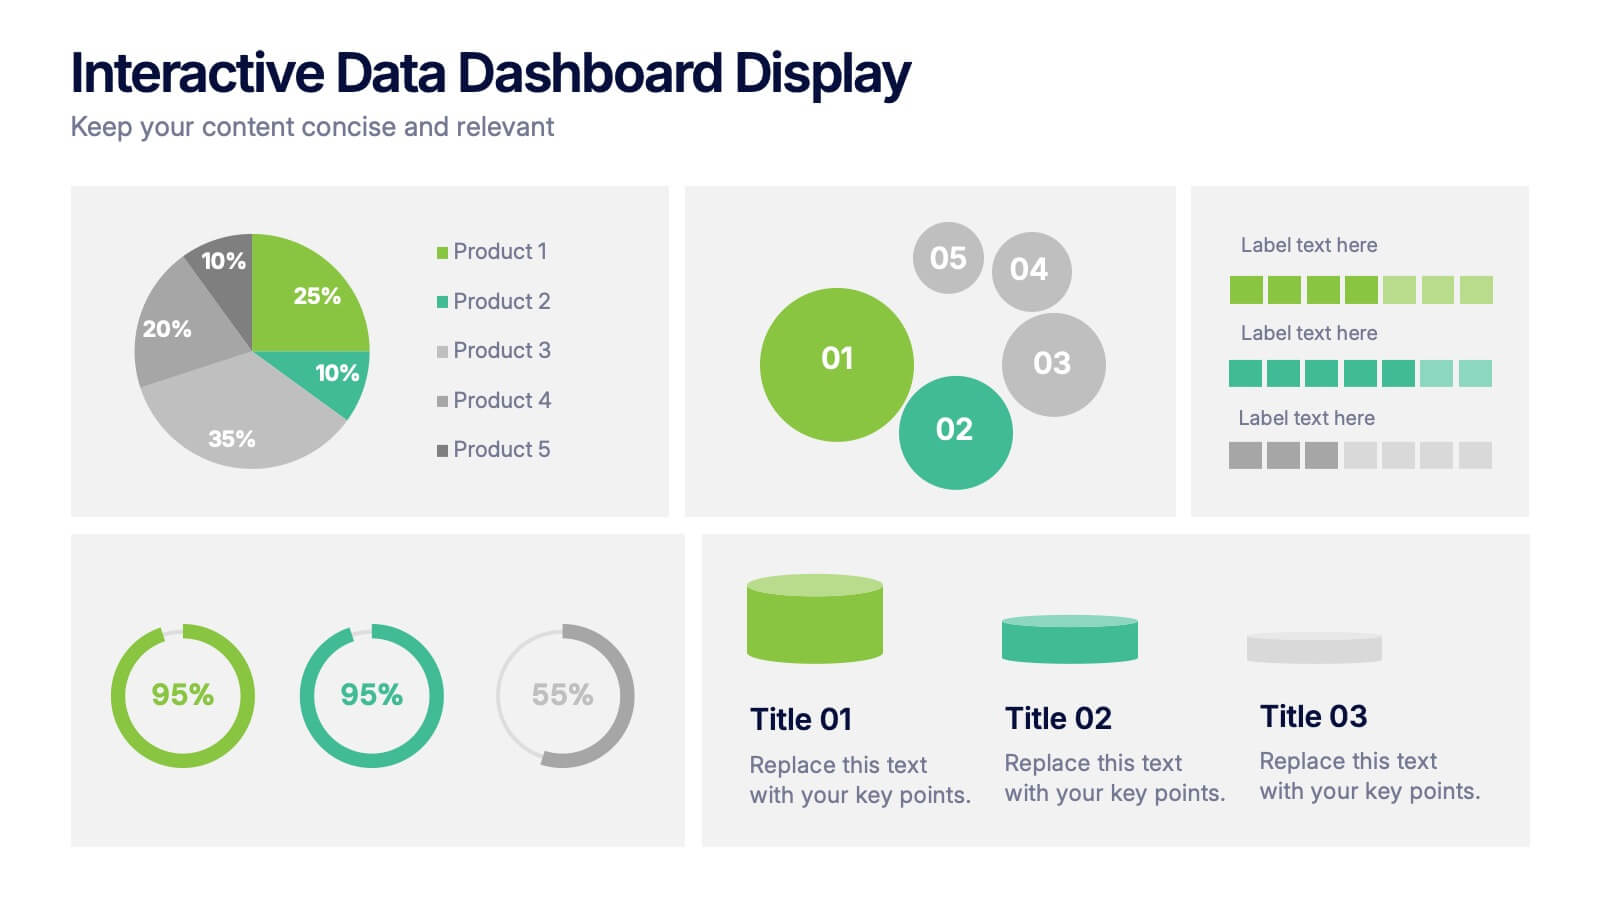
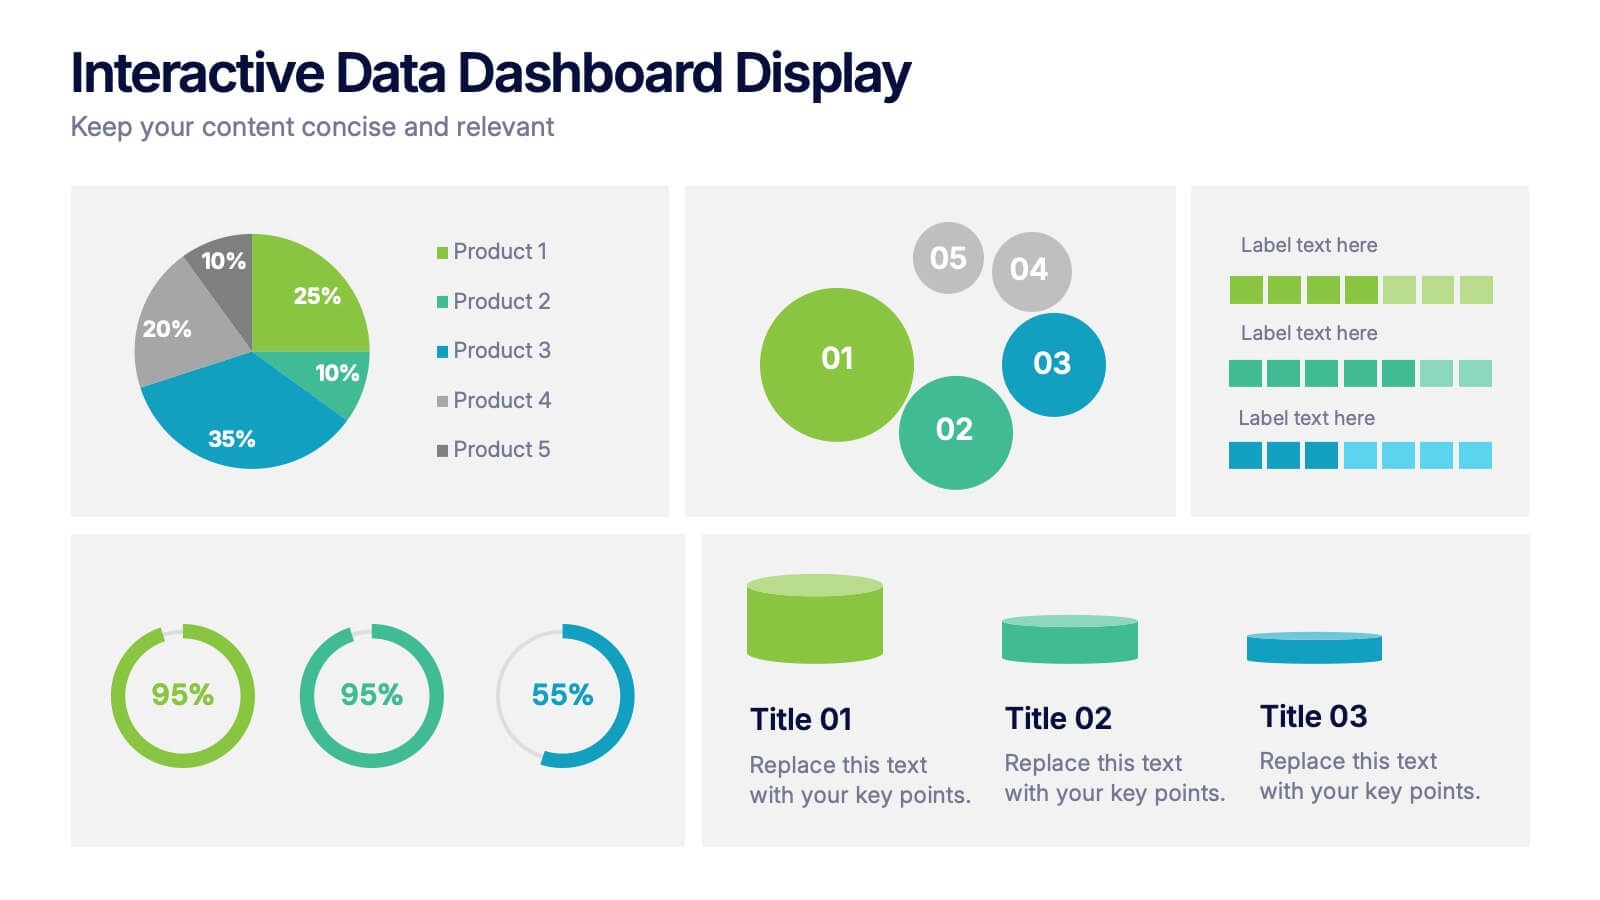
Present data with clarity using this Interactive Data Dashboard Display presentation. Designed to showcase multiple metrics at once, it includes pie charts, donut charts, bubble graphs, and bar comparisons. Ideal for business reports, marketing insights, or performance reviews. Fully editable in Canva, PowerPoint, and Google Slides for flexible customization.
- Remove from favorites
Powerpoint Template
2 MB
Google Slides Template
External link
Keynote Template
1 MB
7 slides
Mission Infographic
The showcased templates are meticulously designed to articulate the mission of an organization effectively, making them an invaluable tool for any corporate or non-profit entity aiming to communicate its core purpose and objectives. Each slide is crafted to guide the audience through the foundational elements that define the company’s ethos, goals, and strategic approaches. These templates feature a clean and professional layout, incorporating subtle design elements that draw attention without overwhelming the content. They utilize a harmonious blend of typography, iconography, and spacing, which helps in making the presentation not only visually appealing but also highly readable. The versatility of these templates allows them to be adapted for various contexts, whether it's part of an employee onboarding packet, investor presentations, or external company introductions. The color schemes and design motifs can be customized to align with specific brand guidelines, ensuring consistency across all corporate communications. By employing these slides, organizations can effectively communicate their mission, foster a cohesive understanding among stakeholders, and reinforce their commitment to their foundational values and objectives. This not only enhances internal morale but also strengthens the organization’s image externally, making these templates a strategic asset for any business.
- Remove from favorites
Powerpoint Template
3 MB
Google Slides Template
External link
Keynote Template
1 MB
6 slides
Mission Goals Infographic
These professionally designed slide templates are tailored to help you articulate your organization's mission goals with clarity and impact. Each slide is structured to emphasize the strategic objectives that guide your operations, making them ideal for communicating with stakeholders, teams, and external partners. Featuring a variety of layouts that include real-life imagery and concise text areas, these templates not only convey your goals but also illustrate the values that underpin your mission. They are perfect for enhancing corporate presentations, annual meetings, or internal strategy discussions, providing a visual and textual guide to what drives your organization forward. Customizable for various communication needs, these templates can be adapted to highlight specific mission goals or to align with different thematic elements of your presentations. They are an essential tool for organizations aiming to foster a unified understanding of their mission and to inspire alignment and action among all stakeholders.


