


Features
- 6 Unique slides
- Fully editable and easy to edit in Microsoft Powerpoint, Keynote and Google Slides
- 16:9 widescreen layout
- Clean and professional designs
- Export to JPG, PDF or send by email


Do you have any questions?
Recommend


7 slides
Human Resources Infographic Presentation Template
A human resources infographic is data related to the management of people in an organization. This template can be used to cover various HR-related topics, such as recruitment and selection, employee benefits, performance management, and career development. The purpose of our HR infographic is to communicate information in a clear and engaging way, making complex HR concepts and processes easier to understand. This well-designed infographic template can help you effectively communicate HR information, improve engagement and understanding, and support the overall success of your presentation.


26 slides
Digital Agency Pink Themed Company Profile
A fashion digital agency is a specialized agency that provides a range of digital marketing, advertising, and branding services tailored to the fashion industry. This template focuses on helping you leverage your digital platforms and technologies to enhance brand visibility, engage target audiences, drive sales, and create a strong online presence for your fashion brand. Fully customizable and compatible with Powerpoint, Keynote, and Google Slides. The elegant shades of pink reflect the fashion-forward and creative nature of your agency. Use this presentation template to showcase your best work, fashion trends, and styles.


6 slides
Demographic Data Analysis Presentation
The "Demographic Data Analysis" presentation effectively visualizes demographic splits using a simple yet engaging pie chart. The template features a clean layout with distinct sections labeled for different demographic metrics, represented by the percentage splits of 35% and 65%. Each section includes placeholder text for inserting detailed insights, making it an excellent tool for presentations that need to communicate demographic data clearly and attractively. The design is versatile and can be adapted for various analysis needs in business or research contexts.


4 slides
Project Milestone Path Roadmap Presentation
Bring your project plan to life with a clean, colorful layout that makes every milestone easy to follow across each quarter. This presentation helps you organize tasks, timelines, and progress in a clear visual path that supports smarter planning and team alignment. Fully compatible with PowerPoint, Keynote, and Google Slides.


5 slides
Marketing Wheel Strategy Presentation
Enhance your marketing presentations with our "Marketing Wheel Strategy Presentation" template. This infographic is designed to visually represent the interconnected components of a marketing strategy, organized in a wheel format for clarity. Each segment, color-coded for distinction, covers different aspects such as planning, execution, analysis, and optimization, demonstrating their interdependence. This layout is perfect for illustrating how each part contributes to the overall effectiveness of a marketing plan. Ideal for marketing professionals and strategists, it facilitates detailed strategy discussions and comprehensive planning sessions. Fully compatible with PowerPoint, Keynote, and Google Slides, this template is essential for delivering clear and effective marketing presentations.


6 slides
OKR Goal-Setting Framework
Clarify your goals and drive performance with this OKR-based layout that maps Objectives, Key Activities, and Results in a clear, actionable format. Ideal for teams, managers, and performance reviews. Each section is fully editable to match your organizational strategy. Compatible with PowerPoint, Keynote, and Google Slides.


6 slides
Financial Summary Infographic
The series presented showcases various slide templates tailored for enhancing sales team strategies and communication. Each slide is crafted to assist sales professionals in detailing team structures, sales goals, performance metrics, and strategic initiatives effectively. Utilizing vibrant color blocks and streamlined design elements, these templates make complex sales data approachable and engaging, facilitating clear and impactful presentations. The collection is designed with adaptability in mind, incorporating elements that can be easily customized to fit different team needs and company branding. These include comparative layouts for benchmarking, timeline formats for showcasing sales cycles, and diagrammatic representations for visualizing sales processes and results. Perfect for internal meetings, sales training sessions, and stakeholder presentations, these templates serve as essential tools for sales leaders to convey their team’s progress, celebrate wins, and strategize for future sales endeavors.


5 slides
Real-Life Case Study Analysis Presentation
Turn data and insights into compelling stories that capture real business impact. This clean, professional layout is perfect for analyzing real-world examples, comparing strategies, and presenting key takeaways. Easy to customize and visually balanced, it’s fully compatible with PowerPoint, Keynote, and Google Slides for seamless use across platforms.


20 slides
Pulsebeat Sales Proposal Presentation
Seal the deal with this compelling sales proposal template, crafted to showcase your offerings, customer value, and competitive edge with clarity. Including slides for sales objectives, process, pricing strategy, and performance metrics, it’s perfect for sales teams aiming to impress. Compatible with PowerPoint, Keynote, and Google Slides for effortless presentation.


6 slides
5G Network Infographic
5G, short for fifth-generation wireless technology, is the latest generation of mobile network technology designed to provide faster, more reliable, and higher capacity wireless communication. This infographic template is designed to educate viewers about the key features, benefits, and impact of 5G technology on various aspects of our lives. This template aims to provide a comprehensive and easy-to-understand overview of the transformative capabilities of 5G technology. It serves as a valuable resource for individuals, businesses, and organizations seeking to understand the potential impact and benefits of 5G on various aspects of our lives and the broader technological landscape.


8 slides
Blue Ocean Strategy Business Model Presentation
Chart unexplored market territories with our Blue Ocean Strategy Business Model template! This dynamic presentation tool, designed to simplify complex business strategies, illustrates the pivotal elements of cost reduction and value innovation to unlock new buyer value. Compatible with PowerPoint, Keynote, and Google Slides, it's ideal for strategists aiming to create uncontested market spaces and make competition irrelevant. Perfect for workshops, business meetings, or strategy sessions.


7 slides
Real Estate Infographic Presentation Template
Real estate is a form of property that can be used for residential, commercial or industrial purposes, and typically includes any resources on the land such as water or minerals. This template is especially useful for real estate agents and brokers who can use it to better understand the real estate industry. This template comes with Infographics that are a great way to explain complex ideas and trends in a simple, easy-to-understand way, and can help your clients better understand as well. This template displays data visually, which will allow your audience to grasp complex ideas quickly.


7 slides
IT Enterprise Architecture Infographic
IT Architecture, is a structured framework used to conceptualize software, hardware, network infrastructure, and related technology components and their relationships within an organization. This infographic template serves as a visual compass navigating the intricate realm of Information Technology architecture. Compatible with Powerpoint, Keynote, and Google Slides. Let the elegant design and comprehensive content guide you through the foundational pillars of digital excellence. Present an architectural framework illustration, outlining the fundamental structure that supports an organization's digital journey.


8 slides
Success Strategy Triangle Presentation
Craft a winning strategy with the Success Strategy Triangle template. This structured design helps visualize key business components in a step-by-step format, making it ideal for growth planning, decision-making, and performance analysis. Fully customizable and easy to use, it’s compatible with PowerPoint, Keynote, and Google Slides for seamless integration.


20 slides
Mythion Business Idea Pitch Deck Presentation
Communicate your business vision with clarity and impact using this comprehensive pitch deck presentation template. Perfect for entrepreneurs, startups, and innovators, this template is designed to help you effectively present your idea to investors, stakeholders, or partners. Cover every essential aspect of your business journey with slides dedicated to the problem statement, solutions, market overview, and target audience. Showcase your business model, revenue projections, and unique selling proposition with visually appealing layouts. Highlight your marketing strategy, growth projections, and funding requirements to build a strong, persuasive case. Fully customizable and compatible with PowerPoint, Google Slides, and Keynote, this template allows you to tailor each slide to suit your business identity and goals. Whether you're pitching a new idea or seeking investment, this template ensures you present with professionalism and confidence.


21 slides
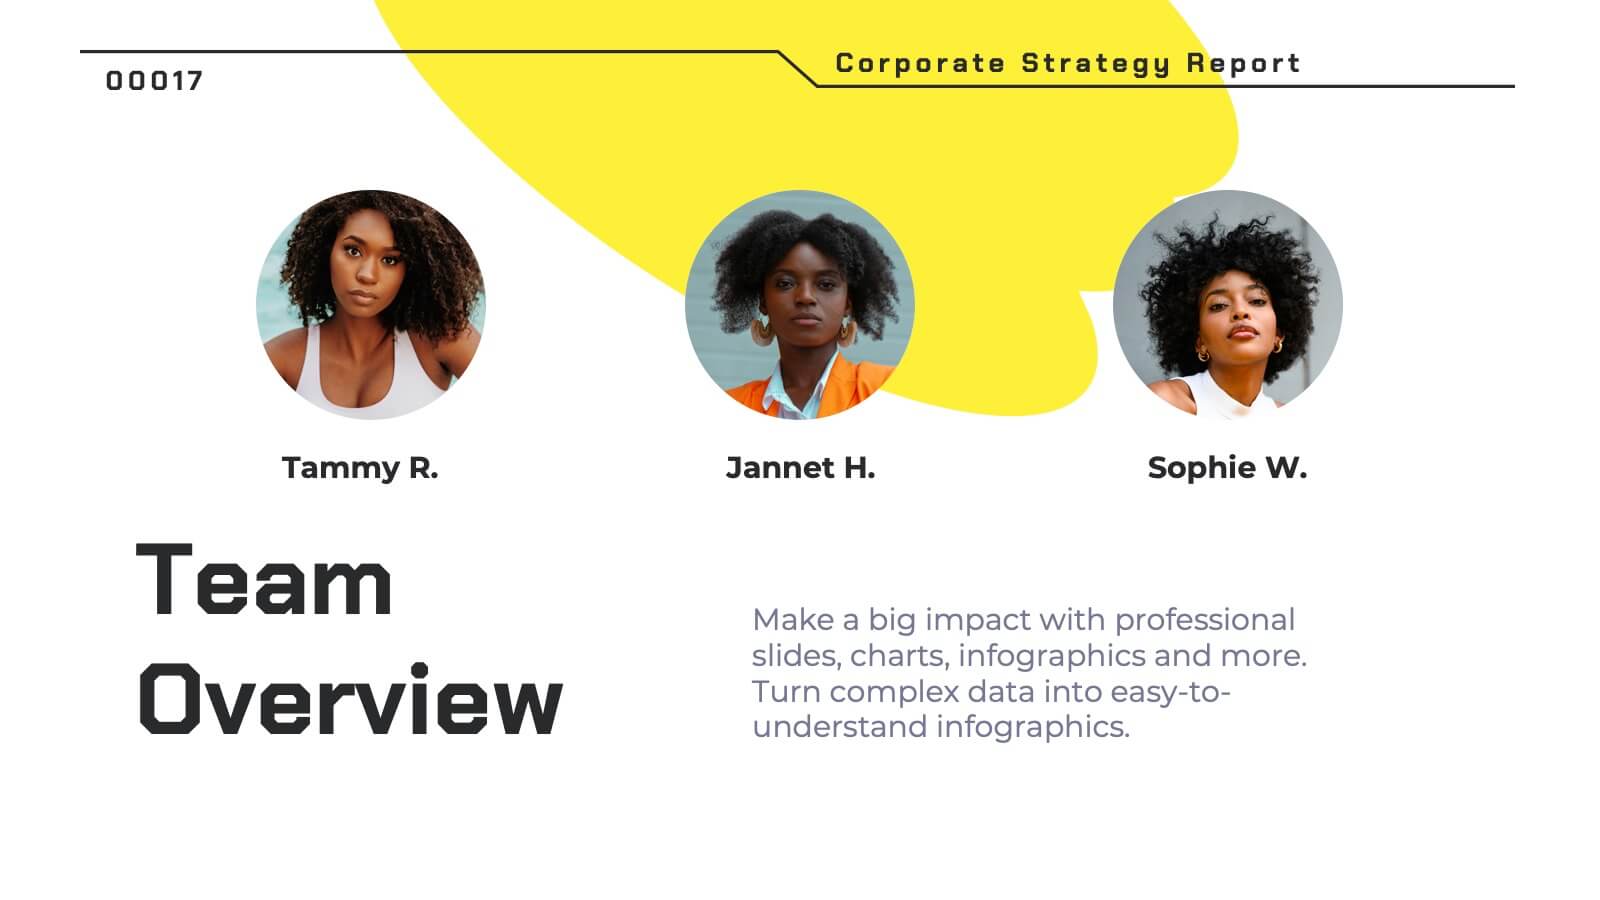
Pyronova Corporate Strategy Report Presentation
This professional corporate strategy template includes slides for market opportunity, SWOT analysis, objectives, marketing plan, revenue model, and competitive analysis. Designed for impactful presentations, it highlights financial performance, investment opportunities, and operational plans. Fully customizable in PowerPoint, Keynote, and Google Slides to suit diverse business needs.


5 slides
User-Centered Design with Empathy Map Presentation
Improve User Insights with the Empathy Map for User-Centered Design! This User-Centered Design with Empathy Map template provides a structured approach to understanding user behaviors, motivations, and needs. Designed with clear quadrant sections, this template helps teams map out key insights for UX research, customer journey mapping, and product development. Ideal for designers, marketers, and strategists, this fully editable slide deck works seamlessly with PowerPoint, Keynote, and Google Slides for a hassle-free customization experience.