


Features
- 24 Unique slides
- Fully editable and easy to edit in Microsoft Powerpoint, Keynote and Google Slides
- 16:9 widescreen layout
- Clean and professional designs
- Export to JPG, PDF or send by email


Do you have any questions?
Recommend


5 slides
Layered Circular Model for Strategy Presentation
Communicate complex strategies with ease using the Layered Circular Model for Strategy Presentation. This 3D-style infographic breaks down your framework into five distinct levels, making it ideal for visualizing hierarchies, stages, or priorities. Each layer is fully editable and labeled for customization. Works with PowerPoint, Google Slides, and Canva.


6 slides
Educational A-Z Letter Chart Presentation
Clear, structured, and easy to navigate, this Educational A-Z Letter Chart presentation visually organizes key topics using letter-coded icons and titles. Ideal for learning journeys, curriculum overviews, or training modules. Fully editable in Canva, making it simple to adapt for any subject or audience. Clean and professional layout.


7 slides
Competitive Analysis Using Strategy Wheel
Highlight your competitive edge with this dynamic strategy wheel diagram. Designed to visually compare up to six business components, this slide is ideal for showcasing strengths, weaknesses, or market positioning. Perfect for strategic planning sessions, it’s fully editable in PowerPoint, Keynote, and Google Slides.


6 slides
Emerging Tech Trends and Tools Presentation
Stay ahead of the curve with this Emerging Tech Trends and Tools Presentation. Featuring a sleek computer-based layout with six data points, this template is ideal for showcasing innovations, tools, or future-focused strategies. Easily customizable in Canva, PowerPoint, and Google Slides for a professional and modern tech presentation.


4 slides
Environmental Sustainability Presentation
Showcase sustainable strategies with this triangle-style infographic focused on Environmental Sustainability. Perfect for illustrating the relationship between ecological, economic, and social pillars. The arrow-based design emphasizes continuity and impact. Fully customizable and ideal for PowerPoint, Keynote, and Google Slides presentations.


4 slides
Business Growth Strategy Presentation
Visualize strategic priorities with this Business Growth Strategy Presentation. Designed as a 2x2 matrix, this slide showcases market and product positioning across four quadrants: present vs. future and market fit vs. innovation. Each section is color-coded and icon-supported, making it easy to highlight initiatives and growth paths. Fully editable in PowerPoint, Keynote, and Google Slides.


4 slides
Pillar Strategy Framework Presentation
Turn complex strategies into clear, structured visuals with this elegant infographic design. Ideal for showcasing key principles, organizational foundations, or business frameworks, it helps communicate ideas with precision and balance. Fully customizable and compatible with PowerPoint, Keynote, and Google Slides for effortless editing and professional results.


5 slides
Rival Strategy Review Presentation
Bring competitive insights to life with a modern, circular layout that highlights rival strategies, key strengths, and market positioning. Perfect for analyzing competitors and identifying growth opportunities, this presentation combines clarity with style. Fully compatible with PowerPoint, Keynote, and Google Slides for effortless customization and professional delivery.


7 slides
Scope Management and Planning Presentation
Ensure clear project scope definition with the Scope Management and Planning Presentation. This structured template highlights key elements of project scope, responsibilities, and deliverables using an intuitive layout. Ideal for project managers, business analysts, and teams aligning project goals. Fully editable and compatible with PowerPoint, Keynote, and Google Slides.


12 slides
Real Estate Business Proposal Presentation
Present your Real Estate Business Proposal with this structured and visually compelling template. Designed for real estate professionals, investors, and agencies, this slide helps communicate investment strategies, market opportunities, and property insights effectively. Fully customizable and compatible with PowerPoint, Keynote, and Google Slides for seamless editing.


21 slides
Riverlyn Artist Portfolio Template Presentation
Showcase your creative journey with this dynamic portfolio template, crafted for artists and creators seeking to captivate their audience. Highlight your philosophy, style, and key projects with a visually engaging design that reflects your artistic identity. Share your creative process and collaborations to provide deeper insights into your work. This template includes sections for client testimonials, services offered, and pricing details, making it an excellent choice for both professional presentations and personal branding. Fully customizable and compatible with PowerPoint, Google Slides, and Keynote, it offers seamless adaptability to meet your unique needs. Ideal for artists aiming to leave a lasting impression!


21 slides
Synergywave Financial Report Presentation
Deliver your financial insights with clarity using this comprehensive report presentation! It covers key sections like performance metrics, sales updates, market trends, and strategic initiatives, ensuring all critical data is well-organized. Whether for stakeholders or internal reviews, this template ensures seamless communication. Fully compatible with PowerPoint, Keynote, and Google Slides.


22 slides
Bona Advertising Agency Proposal Presentation
Present your agency’s vision with confidence using this sleek advertising proposal template. It covers everything from market analysis and strategy development to campaign execution and client testimonials. Ideal for securing new partnerships, it’s compatible with PowerPoint, Keynote, and Google Slides for a polished, professional presentation.


6 slides
Strategic Solution Framework Presentation
Build your ideas step by step with this dynamic layout that turns strategies into a clear visual journey. Perfect for illustrating processes, growth plans, or solution pathways, it helps simplify complex frameworks into engaging visuals. Fully editable and compatible with PowerPoint, Keynote, and Google Slides for seamless customization.


21 slides
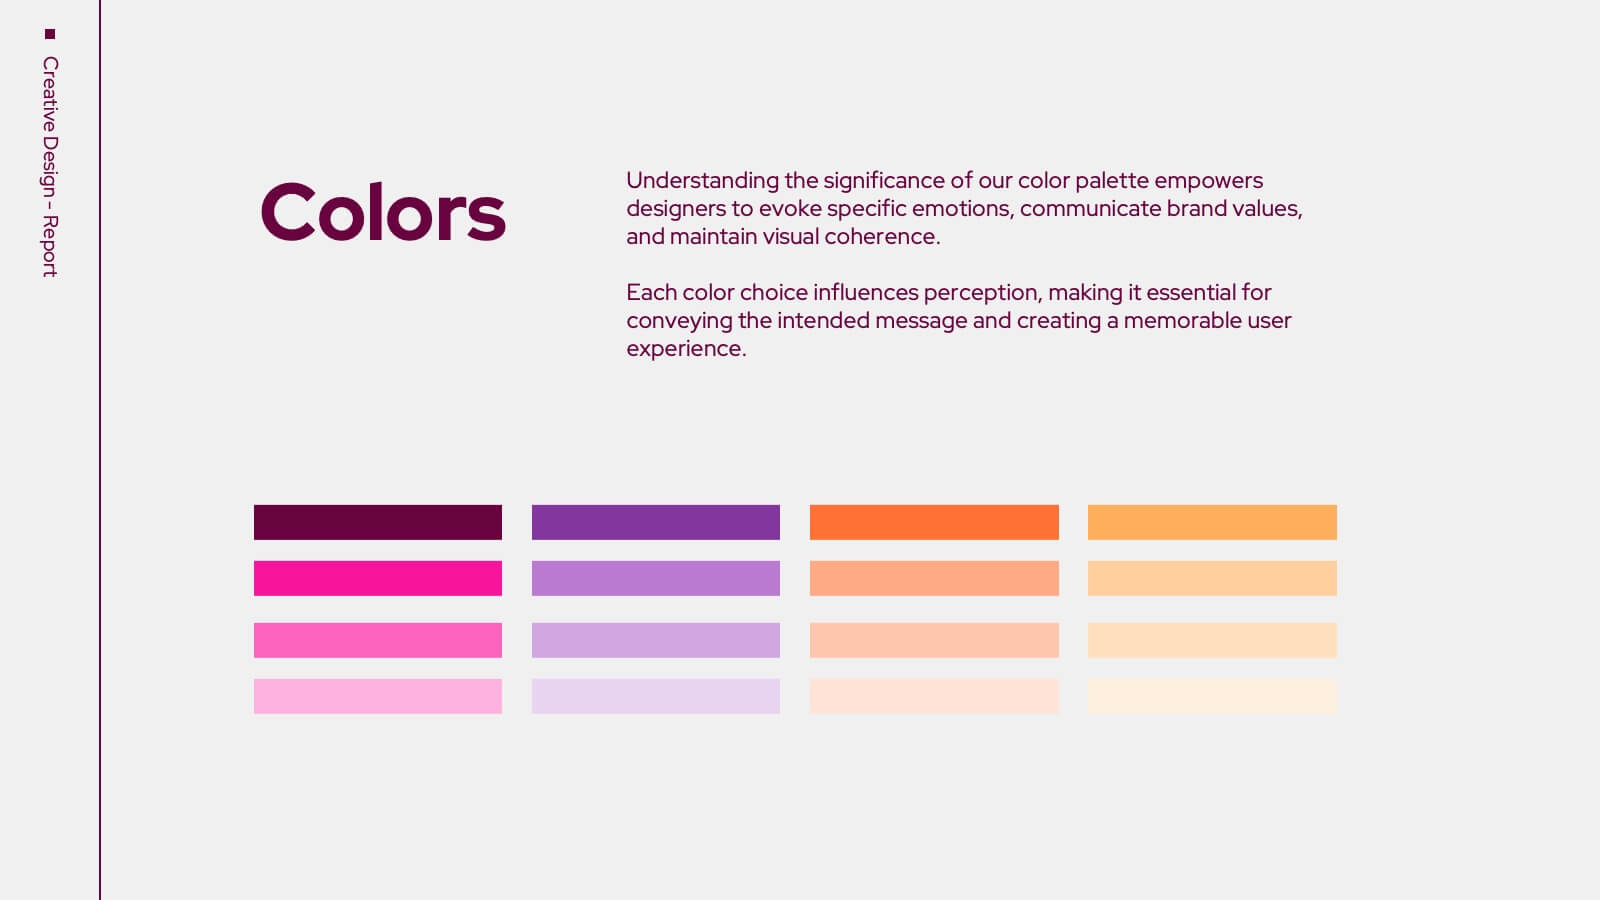
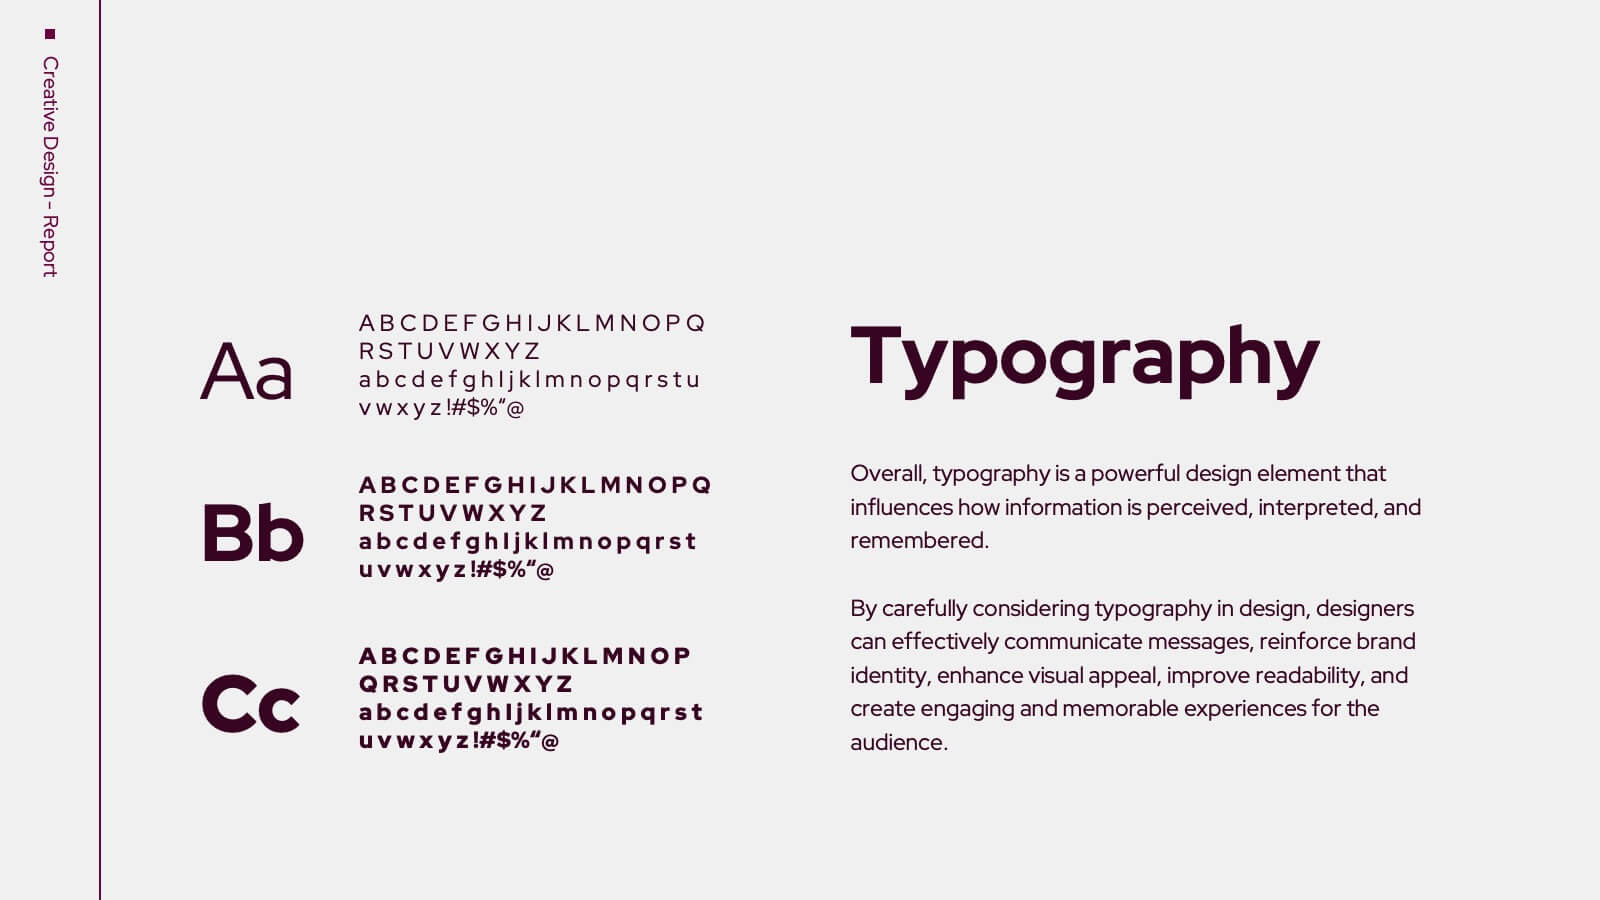
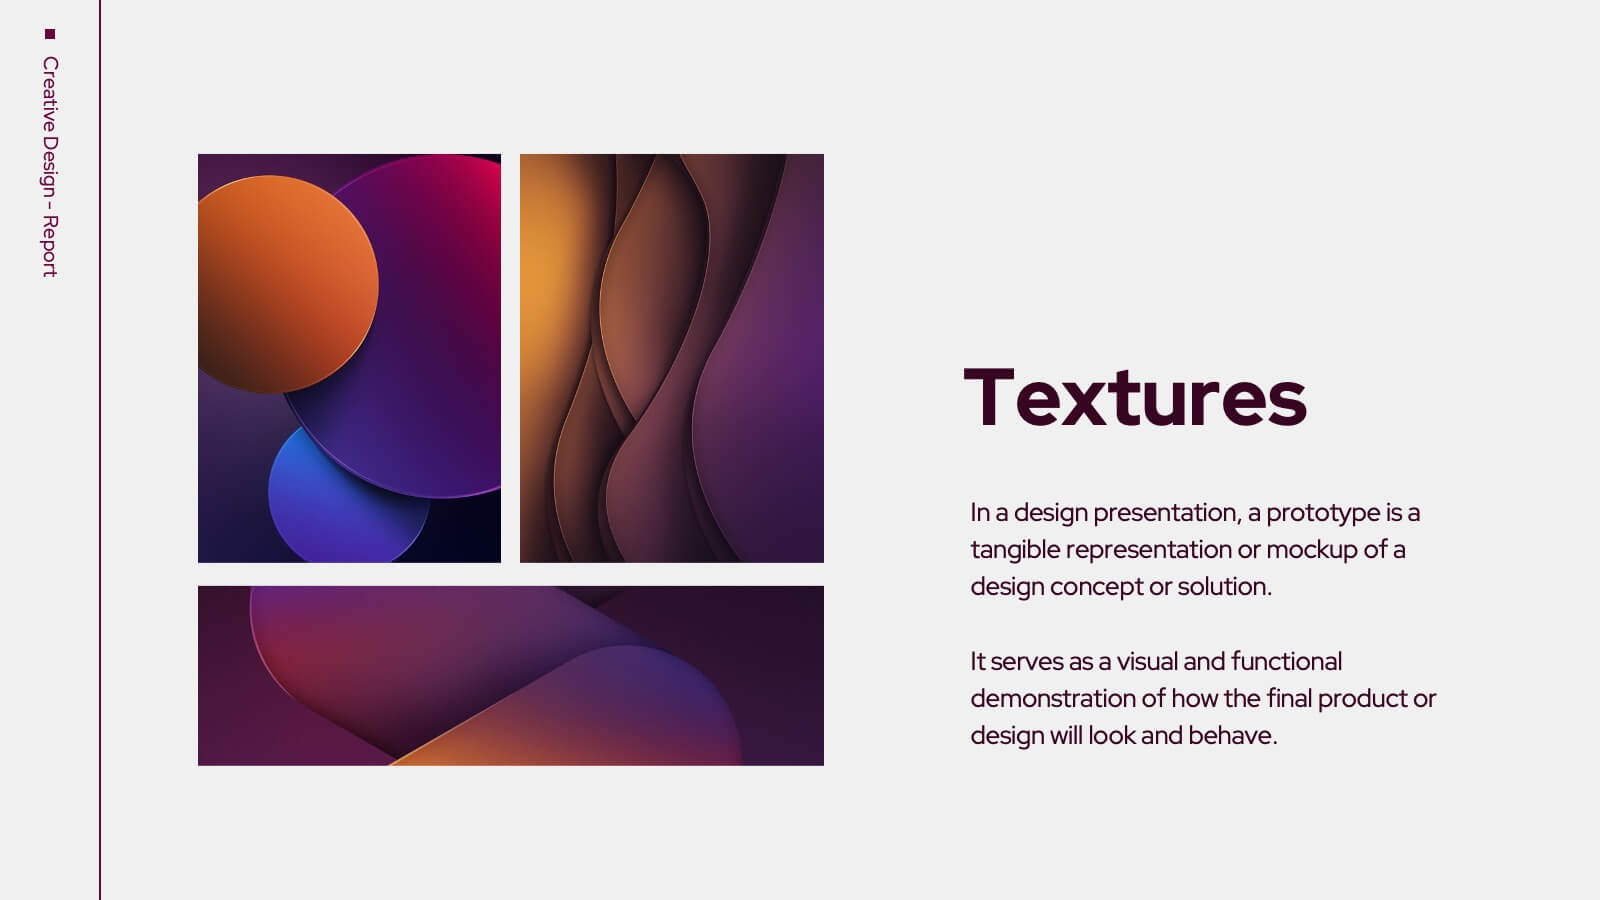
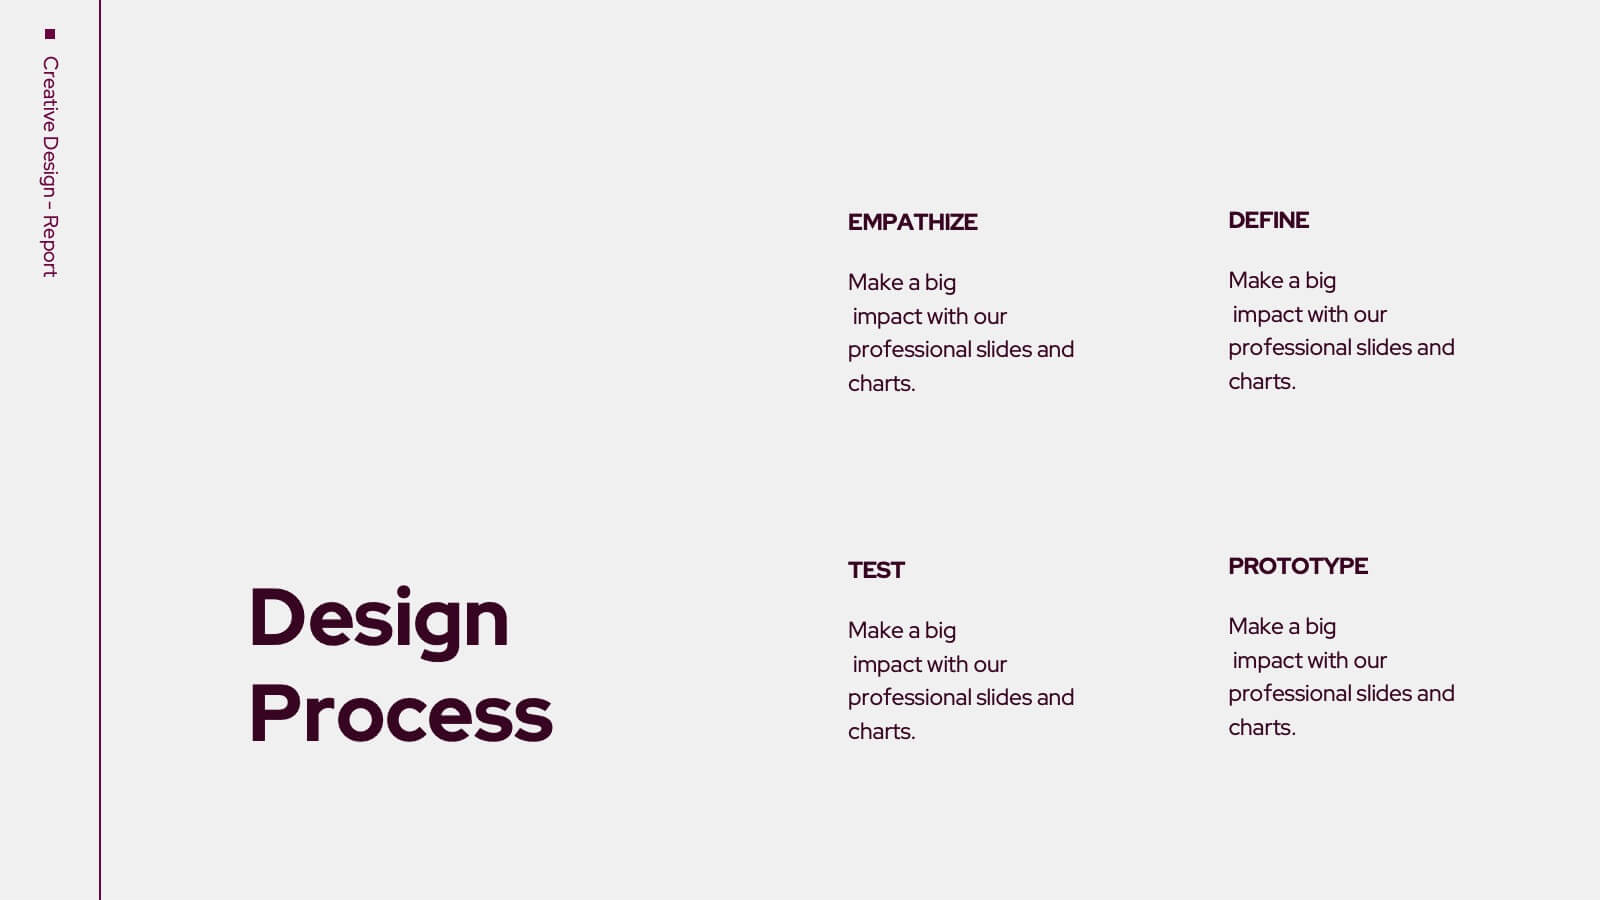
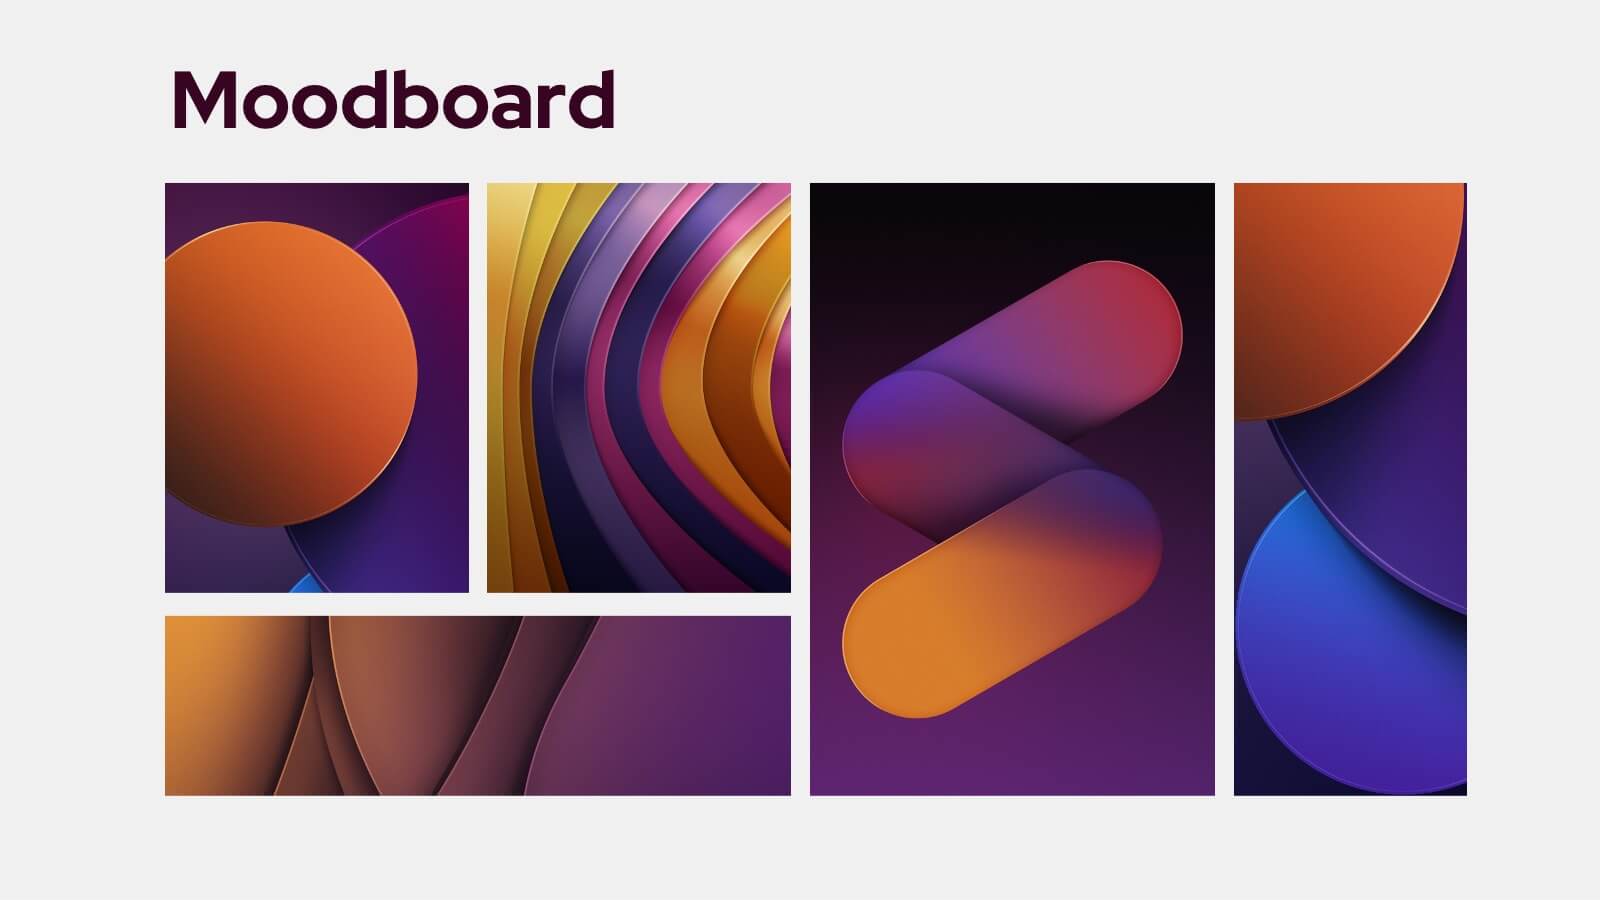
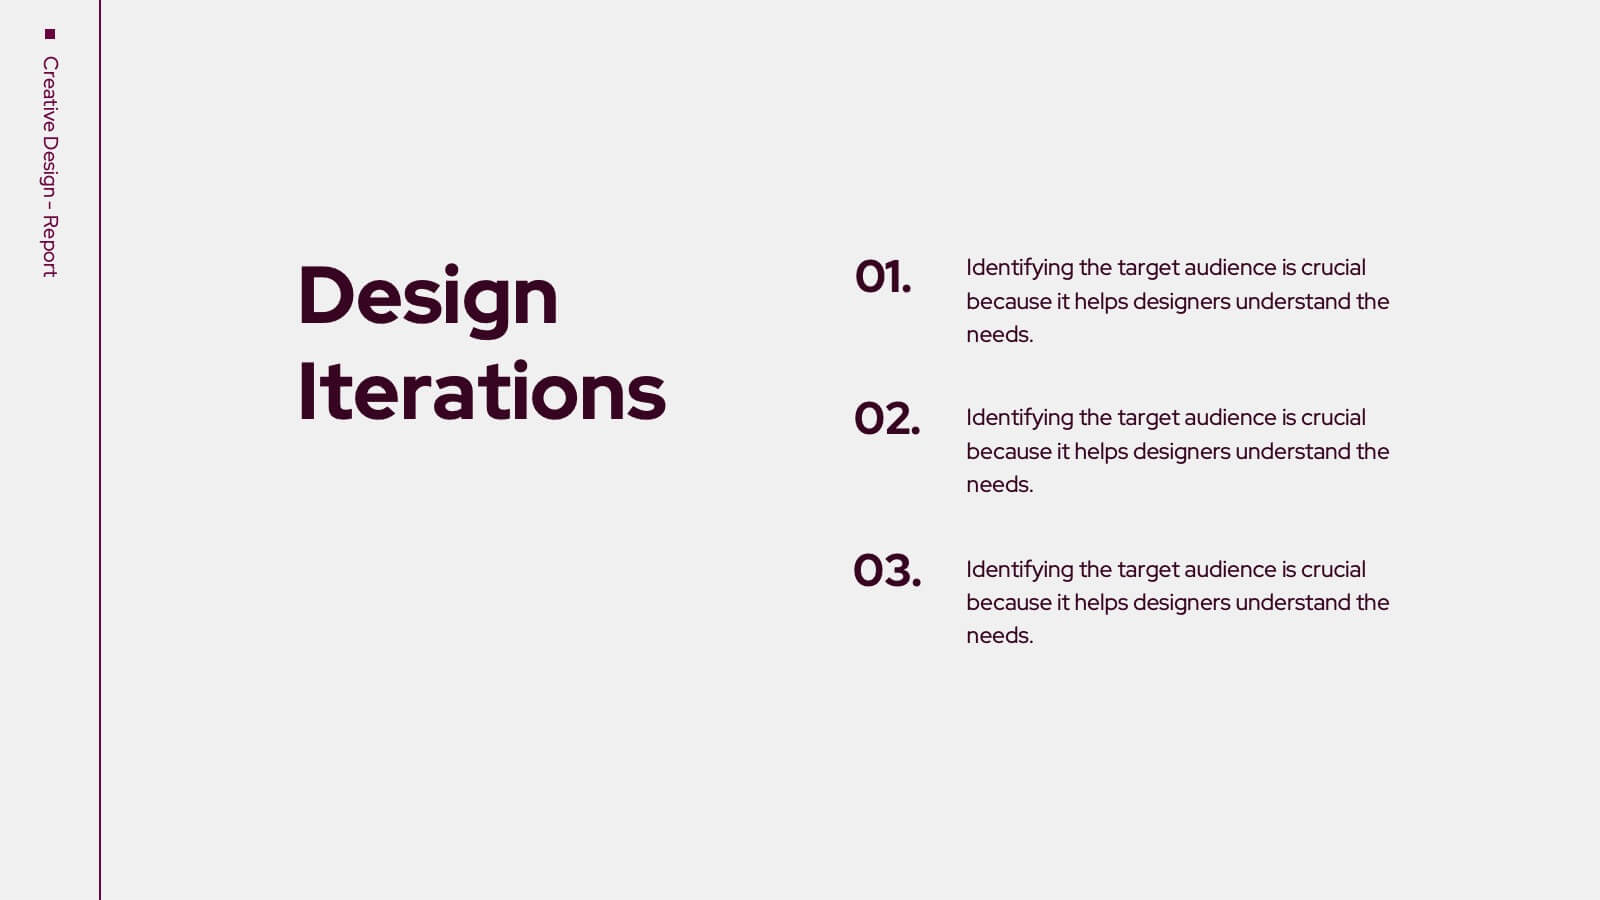
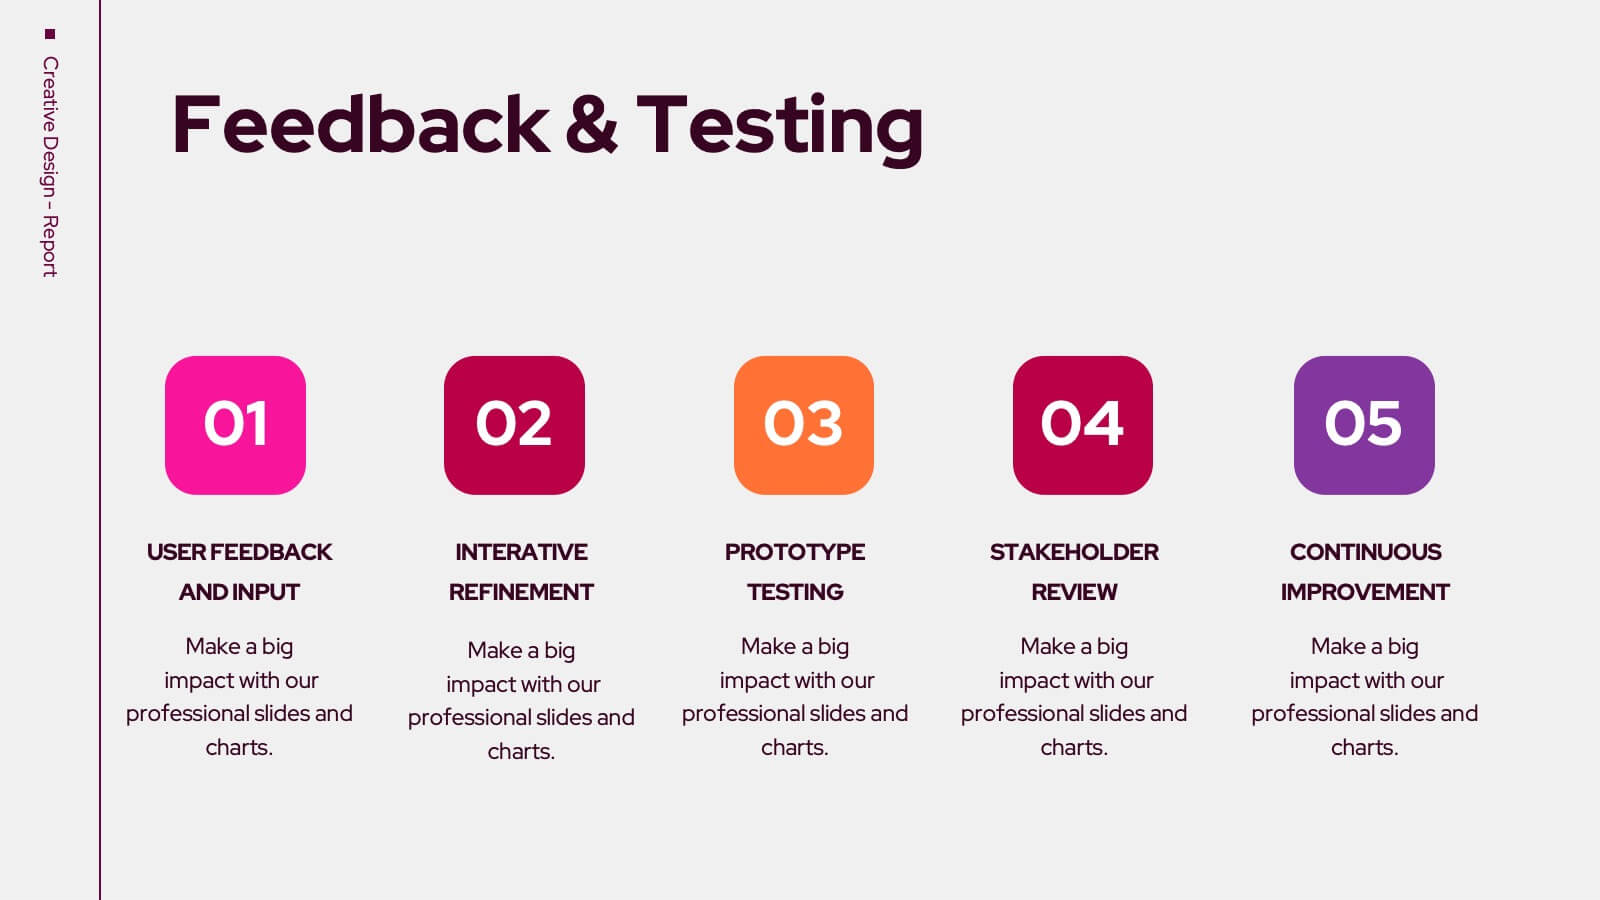
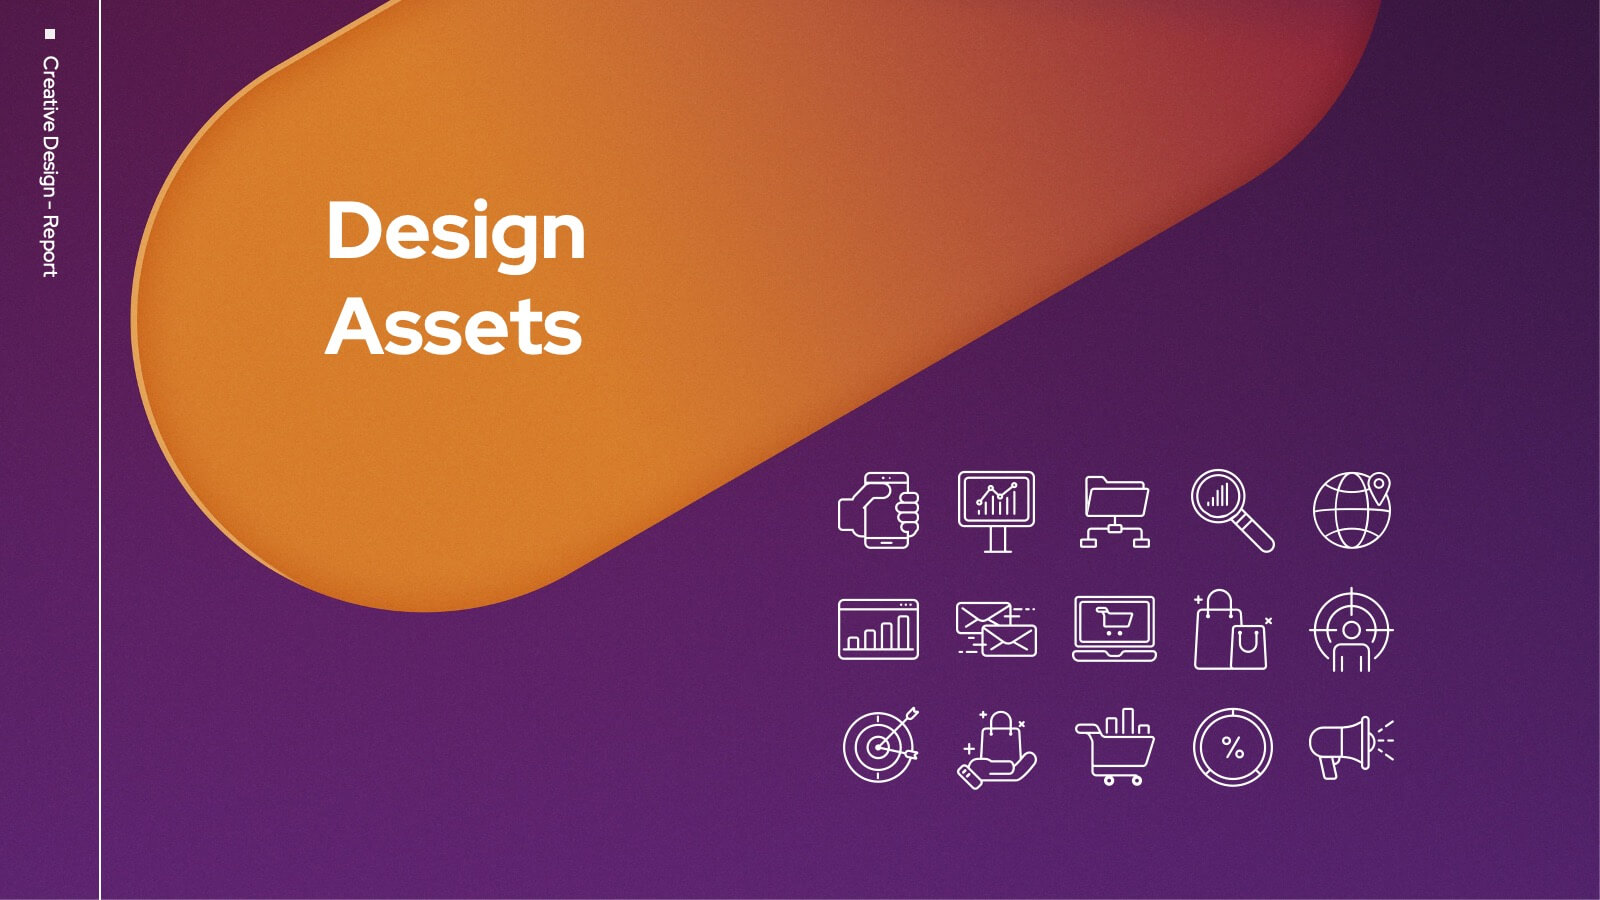
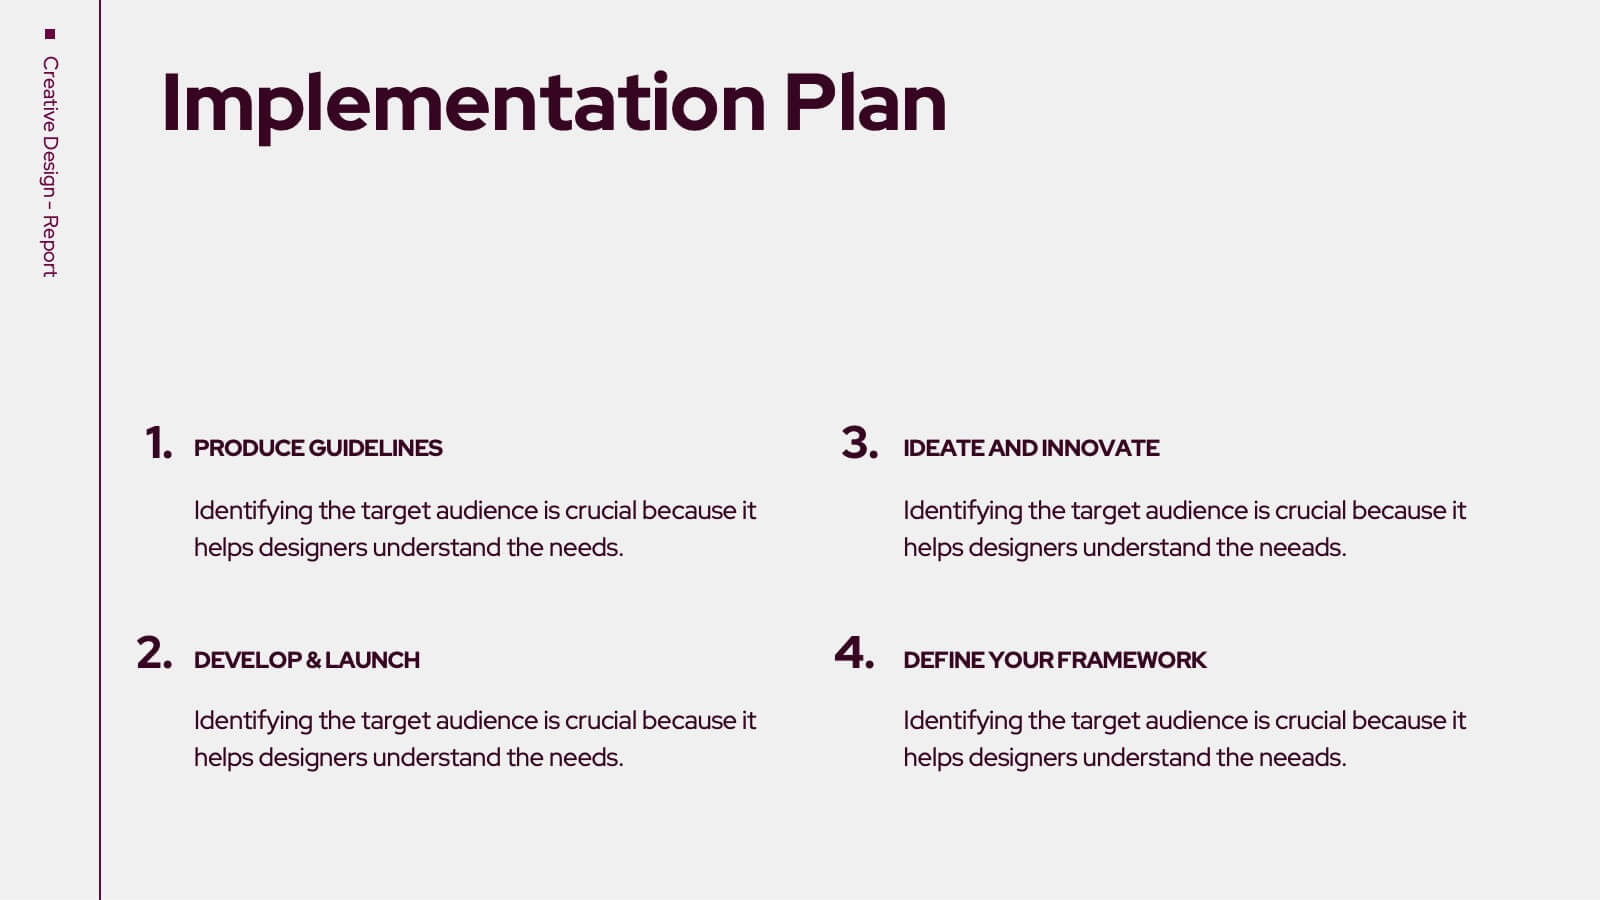
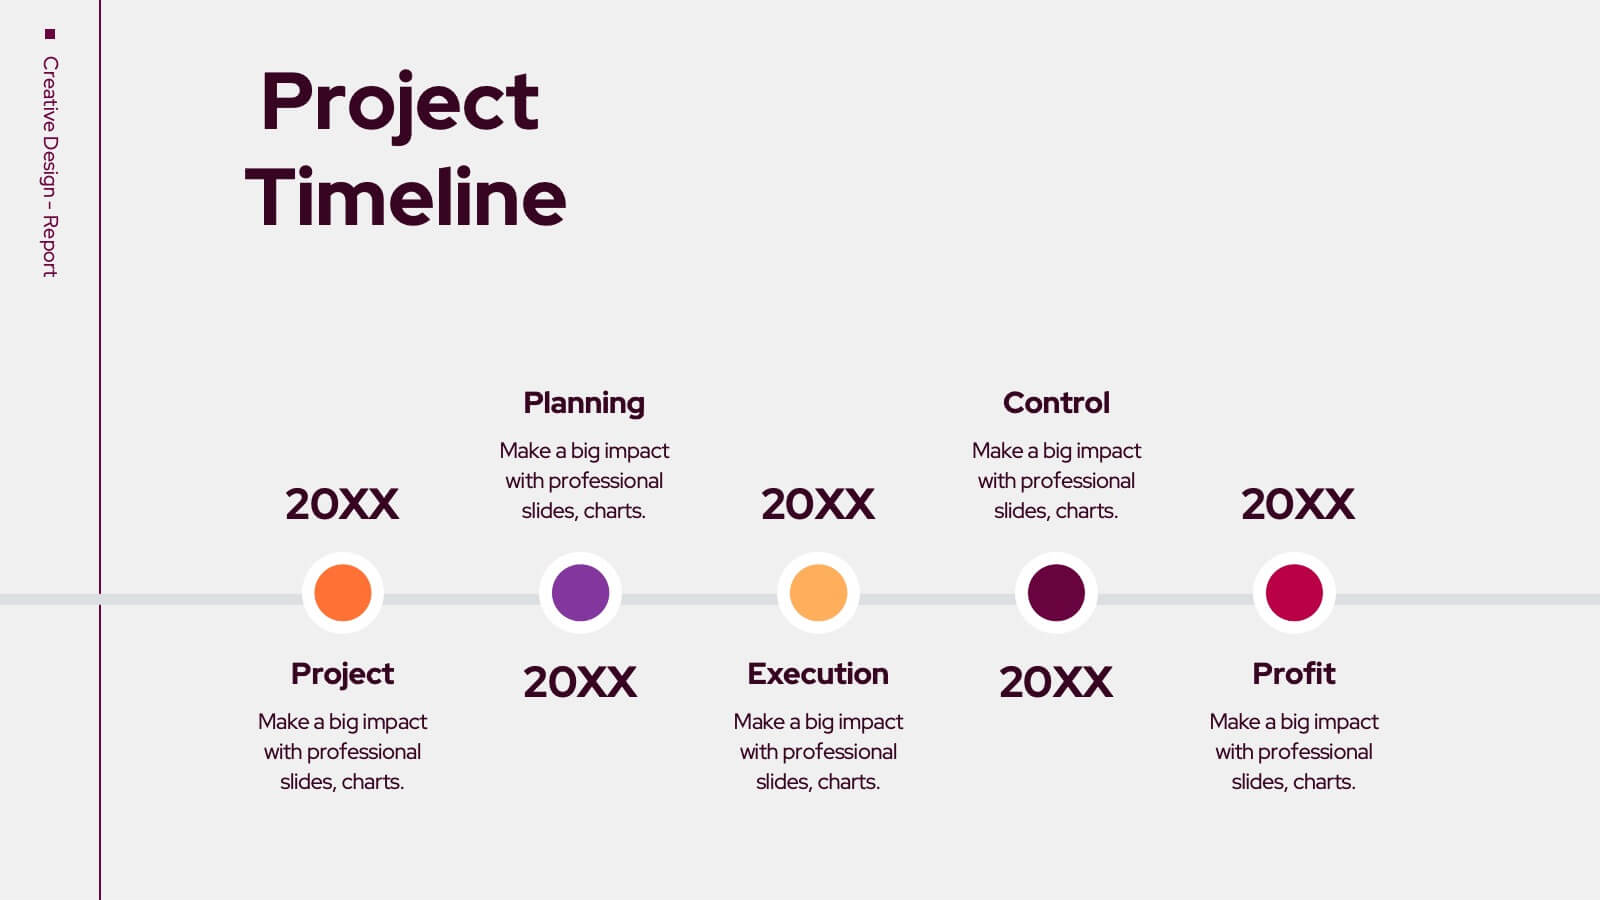
Trojan Creative Design Report Presentation
Unleash your creativity with this striking Trojan-inspired presentation template! Ideal for showcasing your design projects, this presentation enables you to highlight key concepts, inspirations, and visual elements effectively. Its engaging layout ensures your ideas shine through, captivating your audience. Compatible with PowerPoint, Keynote, and Google Slides for seamless presentations.


21 slides
Stellara Content Marketing Pitch Deck Presentation
This Marketing Pitch Deck Presentation is designed to showcase your business strategies with clarity and style. Featuring slides for company history, market presence, financial highlights, and growth plans, it's perfect for startups and agencies. Fully editable and compatible with PowerPoint, Keynote, and Google Slides.


10 slides
Abstract Geometric Pattern Presentation
Energize your message with a bold, modern pattern that instantly grabs attention and gives your content a polished creative edge. This presentation transforms abstract shapes into a clean visual structure that supports clear talking points and smooth storytelling. Fully editable and compatible with PowerPoint, Keynote, and Google Slides.