


Features
- 5 Unique slides
- Fully editable and easy to edit in Microsoft Powerpoint, Keynote and Google Slides
- 16:9 widescreen layout
- Clean and professional designs
- Export to JPG, PDF or send by email


Do you have any questions?
Recommend


2 slides
Digital Mockup Screens for Apps Presentation
Showcase your app in action with the Digital Mockup Screens for Apps Presentation. This bold and modern slide layout centers your mobile UI on colorful abstract shapes, drawing attention to your product. Ideal for startup demos, app features, or UI/UX portfolios. Fully editable in PowerPoint, Keynote, Canva, and Google Slides.


26 slides
Becka Presentation Template
Becka is a modern and powerful template for people who want to present themselves in a professional but bold way. Perfect for the CEO or company executive who wants to have a strong presence on screen. Made with clear and crisp typography, with added bold colors that appeal to both men and women which can evoke powerful emotions and confidence. This template contains easy to edit maps, charts and image place holders that are ready to use. The dynamic slides make it quick and easy to create the perfect presentation.


21 slides
Dreameon Agency Portfolio Presentation
Showcase your agency's expertise with this sleek and modern portfolio presentation template. Designed to highlight your achievements, creative processes, and client success stories, this template offers a comprehensive layout that communicates professionalism and innovation. From introducing your team and services to detailing case studies and market analysis, each slide is meticulously crafted to leave a lasting impression. Display your strategy development, social media impact, and measurement analytics effectively, ensuring a cohesive narrative that resonates with your audience. Easily customizable and compatible with PowerPoint, Google Slides, and Keynote, this template is perfect for agencies looking to pitch their capabilities, attract new clients, or present project achievements with confidence.


7 slides
Lifecycle Stages in Customer Experience Presentation
Showcase the full customer journey with this Lifecycle Stages in Customer Experience presentation. Featuring a sleek infinity loop layout, this slide is ideal for visualizing cyclical engagement stages—like acquisition, onboarding, retention, and advocacy. Clean design and labeled touchpoints help convey insights clearly. Fully compatible with PowerPoint, Canva, and Google Slides.


24 slides
Gamma UX Design Presentation
Present your user experience design process with a sleek and modern template tailored for UX professionals. This template offers a cohesive flow of slides designed to illustrate your design journey, from user research to prototyping and final implementation. Highlight key aspects of your project with slides dedicated to user personas, wireframes, usability testing, and accessibility considerations. Showcase your team’s expertise and present project outcomes effectively with a clean and engaging layout. Visual elements and icons ensure your content is both informative and aesthetically pleasing. Compatible with PowerPoint, Google Slides, and Keynote, this fully customizable template allows you to personalize fonts, colors, and images to match your project’s branding. Impress stakeholders with a well-structured presentation that communicates your UX vision and expertise.


4 slides
Clinical Workflow and Patient Info Layout Presentation
Visualize patient pathways with the Clinical Workflow and Patient Info Layout Presentation. This diagram-based template simplifies complex clinical processes using a clear, step-by-step structure with decision nodes and action points. Ideal for hospital teams, medical administrators, and EHR system walkthroughs. Fully customizable in PowerPoint, Keynote, Google Slides, and Canva.


5 slides
Buyer Journey Infographic Presentation
Understanding how buyers move from awareness to action becomes effortless with this clean, visual presentation. It guides you through each stage, helping you explain behaviors, insights, and touchpoints with clarity. Easy to customize and fully compatible with PowerPoint, Keynote, and Google Slides.


6 slides
Financial Report and Charts Presentation
Deliver financial insights with impact using this Financial Report and Charts Presentation Template. Featuring a clean layout with a money bag visual and percentage breakdowns, it’s perfect for showcasing profit distribution, investment categories, or budget summaries. Fully customizable in PowerPoint, Keynote, and Google Slides.


6 slides
Title Hierarchy Infographic
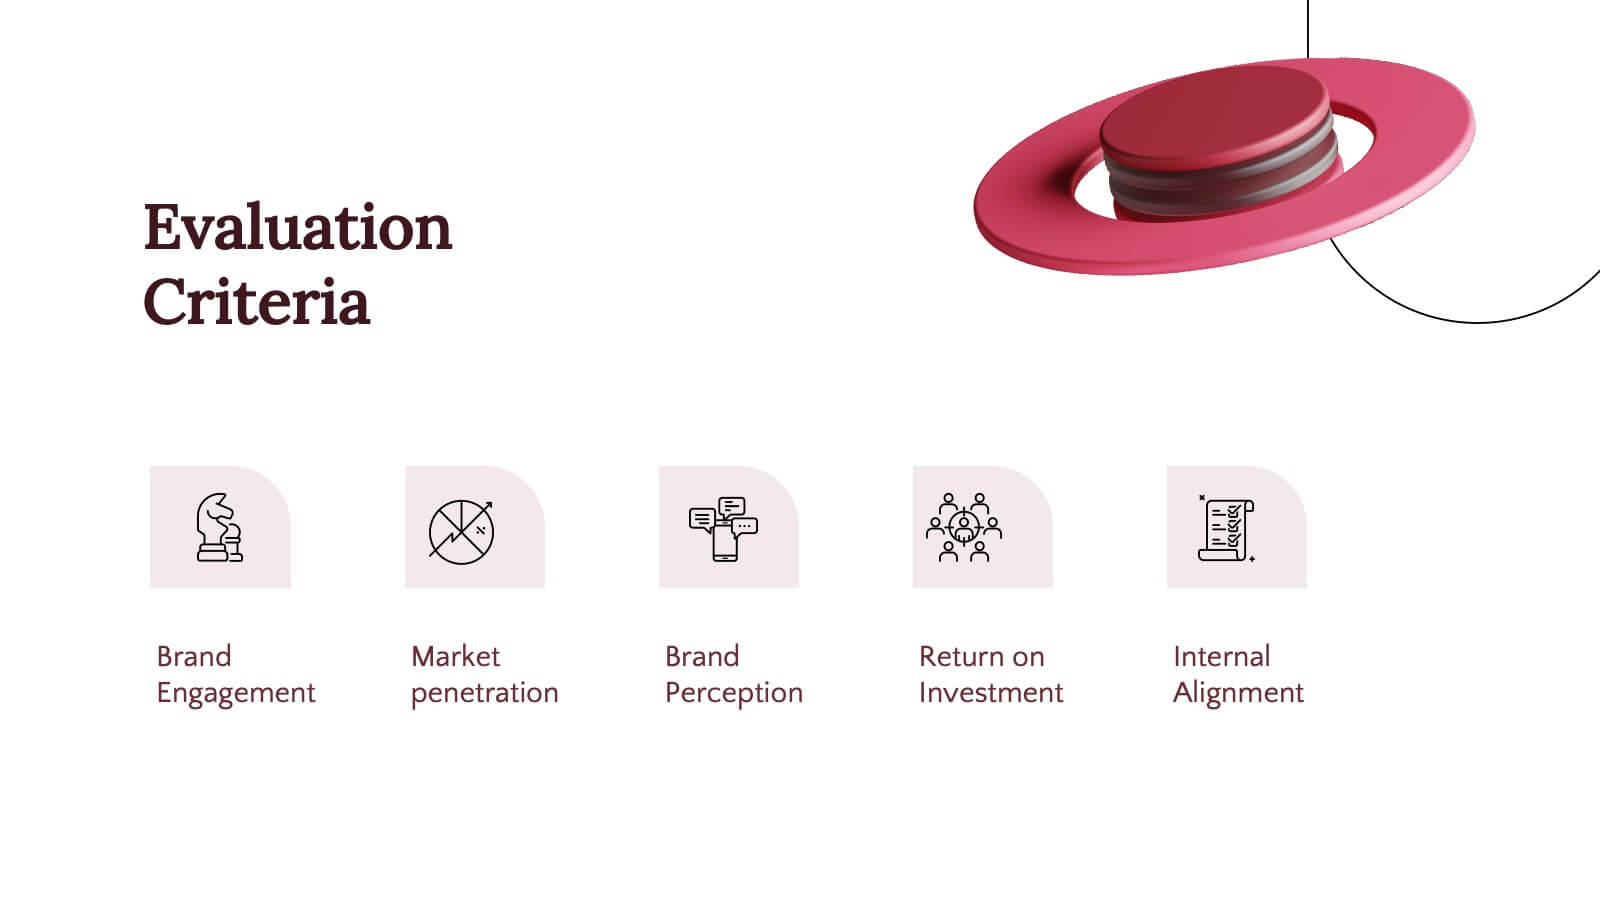
The collection of slides is designed to efficiently convey key themes with a striking visual appeal, ensuring that crucial topics are presented with clarity and emphasis. Each slide utilizes bold typography and a unique color palette to draw attention and maintain viewer engagement. The designs incorporate dynamic shapes and minimalist layouts, enhancing the presentation's readability while emphasizing important content. This set is ideal for professionals aiming to present complex ideas in a clear and memorable way during meetings or in corporate documents. It supports various communicative goals, such as introducing concepts, outlining challenges, or promoting organizational initiatives, making it a versatile tool for enhancing message delivery in any professional setting.


21 slides
Kelpie Project Timeline Presentation
This sleek project plan template is perfect for outlining deliverables, timeline, budget breakdown, and risk management. Its modern design ensures clarity and professionalism, making it ideal for team or business presentations. Compatible with PowerPoint, Keynote, and Google Slides, it offers flexibility and ease for showcasing your project's key elements.
6 slides
Project Status Tracking Dashboard Presentation
Turn complex project data into a clear visual story with this dynamic, data-driven layout built to track progress, performance, and milestones. Perfect for reports and executive updates, it highlights insights at a glance. Fully compatible with PowerPoint, Keynote, and Google Slides for easy editing and professional presentation delivery.


7 slides
McKinsey 7S Model Infographic Presentation Template
The McKinsey 7S model is a management framework developed by the consulting firm McKinsey & Company. The model consists of seven interdependent factors that are important for an organization's success: strategy, structure, systems, shared values, skills, staff, and style. The template can be used to visualize the 7S model hierarchy and the importance of each component to your business. This inventive presentation is designed to take an economic approach, If you’re interested in taking this strategic step to evaluating your processes and measuring performance, this presentation is for you.


8 slides
Success Metrics and Performance Presentation
Showcase your Success Metrics and Performance with this data-driven presentation template. Designed with bar-style visualizations and percentage-based highlights, this layout is ideal for business analysts, project managers, and executives looking to present key performance indicators (KPIs) with clarity. Featuring customizable colors, icons, and text placeholders, this template ensures clear and impactful storytelling. Compatible with PowerPoint, Keynote, and Google Slides for easy integration.


7 slides
Skills Gap Analysis Infographic Presentation Template
A skills gap analysis is a process that identifies organizational skill gaps and develops a plan to fill them. Employers use this process when they are trying to gauge their current skill sets, identify future needs and understand the best ways to meet those needs. This is an important part of your organization's recruiting strategy. Use this customizable template to gather your own insights into the skills gap in your organization. With this template you can analyze the current state of your company and team, identify areas for improvement, and create a roadmap for growing your team.


21 slides
Mystic UX Research Report Presentation
Present your UX research with precision using this sleek and engaging report template! It covers key elements like user research, wireframes, prototyping, testing, and branding guidelines, providing a comprehensive overview of the design process. Ideal for client reviews or team discussions, this template is fully compatible with PowerPoint, Keynote, and Google Slides.


4 slides
Simple and Effective Steps Presentation
Guide your audience through a seamless workflow with this "Simple and Effective Steps" template. Designed for clarity and impact, this layout breaks down processes into four distinct steps, making it ideal for project planning, decision-making, and strategy execution. Fully customizable and compatible with PowerPoint, Keynote, and Google Slides.


6 slides
Environmental Science Infographics
Our "Environmental Science" infographic template, compatible with PowerPoint, Keynote, and Google Slides, is designed for educators, environmentalists, and scientists. This template effectively communicates important concepts in environmental science, making it a great tool for presentations and educational purposes. The template features key elements such as ecosystems, sustainability practices, and the impacts of climate change. It’s structured to help presenters convey complex environmental information in a way that is both easy to understand and visually engaging. This makes it ideal for educational settings, conferences, or public awareness campaigns about environmental issues. The design is vibrant and engaging, with a color scheme that reflects nature and environmental awareness. Incorporating greens, blues, and earth tones, it not only educates but also inspires the audience to think about the environment. Whether you're discussing conservation strategies, ecological studies, or environmental policies, this template ensures your presentation is both informative and visually striking.