


Features
- 5 Unique slides
- Fully editable and easy to edit in Microsoft Powerpoint, Keynote and Google Slides
- 16:9 widescreen layout
- Clean and professional designs
- Export to JPG, PDF or send by email


Do you have any questions?
Recommend


8 slides
Health and Safety Training
Create impactful safety briefings with this visual slide designed around a caution-sign layout. Perfect for outlining training modules, compliance steps, or workplace hazard procedures, it presents four key points using icons and color-coded elements. Fully customizable in PowerPoint, Keynote, and Google Slides.


5 slides
Final Thoughts and Project Recap Presentation
Wrap up your presentation with clarity using this Final Thoughts and Project Recap Presentation. Designed with a modern vertical hexagon layout, this slide highlights four key conclusions or reflections with matching icons and clean text alignment. It's perfect for summarizing insights, actions, or final outcomes. Fully editable in PowerPoint, Keynote, Google Slides, and Canva.


26 slides
Effective Communication Skills Presentation
Discover the key to successful interactions with our Effective Communication Skills presentation template. This all-in-one template is fully compatible with PowerPoint, Keynote, and Google Slides, making it the perfect addition to your toolkit, whether you're an educator, a corporate trainer, or a team leader. Our template is meticulously designed to help you convey the essence of effective communication, breaking down complex concepts into easily understandable segments. From active listening to clear articulation, it covers various aspects of communication that are crucial in both personal and professional environments. Each slide in the Effective Communication Skills template features a clean, engaging design, encouraging viewers to focus on the content. Editable charts, graphs, and models allow for a customized experience, ensuring that your message resonates with your specific audience. By using this template, you can confidently guide your audience through the intricacies of effective communication, making your presentation a reference point for those looking to improve their communication skills. Elevate your presentations and ensure your message is not just heard, but understood and acted upon.


21 slides
Alchemos UX Case Study Presentation
Showcase your UX process with clarity and impact using this sleek case study presentation. Covering key aspects like user research, interaction design, prototyping, and responsive design, this template helps you tell a compelling design story. Fully customizable and compatible with PowerPoint, Keynote, and Google Slides for a seamless presentation experience.


7 slides
Food Recipes Infographic Presentation
Food is a source of energy, nutrients and other substances. These are the basic necessities for growth and development of the body. Help your audience take a closer look at the ingredients of your food with this infographic! This template will allow you to easily convey the healthy benefits of certain foods and what to avoid. It features a variety of visual styles and easy to use editing tools like text boxes, shapes, icons and other editable elements. It is completely customizable and compatible with Powerpoint, Keynote, and Google Slides, so you can change colors, fonts and more.
23 slides
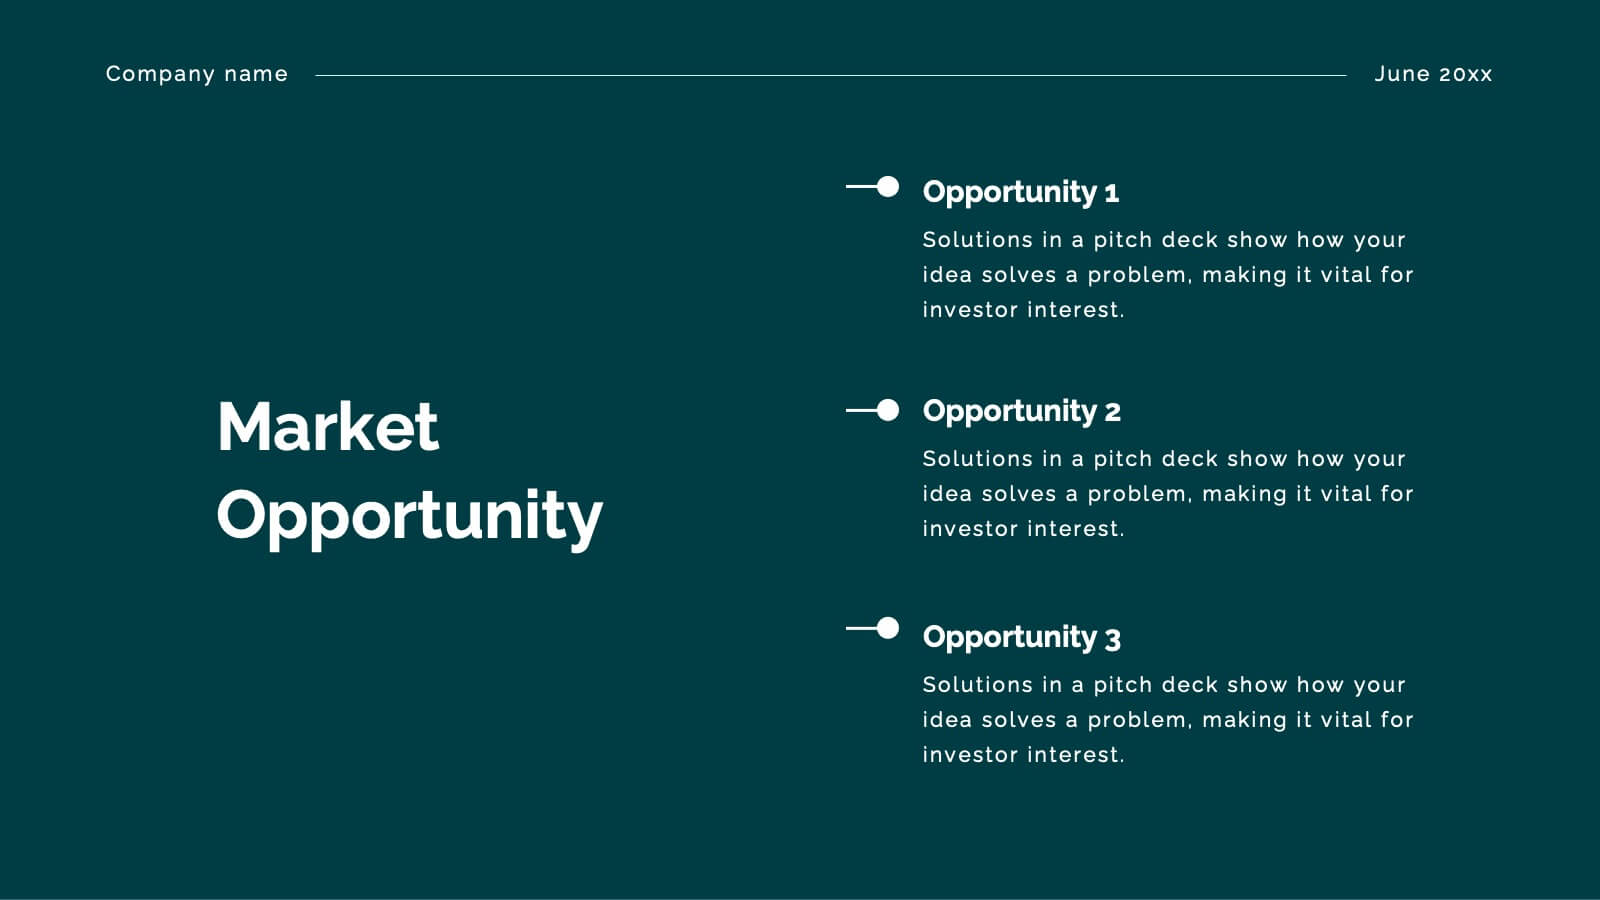
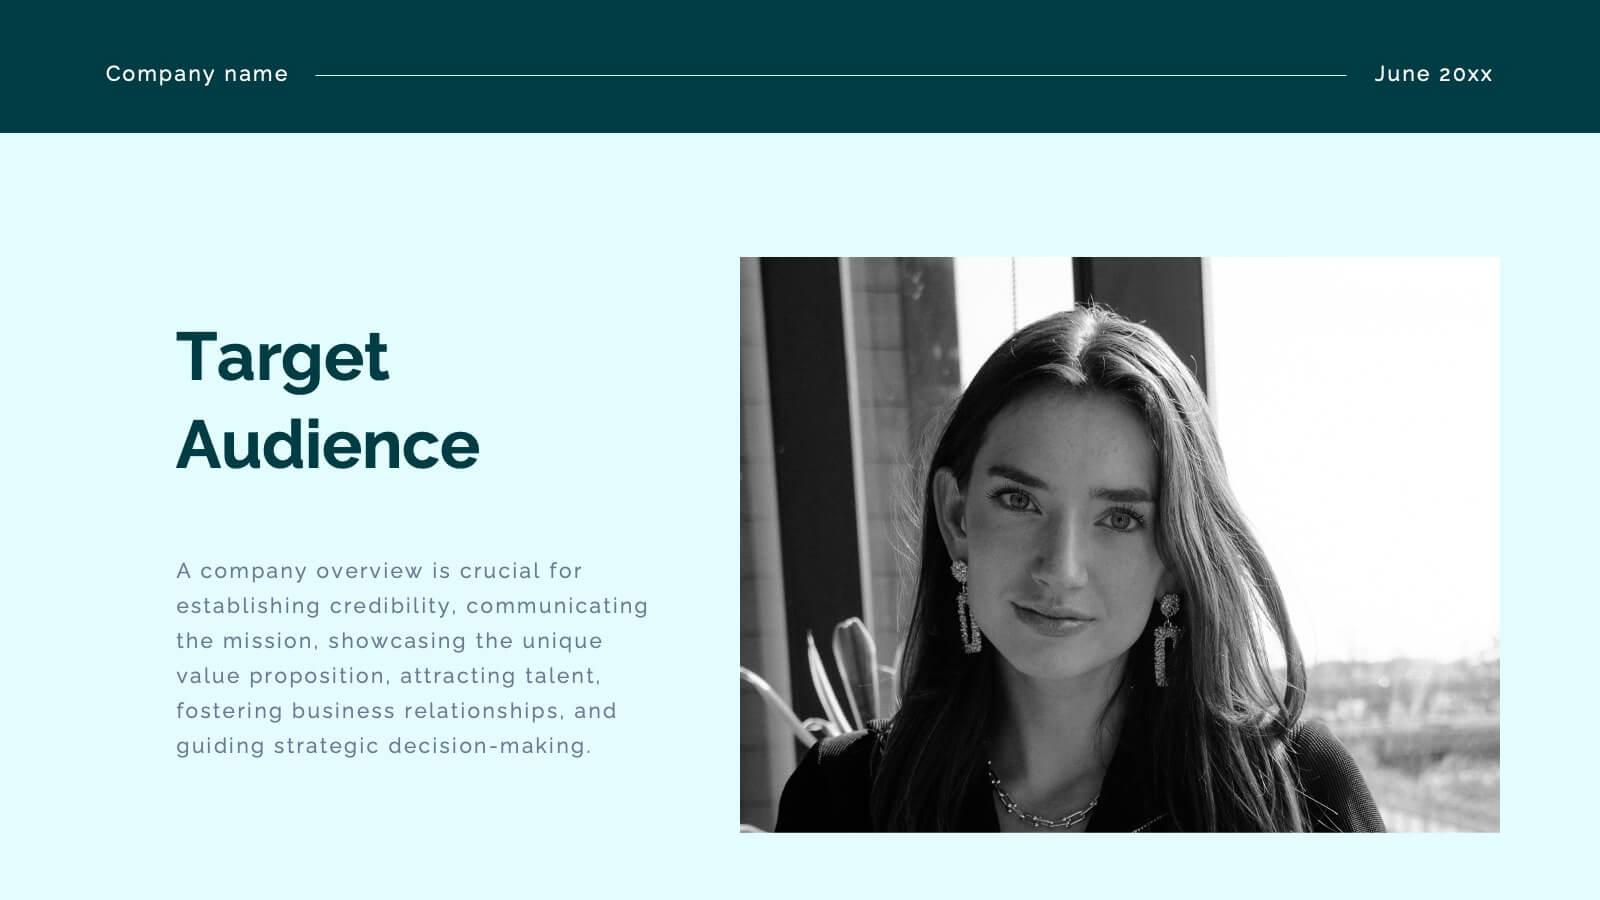
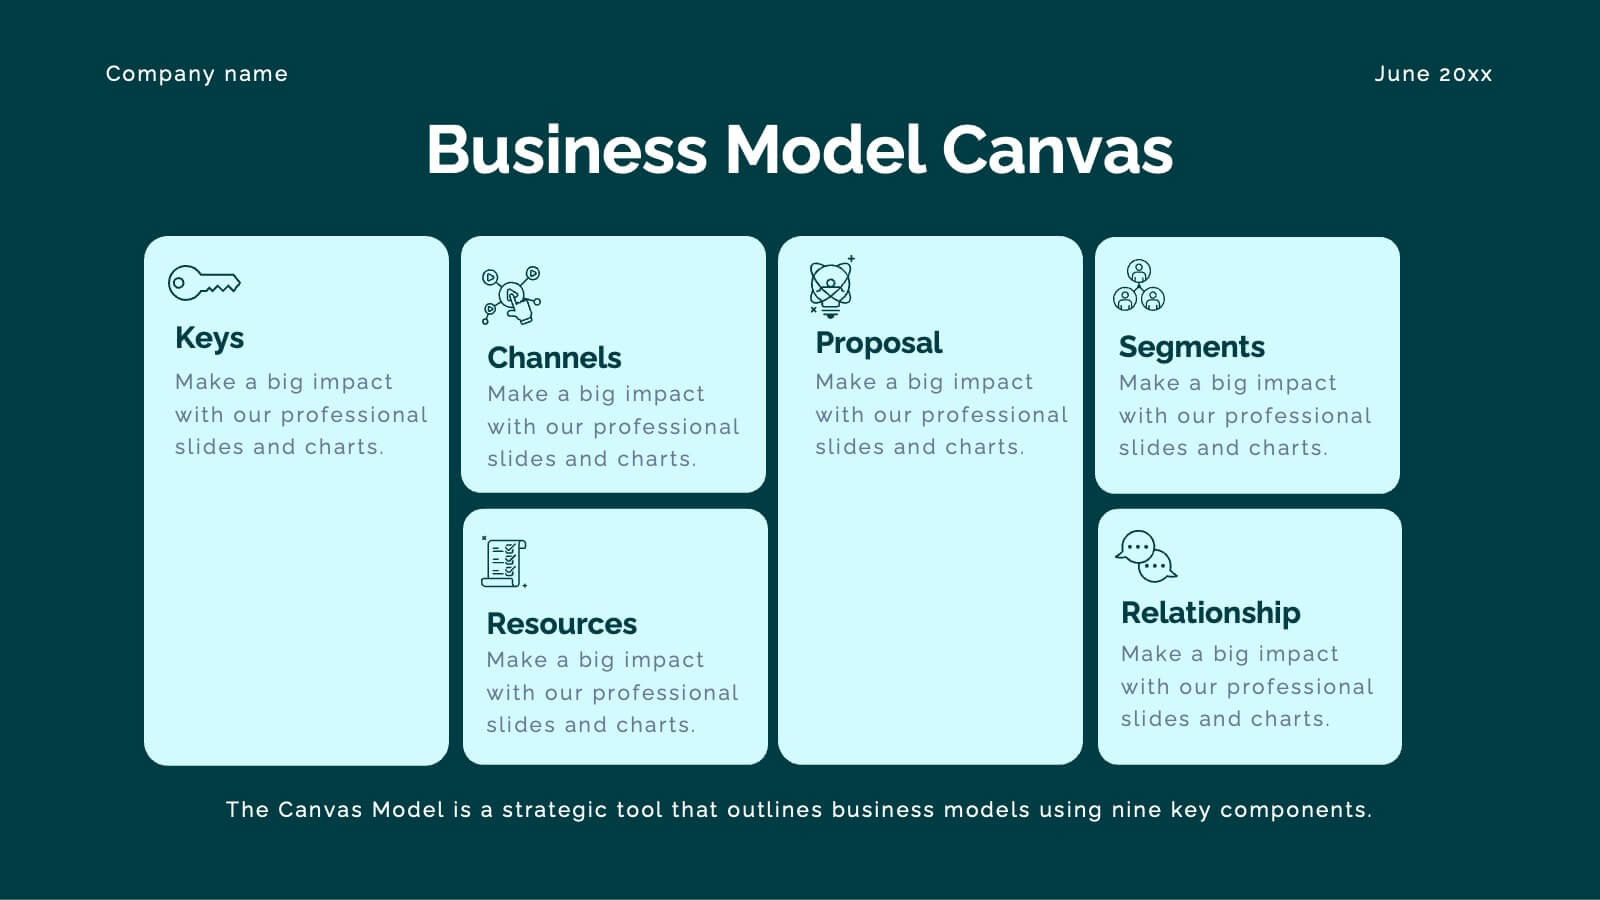
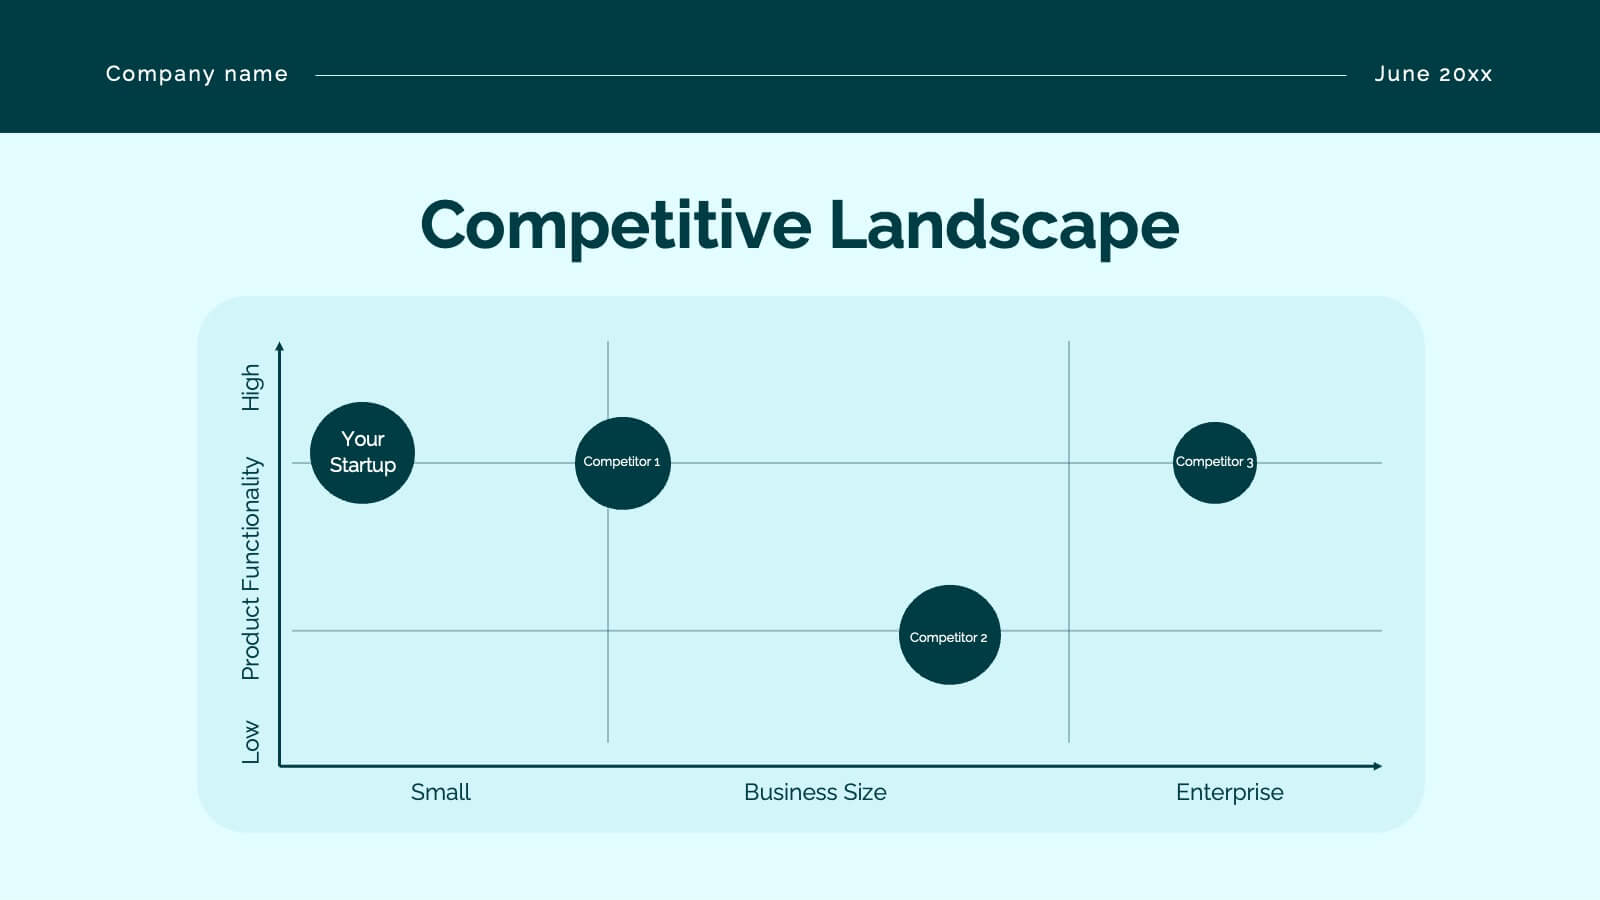
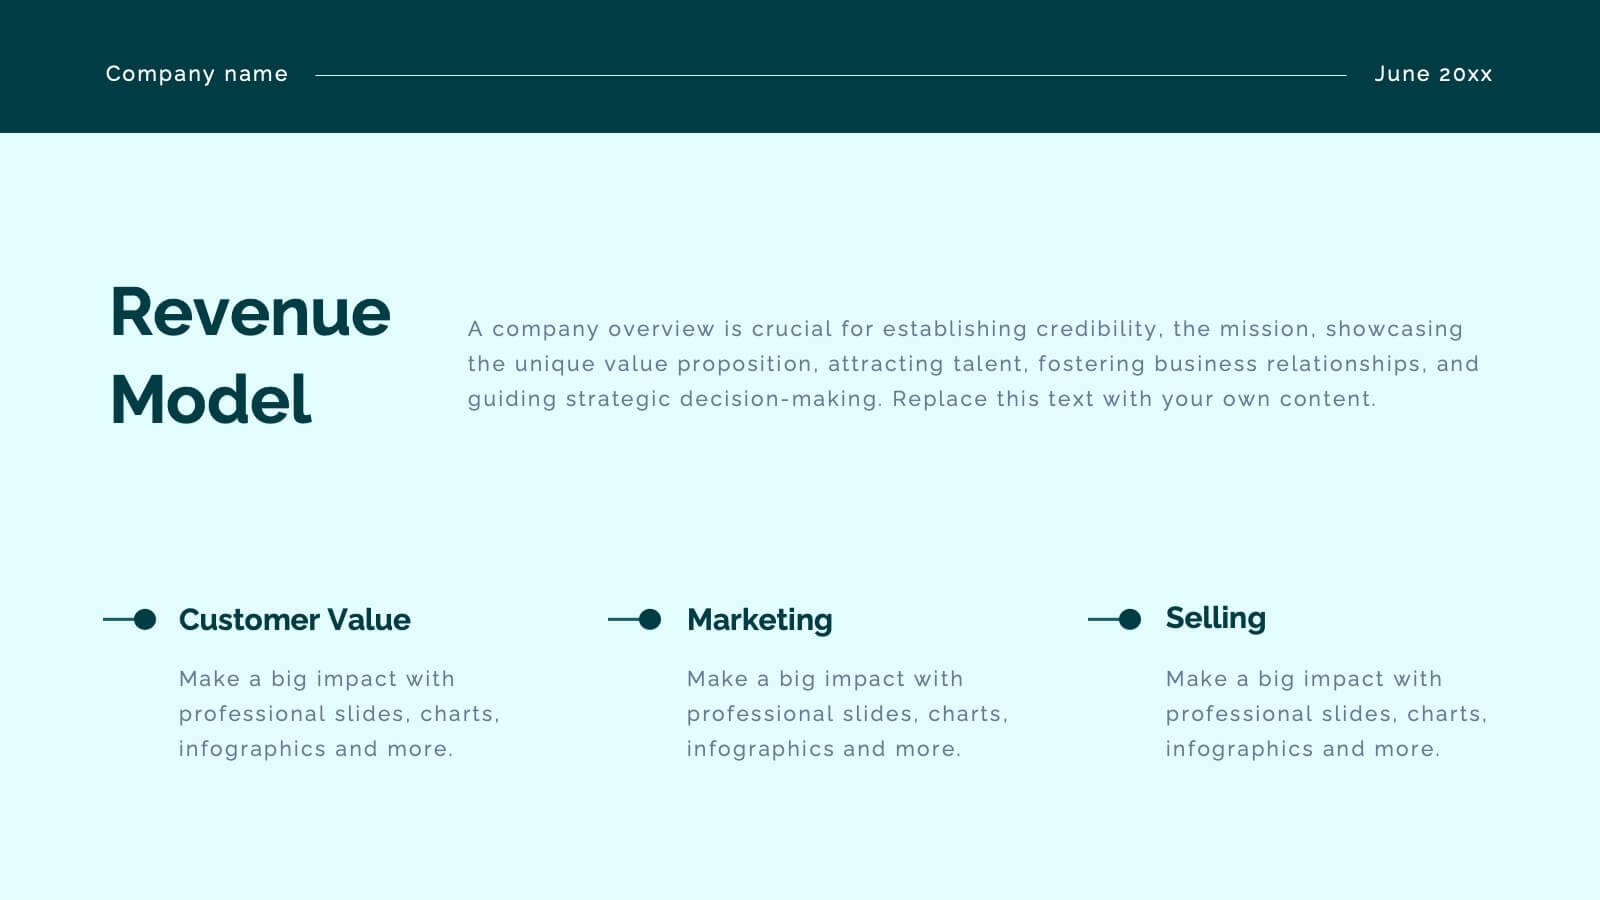
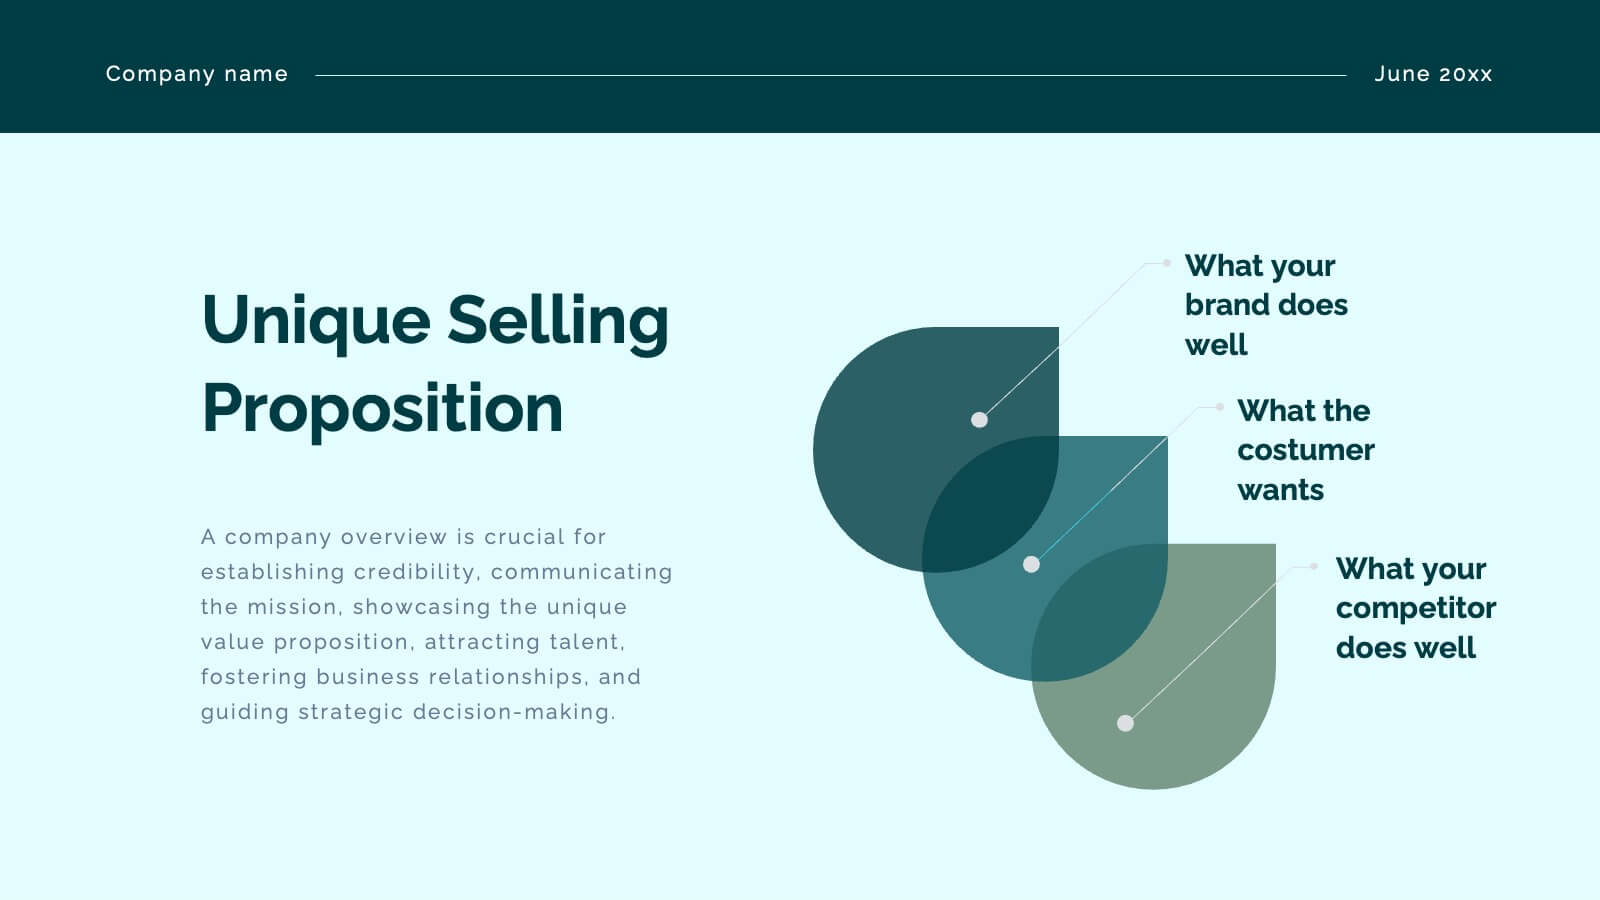
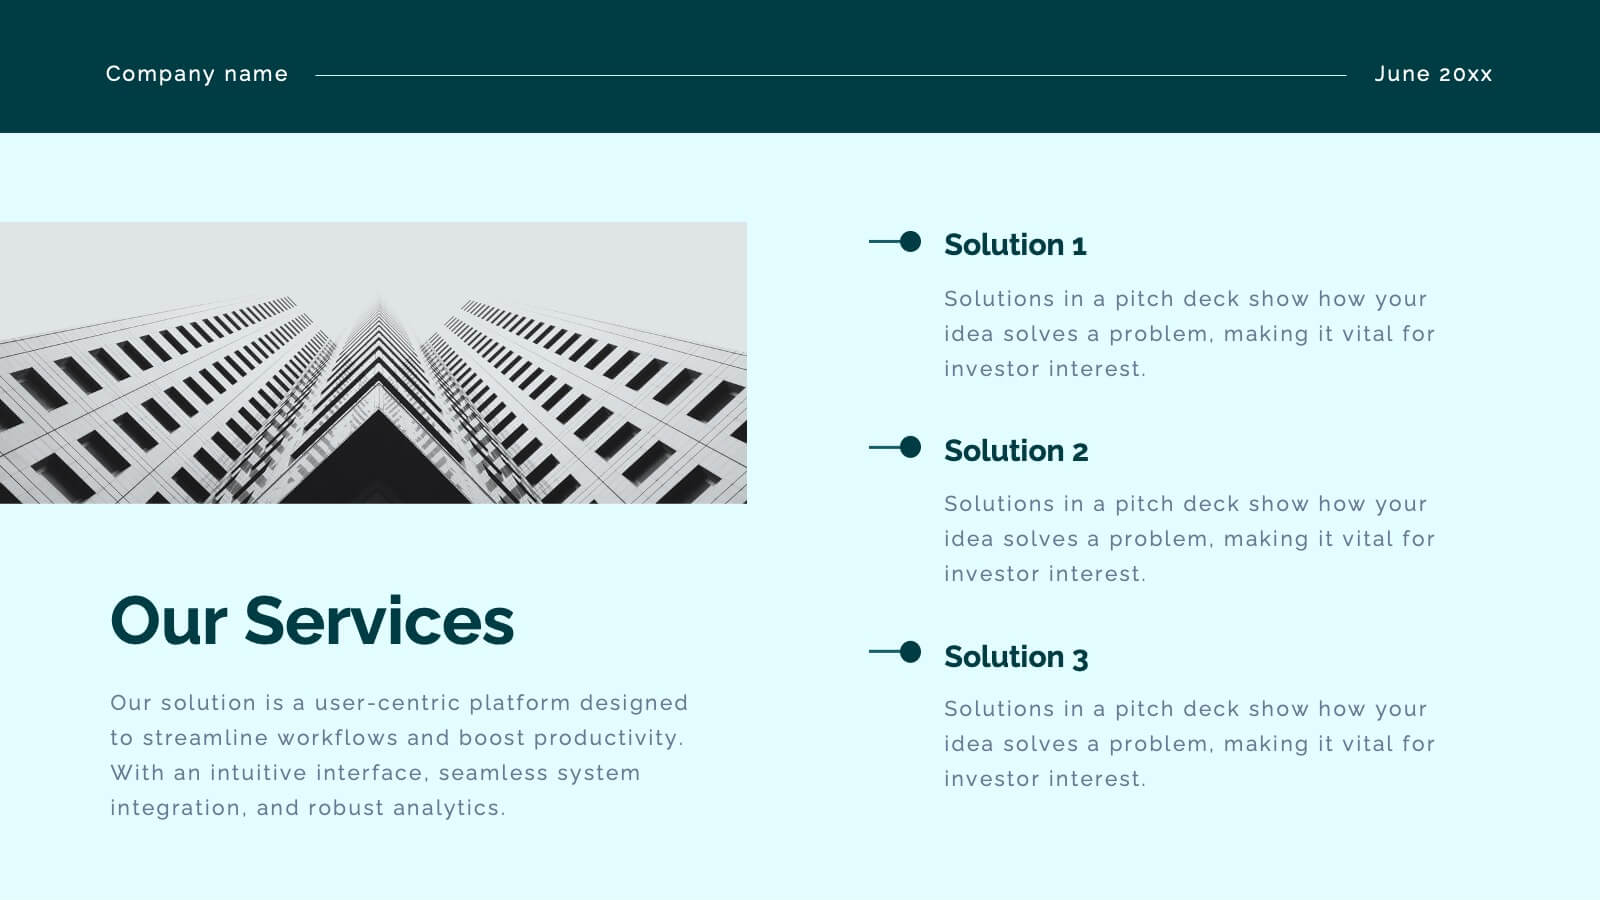
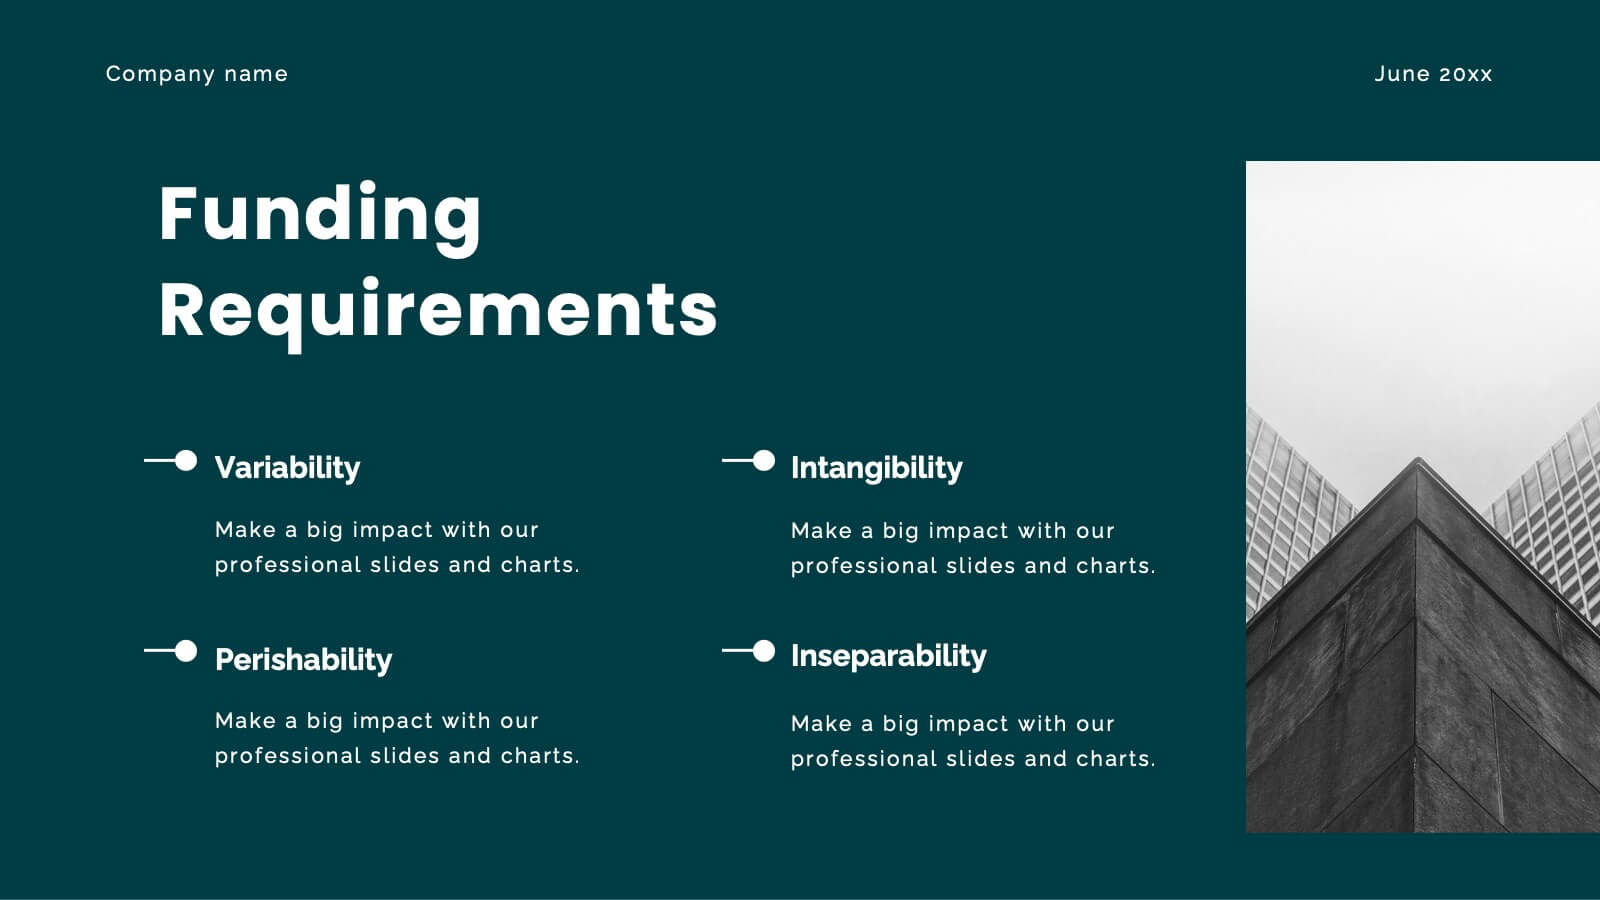
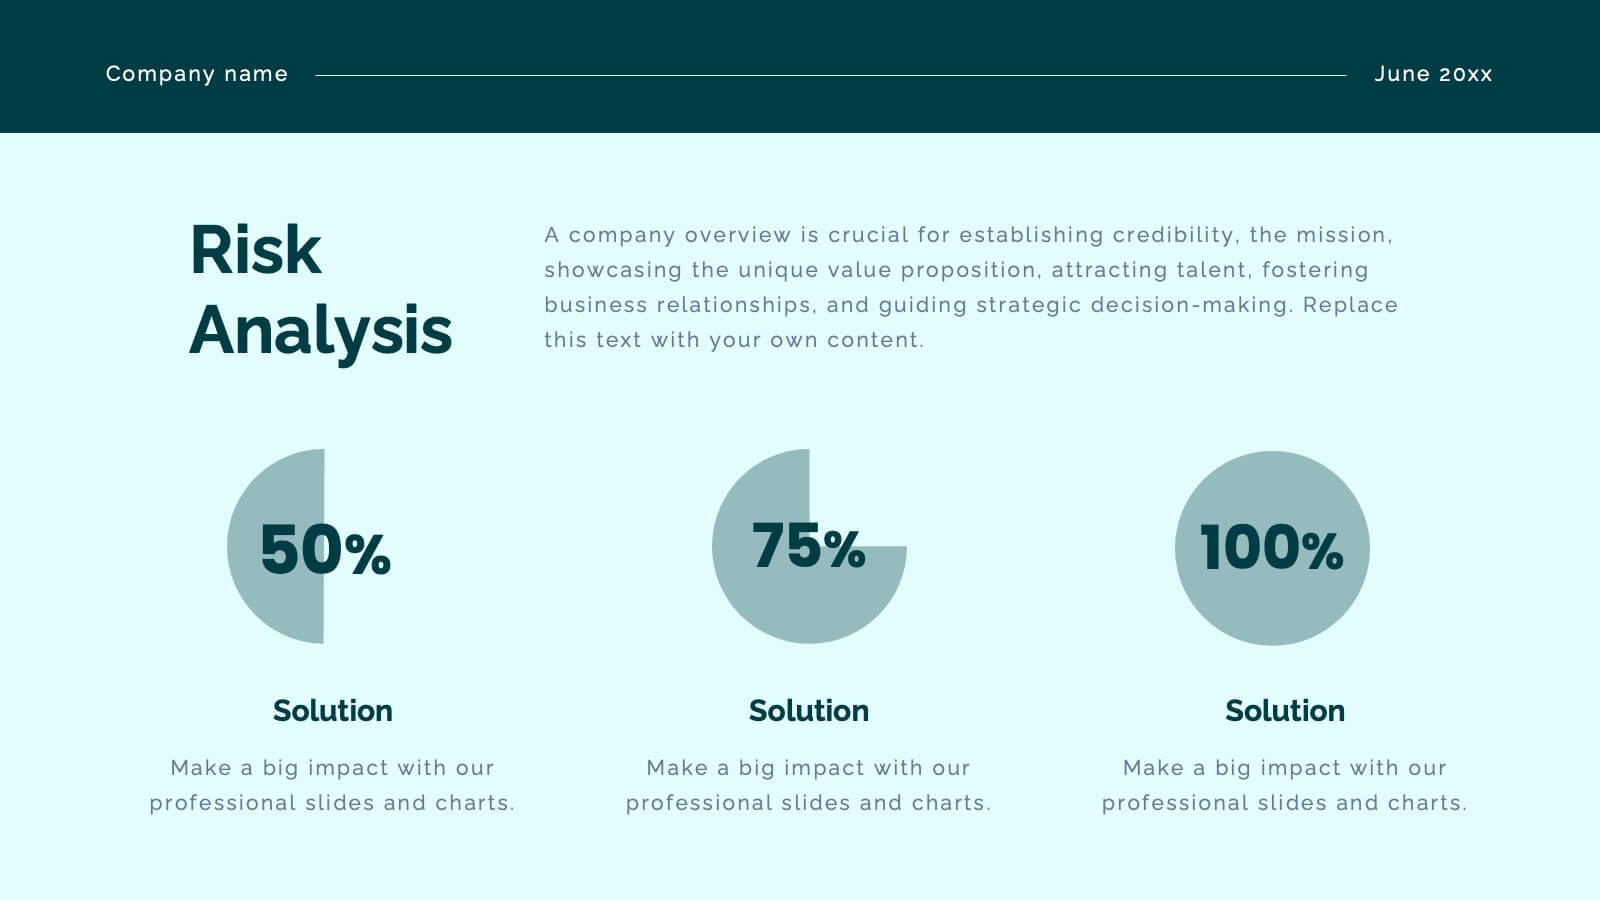
Crest Investor Pitch Presentation Presentation
Unleash your potential with this powerful pitch deck template! Tailored for presenting innovative business ideas, it features slides for company overview, market opportunity, competitive landscape, and financial projections. Clearly communicate your value proposition and impress investors with professional design and concise content. Compatible with PowerPoint, Keynote, and Google Slides for seamless presentations on any platform.


8 slides
Professional Title Slide Presentation
Start your presentation with impact using a bold, modern cover design that captures attention instantly. Perfect for introducing reports, creative projects, or business pitches, this layout combines professional typography with clean visuals for a polished first impression. Fully editable in PowerPoint, Keynote, and Google Slides for seamless customization.
22 slides
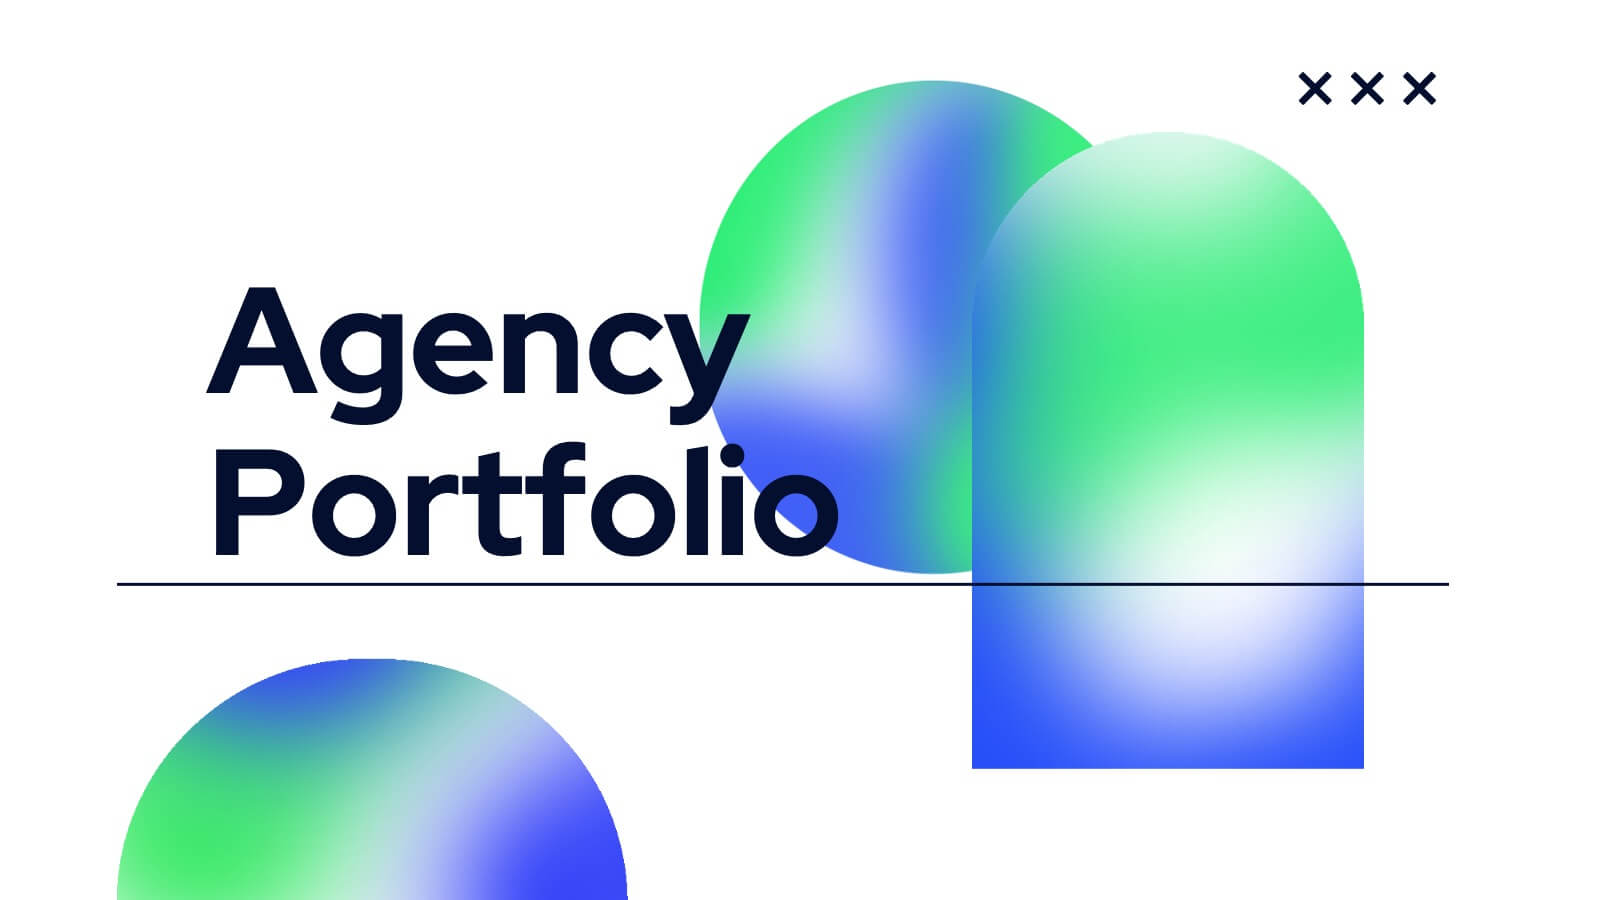
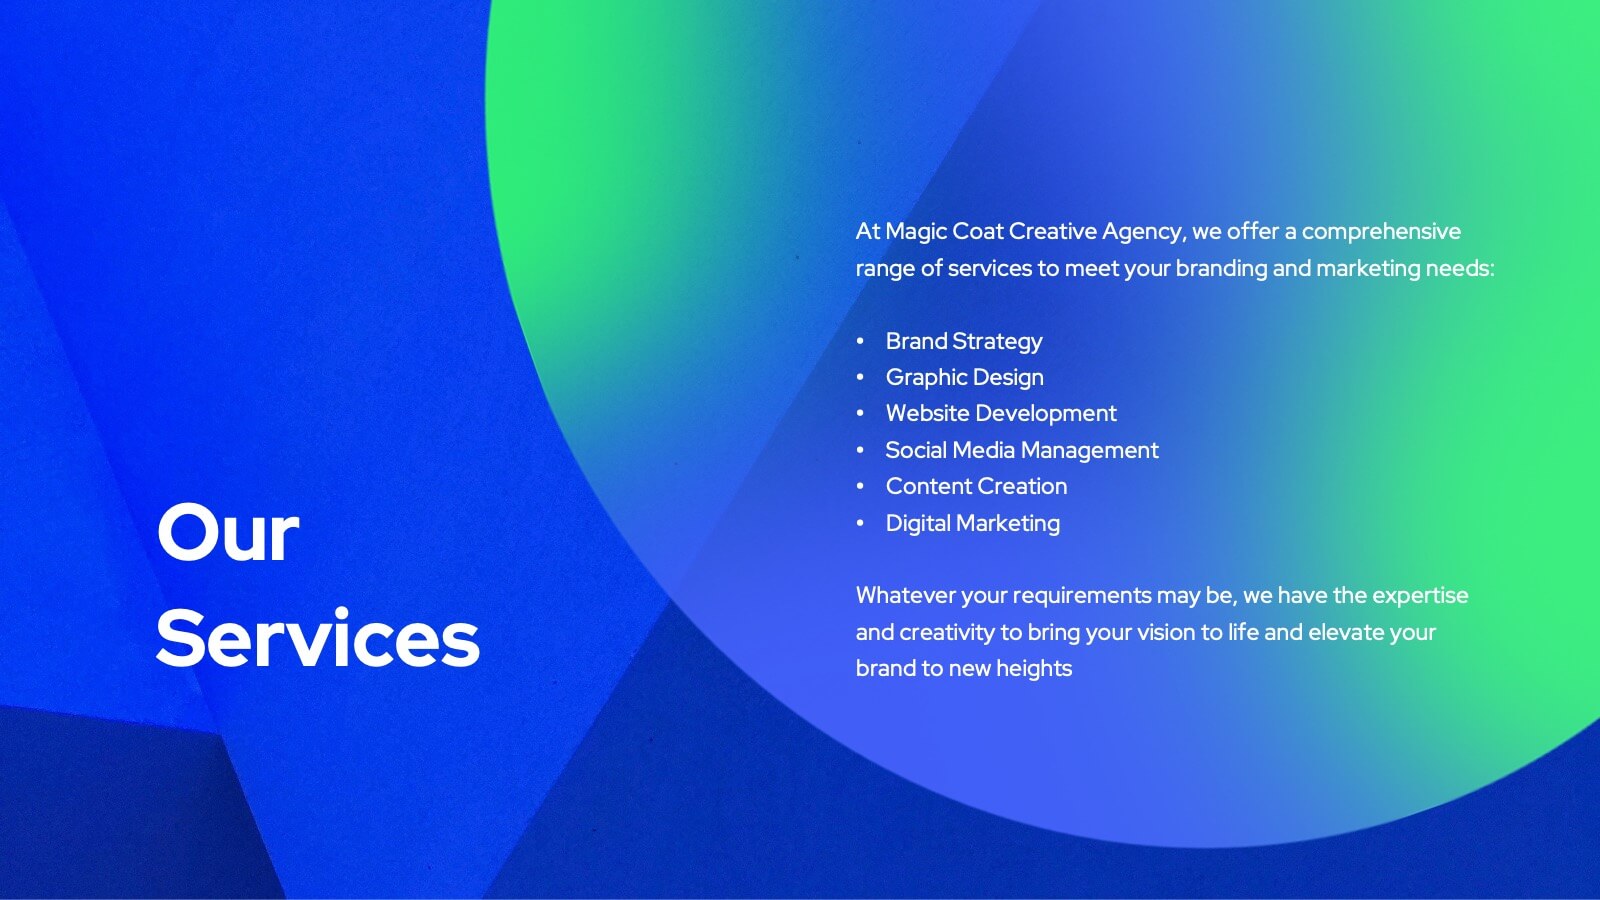
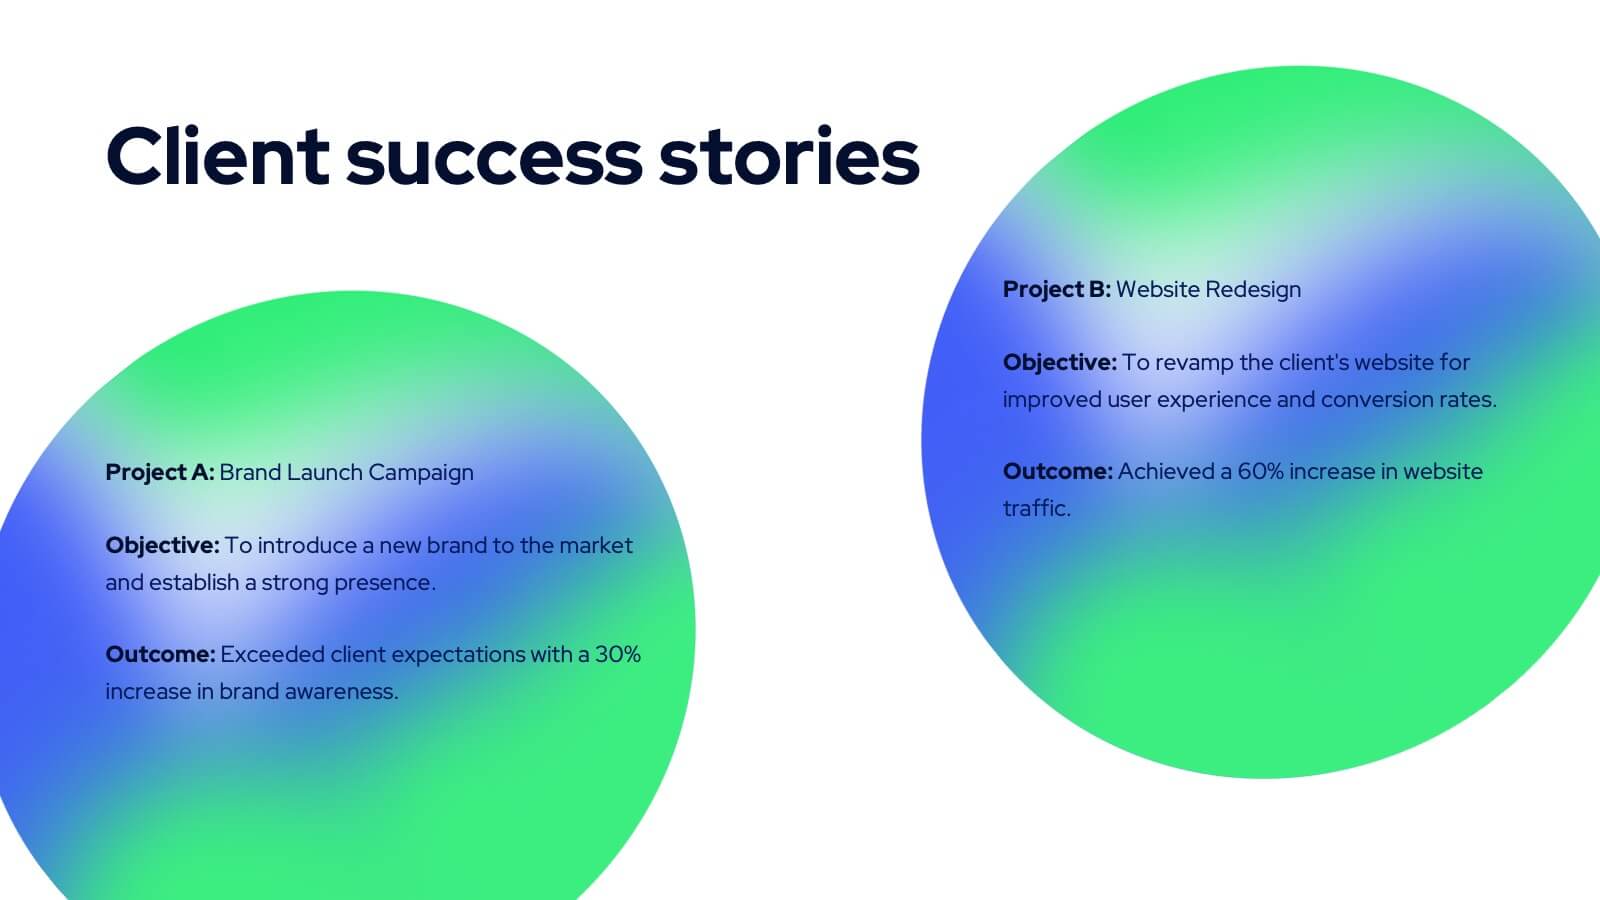
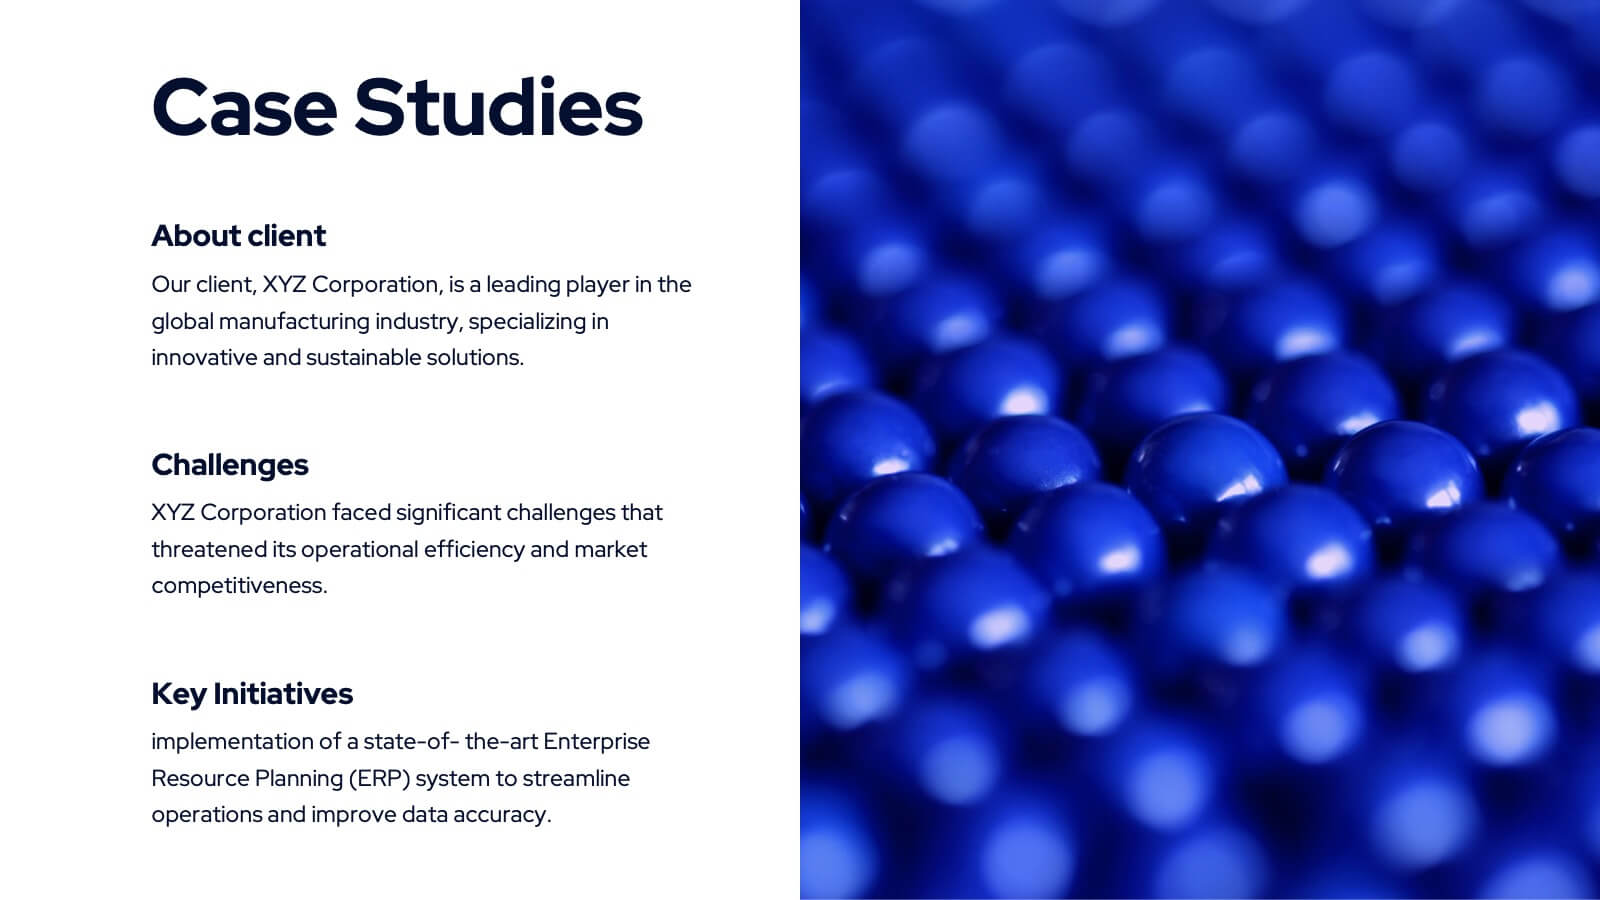
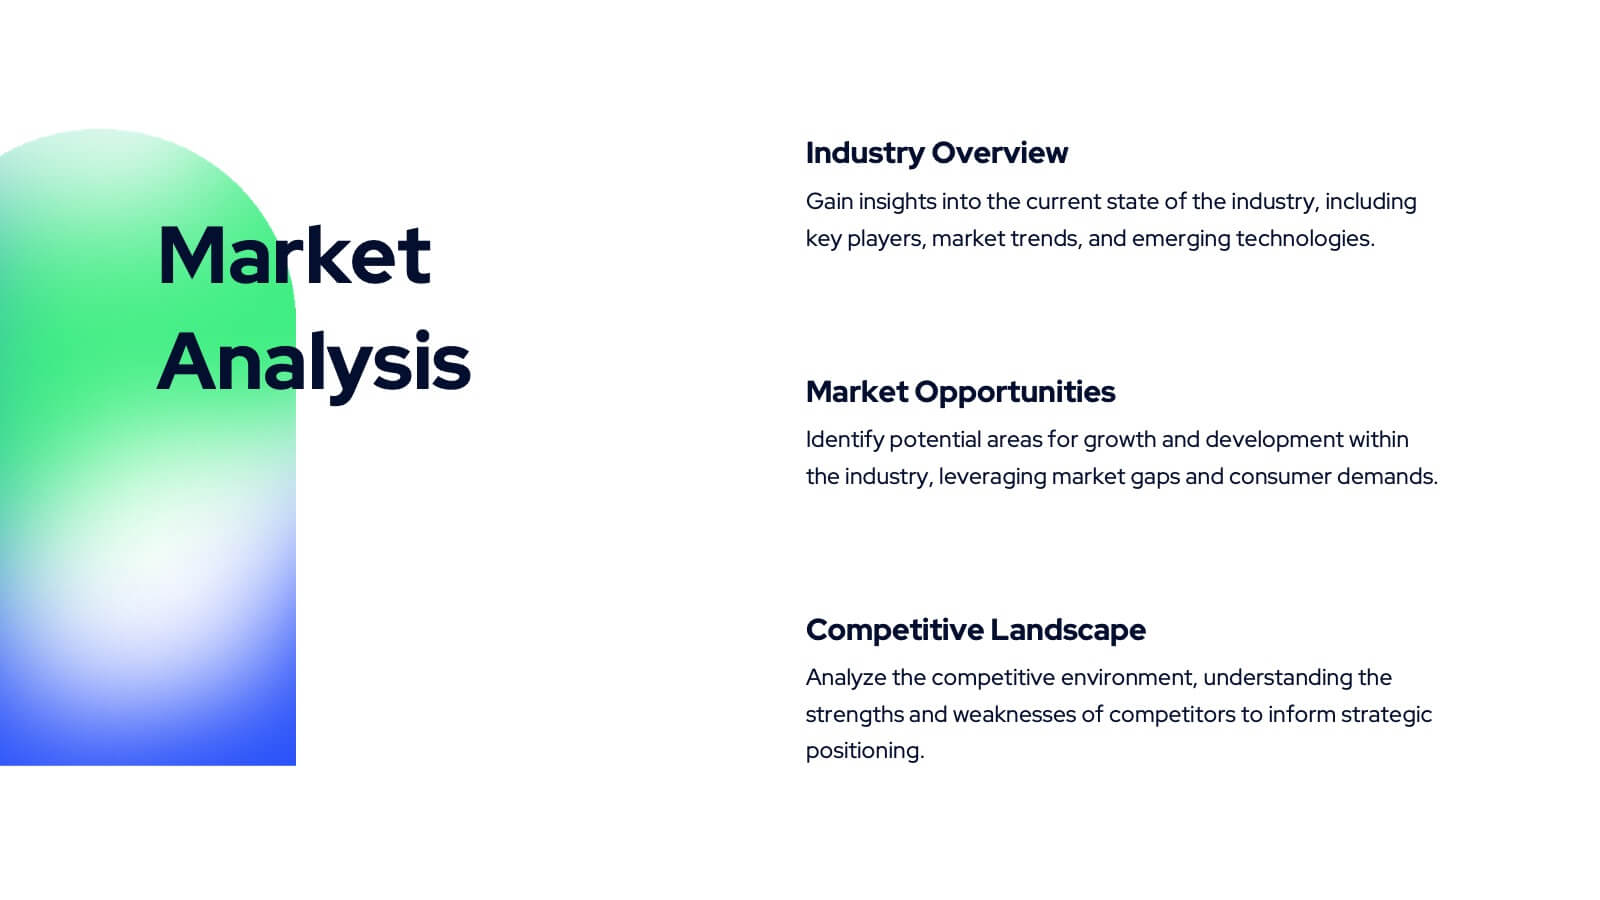
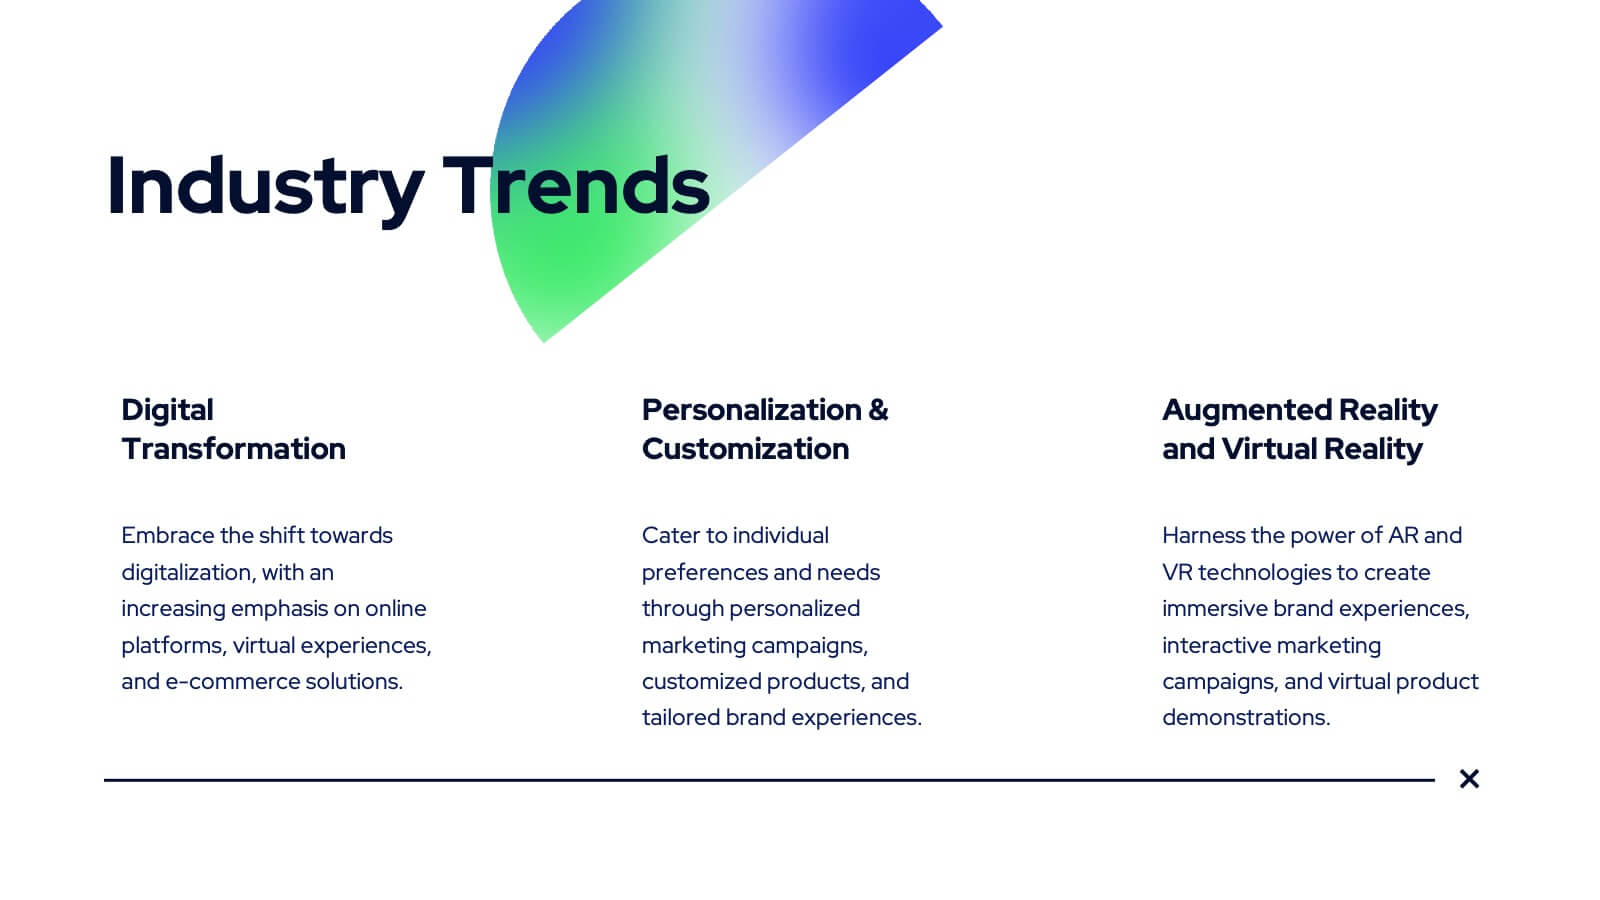
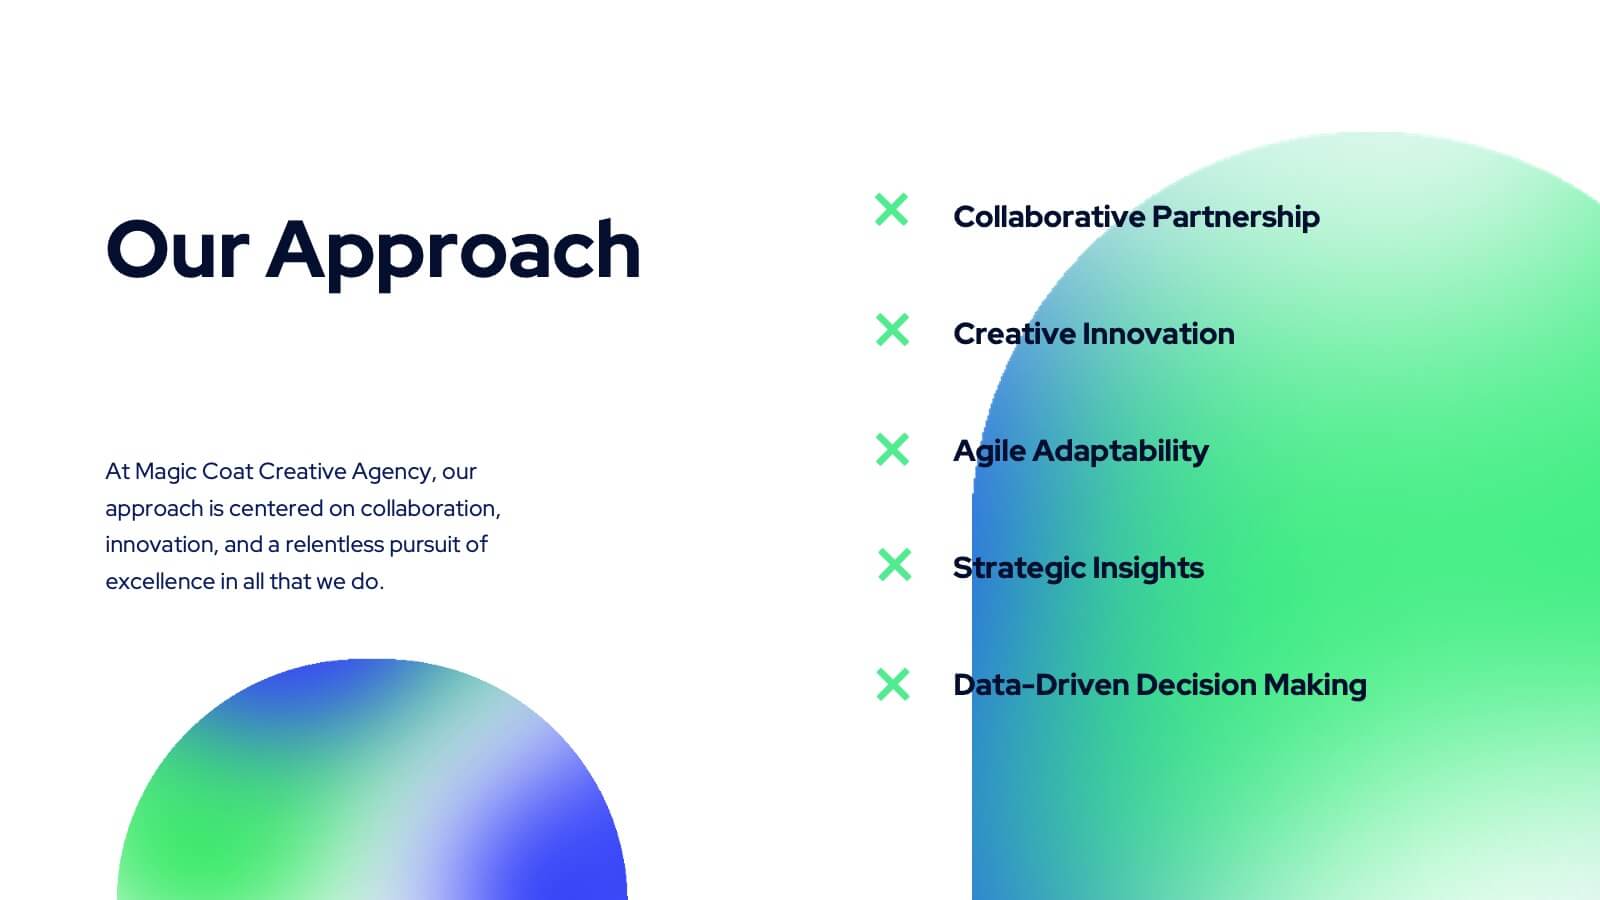
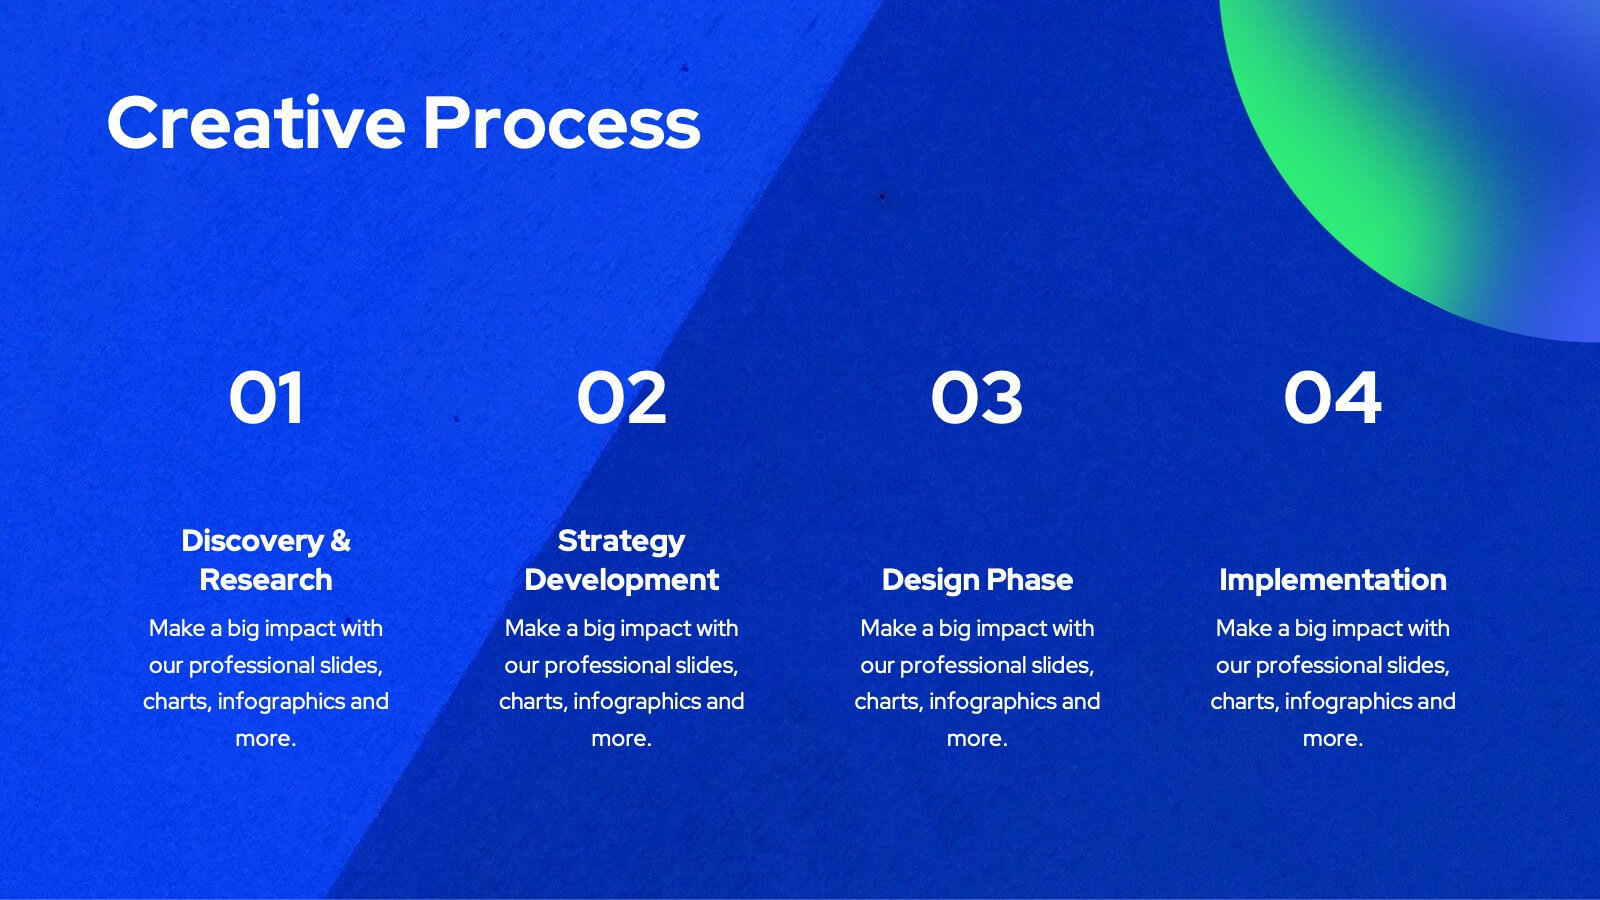
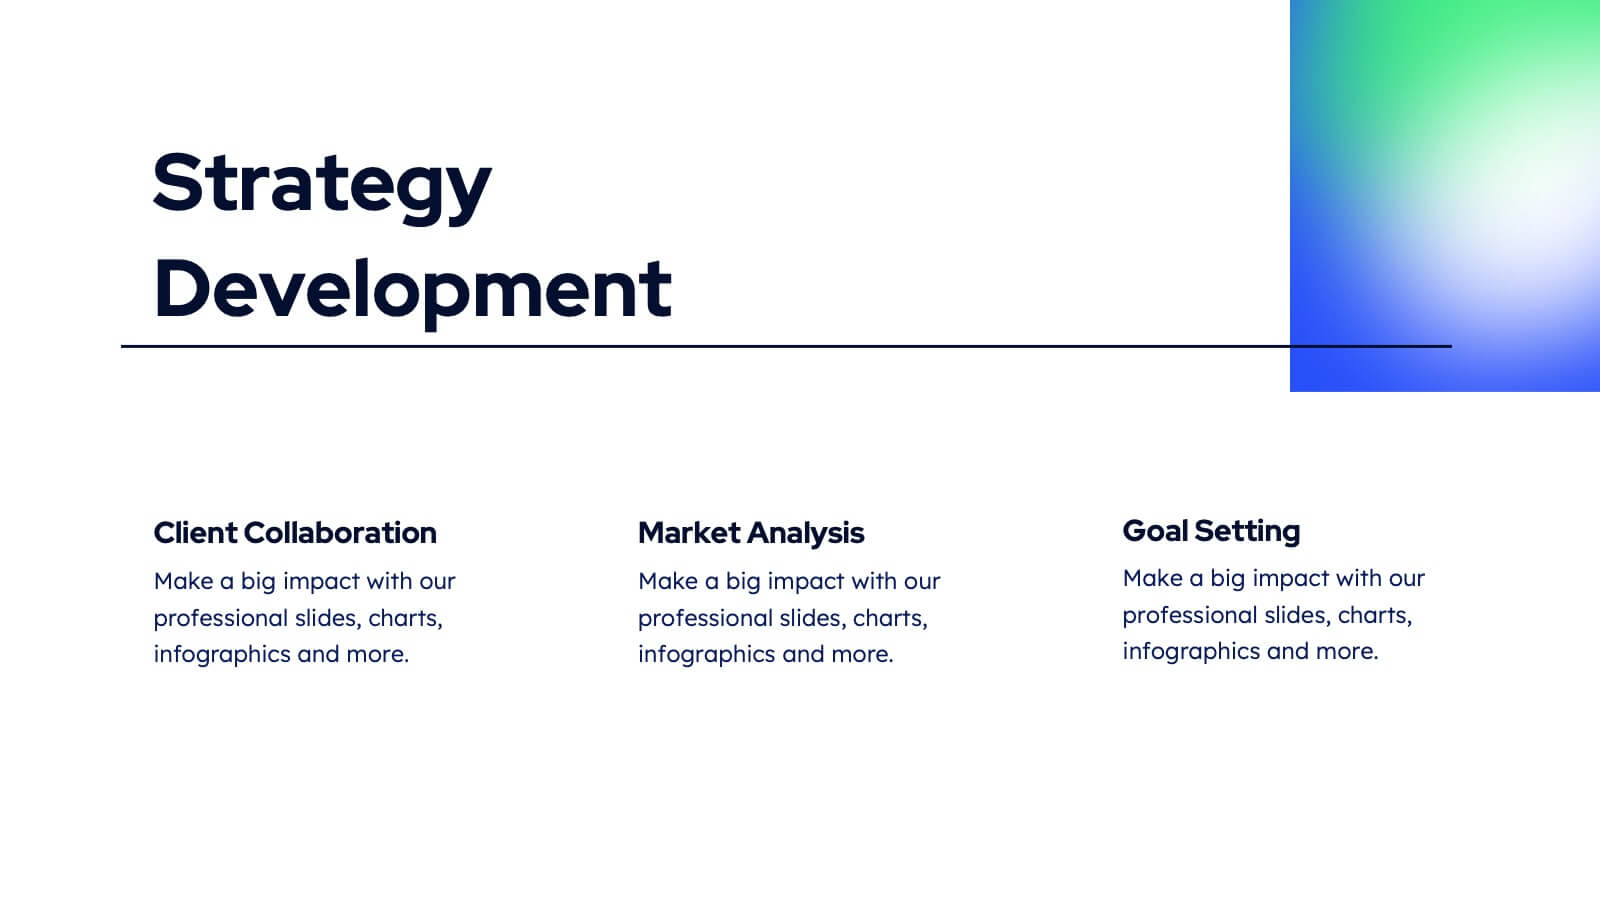
Tanzanite Full-Service Agency Project Plan Presentation
Showcase your agency's strengths with this bold and modern portfolio presentation template! From client success stories and case studies to market analysis and strategy development, this template highlights your expertise and approach. Perfect for agencies looking to present their services, creative processes, and partnerships. Compatible with PowerPoint, Keynote, and Google Slides, making it easy to impress any audience.


4 slides
4-Quadrant Empathy Map Presentation
Dive into your audience’s mindset with a clean, structured layout that brings clarity to what they see, feel, hear, and do. This presentation helps teams understand user behavior and motivations with simple quadrant-based insights. Fully compatible with PowerPoint, Keynote, and Google Slides.


7 slides
SEO Specialist Infographic
A Search Engine Optimization (SEO) Specialist is a professional responsible for improving the visibility and ranking of a website in search engine results pages. The goal of this infographic template is to drive organic, unpaid traffic to a website by optimizing its content, structure, and technical aspects to align with search engine algorithms. Embark on a visually stimulating exploration of the dynamic world of SEO. This captivating infographic is carefully crafted to offer a comprehensive understanding of Search Engine Optimization, empowering both beginners and experts to enhance their online presence and rankings.


5 slides
Real-Time KPI's Monitoring Dashboard Presentation
Track performance at a glance with this Real-Time KPI Monitoring Dashboard Presentation. Featuring clean bar visuals, circular gauges, and a numeric display, this layout is ideal for presenting five key metrics and their progress. Perfect for executive updates, marketing reports, or business reviews. Fully editable in PowerPoint, Keynote, Google Slides, and Canva.


7 slides
Process Solution Infographic
Streamline intricate workflows with our process solution infographic. Anchored in a pristine white base and infused with varying shades of professional blue, our template elegantly delineates step-by-step solutions and systematic approaches. Decked with meticulous infographics, representative icons, and versatile image placeholders, it transforms complexities into a navigable visual journey. Masterfully curated for Powerpoint, Keynote, or Google Slides. An invaluable asset for process managers, business analysts, strategists, or any organization keen on optimizing workflows. Navigate processes with confidence; let each slide chart the path to optimized solutions.


5 slides
Smart Agriculture and Sustainability Trends
Highlight the future of farming with the Smart Agriculture and Sustainability Trends Presentation. This slide features a sleek visual progression of plant growth stages, symbolizing innovation, eco-conscious development, and data-driven agricultural trends. Ideal for sustainability reports, agritech proposals, and environmental briefings. Fully editable and compatible with PowerPoint, Keynote, and Google Slides.


24 slides
Business Strategy Presentation
Streamline your strategic planning with our Business Strategy presentation template. It covers SWOT analysis, market trends, competitive landscape, and strategic initiatives. Ideal for business planners and strategists, this template is compatible with PowerPoint, Keynote, and Google Slides, ensuring comprehensive support for your strategic presentations.


7 slides
Developmental Milestone Infographic
Developmental milestones are specific skills or abilities achieved by individuals within a certain age range that indicate their growth and progress in various domains of development, including physical, cognitive, social, and emotional. This infographic template is designed to showcase the key developmental milestones children typically reach at various ages, guiding parents and caregivers in understanding and celebrating these significant achievements. Compatible with Powerpoint, Keynote, and Google Slides. Encourage celebrating each milestone achieved, emphasizing the positive impact on development and motivation.


8 slides
Chain of Command Mapping Presentation
Clarify your organizational flow with the Chain of Command Mapping Presentation. This template is ideal for visualizing reporting lines, departmental authority, and team structures in a clean, easy-to-follow format. Featuring modern icons, varied layouts, and editable labels, it helps simplify decision-making and responsibility tracking. Fully customizable in PowerPoint, Keynote, Canva, and Google Slides.


26 slides
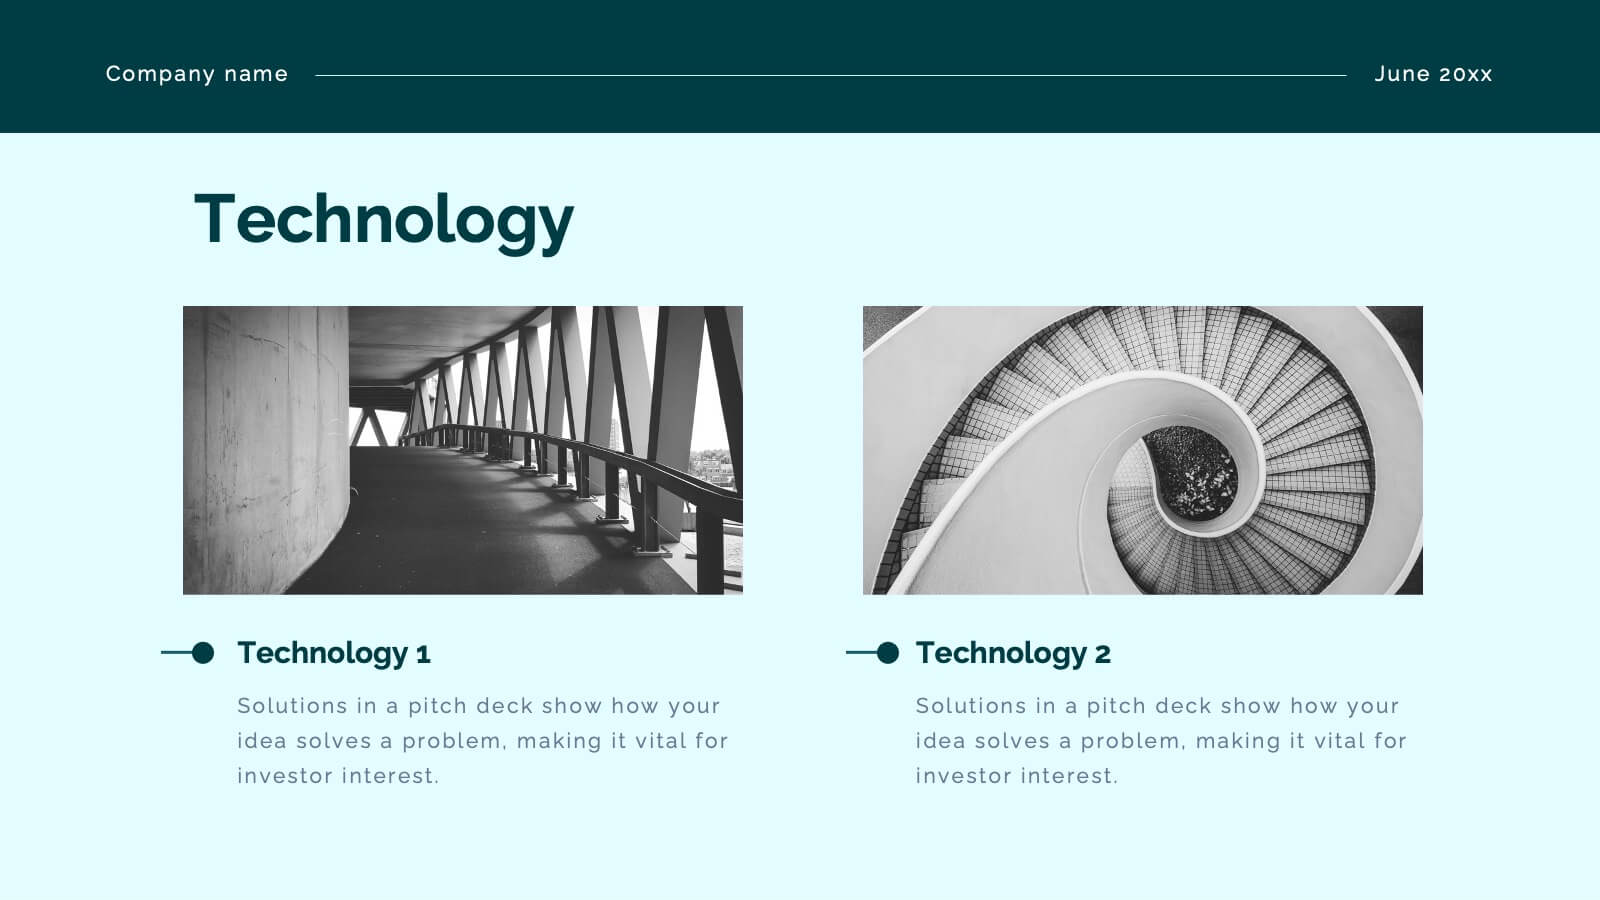
Abstract Technology Presentation
Artificial intelligence is helping to drive the future and make it better, it has the potential to transform how we live and work. This is a detailed presentation template for artificial intelligence technology, with an abstract design and chart slides that can be used to demonstrate how this technology works. This template will help you inform your audience about what artificial intelligence is. Easy to edit and customize, this template will allow you to create your own story around the concept of artificial intelligence, while still presenting your information in an organized format.