


Features
- 26 Unique slides
- Fully editable and easy to edit in Microsoft Powerpoint, Keynote and Google Slides
- 16:9 widescreen layout
- Clean and professional designs
- Export to JPG, PDF or send by email


Do you have any questions?
Recommend


2 slides
Online Course Structure and Syllabus Deck Presentation
Welcome students with a vibrant and modern course intro slide. This template is perfect for online educators outlining course objectives and syllabus details. Features an image placeholder and text sections for clear communication. Fully editable in PowerPoint, Keynote, and Google Slides—ideal for virtual learning environments and eLearning programs.


14 slides
Business Model Canvas Presentation
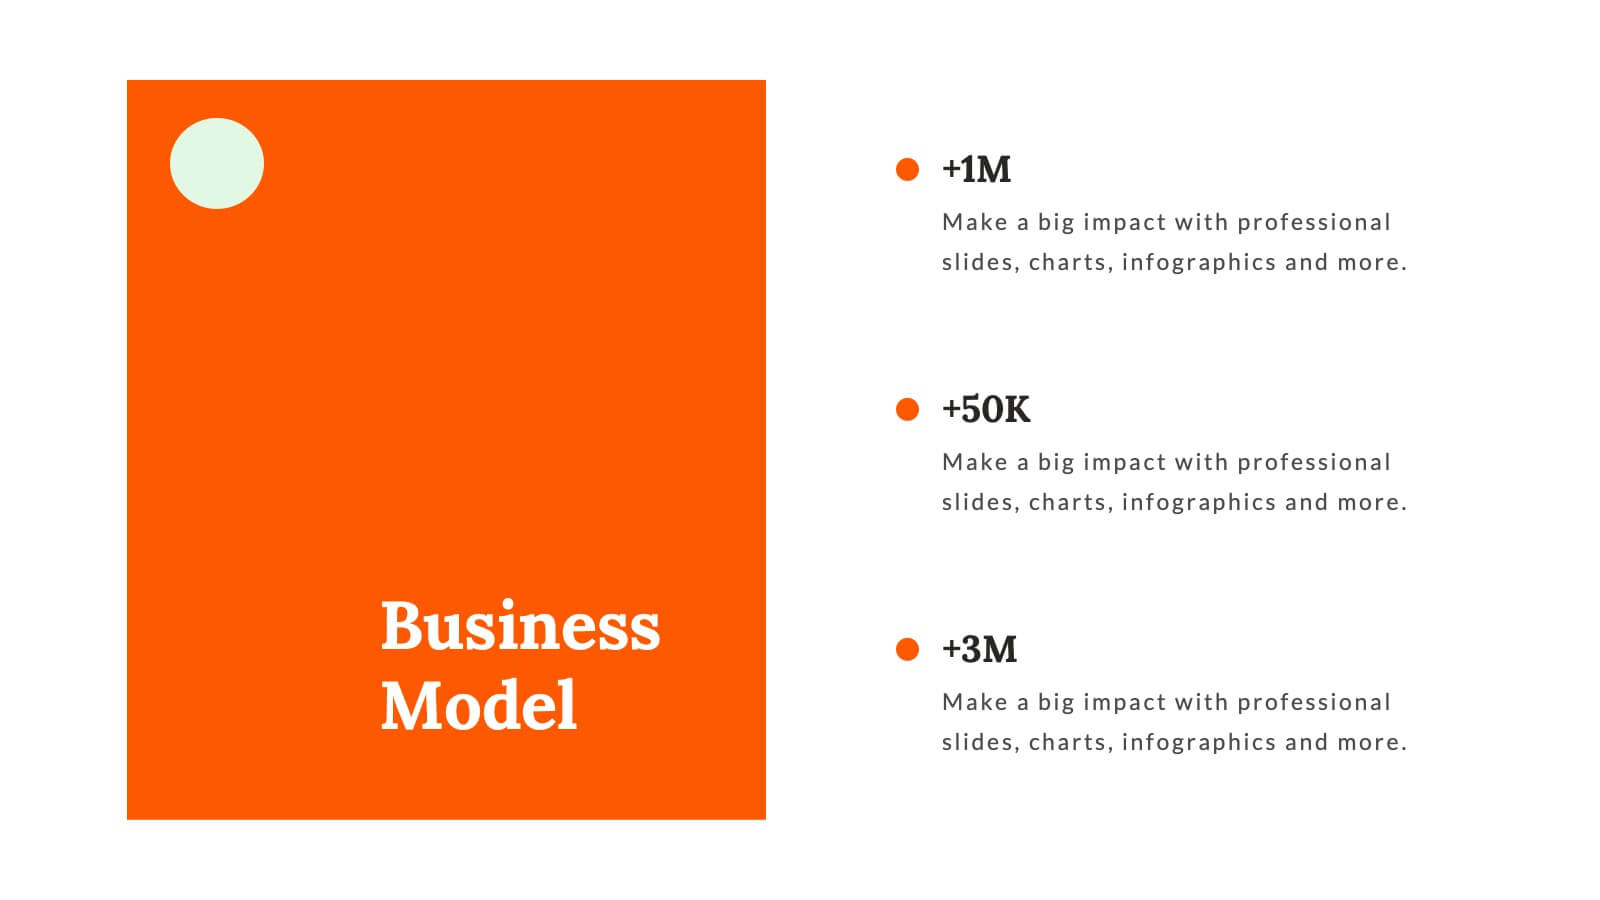
Our Business Model Canvas presentation template is an invaluable tool for entrepreneurs and business strategists to map out their business model in a clear and structured way. It begins with an engaging title slide that announces the topic, leading to an explanatory slide on what a business model entails. The template includes dedicated slides for each segment of the business model canvas, allowing for a detailed analysis of your value proposition, customer segments, key partnerships, channels, customer relationships, key activities, key resources, and your cost structure. Each slide is designed for clarity, ensuring that the audience can easily follow the intricacies of your business model. The final sections provide space for outlining your revenue streams, highlighting the importance of diversification and sustainability. The presentation wraps up with a concise conclusion and credits slide for sourcing acknowledgments. This template is perfect for PowerPoint, Keynote, and Google Slides, designed to facilitate a comprehensive understanding of your business model for both internal and external stakeholders.


20 slides
Venus Design Proposal Presentation
Present your design proposal with confidence using this sleek and professional layout! It includes everything from problem statements and proposed solutions to budget breakdowns, milestones, and team expertise, ensuring every detail is covered. Ideal for client presentations or internal project pitches, this template is fully compatible with PowerPoint, Keynote, and Google Slides.


19 slides
Fableia Marketing Research Report Presentation
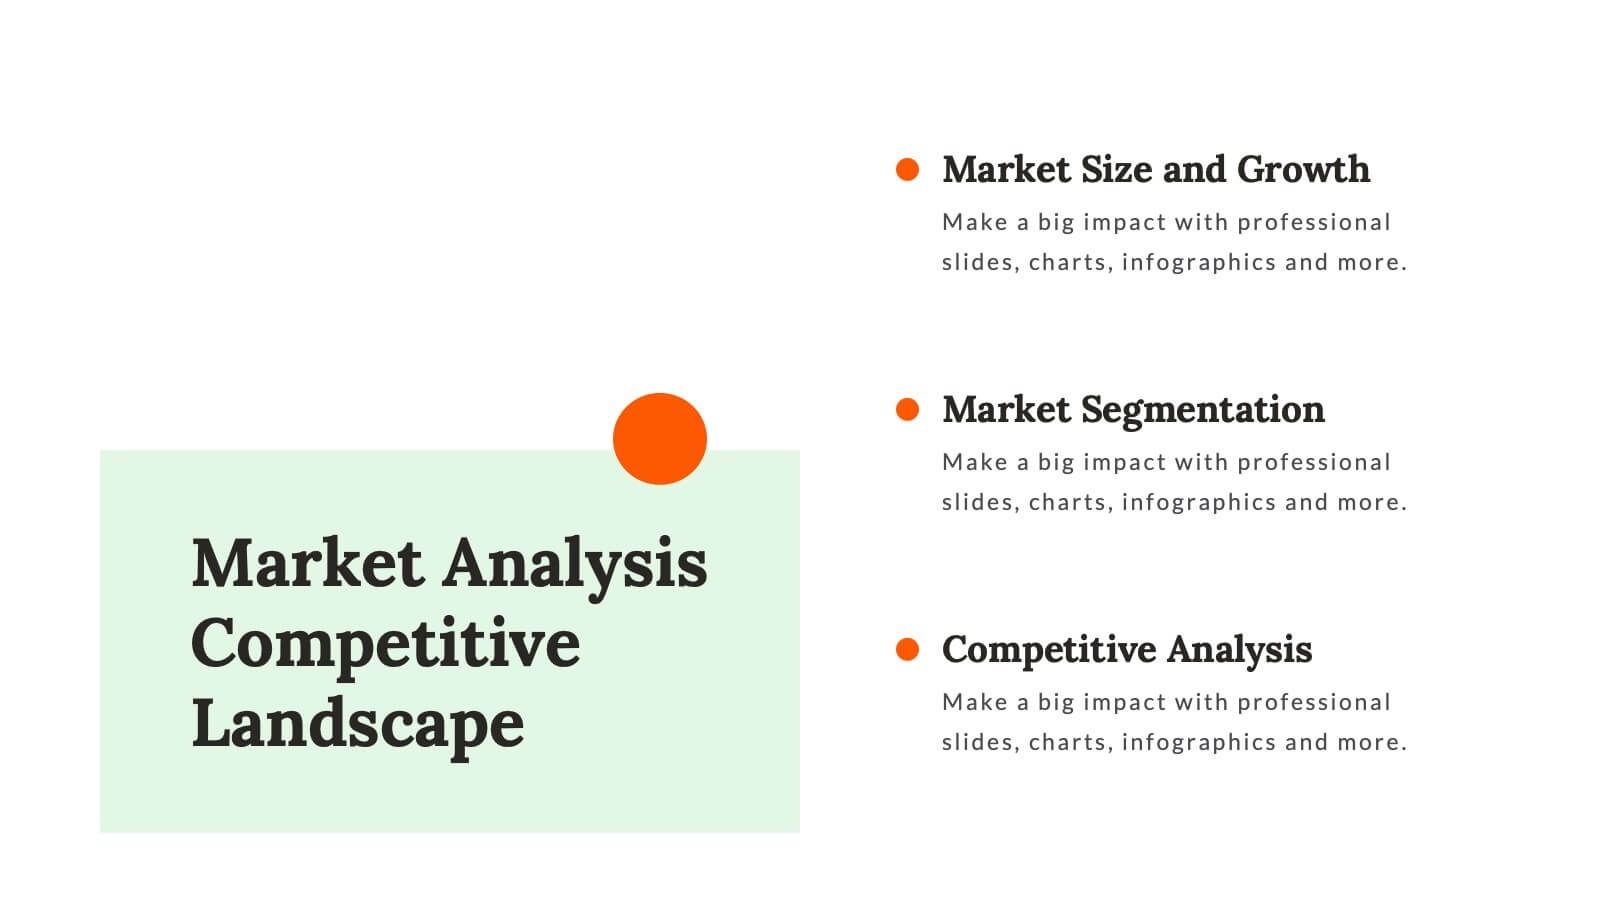
Deliver data-driven insights with a professional and visually engaging marketing research report presentation. This template is tailored for marketing professionals, agencies, and businesses looking to showcase research findings with precision and clarity. Highlight key sections such as market trends, consumer behavior analysis, and campaign performance using dynamic visuals and well-structured layouts. Share your insights on emerging technologies, social media strategies, and customer targeting with easy-to-edit graphs, charts, and infographics. Use dedicated slides for SEO analytics, value propositions, and recommendations to present actionable strategies that resonate with your audience. This template is fully customizable and works seamlessly with PowerPoint, Google Slides, and Keynote, ensuring you can adapt it to your unique needs. Present your research with confidence and leave a lasting impact on stakeholders and decision-makers.


8 slides
Asia Geographics and Business Analysis Map Presentation
Visualize regional insights with this Asia map template. Highlight business data, performance indicators, or strategic regions using callouts and color-coded zones. Perfect for market analysis, logistics, or geographic reporting. Fully customizable in PowerPoint, Keynote, or Google Slides to match your branding and presentation goals with clear, location-based storytelling.


6 slides
Historical Data Timeline Visualization
Showcase historical progression with clarity using the Historical Data Timeline Visualization. Designed for presenting chronological data points, this template combines circle elements with image icons and milestone labels—perfect for educational or historical presentations. Fully editable in Canva, PowerPoint, Keynote, and Google Slides for seamless customization.


20 slides
Whirlwind Startup Funding Proposal Presentation
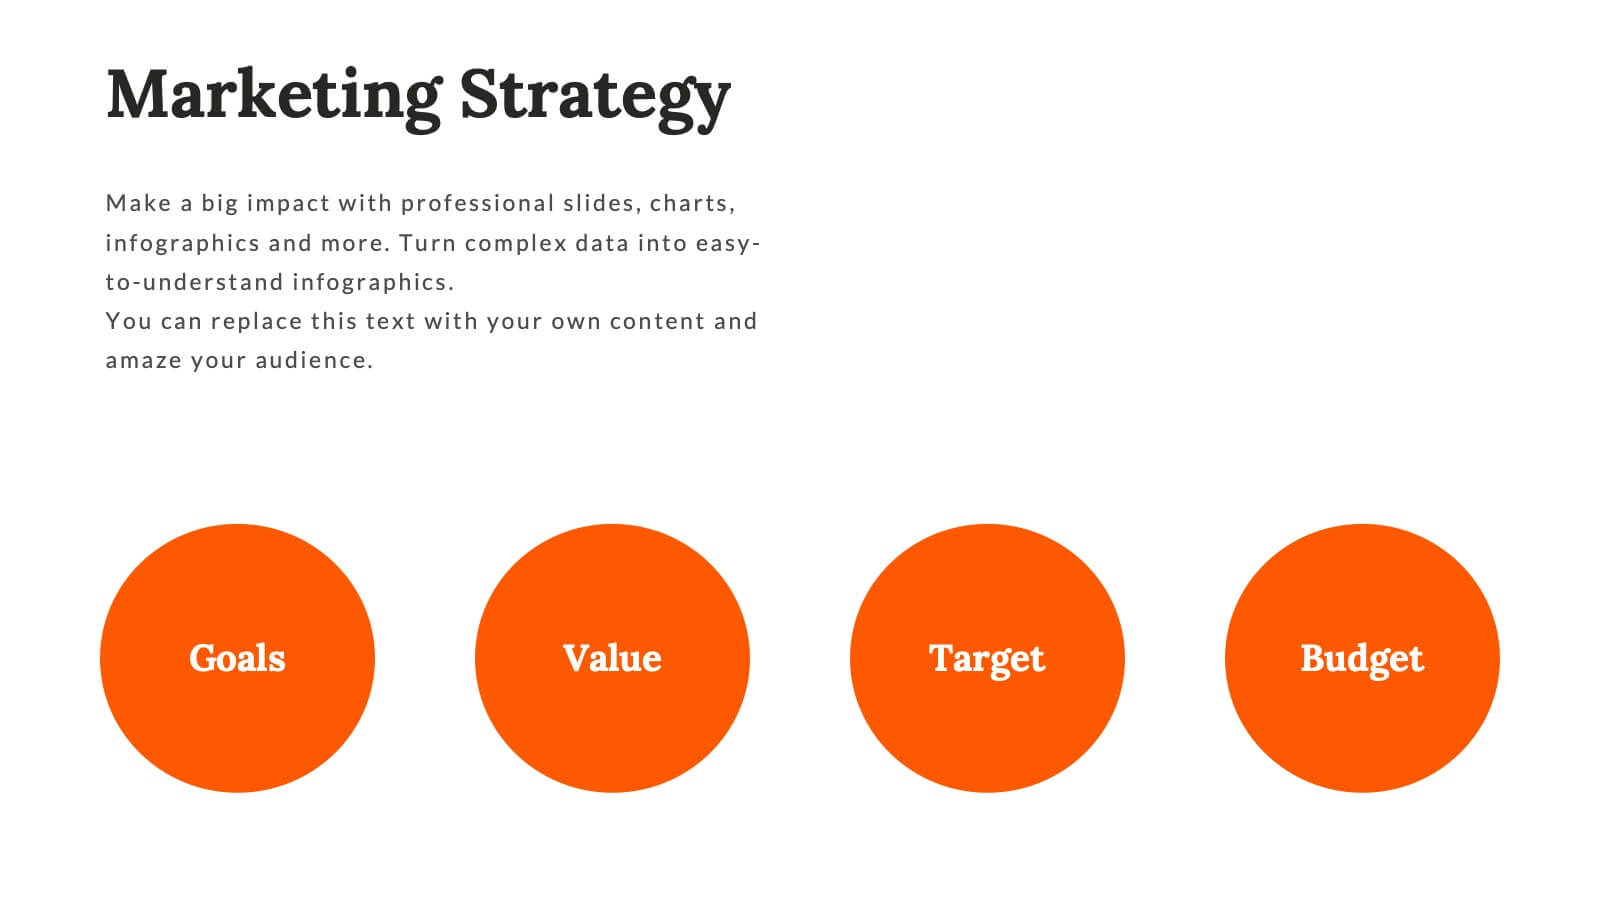
Transform your startup funding proposals with this vibrant and professional template. Designed to impress potential investors, it features sections for mission & vision, founding story, market analysis, and financial overview. Highlight your unique value proposition and business model with clarity and style. This template is compatible with PowerPoint, Keynote, and Google Slides, ensuring seamless presentations on any platform. Perfect for conveying your innovative ideas and growth plans effectively.


20 slides
Spectrum Graphic Design Project Plan Presentation
The Graphic Design Project Plan Presentation Template includes 20 clean and modern slides, tailored for creative professionals. It guides you through key design stages like audience targeting, design brief, elements, moodboards, prototypes, and project timelines. Featuring bold typography, engaging visuals, and a sleek black-and-yellow color palette, this template ensures clarity and style. Compatible with PowerPoint, Keynote, and Google Slides, it's fully editable to fit any design project.


5 slides
Employee Onboarding Training Roadmap Presentation
Visualize your training journey with the Employee Onboarding Training Roadmap Presentation. This layout uses a road-style timeline with trucks to represent each step of the onboarding process—perfect for outlining key milestones, training modules, or departmental introductions. Fully editable in PowerPoint, Keynote, Google Slides, or Canva.


4 slides
Historical Event Timeline Presentation
Visualize your timeline with this Historical Event layout, ideal for showcasing progress, milestones, or key moments over time. Featuring a horizontal design with date markers and icons, it’s perfect for history, education, or project recaps. Fully editable in PowerPoint, Keynote, and Google Slides to match your content and branding.


6 slides
Business Security Compliance Presentation
Visualize your security framework with this clear and modern infographic layout. This slide is ideal for presenting compliance steps, risk assessments, or regulatory requirements, featuring a shield-centered hub with 5 editable sections. Customize easily in PowerPoint, Keynote, or Google Slides.


5 slides
Tiered Strategy Framework Pyramid Presentation
Break down your plan into clear, actionable steps with this Tiered Strategy Framework Pyramid presentation. Each arrow-shaped tier helps visualize hierarchical strategies, workflows, or growth levels. Use this layout to communicate priorities, initiatives, or milestones in a sleek and modern format. Fully editable in Canva, PowerPoint, or Google Slides.


6 slides
Ideal Buyer Persona Customer Profile Presentation
Define your perfect customer with the Ideal Buyer Persona Customer Profile Presentation. This clear and visually structured layout helps you map out key traits, behaviors, and needs of your target audience. Easy to edit in Canva, PowerPoint, or Google Slides—ideal for marketing teams, strategists, and business development presentations.


5 slides
Business Influence Stakeholder Analysis
Highlight influence and interest with this layered stakeholder analysis pyramid. Designed for strategic presentations, this layout categorizes engagement levels—Pull Communications, Push Communications, Consultant, Participation, and Partnership—across a 3D stacked model. Ideal for stakeholder mapping, influence management, and communication strategy planning. Fully editable in PowerPoint, Keynote, and Google Slides.


5 slides
User Experience Empathy Map Strategy Presentation
Step into the user’s mindset with the User Experience Empathy Map Strategy Presentation. This template helps you visualize your audience’s thoughts, feelings, behaviors, and perceptions using a structured empathy map format. Ideal for UX workshops, customer journey analysis, or product design strategy sessions. Fully customizable in PowerPoint, Keynote, Canva, and Google Slides.


5 slides
Best Travel Planning Template
Bring wanderlust to life with a slide that turns trip planning into a clear, engaging journey. This presentation breaks down key travel steps—documents, packing, routes, and timing—using simple visuals that keep details organized and easy to follow. Fully customizable and compatible with PowerPoint, Keynote, and Google Slides.


8 slides
Architectural Design and Smart Home Trends Presentation
Showcase modern architecture insights and tech-savvy innovations with this layered home diagram slide. Ideal for real estate, construction, or smart home professionals, it highlights key features in a visually tiered format. Fully editable in PowerPoint, Keynote, and Google Slides—perfect for clean, tech-forward presentations with a sleek design.