


Features
- 6 Unique slides
- Fully editable and easy to edit in Microsoft Powerpoint, Keynote and Google Slides
- 16:9 widescreen layout
- Clean and professional designs
- Export to JPG, PDF or send by email


Do you have any questions?
Recommend


10 slides
Competitive Advantage Blue Ocean Strategy Presentation
Gain a competitive edge with this Blue Ocean Strategy presentation template! Designed to help businesses identify new market opportunities, this layout focuses on the four key actions: eliminate, reduce, raise, and create. Perfect for strategic planning, innovation workshops, and business growth discussions. Fully customizable and compatible with PowerPoint, Keynote, and Google Slides.


20 slides
Alchemy Sales Forecast Presentation
Elevate your sales strategy with this sleek and modern sales forecast presentation template. Featuring sections for sales objectives, pricing strategies, performance metrics, and future opportunities, it’s perfect for teams aiming to analyze and plan effectively. Fully compatible with PowerPoint, Keynote, and Google Slides for seamless professional presentations.


5 slides
Mental Health Disorders Infographics
Mental Health Disorder Infographics play a crucial role in raising awareness, combating misinformation, and advocating for better mental health support. These Infographics are visual representations of information about mental health disorders. They include statistics, images, and text to provide information on the prevalence of these disorders, common symptoms, risk factors, and available treatments. These infographics are designed with the goal to raise awareness about mental health disorders and to help people better understand and identify the signs and symptoms of these conditions.


6 slides
Geometric Distribution Infographic
The geometric distribution is a probability distribution that models the number of trials needed for a specific event to occur for the first time in a sequence of independent and identically distributed Bernoulli trials. This Infographic template is a visual representation of the geometric distribution, which is a probability distribution that models the number of Bernoulli trials required for a success to occur. This is can be used in scenarios where you're interested in the number of trials needed for a specific event to occur. This template can help explain the geometric distribution concept, formula, and application in a clear and visually appealing manner.


22 slides
Sky Drop Full-Service Agency Project Plan Presentation
Step into the world of strategic creativity with the Sky Drop Agency Project Plan template! Designed for modern agencies looking to impress clients and stakeholders, this template offers a sleek and professional design that highlights your agency's strengths, processes, and successes. With dedicated sections for mission and vision, team introduction, services, and client testimonials, this template provides a comprehensive overview of your agency's capabilities. It's perfect for showcasing case studies, market analysis, and future outlooks, helping you to build trust and establish credibility. Whether you're presenting a new project plan or updating clients on progress, this template ensures your information is communicated clearly and effectively. Fully customizable and compatible with PowerPoint, Keynote, and Google Slides, the Sky Drop template is your go-to for creating presentations that leave a lasting impact. Impress your audience and elevate your agency's brand with this powerful presentation tool!


5 slides
Human Body Anatomy Diagram Presentation
Bring your content to life with a clean, modern visual that makes learning feel surprisingly engaging. This presentation breaks down key body systems in a simple, approachable way, helping you explain functions, processes, or health concepts with clarity. Perfect for medical training, wellness education, or anatomy lessons. Fully compatible with PowerPoint, Keynote, and Google Slides.


6 slides
Insurance Comparison Infographic
Insurance comparison is the process of evaluating and comparing different insurance policies offered by various insurance companies to find the one that best meets your needs and requirements. This infographic template is a visual representation of different types of insurance policies and their key features, designed to help consumers compare and make informed decisions about their insurance needs. This infographic aims to simplify complex insurance information. This can be used on insurance websites, marketing materials, and educational resources to assist consumers in making well-informed insurance choices based on their unique needs and preferences.


7 slides
Hierarchy Needs Infographic
The Hierarchy of Needs, is a framework that categorizes human needs into five levels, often depicted as a pyramid. This visually engaging infographic template lays out the psychological journey each individual undertakes, climbing the pyramid of needs towards a successful life. Compatible with Powerpoint, Keynote, and Google Slides. Utilize visual elements to guide your audience in understanding their unique journey through the hierarchy, highlighting the importance of each stage. This template will guide you through the layers of hierarchy within organizations, providing an understanding of leadership and organizational structure.


23 slides
Lexicon Startup Pitch Deck Template Presentation
The Startup Pitch Deck Presentation Template provides a modern and professional design with 23 fully customizable slides, ideal for startups seeking funding or presenting their business idea. Key sections include company overview, problem statement, solution, market opportunity, business model, and unique selling proposition (USP). It also covers competitive landscape, product features, financials, milestones, and funding requirements, ensuring a comprehensive pitch. The vibrant orange and gray color scheme adds energy and creativity to the presentation. Compatible with PowerPoint, Keynote, and Google Slides, this template is perfect for impactful startup pitches.


23 slides
Phantasia Sales Pitch Deck Presentation
Impress stakeholders and close deals effectively with this sleek and dynamic pitch deck template. With structured slides for company overview, problem statements, and market opportunities, you can present your solutions with clarity and impact. Showcase your business model, revenue streams, and unique selling propositions to stand out in a competitive landscape. This template also includes slides for financial projections, growth strategies, and funding requirements, making it an excellent choice for entrepreneurs, sales teams, and business leaders. The modern design ensures your data is engaging and easy to follow, keeping your audience focused on your message. Fully editable and compatible with PowerPoint, Google Slides, and Keynote, this template provides the customization options you need to align with your branding and goals. Perfect for delivering professional and persuasive presentations.


20 slides
Quasar Design Strategy Proposal Presentation
Elevate your design strategy presentations with this modern, engaging template. Perfect for showcasing design briefs, concept development, and project timelines, it features a sleek layout with a cohesive color scheme. Highlight key elements like typography, textures, and feedback processes to captivate your audience. Compatible with PowerPoint, Keynote, and Google Slides, it ensures seamless presentations on any platform.

21 slides
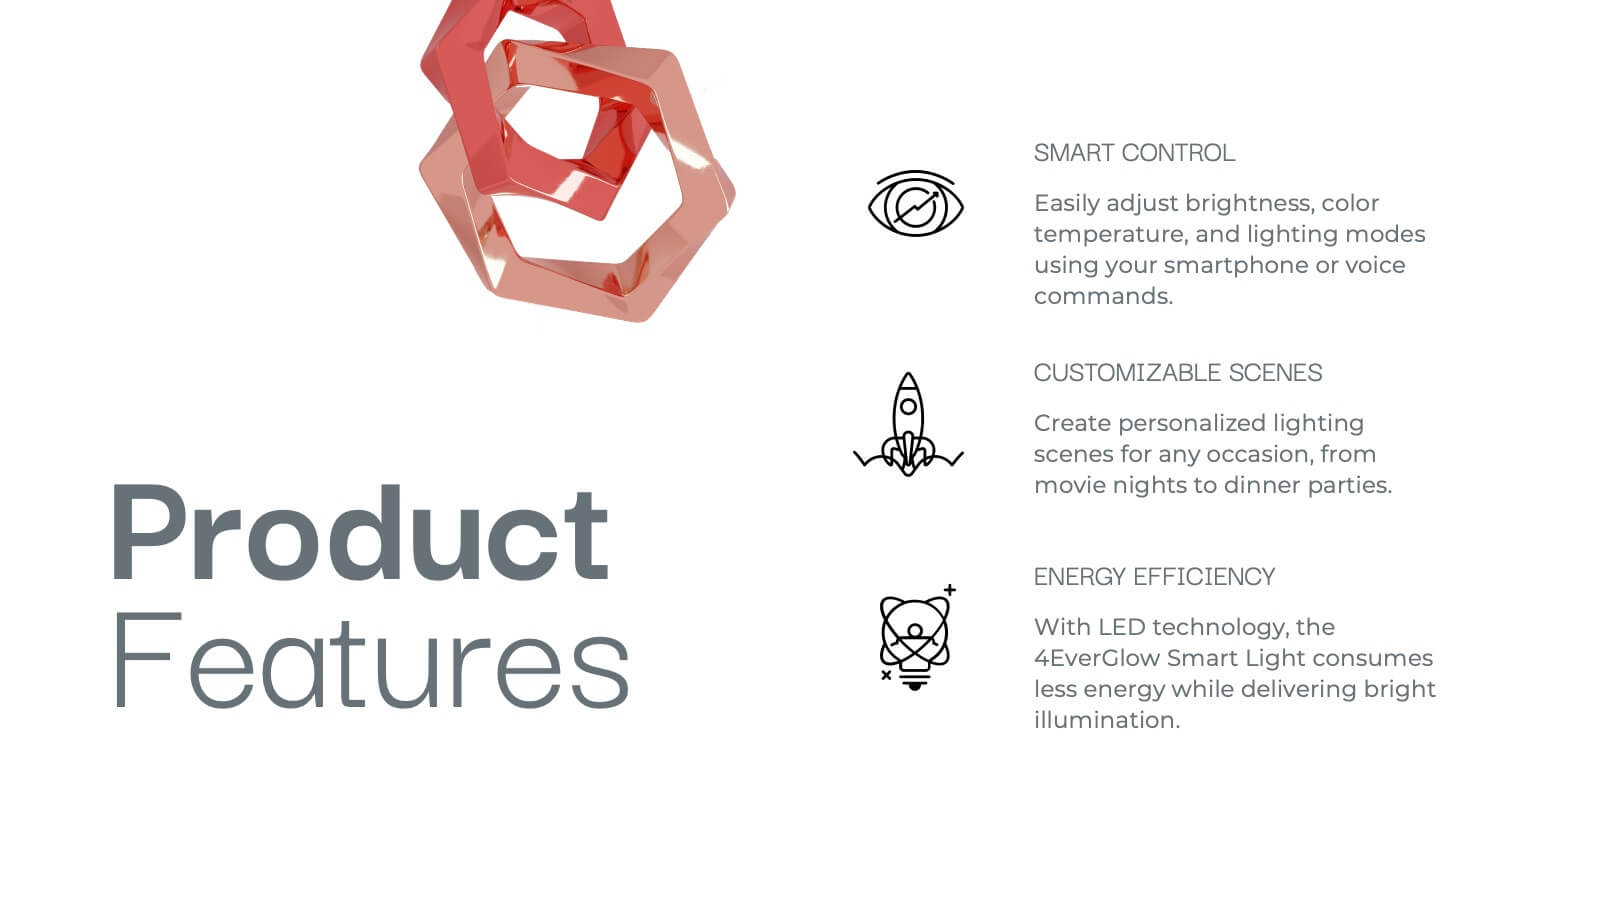
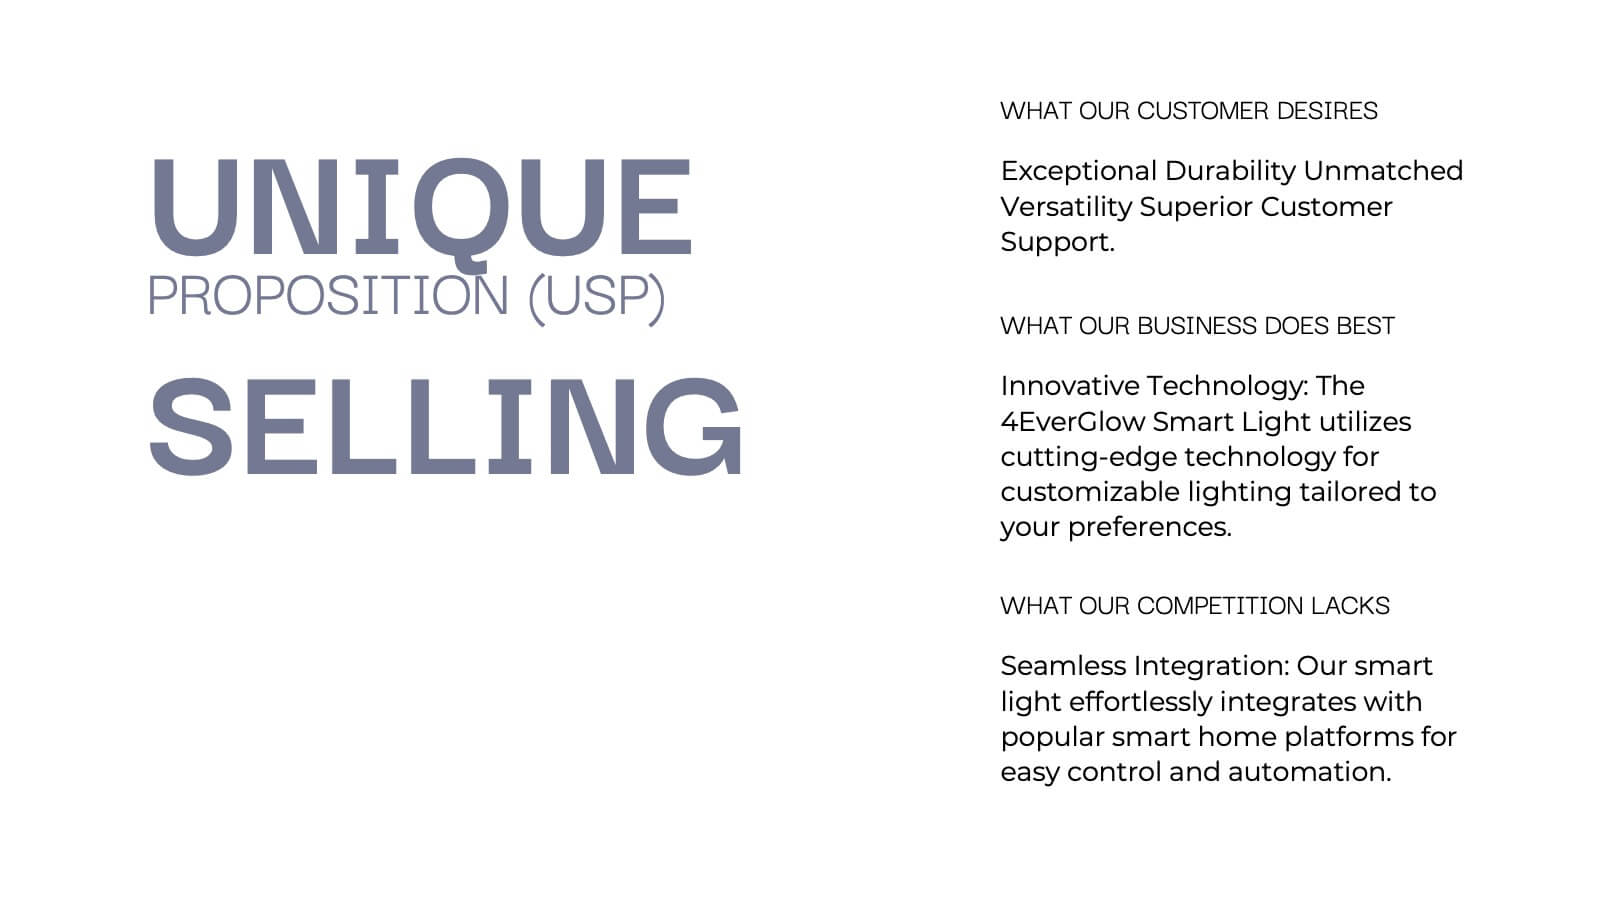
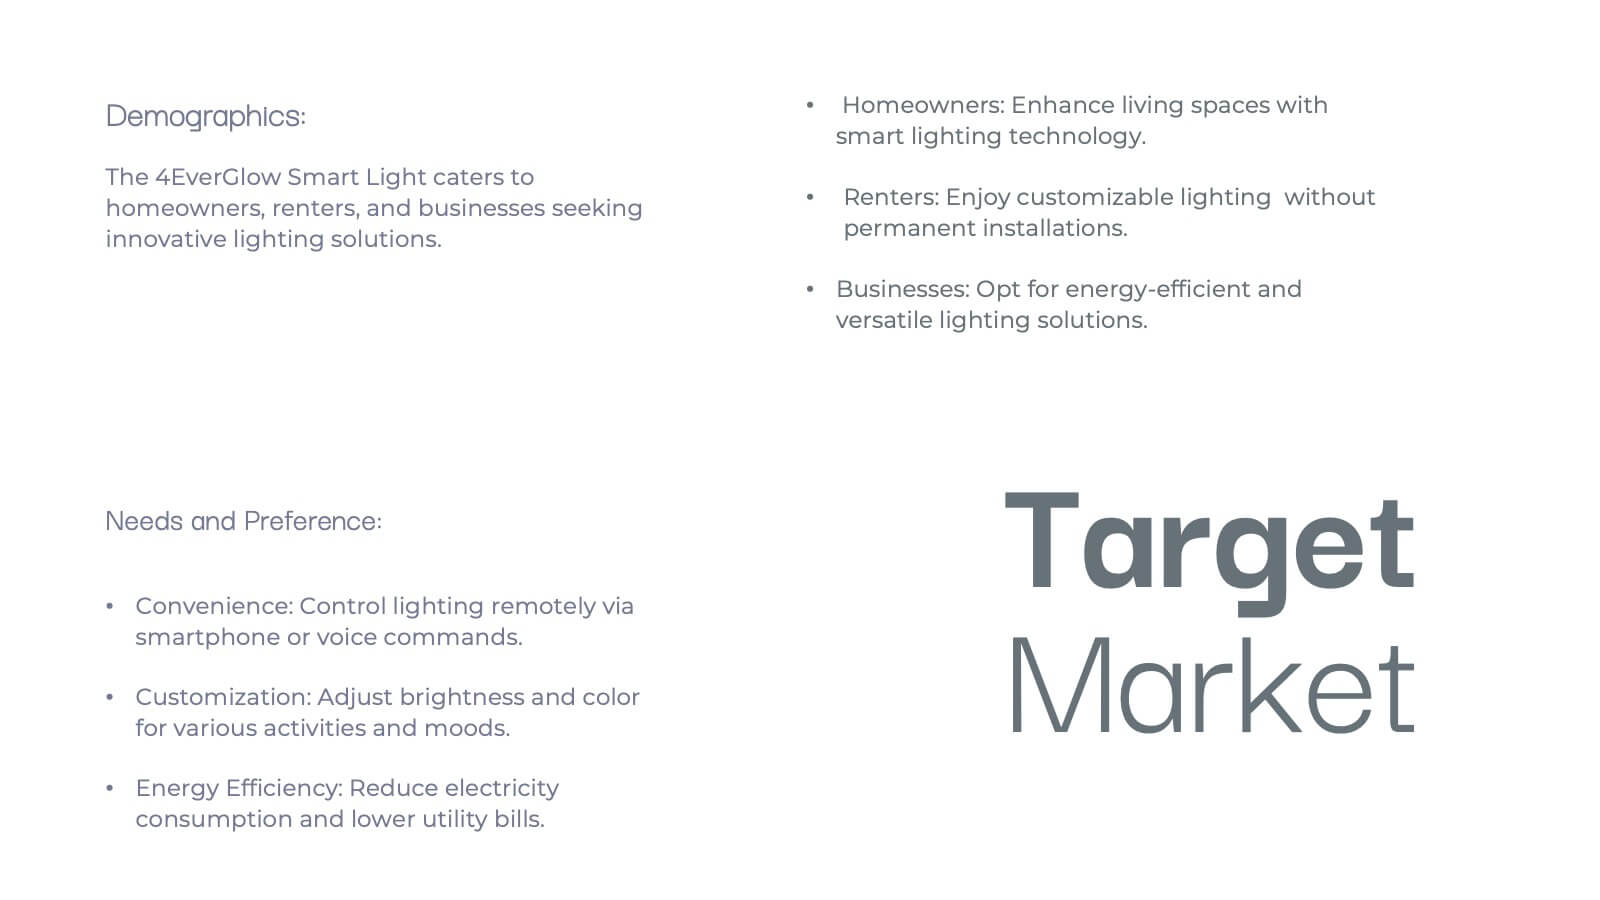
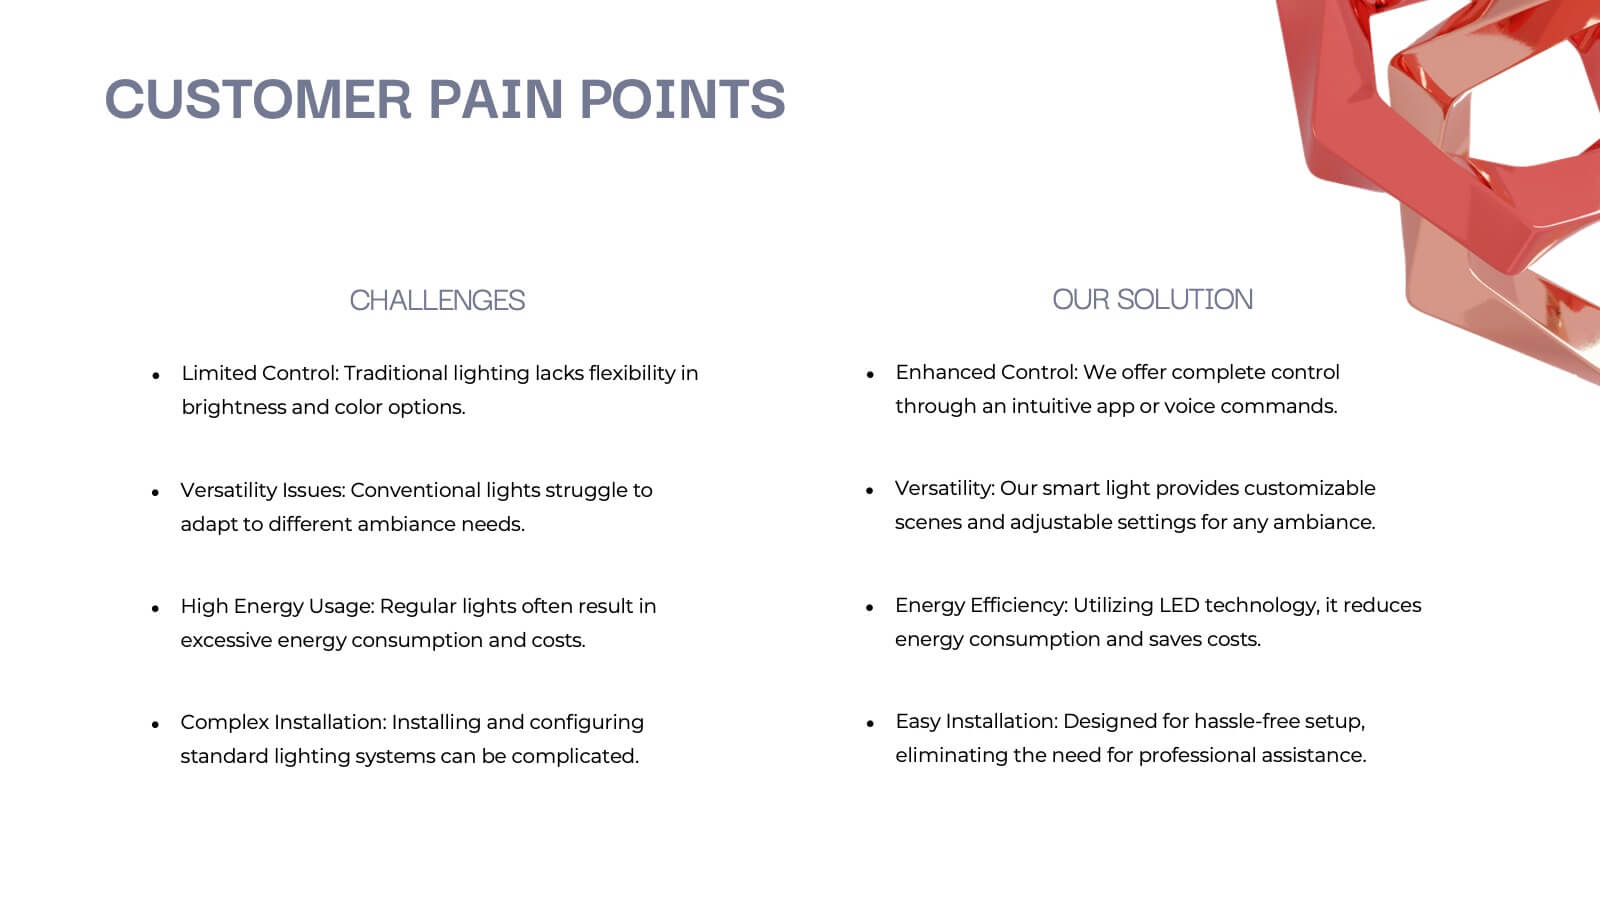
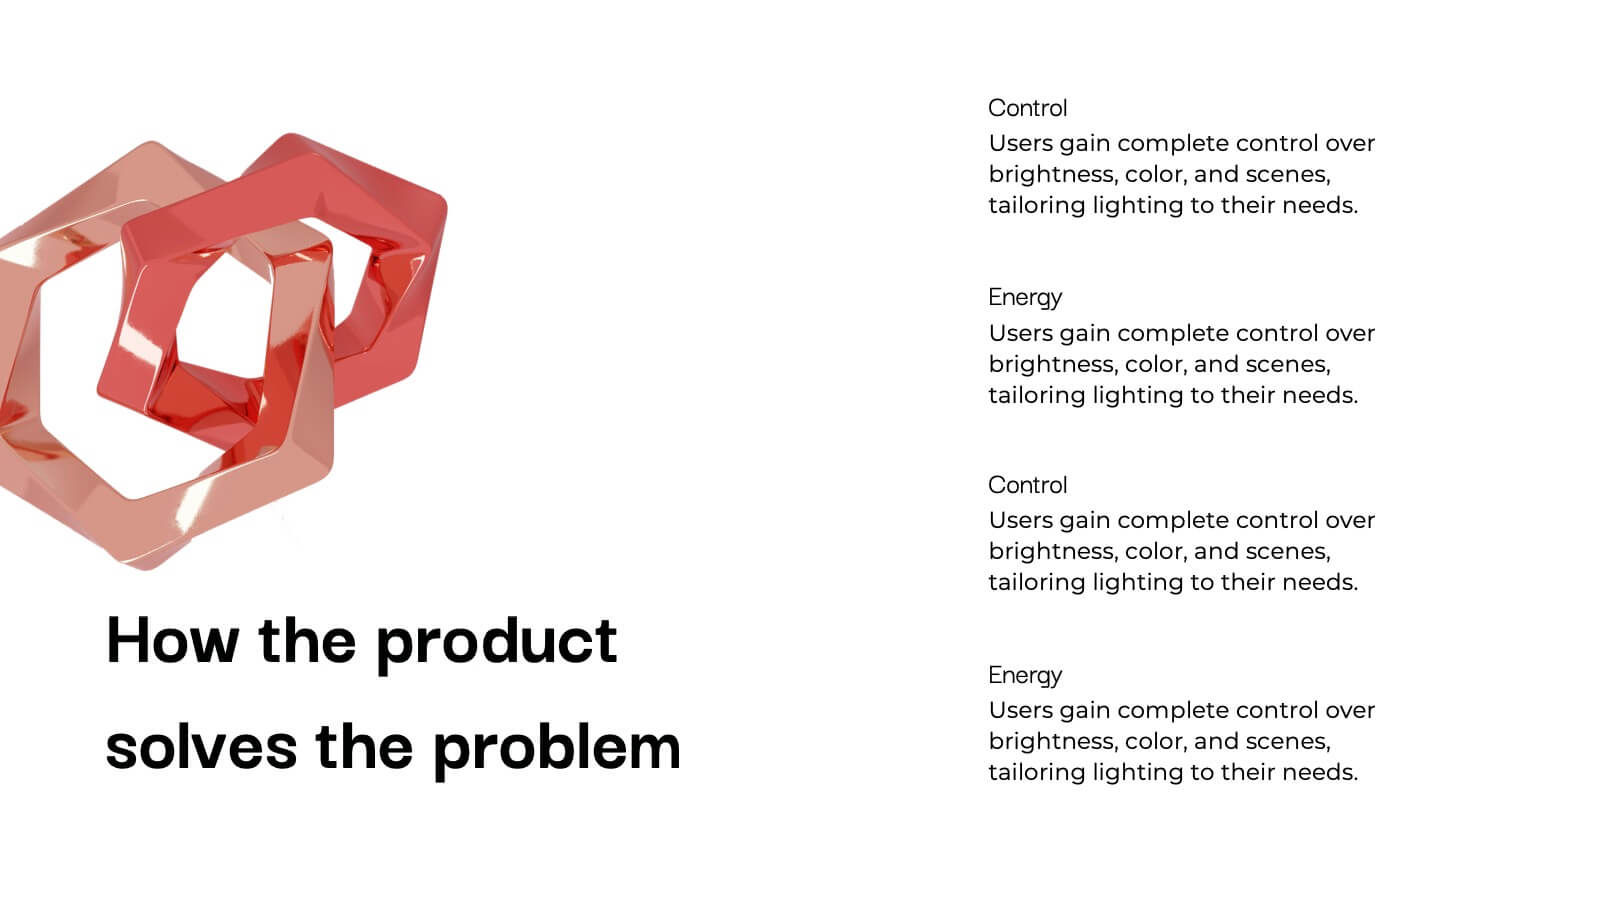
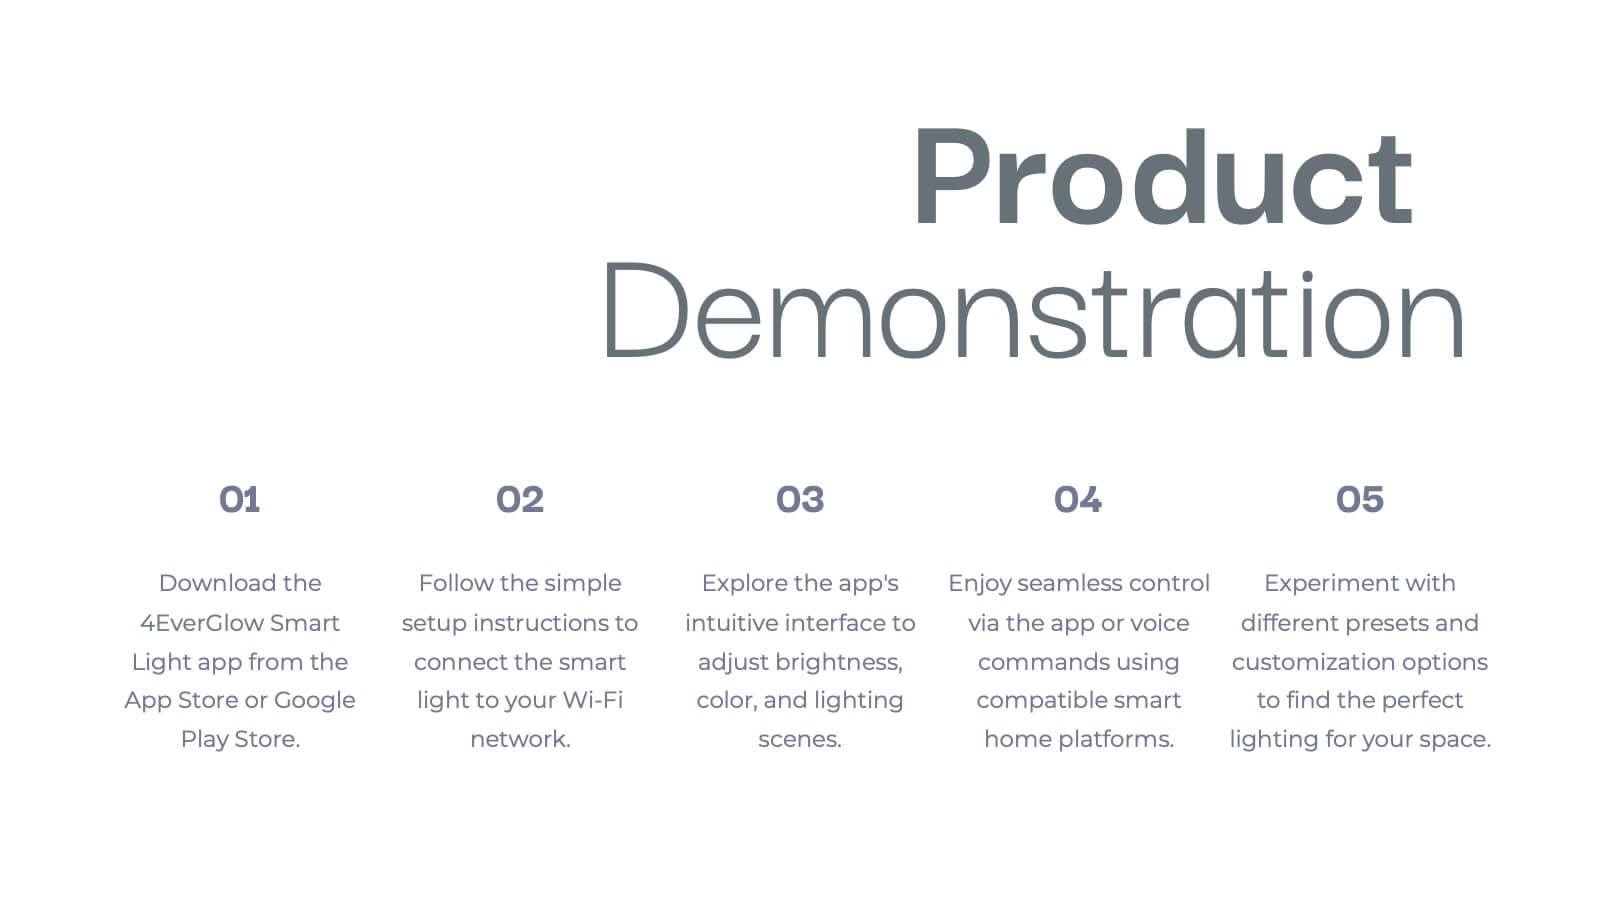
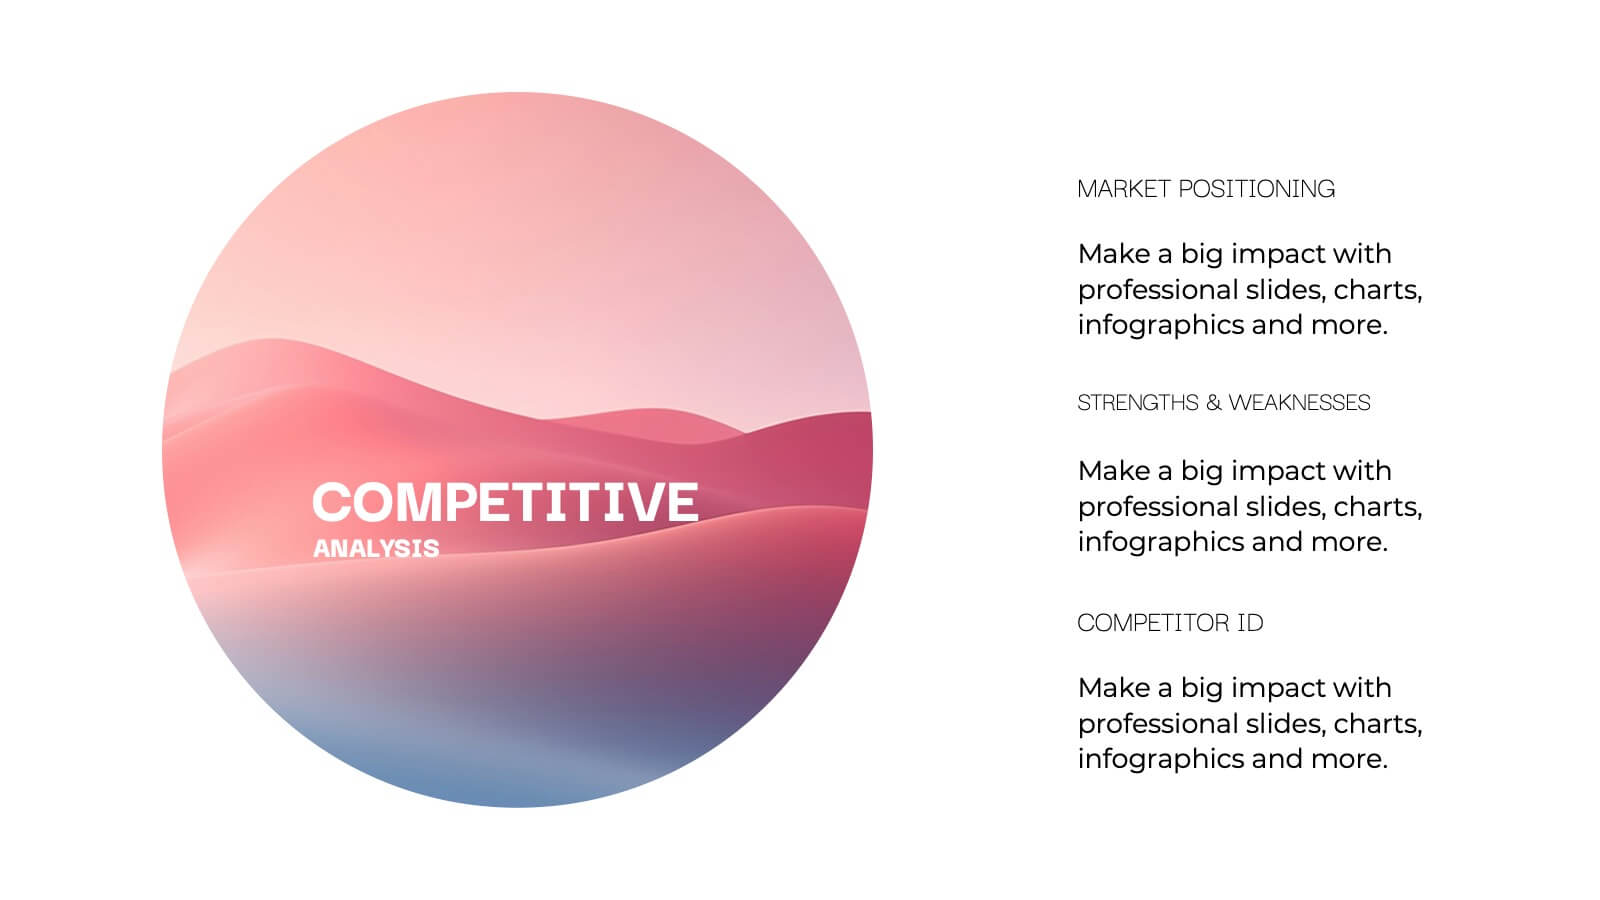
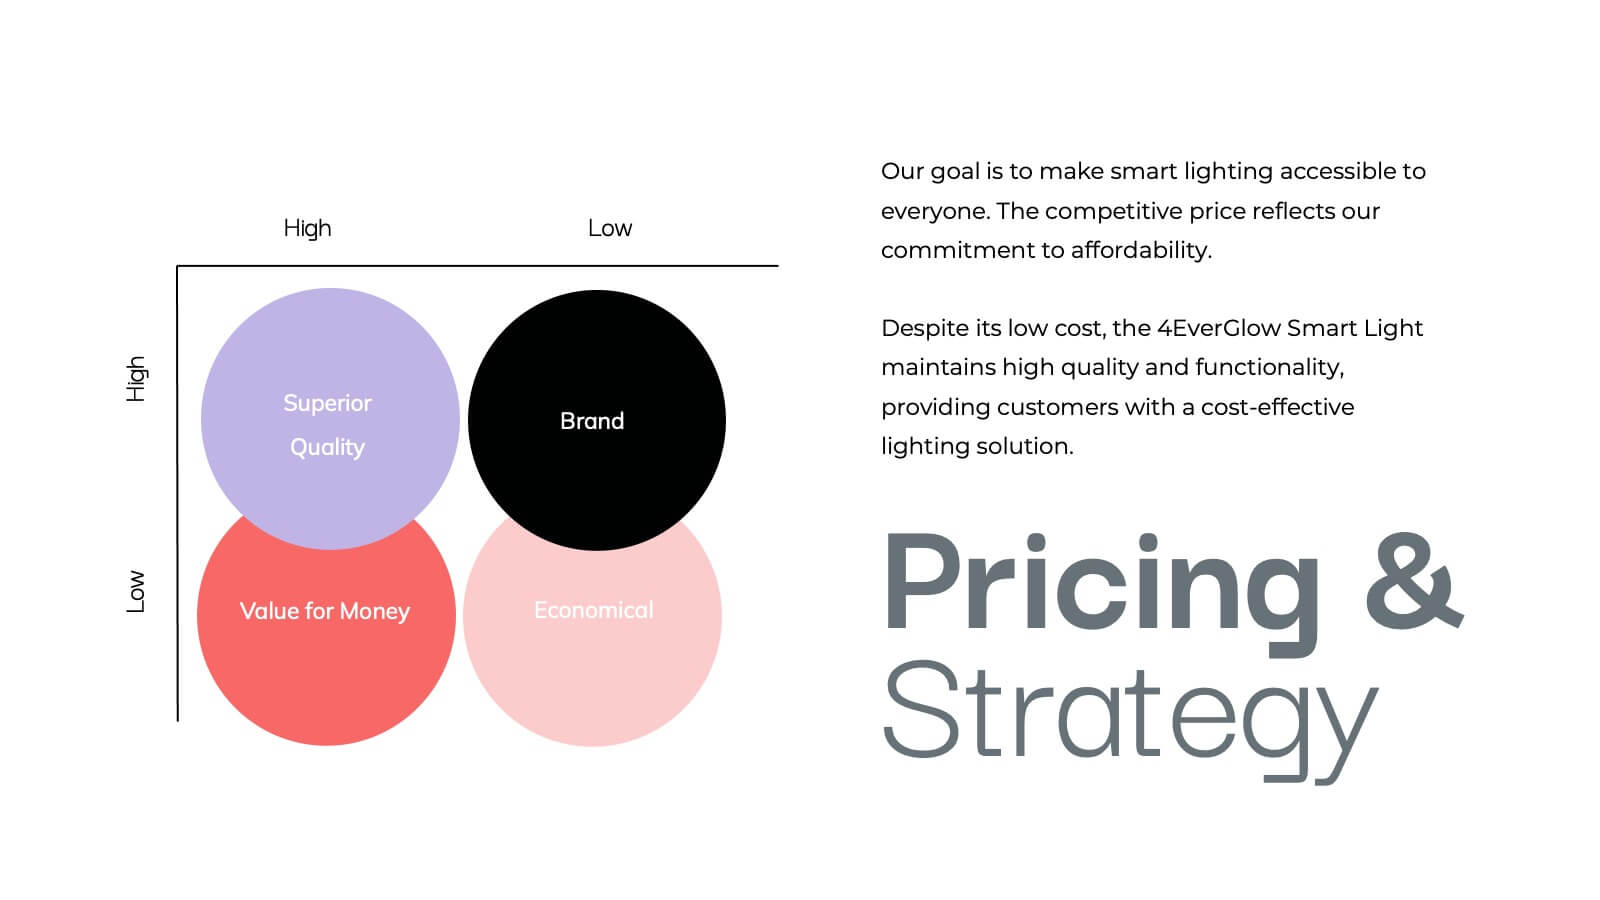
Vulcan New Product Proposal Presentation
Launch your next product with confidence using this comprehensive presentation template! Covering everything from product features and target market to pricing strategy and customer pain points, this template ensures a smooth and engaging flow for your audience. It’s ideal for product proposals, demonstrations, and marketing strategies. Compatible with PowerPoint, Keynote, and Google Slides for seamless presentations.


23 slides
Ethelin Digital Strategy Presentation
The digital strategy presentation template is designed to showcase your company's goals, market analysis, and strategic initiatives. Featuring slides for SWOT analysis, performance metrics, and action plans, it’s perfect for business planning and stakeholder engagement. Fully customizable and compatible with PowerPoint, Keynote, and Google Slides.


4 slides
Strategic Planning Business Framework Presentation
Sharpen your strategic vision with the Strategic Planning Business Framework presentation. This modern, radial diagram slide uses a target-and-arrow layout to symbolize precision, focus, and goal alignment across four key business areas. Each quadrant features customizable sections for initiatives, insights, or performance metrics—ideal for planning sessions, quarterly reviews, or executive briefings. The clean design and visual balance make your content easy to understand at a glance. Fully editable and compatible with PowerPoint, Keynote, and Google Slides.


5 slides
Environment News Infographics
Dive into the pressing issues of our times with environment news infographics. Crafted in shades of a serene blue palette, this collection is designed for environmental activists and journalists. It stands out with its creative, vertical style, making it perfect for detailed storytelling and comprehensive data representation related to environmental news and studies. Compatible with Powerpoint, Keynote, and Google Slides. The template features innovative graphics, icons, and image placeholders, all customizable to highlight ecological statistics, climate change advancements, or conservation efforts, making complex information accessible and engaging.


4 slides
Effective Team Management Presentation
Present your management insights with clarity using this puzzle-style Effective Team Management template. Ideal for breaking down leadership functions, collaboration elements, or role responsibilities across four segments. The modular puzzle format adds a creative visual touch while staying professional. Fully editable in PowerPoint, Keynote, and Google Slides.
20 slides
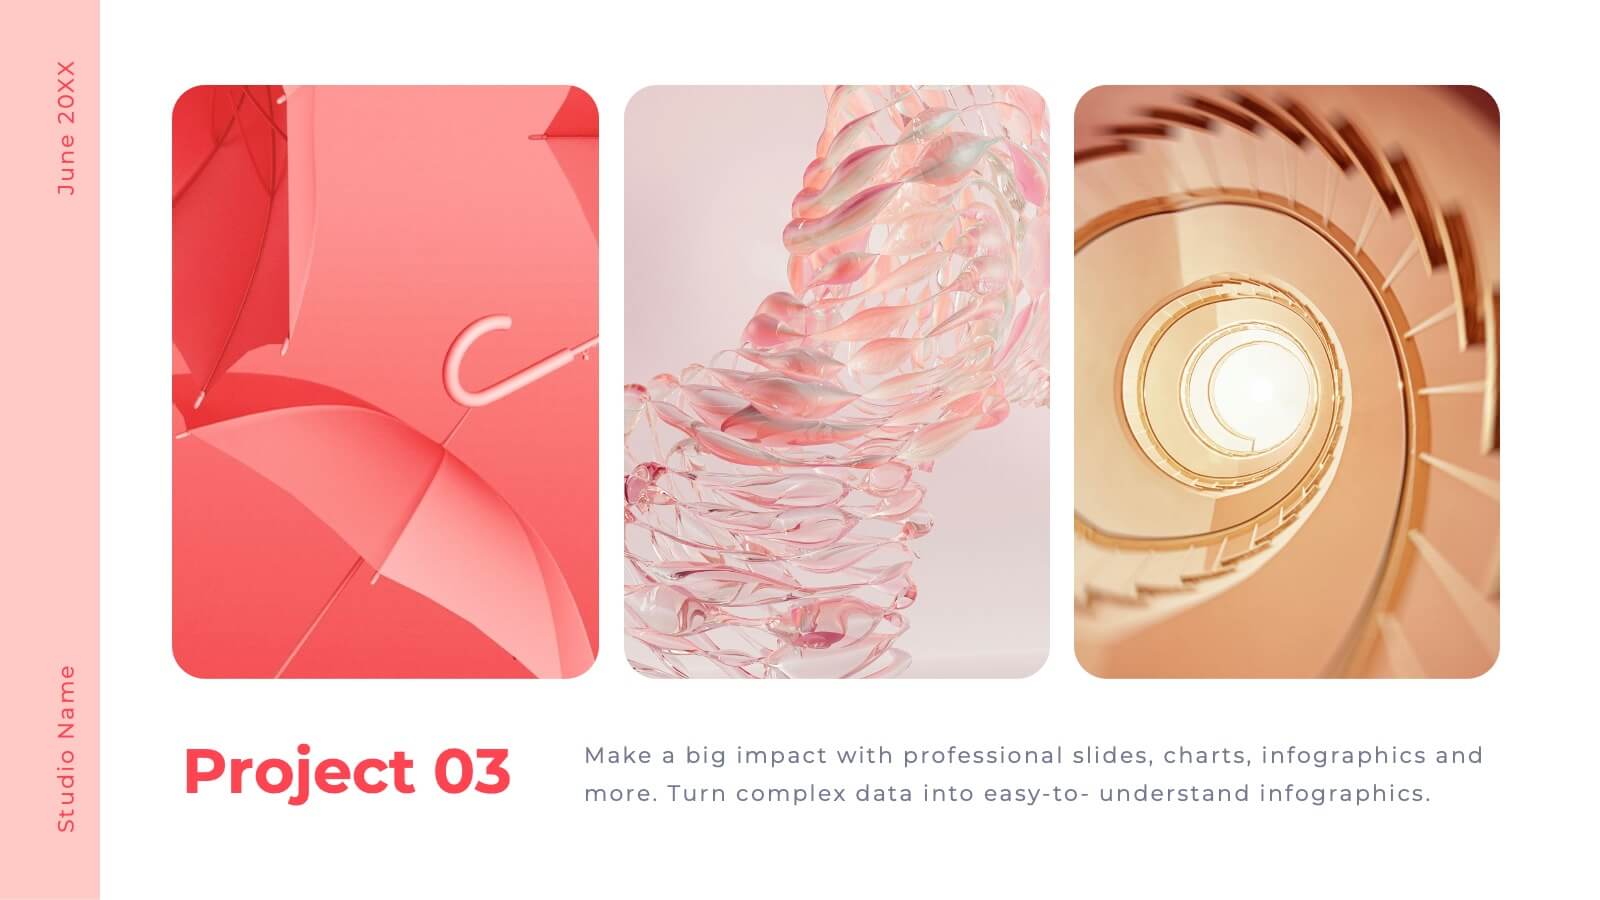
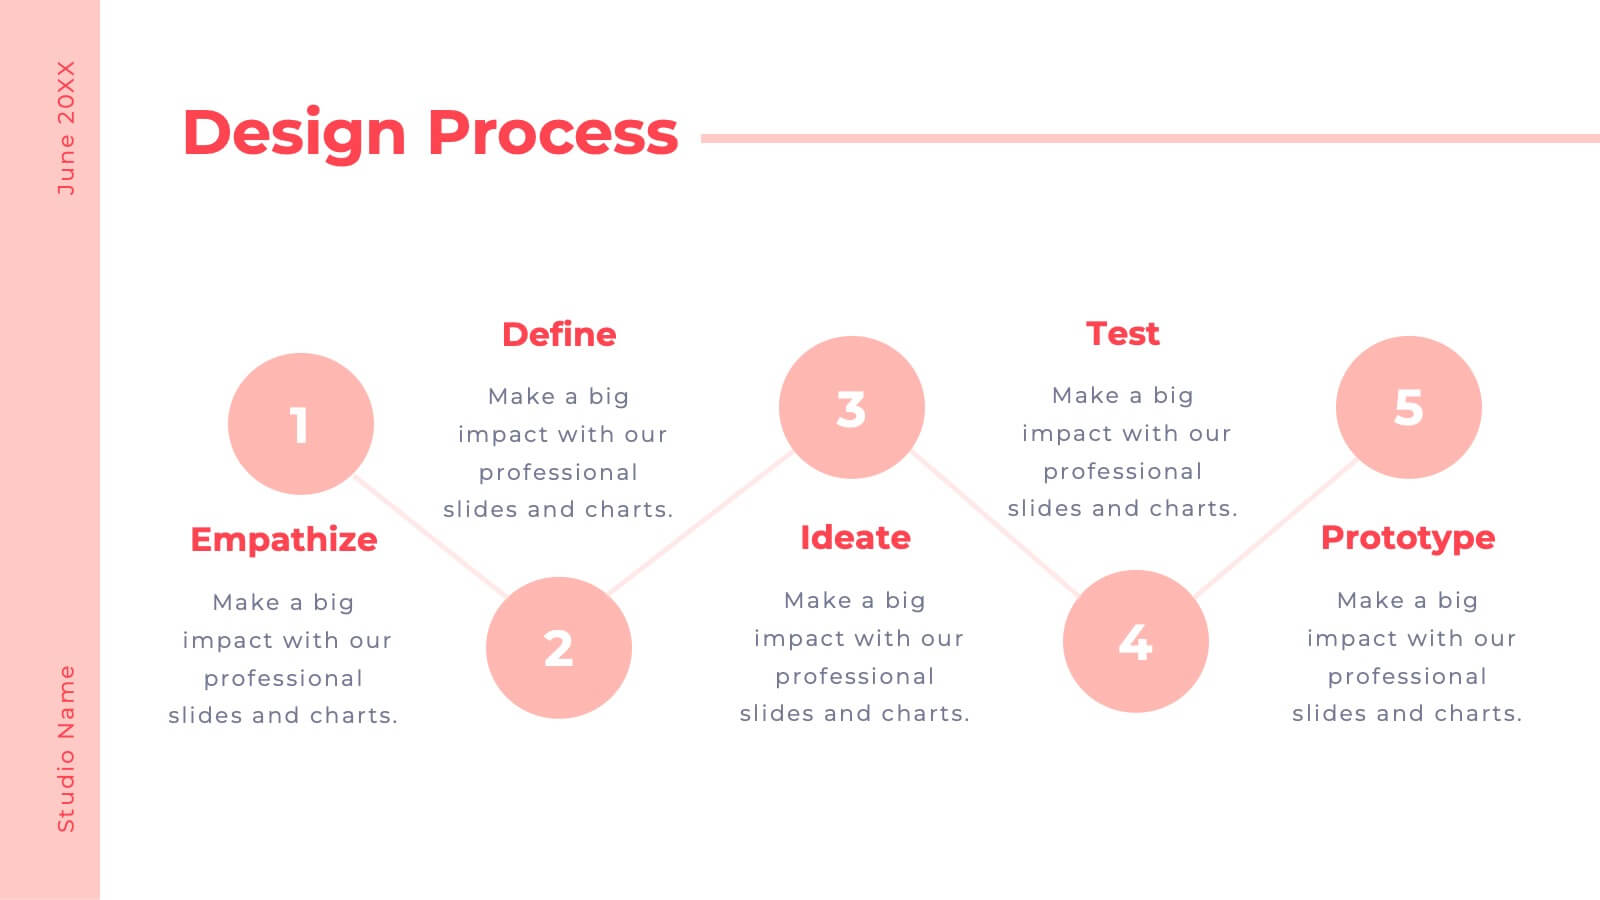
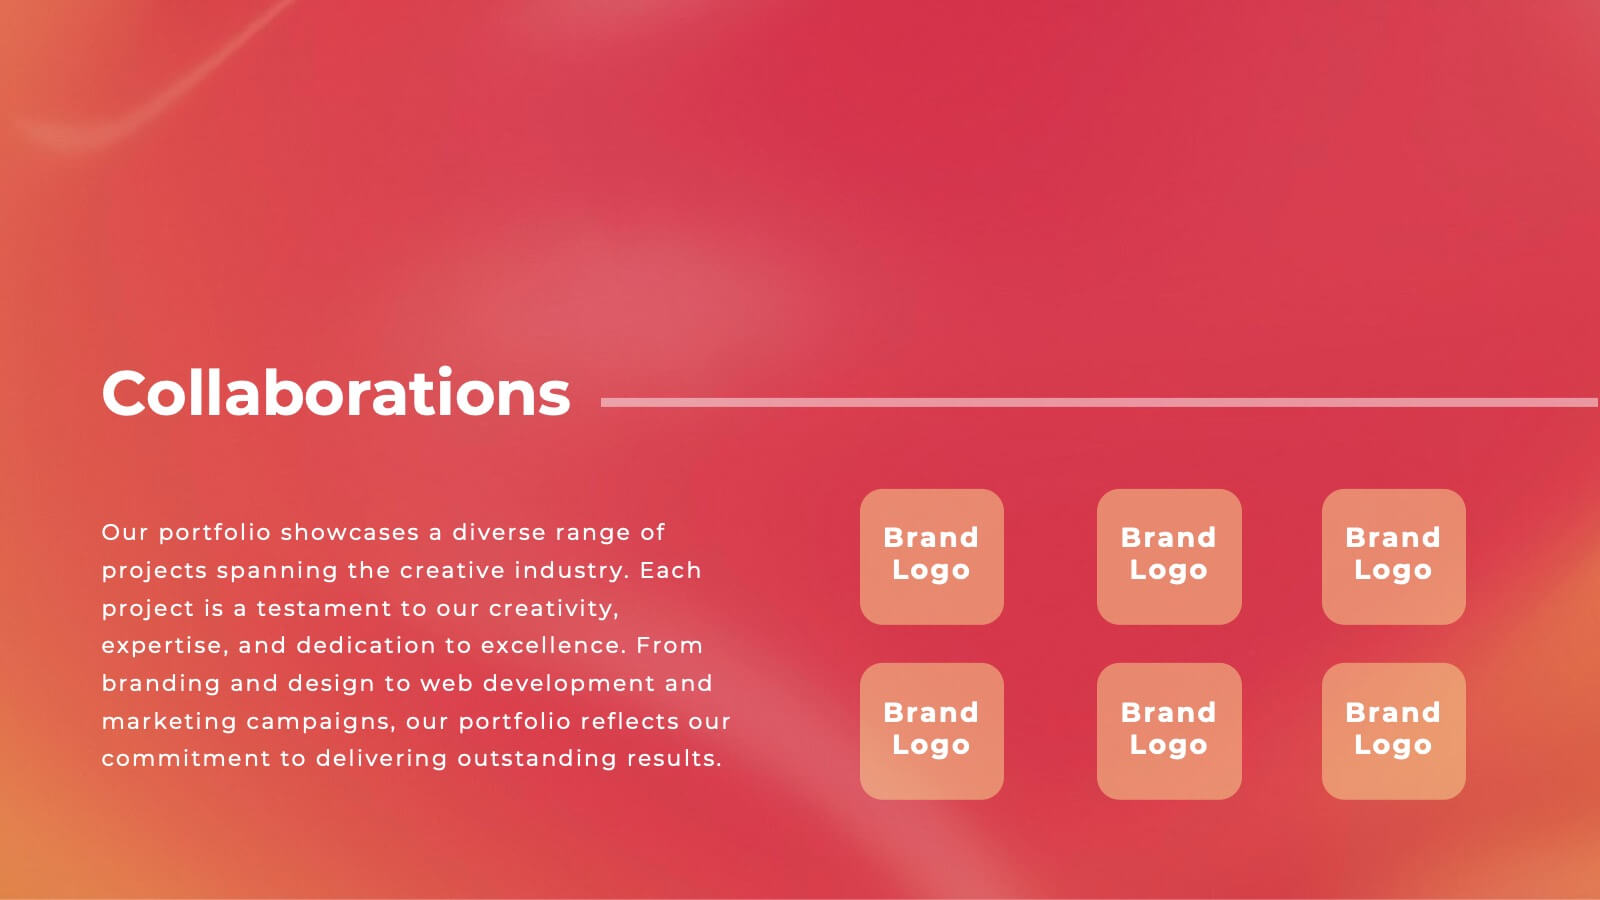
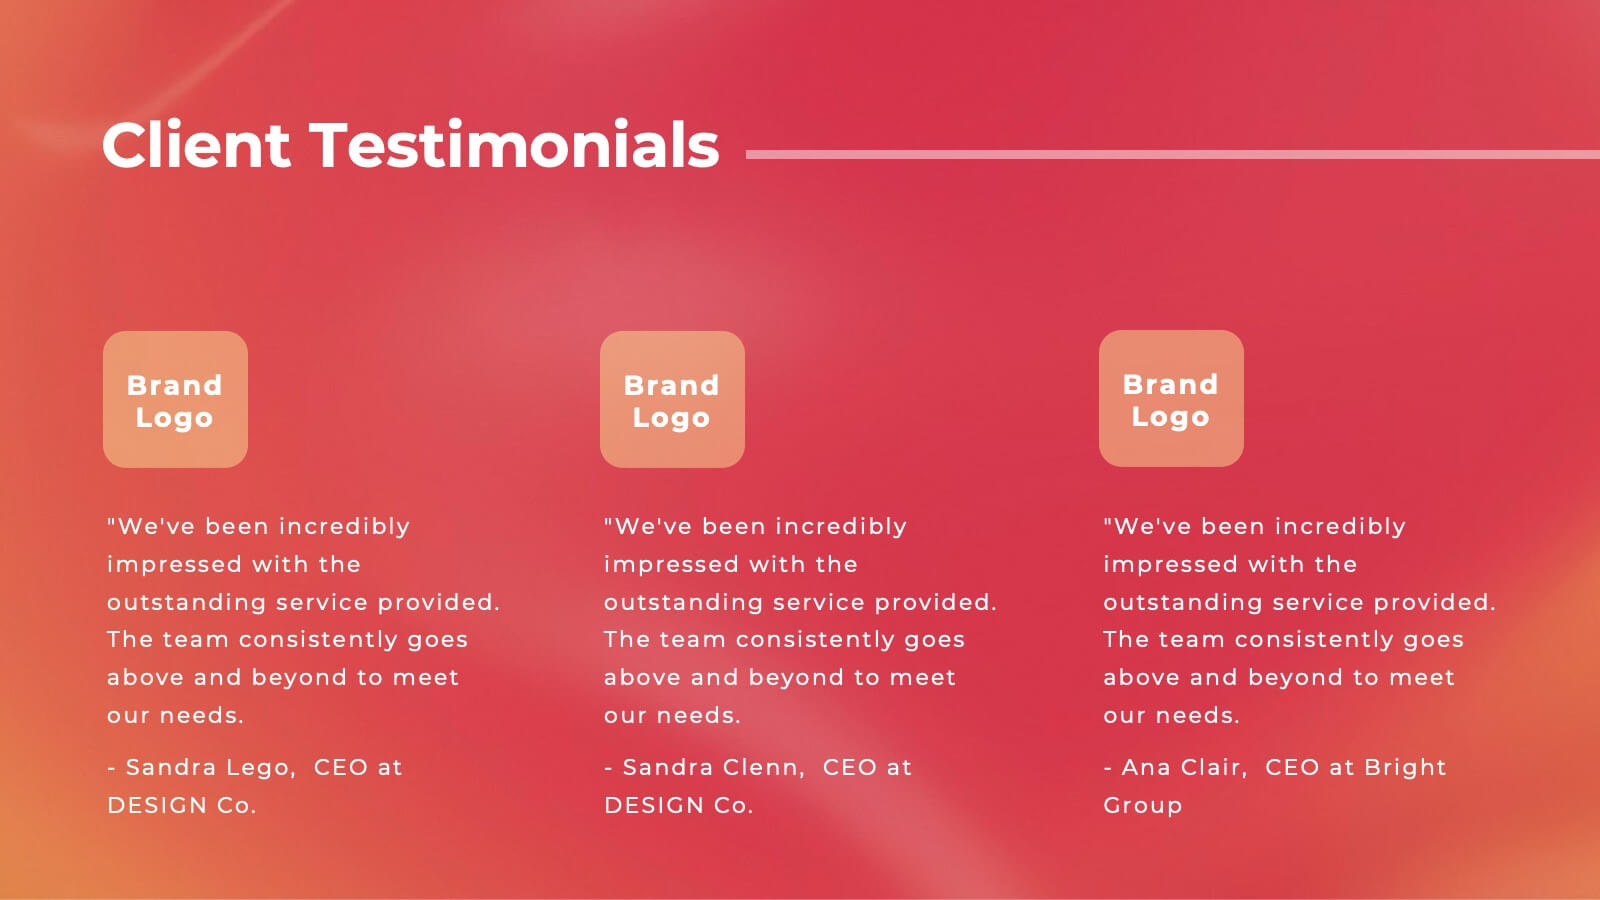
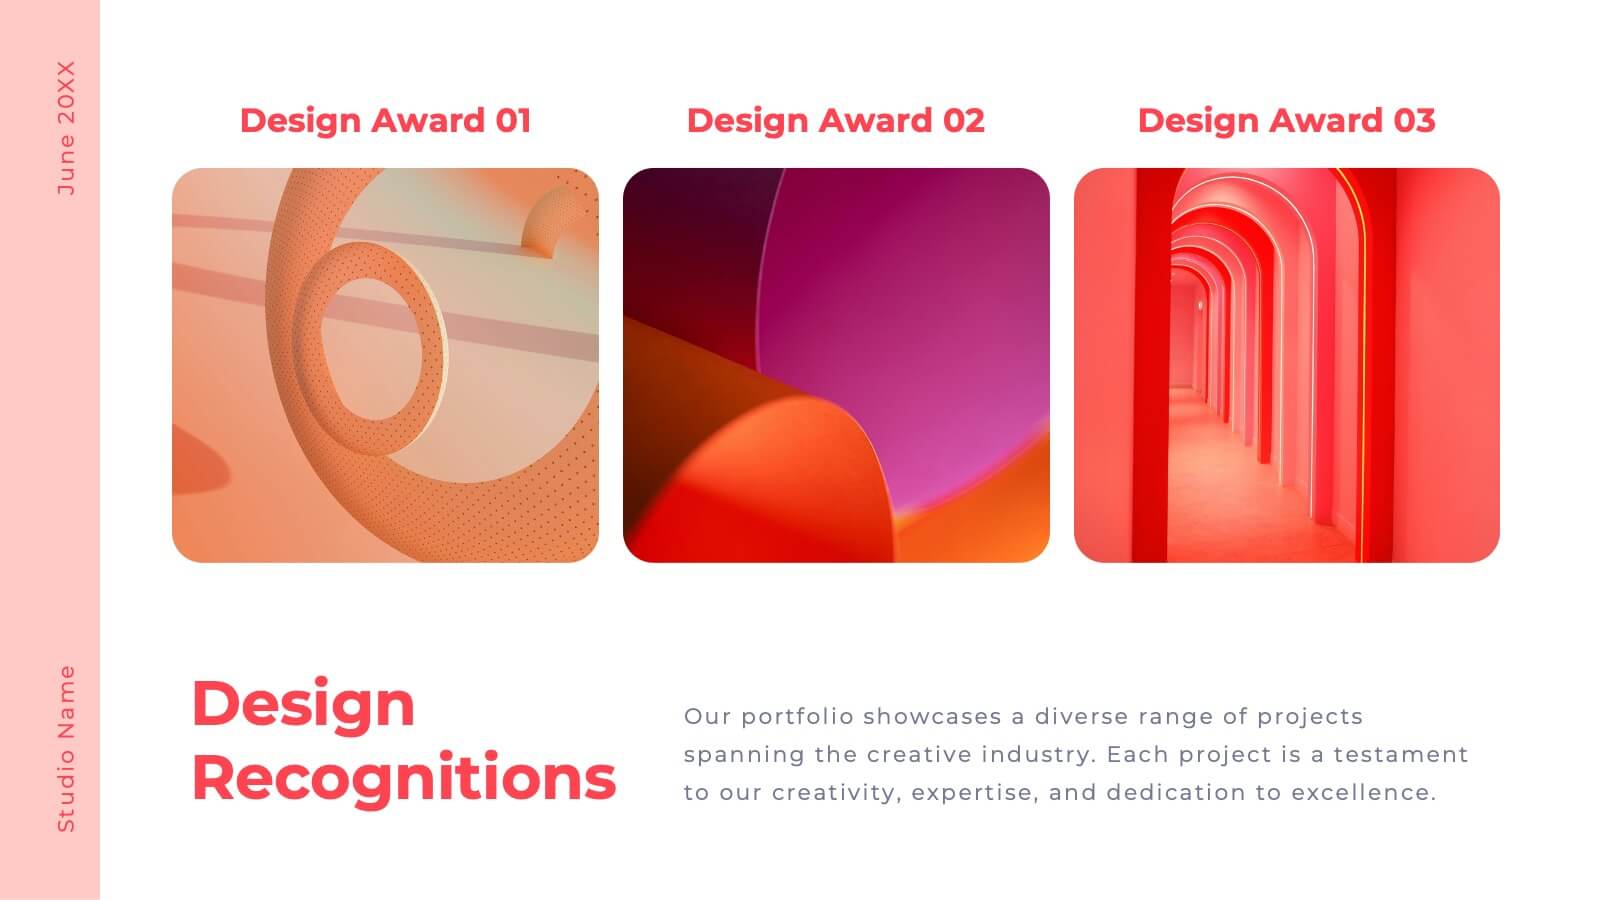
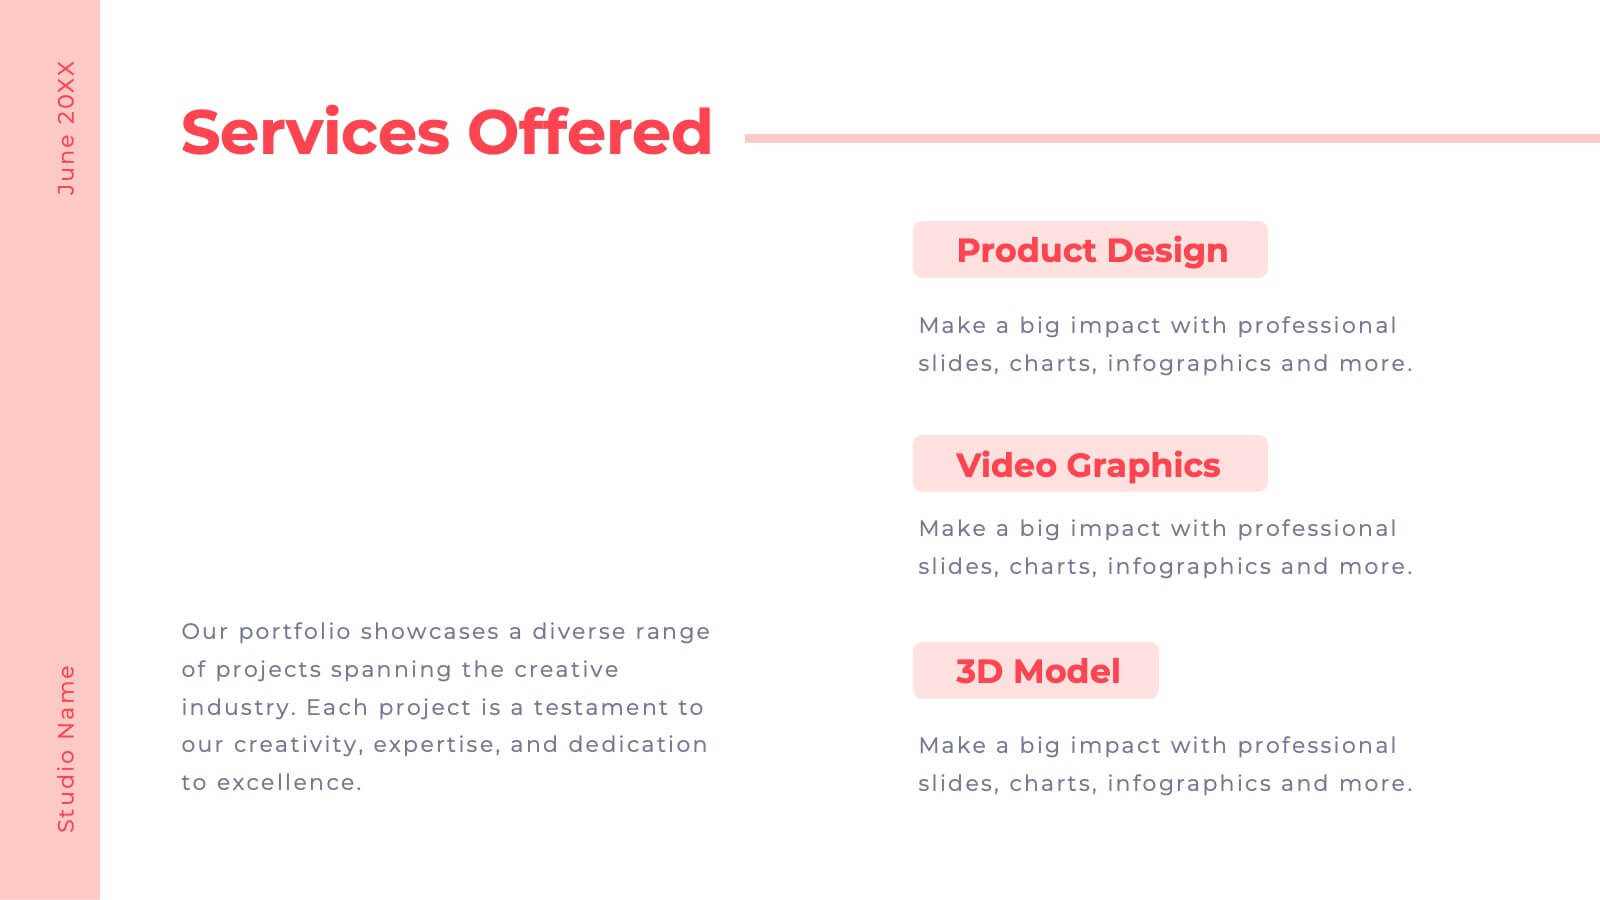
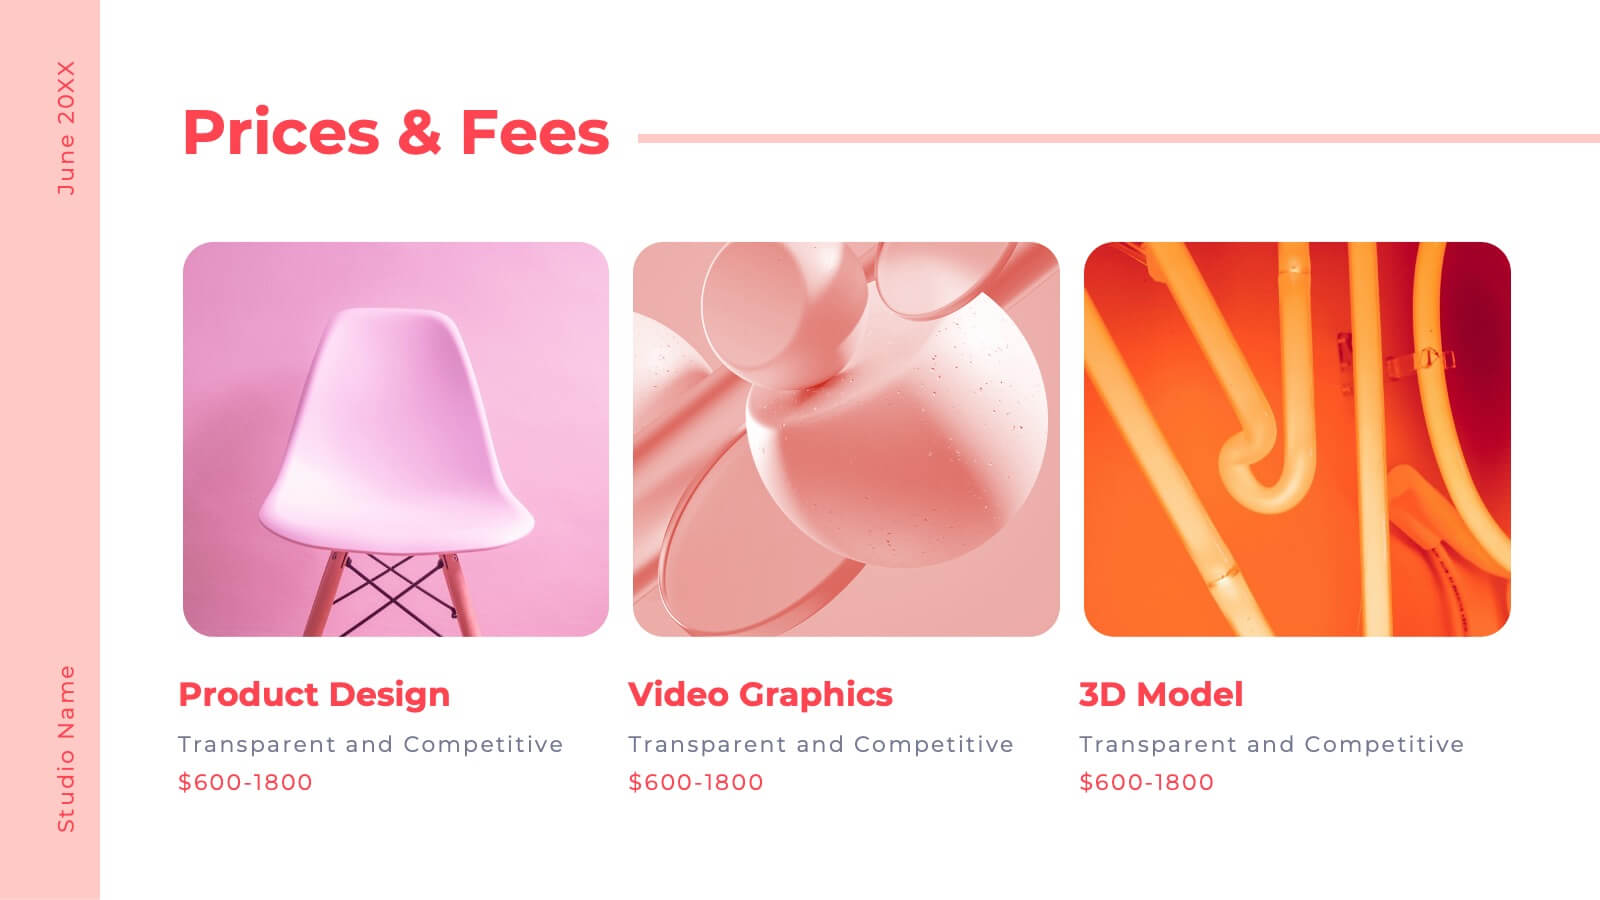
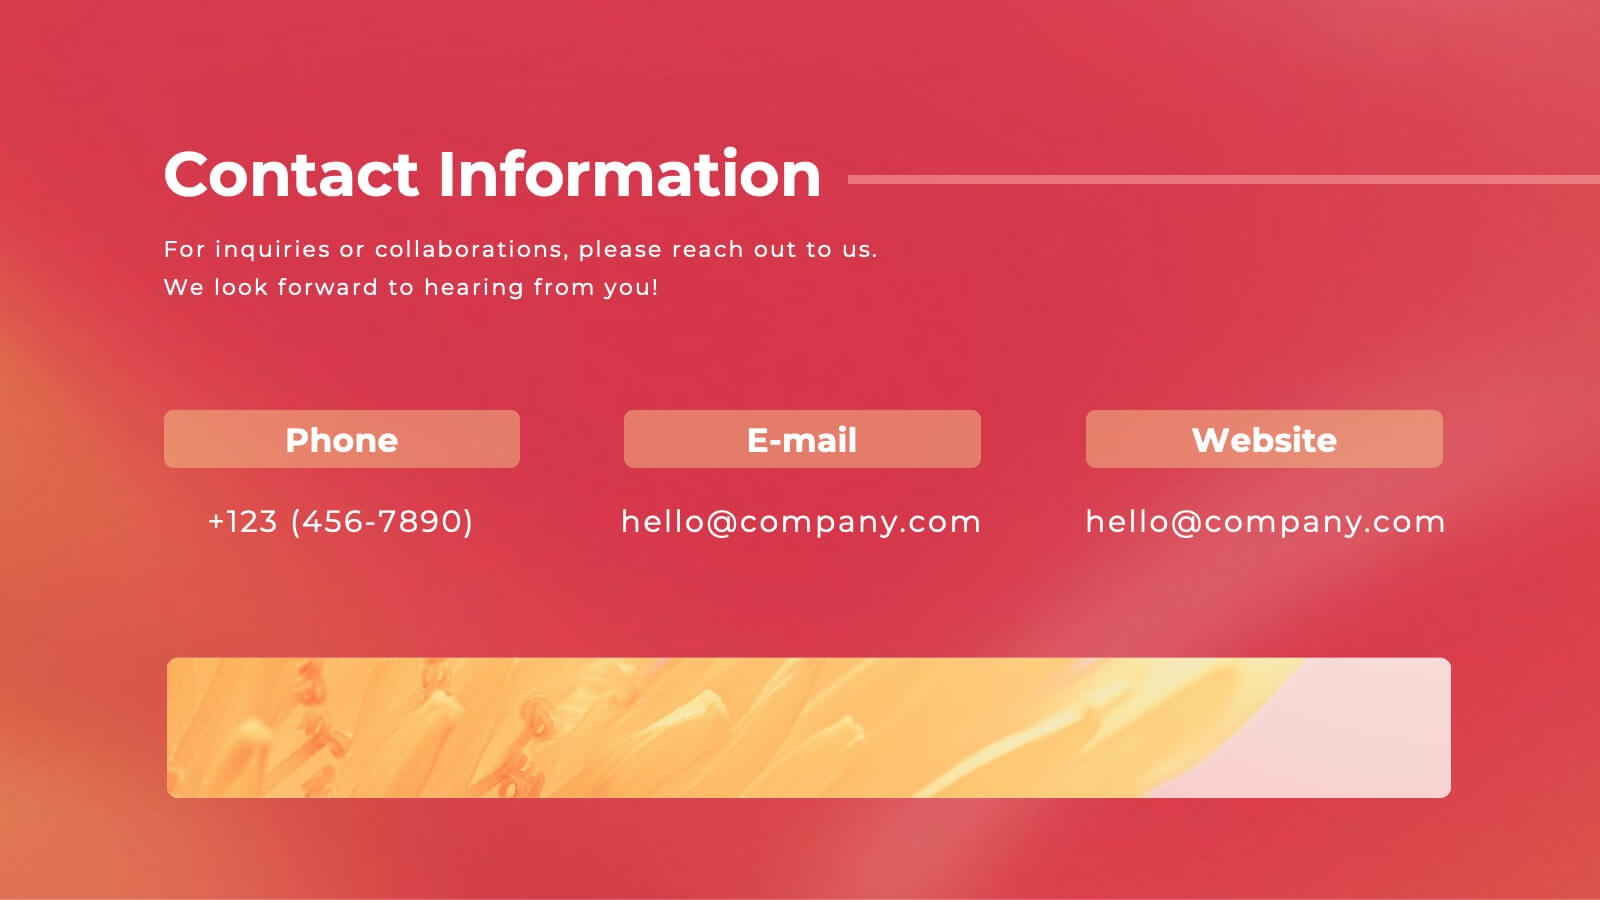
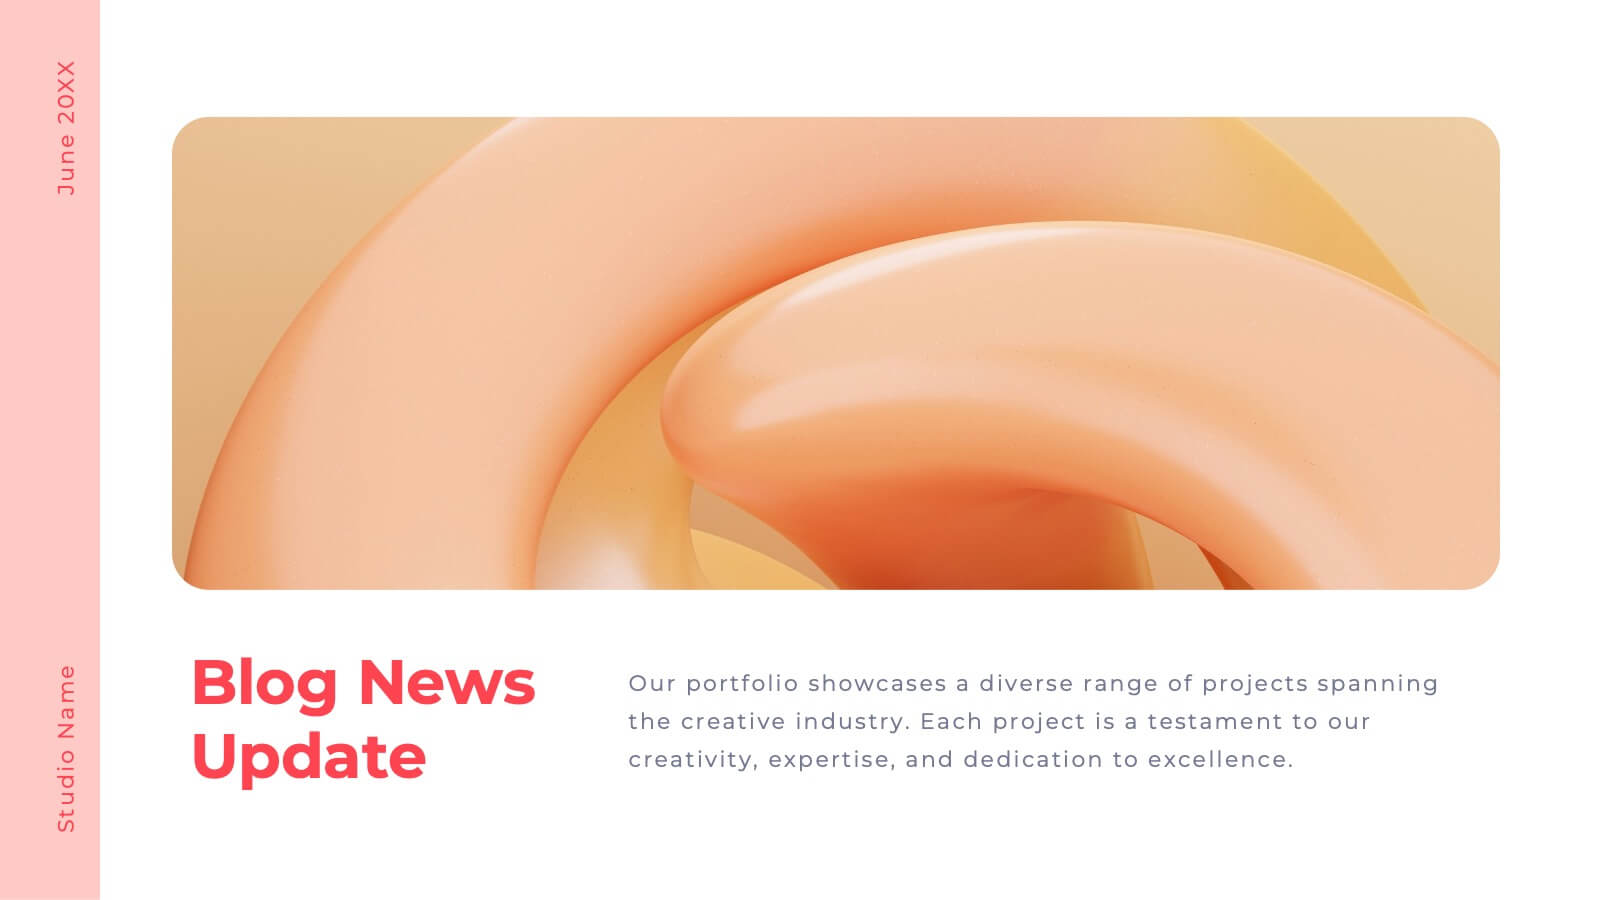
Valor Creative Portfolio Presentation
Step into creativity with this stunning portfolio template! Showcase your projects, design philosophy, and client testimonials with style and flair. Ideal for designers, artists, and creatives wanting to impress. Compatible with PowerPoint, Keynote, and Google Slides, this template elevates every portfolio to new heights. Perfect for making a lasting impact.