


Features
- 5 Unique slides
- Fully editable and easy to edit in Microsoft Powerpoint, Keynote and Google Slides
- 16:9 widescreen layout
- Clean and professional designs
- Export to JPG, PDF or send by email


Do you have any questions?
Recommend


10 slides
Leadership and Team Management Presentation
Enhance team leadership with the Leadership and Team Management presentation template. Featuring a structured layout with a clear hierarchy, this template helps illustrate management strategies, team roles, and leadership principles. Perfect for business leaders, HR professionals, and trainers. Fully customizable and compatible with PowerPoint, Keynote, and Google Slides.


8 slides
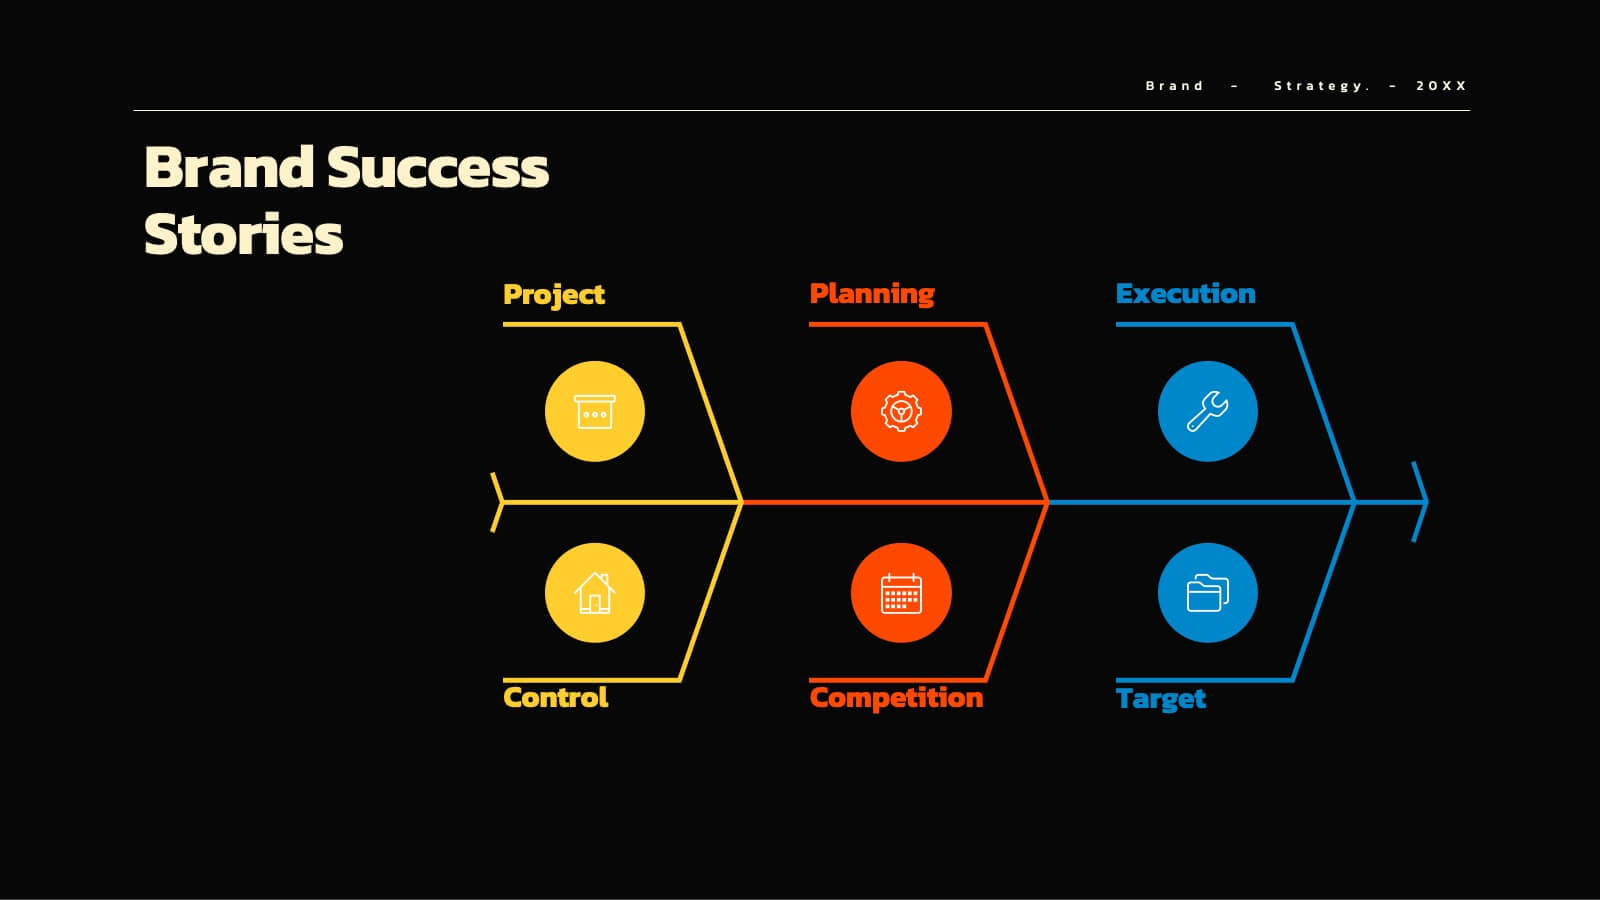
Success Strategy Triangle Presentation
Craft a winning strategy with the Success Strategy Triangle template. This structured design helps visualize key business components in a step-by-step format, making it ideal for growth planning, decision-making, and performance analysis. Fully customizable and easy to use, it’s compatible with PowerPoint, Keynote, and Google Slides for seamless integration.


6 slides
Credit Card Features Overview Presentation
Bring your audience into the world of smart spending with a clean, visual layout that explains key credit card features in a simple, engaging way. This presentation helps you break down benefits, terms, and essential details with clarity and confidence. Fully editable and compatible with PowerPoint, Keynote, and Google Slides.


5 slides
Human Capital Planning Overview Presentation
Streamline workforce strategies with the Human Capital Planning Overview Presentation. This structured template helps visualize talent development, succession planning, and HR workflows in clear, step-by-step layouts. Perfect for HR leaders, consultants, and executives. Fully editable in PowerPoint, Keynote, and Google Slides for seamless customization to match your team or organization.


7 slides
Change Management Process Infographic Presentation
Change Management is the process of managing and guiding an organization or individual through a planned and deliberate change. This template is perfect for discussing change management and allows you to customize the design and add your own tips. Designed in Powerpoint, Keynote, and Google Slides it is easy to use with helpful illustrations. Use this change management template to report on current practices, issues and reasons for change, along with how these changes can improve your organization's performance. The perfect tool to share your vision and plan, or align an entire organization!


4 slides
Step-by-Step 30-60-90 Milestones Presentation
Present clear onboarding or strategic progressions with the Step-by-Step 30-60-90 Milestones Presentation. This layout is ideal for showcasing phased plans, goal tracking, and employee integration milestones over time. Each segment highlights a distinct 30-, 60-, and 90-day focus, helping visualize stepwise achievement clearly. Fully editable in PowerPoint, Keynote, and Google Slides.


2 slides
Elegant Thank You Slide
Leave a lasting impression with this modern and refined thank-you slide. Designed with clean lines, professional typography, and an image placeholder to showcase your team, workspace, or branding. Ideal for closing business decks and project presentations. Compatible with PowerPoint, Keynote, and Google Slides.


5 slides
Workout Benefits Infographics
Engaging in regular workouts and physical exercise offers numerous benefits for both physical and mental well-being. These vertical infographic templates aim to motivate and educate individuals about the positive impact of workouts on physical health, mental well-being, and overall quality of life. These infographics are the perfect tools to be used in presentations, educational material, or fitness campaigns, this template helps inspire and inform viewers about the significant benefits of incorporating workouts into their daily routines. Compatible with Powerpoint, Keynote, and Google Slides.


22 slides
Aurorafrost Project Timeline Presentation
A sleek timeline-focused presentation template that showcases project overviews, objectives, deliverables, and milestones. Perfect for tracking budgets, resource allocation, stakeholder analysis, and quality assurance plans. Includes modern layouts for seamless planning and execution. Fully editable for a range of industries, compatible with PowerPoint, Keynote, and Google Slides for polished results.


7 slides
Innovation Infographics Presentation Template
Our innovation Infographic template is a trendy and professional way to present innovation to your audience in a way that keeps them engaged. This design features simple yet striking elements which will deliver your message, while the font and color scheme gives you that flexibility to personalize this template to your brand’s identity. We have designed this presentation template to help you create and deliver engaging content for your audience. It is a powerful tool that helps you build interest, generate leads and position yourself as an authority on the subject of innovation.


7 slides
Europe Countries Map Infographic
This Europe Countries Map infographic template is a versatile presentation tool for showcasing various data across European nations. The template is fully compatible with PowerPoint, Google Slides, and Keynote and features different infographic styles, such as color-coded maps, bar charts, and statistical representations. It is perfect for displaying country-specific information like population size, economic statistics, or any other relevant data. The clear and concise design ensures that viewers can easily interpret the information, making it suitable for educators, students, business professionals, and anyone needing to present European data in an engaging and informative manner.


7 slides
30 60 90 Nutritional Plan Infographic
Chart a path to healthful living with the 30 60 90 Nutritional Plan Infographic. In a vibrant mix of yellow, purple, blue, and white, this template presents a visually delightful guide to nutrition enthusiasts and health-conscious audiences. The tailored design encourages a gradual approach to dietary transitions, making it easier to understand and adhere to. Health coaches, dietitians, or fitness trainers will find this as an indispensable tool for workshops, webinars, or consultations. Its seamless integration with PowerPoint, Keynote, and Google Slides enhances the user experience during presentations.


7 slides
Stock Market Futures Infographic
The stock market, also known as the equity market or share market, is a platform where buying, selling, and issuing shares of publicly-held companies take place. This infographic template serves as your compass through the intricate landscape of stocks and futures, empowering you with the knowledge to steer your investments towards a prosperous horizon. Compatible with Powerpoint, Keynote, and Google Slides. The striking visualizations present the clash between the bullish and bearish market forces, symbolizing the constant struggle that drives market movements. Easily showcase the latest stock prices with this template.


10 slides
Business Growth and Market Statistics Presentation
Showcase key business growth trends and market insights with the "Business Growth and Market Statistics" presentation templates. These visuals are crafted to enhance clarity in communicating growth drivers, market dynamics, and performance metrics effectively. Ideal for corporate presentations, they're compatible with PowerPoint, Keynote, and Google Slides, ensuring a professional look across all platforms.


8 slides
Africa Market Potential and Improvement Map Presentation
Visualize market opportunities across Africa with this insightful map template. Featuring percentage-based growth indicators and color-coded country highlights, it’s perfect for showcasing regional potential, trends, and business expansion strategies. Fully customizable in PowerPoint, Keynote, and Google Slides, this template supports clear, data-driven storytelling for marketing, economic, or strategic presentations.


27 slides
Aqua Brand Strategy Report Presentation
Make waves with this fresh, aqua-inspired presentation template, perfect for delivering a standout brand strategy report! Designed to help you showcase your brand's vision, market positioning, and strategic goals, it features a clean, modern layout that grabs attention. Compatible with PowerPoint, Keynote, and Google Slides for effortless customization.


21 slides
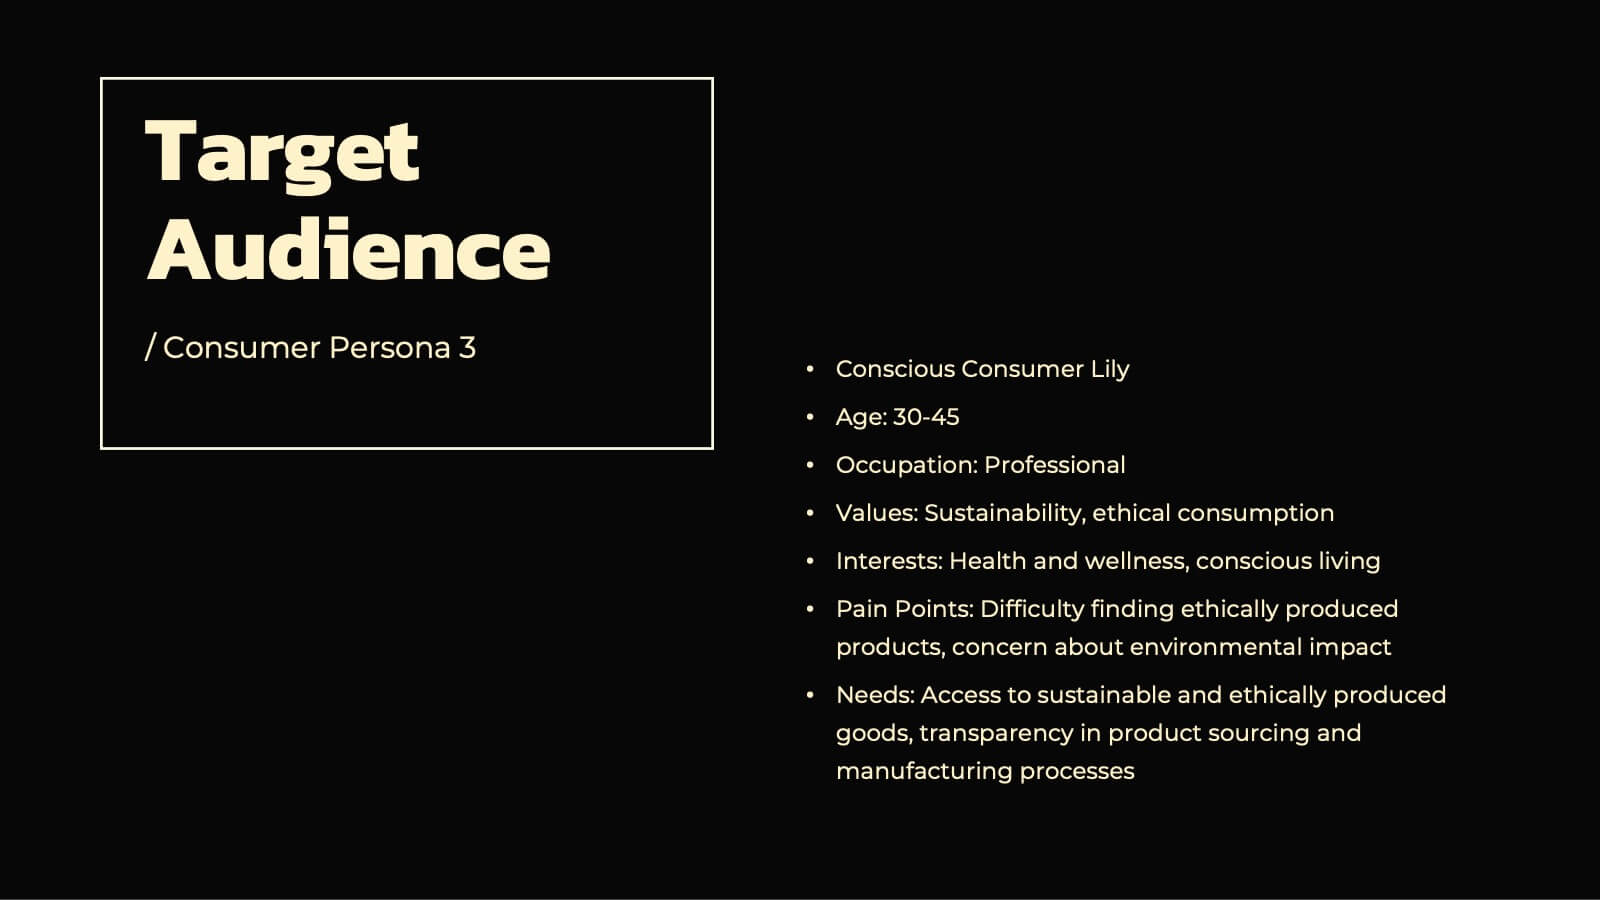
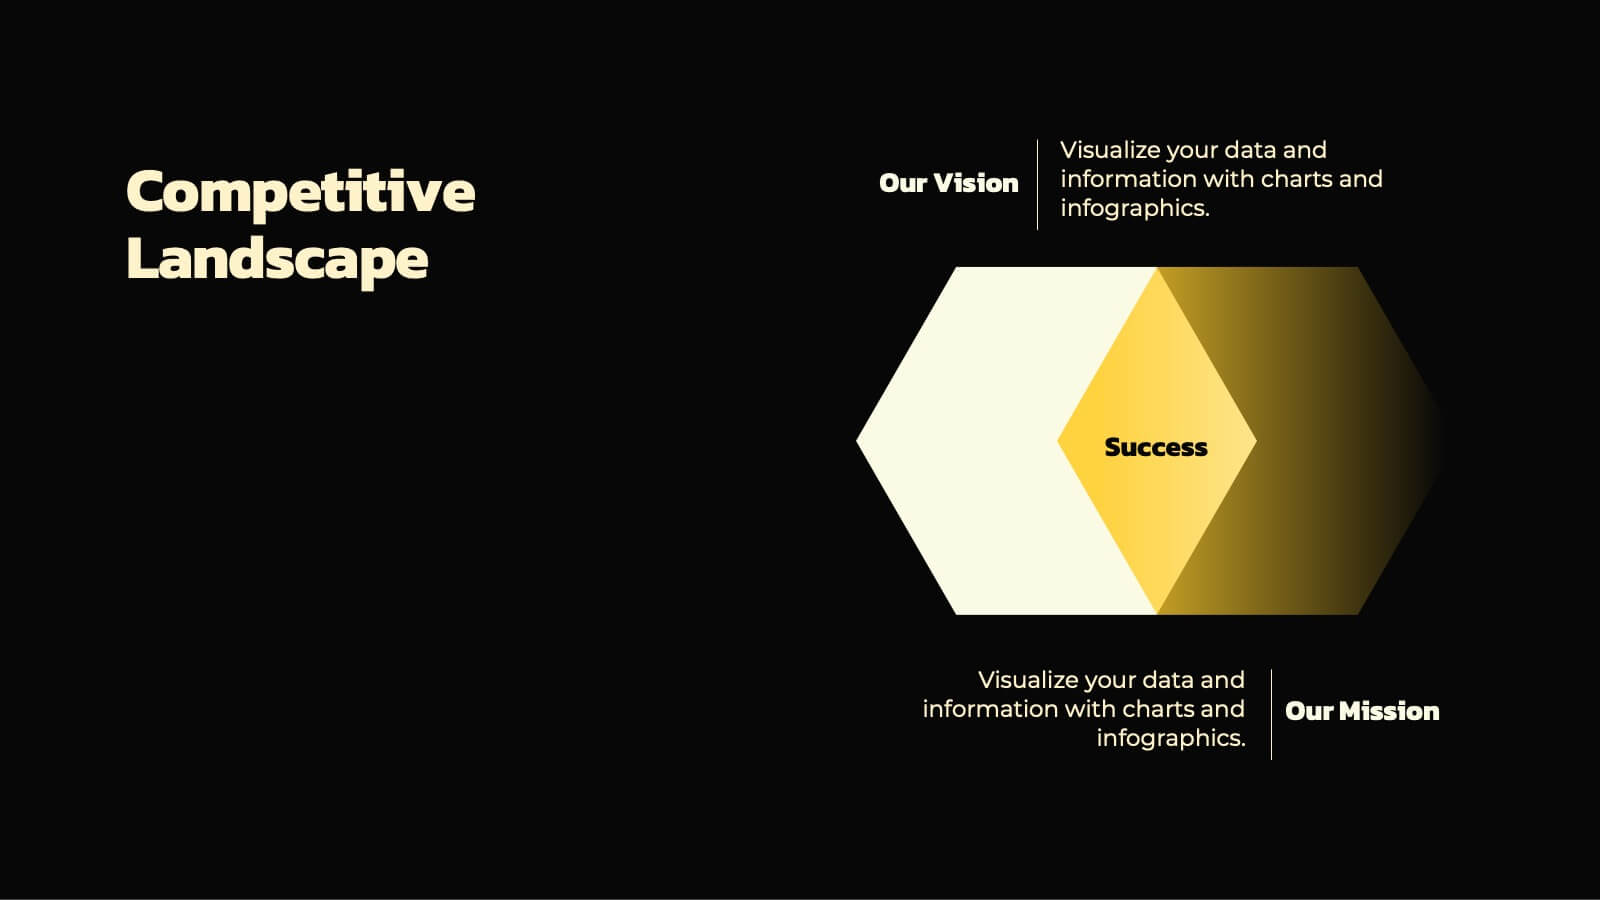
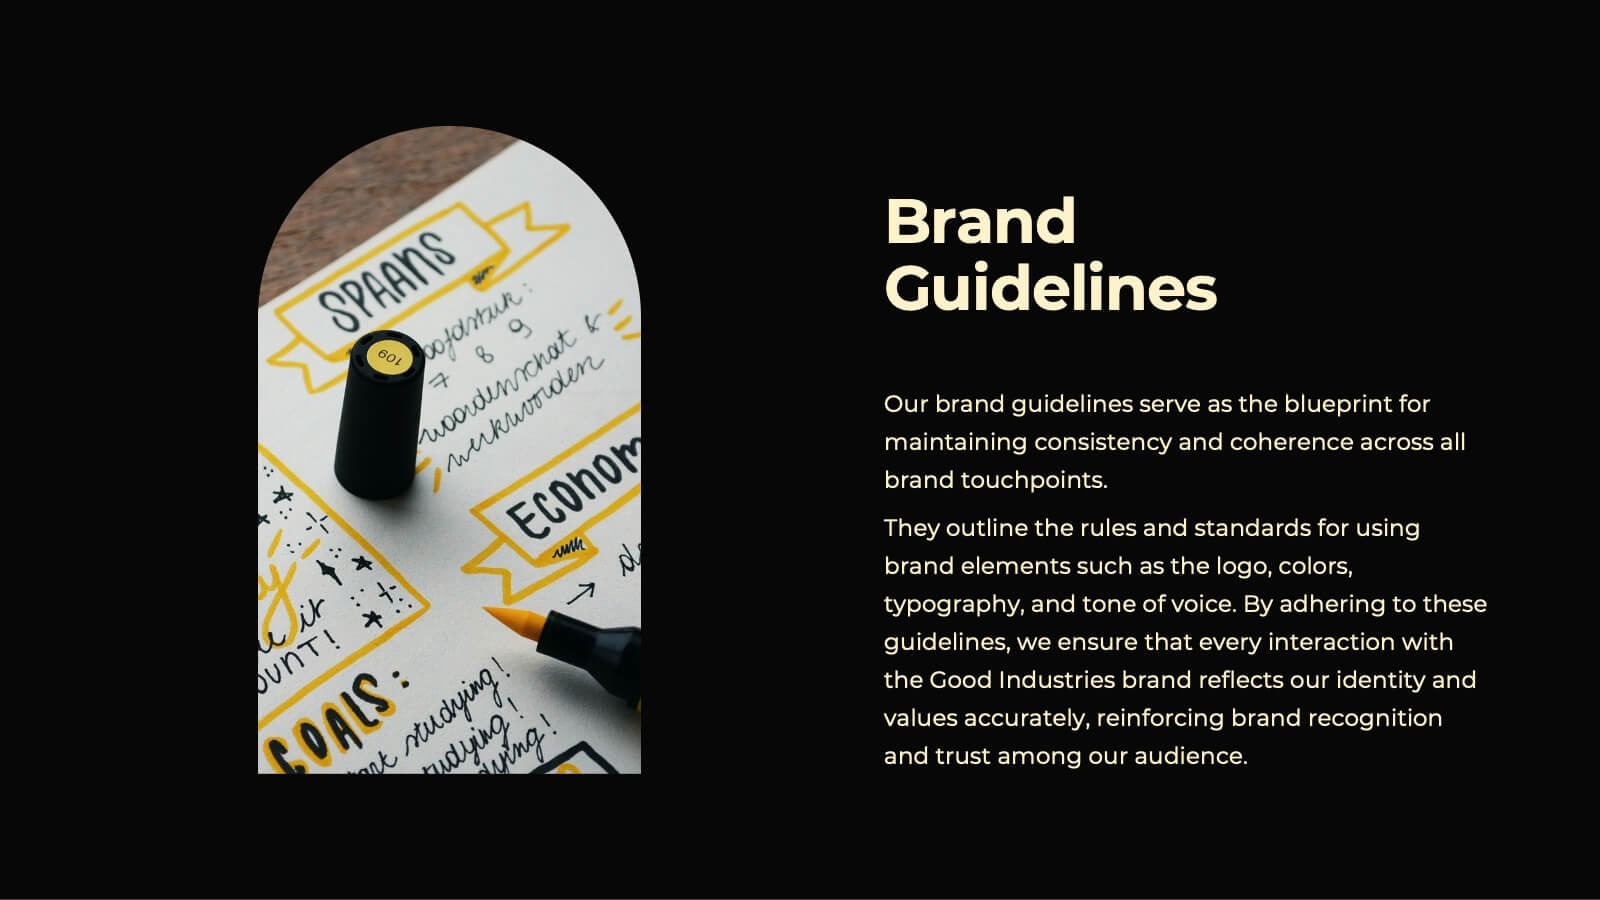
Utopia Marketing Proposal Template Presentation
Unleash your marketing potential with this vibrant, modern presentation template. Perfect for presenting marketing proposals, industry overviews, and consumer behavior analysis, it features a colorful design that captures attention. Highlight key strategies like social media, influencer marketing, and SEO trends to engage your audience. Compatible with PowerPoint, Keynote, and Google Slides, it ensures seamless presentations on any platform.