


Features
- 6 Unique slides
- Fully editable and easy to edit in Microsoft Powerpoint, Keynote and Google Slides
- 16:9 widescreen layout
- Clean and professional designs
- Export to JPG, PDF or send by email


Do you have any questions?
Recommend


20 slides
Pegasus Sales Forecast Presentation
This bold sales forecast template combines powerful visuals with a sleek design to highlight key performance metrics, competitive analysis, and pricing strategy. With sections for service overview, testimonials, promotions, and next steps, it’s ideal for impactful presentations. Compatible with PowerPoint, Keynote, and Google Slides, delivering your message has never been easier.


21 slides
Naga Project Proposal Presentation
Present your project with confidence using this comprehensive proposal presentation! It covers crucial sections such as objectives, methodology, timeline, budget breakdown, and risk mitigation strategies, ensuring every detail is addressed clearly. Ideal for client proposals or internal planning, this template works seamlessly with PowerPoint, Keynote, and Google Slides.


4 slides
Consumer Psychology in Marketing
Ever wonder what’s really going on inside a shopper’s mind? This infographic presentation explores the psychology behind consumer decisions, helping you visualize key buying patterns, emotional triggers, and marketing insights with clear, modern visuals. Fully customizable and easy to edit in PowerPoint, Keynote, and Google Slides.


4 slides
Freight & Logistics Route Planning Presentation
Track every mile with this smart and stylish logistics flowchart. Visualize freight movement across air, sea, rail, and road using bold, intuitive icons and directional arrows. A great fit for supply chain managers and route optimization strategies. Easily customizable in PowerPoint, Keynote, and Google Slides.


6 slides
Sports Training Program Presentation
Get ready to energize your audience with a slide that feels fast, motivating, and built for action. This presentation helps you outline key training steps, performance goals, and athletic milestones in a clean, visual way that keeps information clear and engaging. Fully compatible with PowerPoint, Keynote, and Google Slides.


20 slides
Momentum Business Proposal Presentation
Elevate your business proposals with this vibrant, dynamic template designed to impress and persuade. Featuring a sleek design and a structured layout, this template is perfect for outlining project summaries, methodologies, and pricing structures. It's ideal for conveying professionalism and clarity. Compatible with PowerPoint, Keynote, and Google Slides, it ensures seamless presentations across all platforms.

20 slides
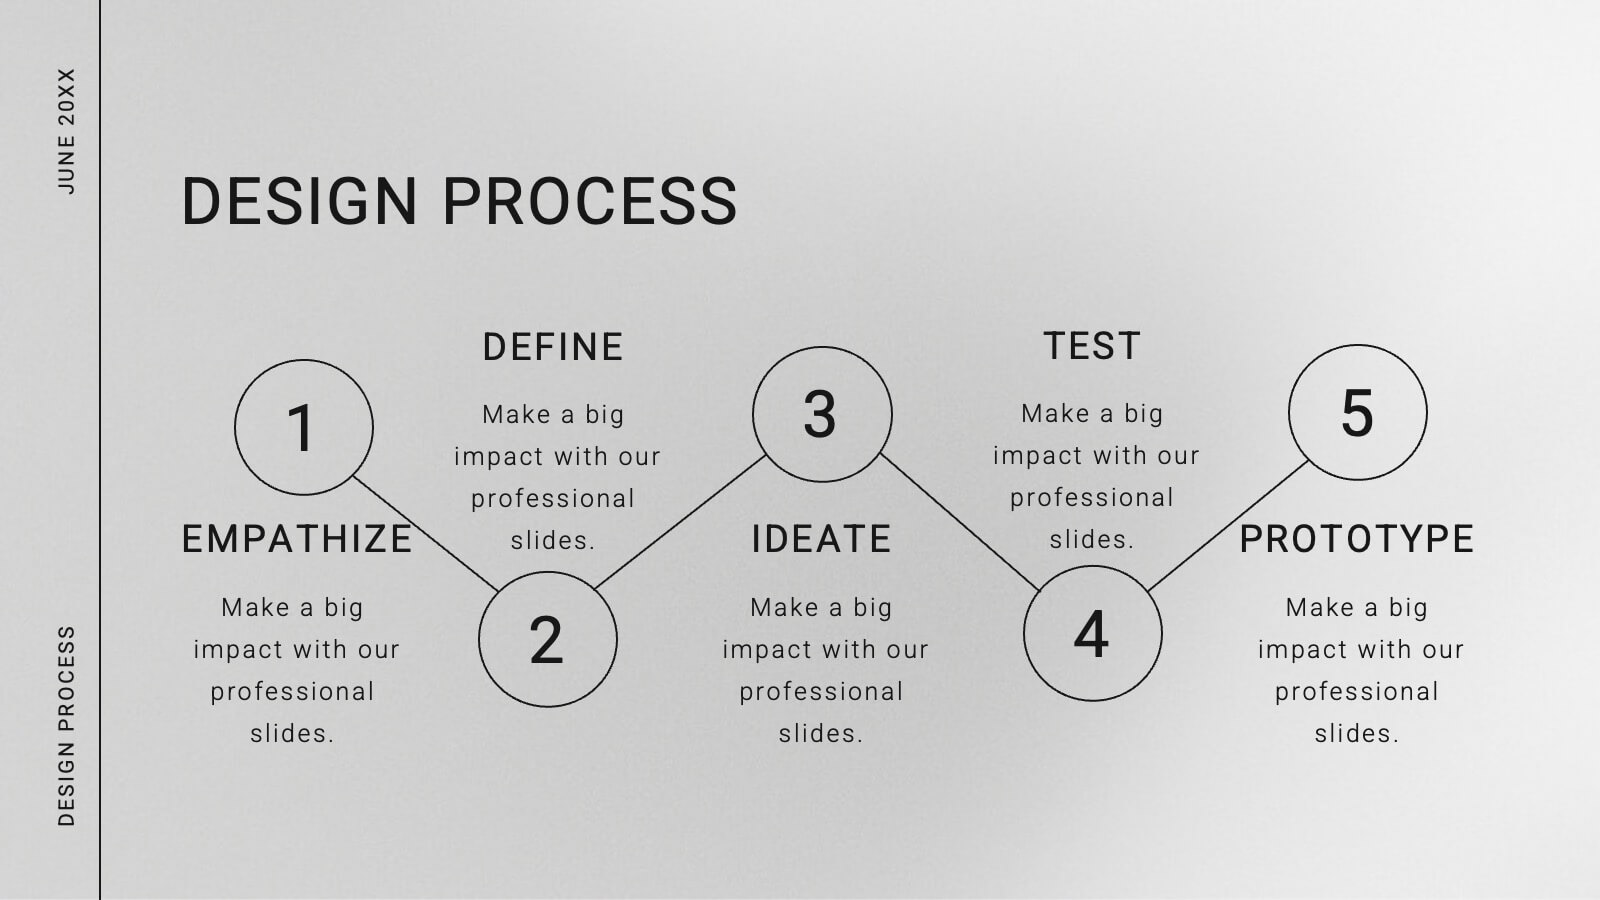
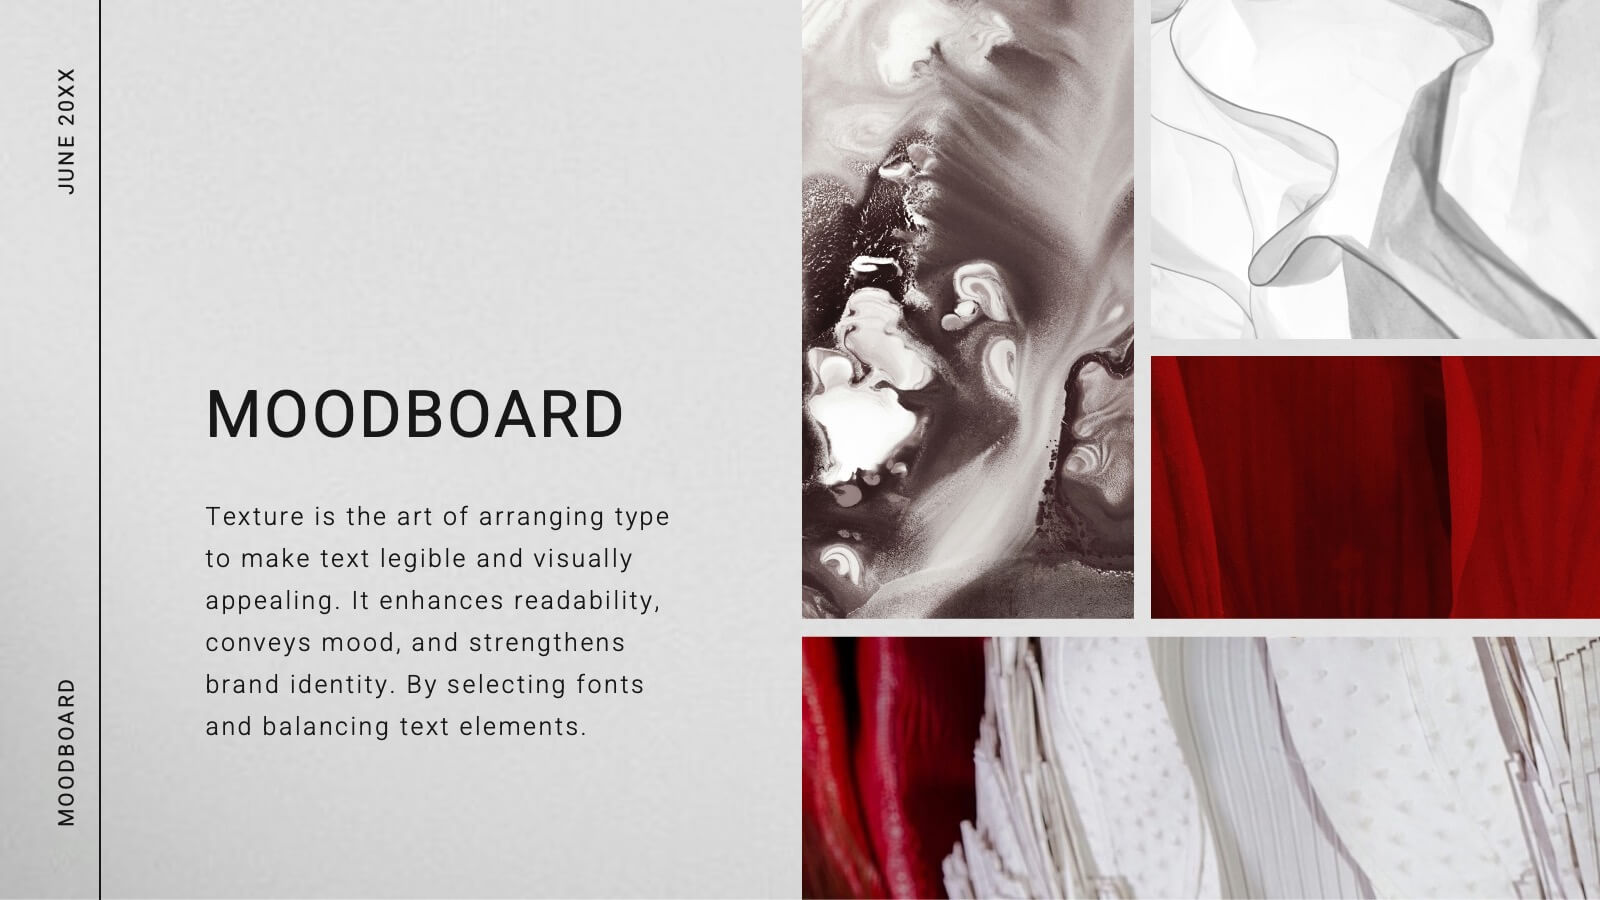
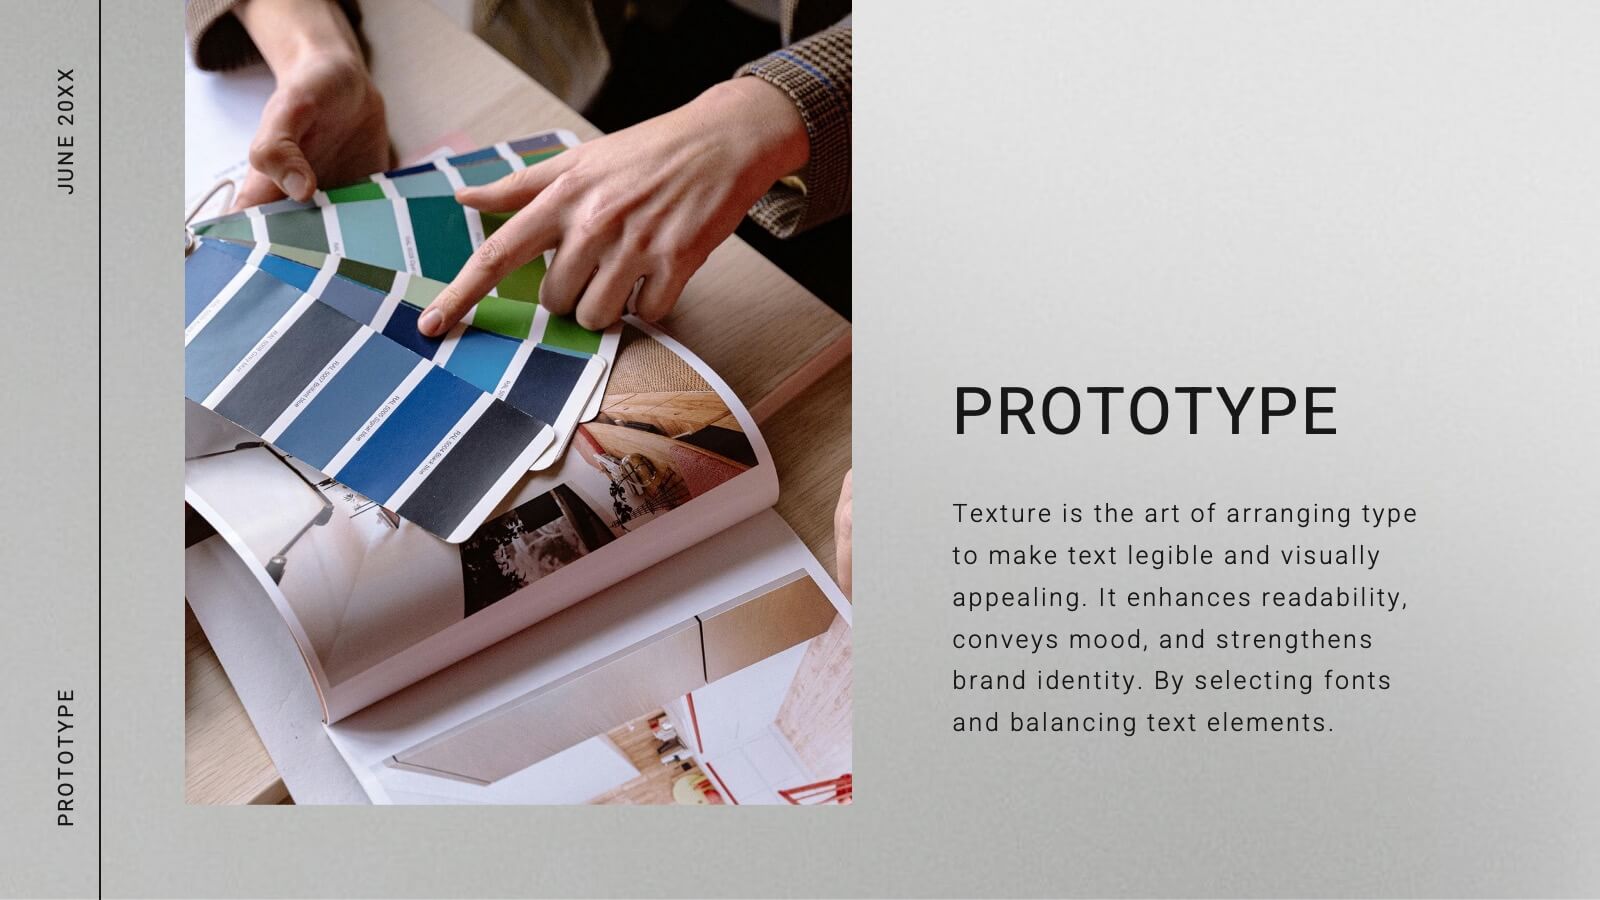
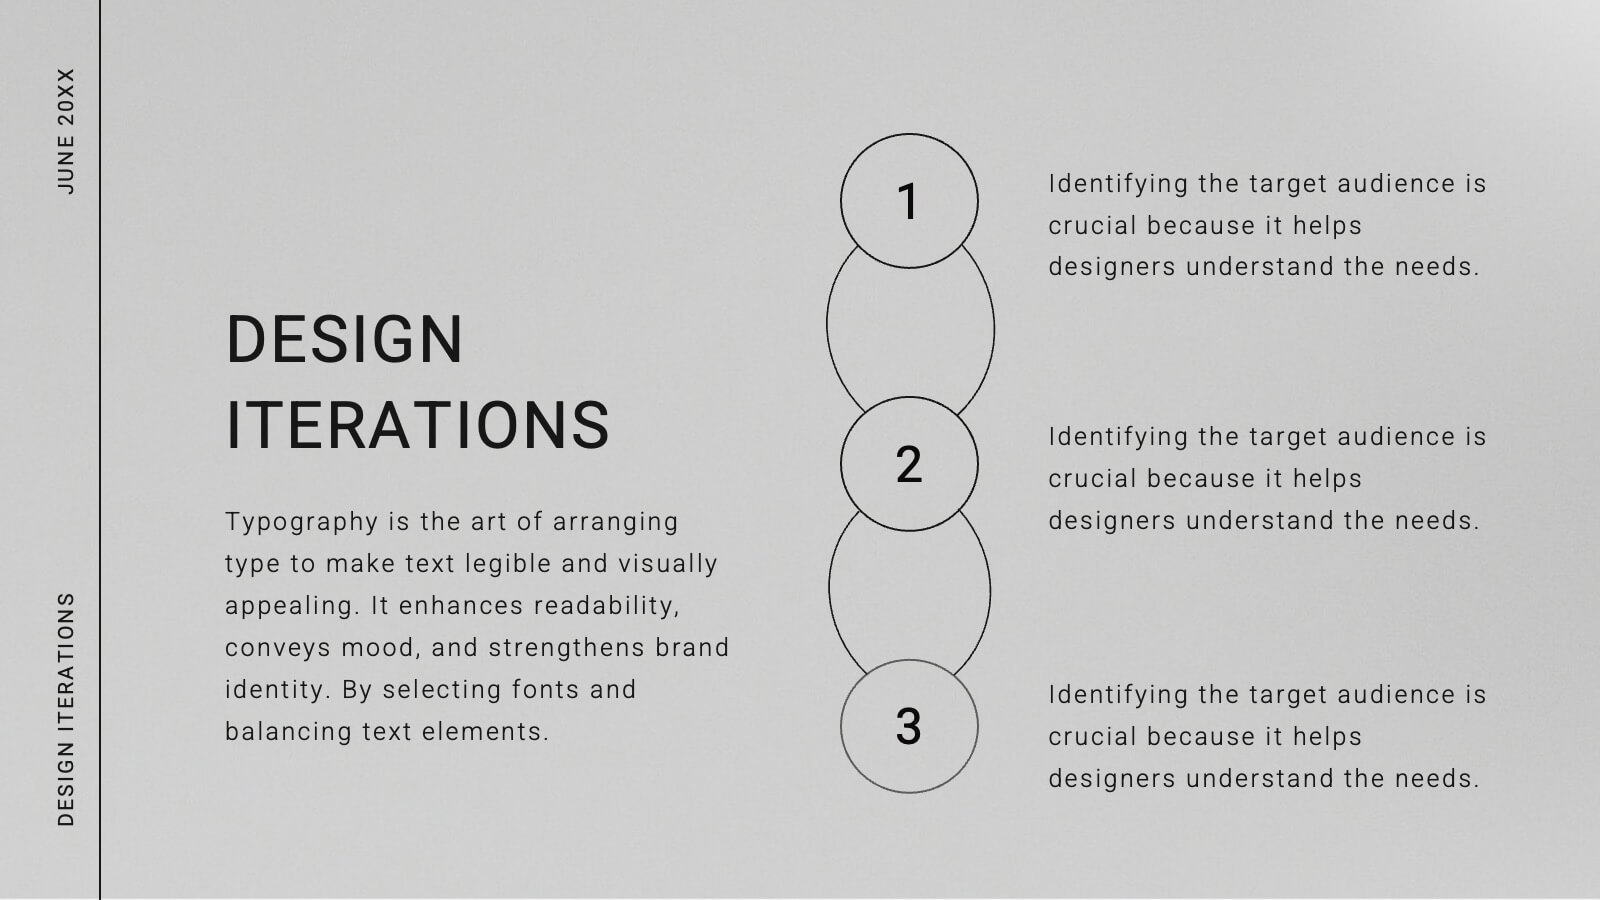
Comet Graphic Design Project Plan Presentation
Craft stunning design project presentations with this elegant template. Showcase objectives, processes, mood boards, and final designs effectively. Ideal for creative teams and clients. Fully compatible with PowerPoint, Keynote, and Google Slides.


6 slides
Organizational Structure Overview Presentation
Map out your team’s structure with clarity using this simple organizational chart template. Ideal for showcasing departments, reporting lines, or team roles, it helps stakeholders quickly understand who’s who and how responsibilities are divided. Perfect for internal meetings, onboarding decks, or company overviews. Works with PowerPoint, Keynote, and Google Slides.


21 slides
Literati Research Proposal Presentation
Present your research proposal with confidence using this professionally crafted template, designed to streamline complex ideas into a cohesive, engaging narrative. With a modern design and dynamic visuals, it ensures your research objectives and findings are communicated effectively. The template includes sections for your introduction, background, methodology, data collection, analysis, and key findings, giving your proposal a logical structure. Use the literature review and data visualization slides to back up your arguments with credible sources and compelling graphics. Dedicated slides for conclusions, recommendations, and implications allow you to outline the impact of your research clearly. Fully editable in PowerPoint, Google Slides, and Keynote, this template adapts effortlessly to your needs. Perfect for academic, corporate, or professional research presentations, it combines sleek design with functionality to ensure your proposal resonates with your audience. Take your research to the next level with a template that reflects your dedication to excellence.


5 slides
Quarterly Sales Funnel Overview Presentation
Visualize conversion performance with clarity using the Quarterly Sales Funnel Overview Presentation. This sleek funnel chart design breaks down each sales stage—from lead generation to closing—helping you present key percentages and insights effectively. Perfect for marketing reports, sales updates, and business reviews. Fully editable in Canva, PowerPoint, Keynote, and Google Slides.


5 slides
Performance Scaling Overview Presentation
Illustrate performance development with this sleek layered pyramid chart. Designed to visualize growth stages, team levels, or scaling strategies, each tier includes editable text and icons for clarity. Ideal for business reviews, capability mapping, or operational planning. Fully customizable in PowerPoint, Keynote, and Google Slides for effortless updates.


6 slides
Bitcoin and Blockchain Technology Overview Presentation
Break down complex blockchain systems into digestible visuals with this sleek overview slide. Featuring six color-coded icons around a secure lock illustration, it’s ideal for explaining blockchain architecture, bitcoin components, or crypto processes. Fully editable in PowerPoint, Keynote, and Google Slides for seamless customization.


20 slides
Wyrmwood Design Proposal Presentation
The Startup Funding Proposal Presentation Template includes 20 sleek and professional slides covering problem statements, solutions, pricing structures, and team expertise. With its modern black-and-white aesthetic, it ensures clarity and impact. Fully editable and compatible with PowerPoint, Keynote, and Google Slides, it's perfect for startups seeking investment opportunities and partnerships.


7 slides
South America Infographic Presentation Template
South America is the fourth largest continent in size and the fifth largest in population. It is located primarily in the southern hemisphere, situated between the Pacific and Atlantic Oceans, with mostly colonies on other continents. South America is a continent entirely in the Western Hemisphere, mostly in the Southern Hemisphere. This South America map template is a great base for lesson plans, reference guides and much more. This map template is fully editable and can be easily customized to suit your presentation needs, add multiple layers of text, pictures and various other features.


6 slides
Effective Time Management Strategie Presentation
Make the most of your hours with this sharp and creative visual layout designed to organize your time-saving game plan. This template highlights key time management strategies, helping you structure priorities and boost daily efficiency. Fully customizable and easy to edit in PowerPoint, Keynote, and Google Slides for seamless presentation use.


5 slides
Business Vision Statement Presentation
Focus on the future with our "Business Vision Statement" presentation template, ideal for outlining your company's aspirations. This visually engaging template helps you present your business's core values and long-term goals, ensuring alignment across the organization. Perfect for strategic meetings and stakeholder presentations, it is compatible with PowerPoint, Keynote, and Google Slides. This template is a crucial tool for leaders looking to inspire and direct their teams towards common objectives.


5 slides
Global Warming Impacts Infographics
Global Warming refers to the long-term increase in Earth's average surface temperature due to human activities, primarily the emission of greenhouse gases. This is a visually engaging infographic template that highlights the impacts of global warming on the environment, ecosystems, and human societies. This template is made to create an understanding of the consequences of climate change and raise awareness about the urgent need for action. The eye-catching visuals and impactful messaging, make these infographics ideal for presentations, educational material, or awareness campaigns related to global warming and environmental sustainability.