


Features
- 4 Unique slides
- Fully editable and easy to edit in Microsoft Powerpoint, Keynote and Google Slides
- 16:9 widescreen layout
- Clean and professional designs
- Export to JPG, PDF or send by email


Do you have any questions?
Recommend


6 slides
Creative 3D Elements Slide Presentation
Take your slides from flat to fantastic with this playful 3D layered design! This infographic template is perfect for visualizing multi-step processes, product stacks, or layered strategies in a modern and creative way. It’s fully editable and easy to customize in PowerPoint, Keynote, and Google Slides for any presentation need.


6 slides
Growth Chart Infographic
A growth chart is a visual representation that shows the progress of an individual's growth over time. This infographic template is a visual representation that illustrates the growth and progress of various elements over time. These infographic charts are important tools to monitor growth patterns and help detect any potential issues. This growth chart infographic helps convey trends and insights in a clear and engaging manner. This template is compatible with Powerpoint, Keynote, and Google Slides. Allowing you to keep the design clean, easy to understand, and aligned with the message you want to convey.


8 slides
Rewards and Membership Benefits
Highlight the value of your loyalty or subscription programs with this eye-catching slide. Featuring four ticket-style sections radiating from a central icon, this layout is ideal for outlining exclusive perks, tiered rewards, or member-only features. Fully editable in PowerPoint, Keynote, and Google Slides.


4 slides
User Experience Flow Presentation
Bring clarity and color to every stage of your user experience process with this clean, structured presentation. It helps you outline steps, explain interactions, and highlight key insights in a visually intuitive flow. Easy to customize and fully compatible with PowerPoint, Keynote, and Google Slides.


21 slides
Harmony Project Management Plan Presentation
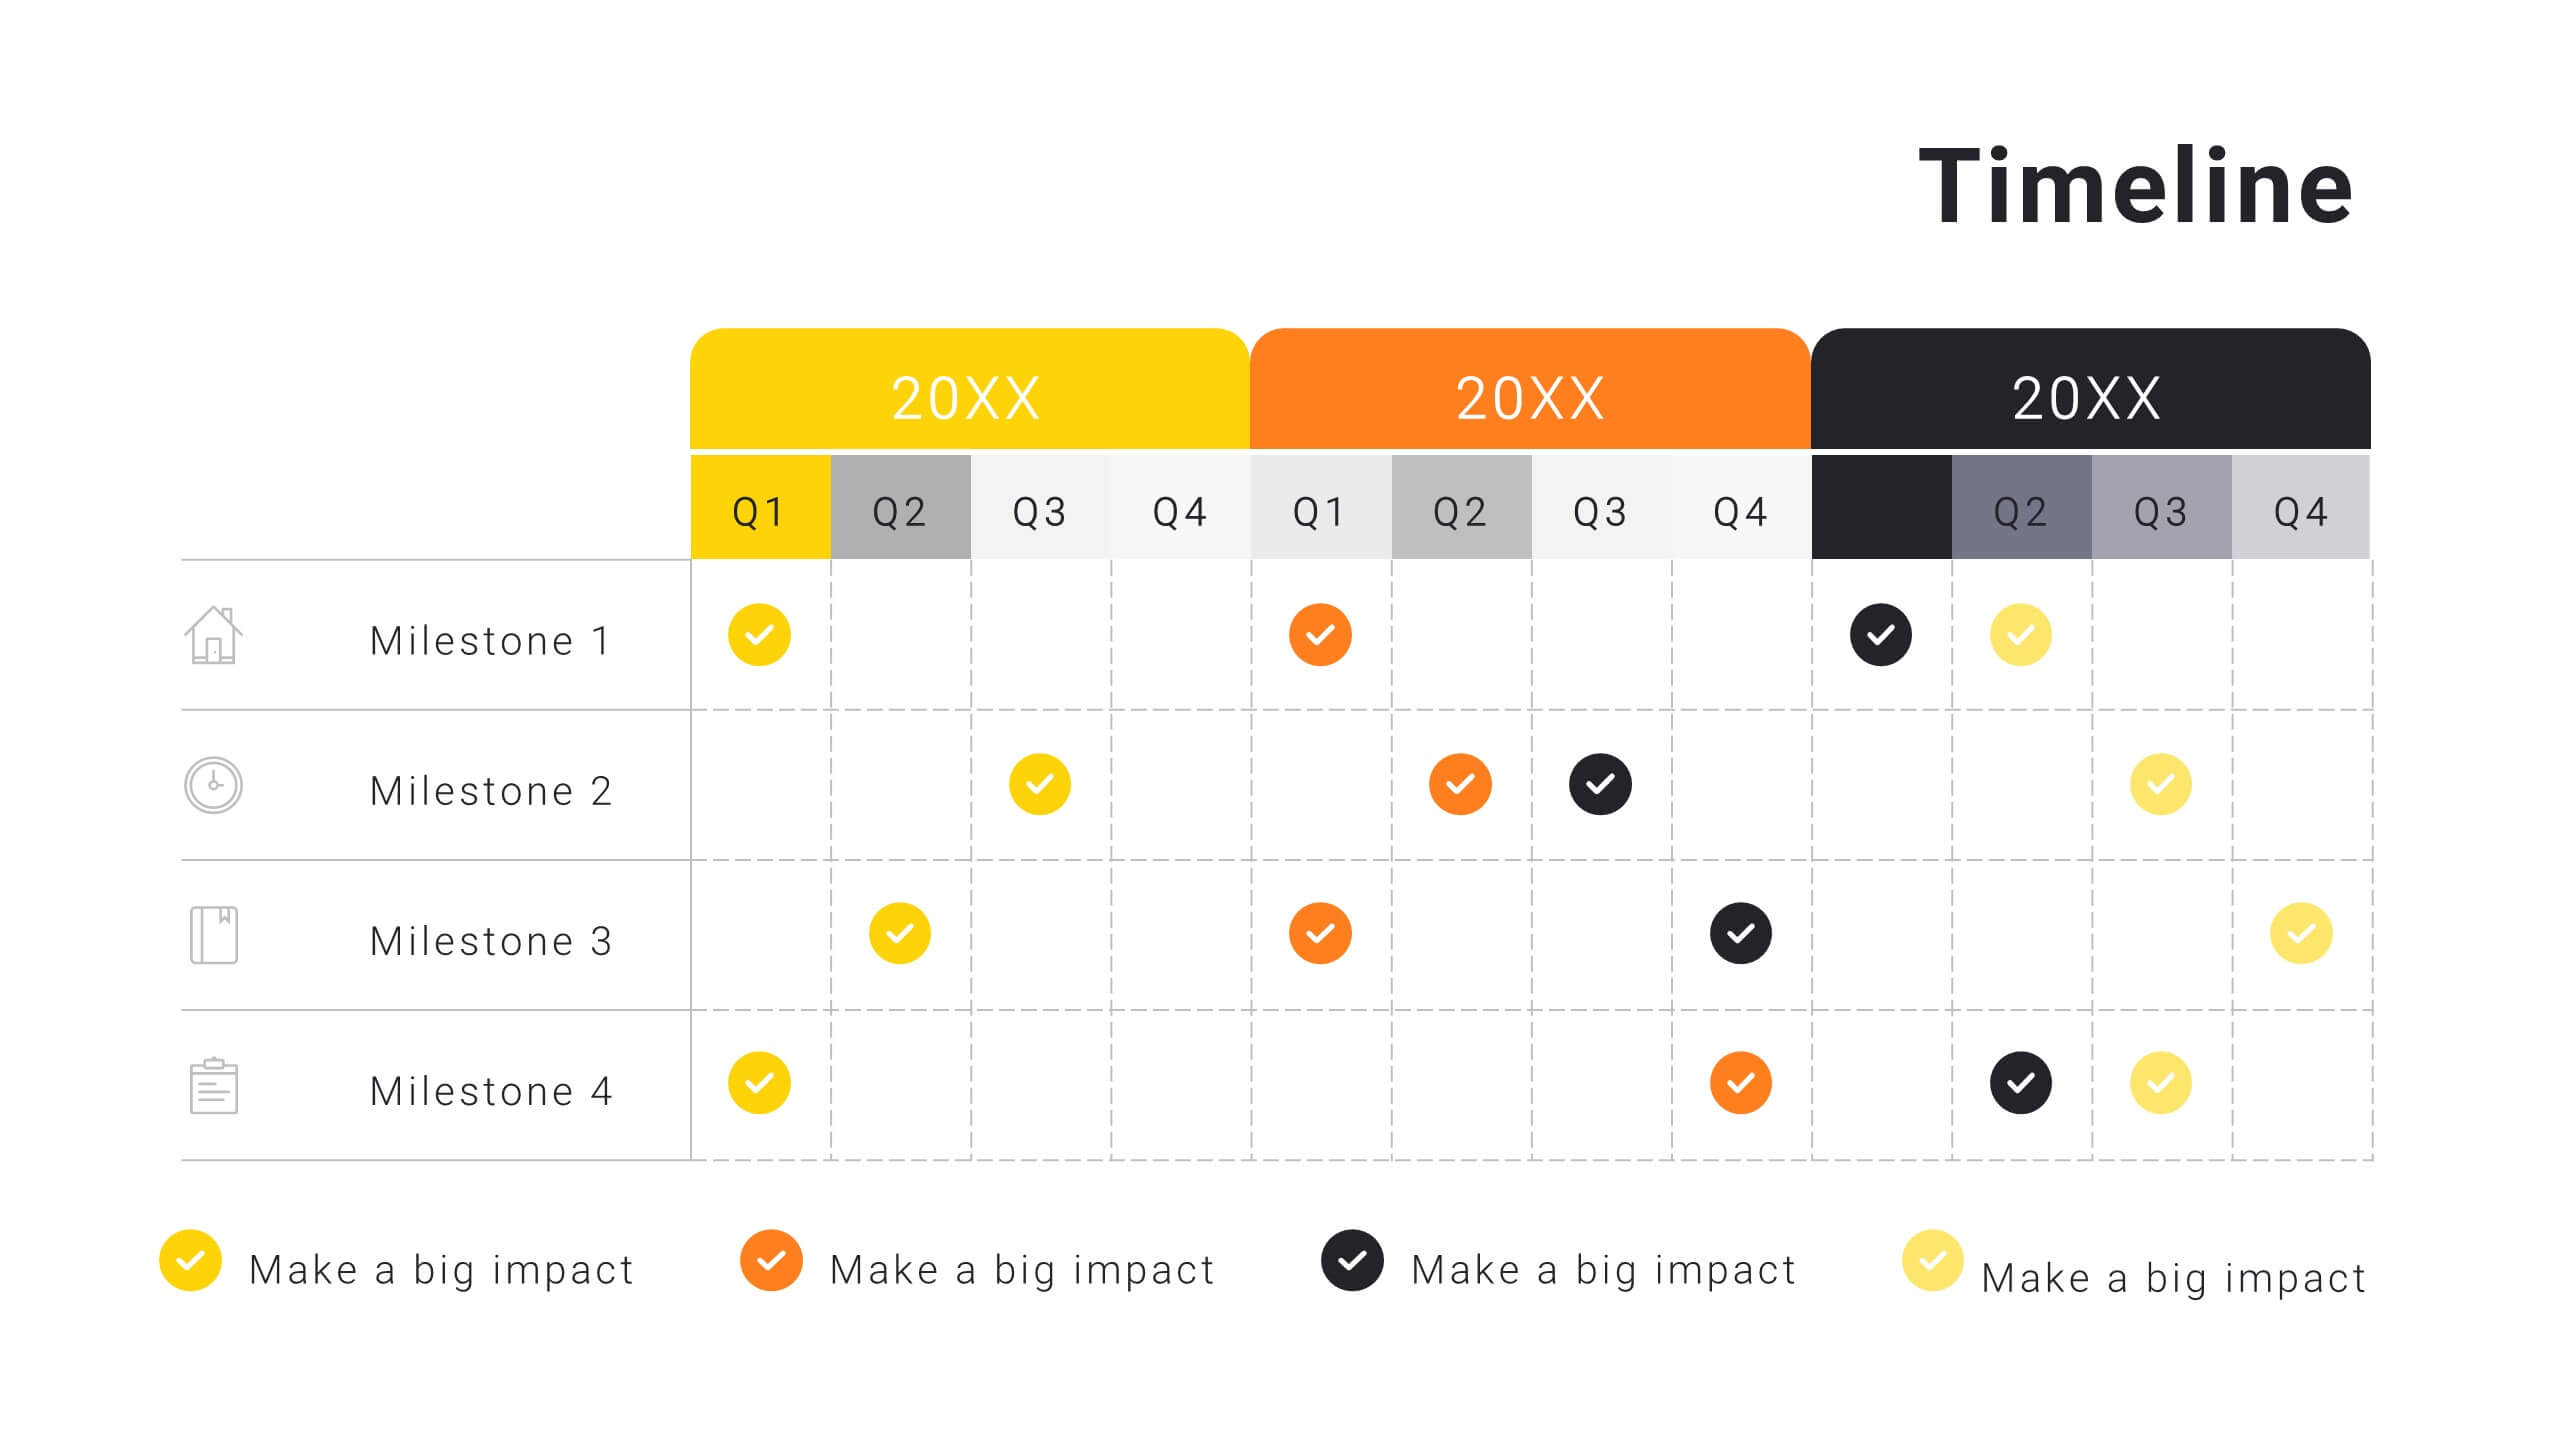
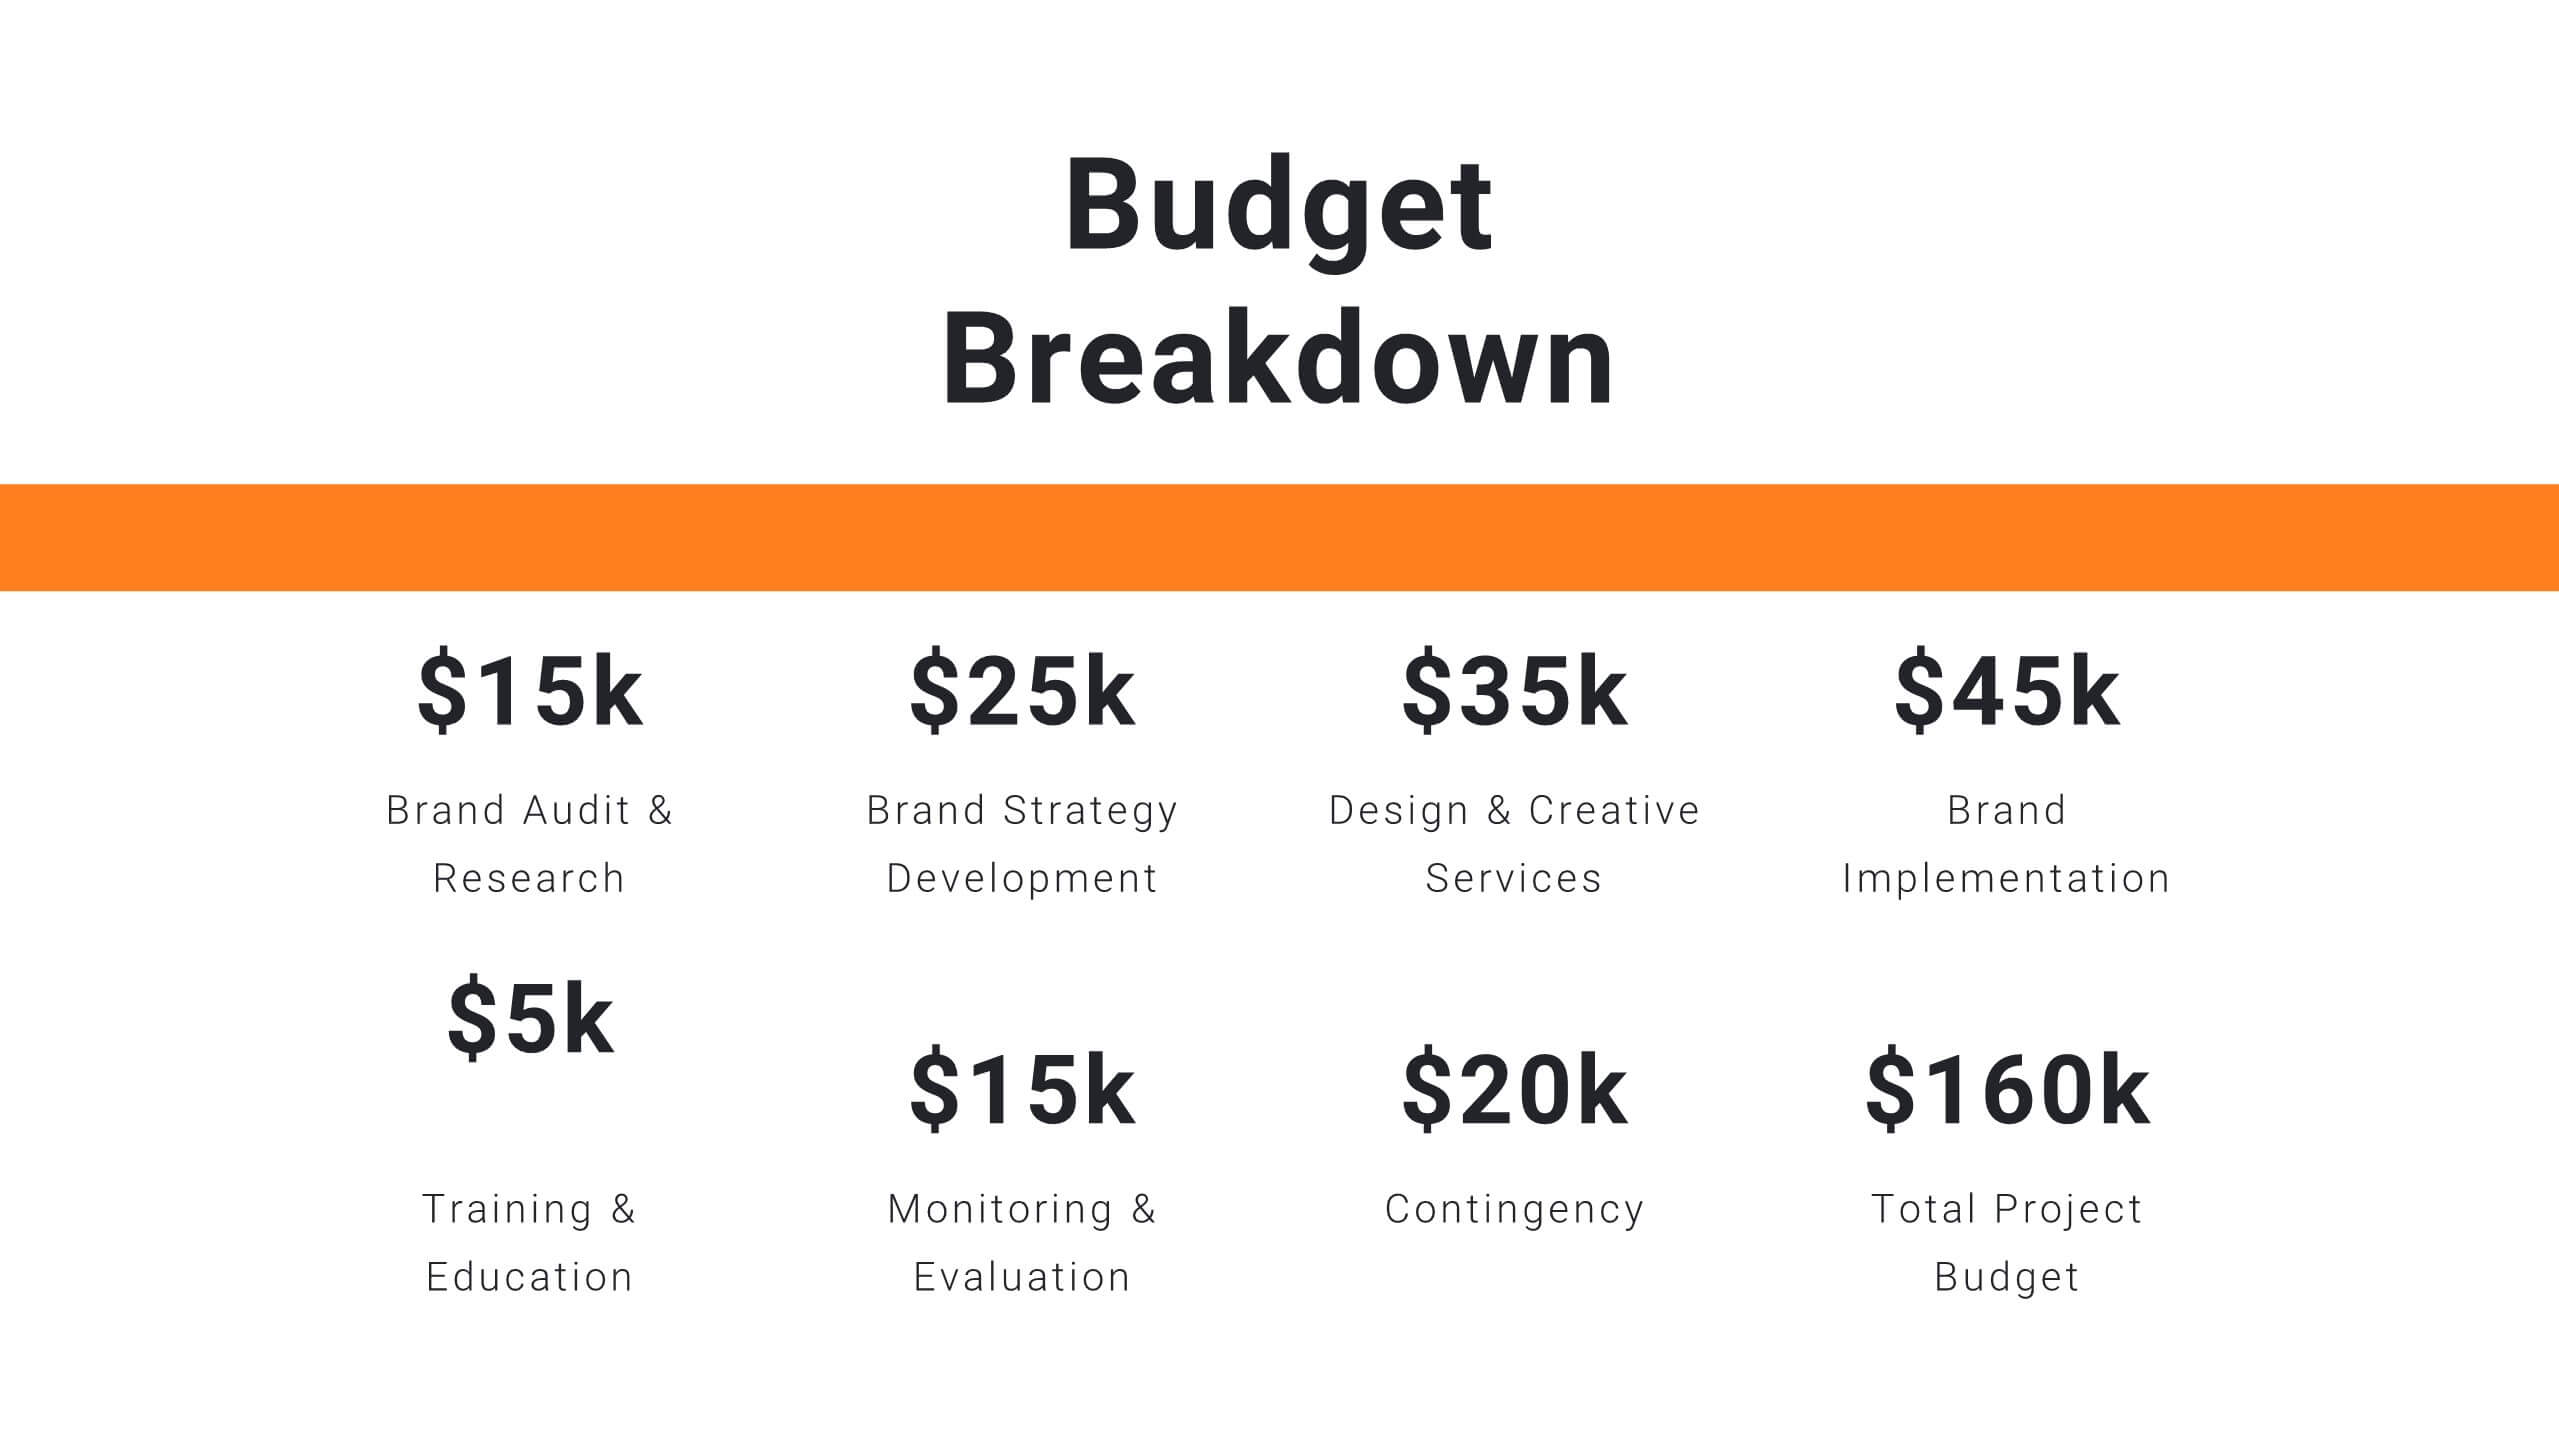
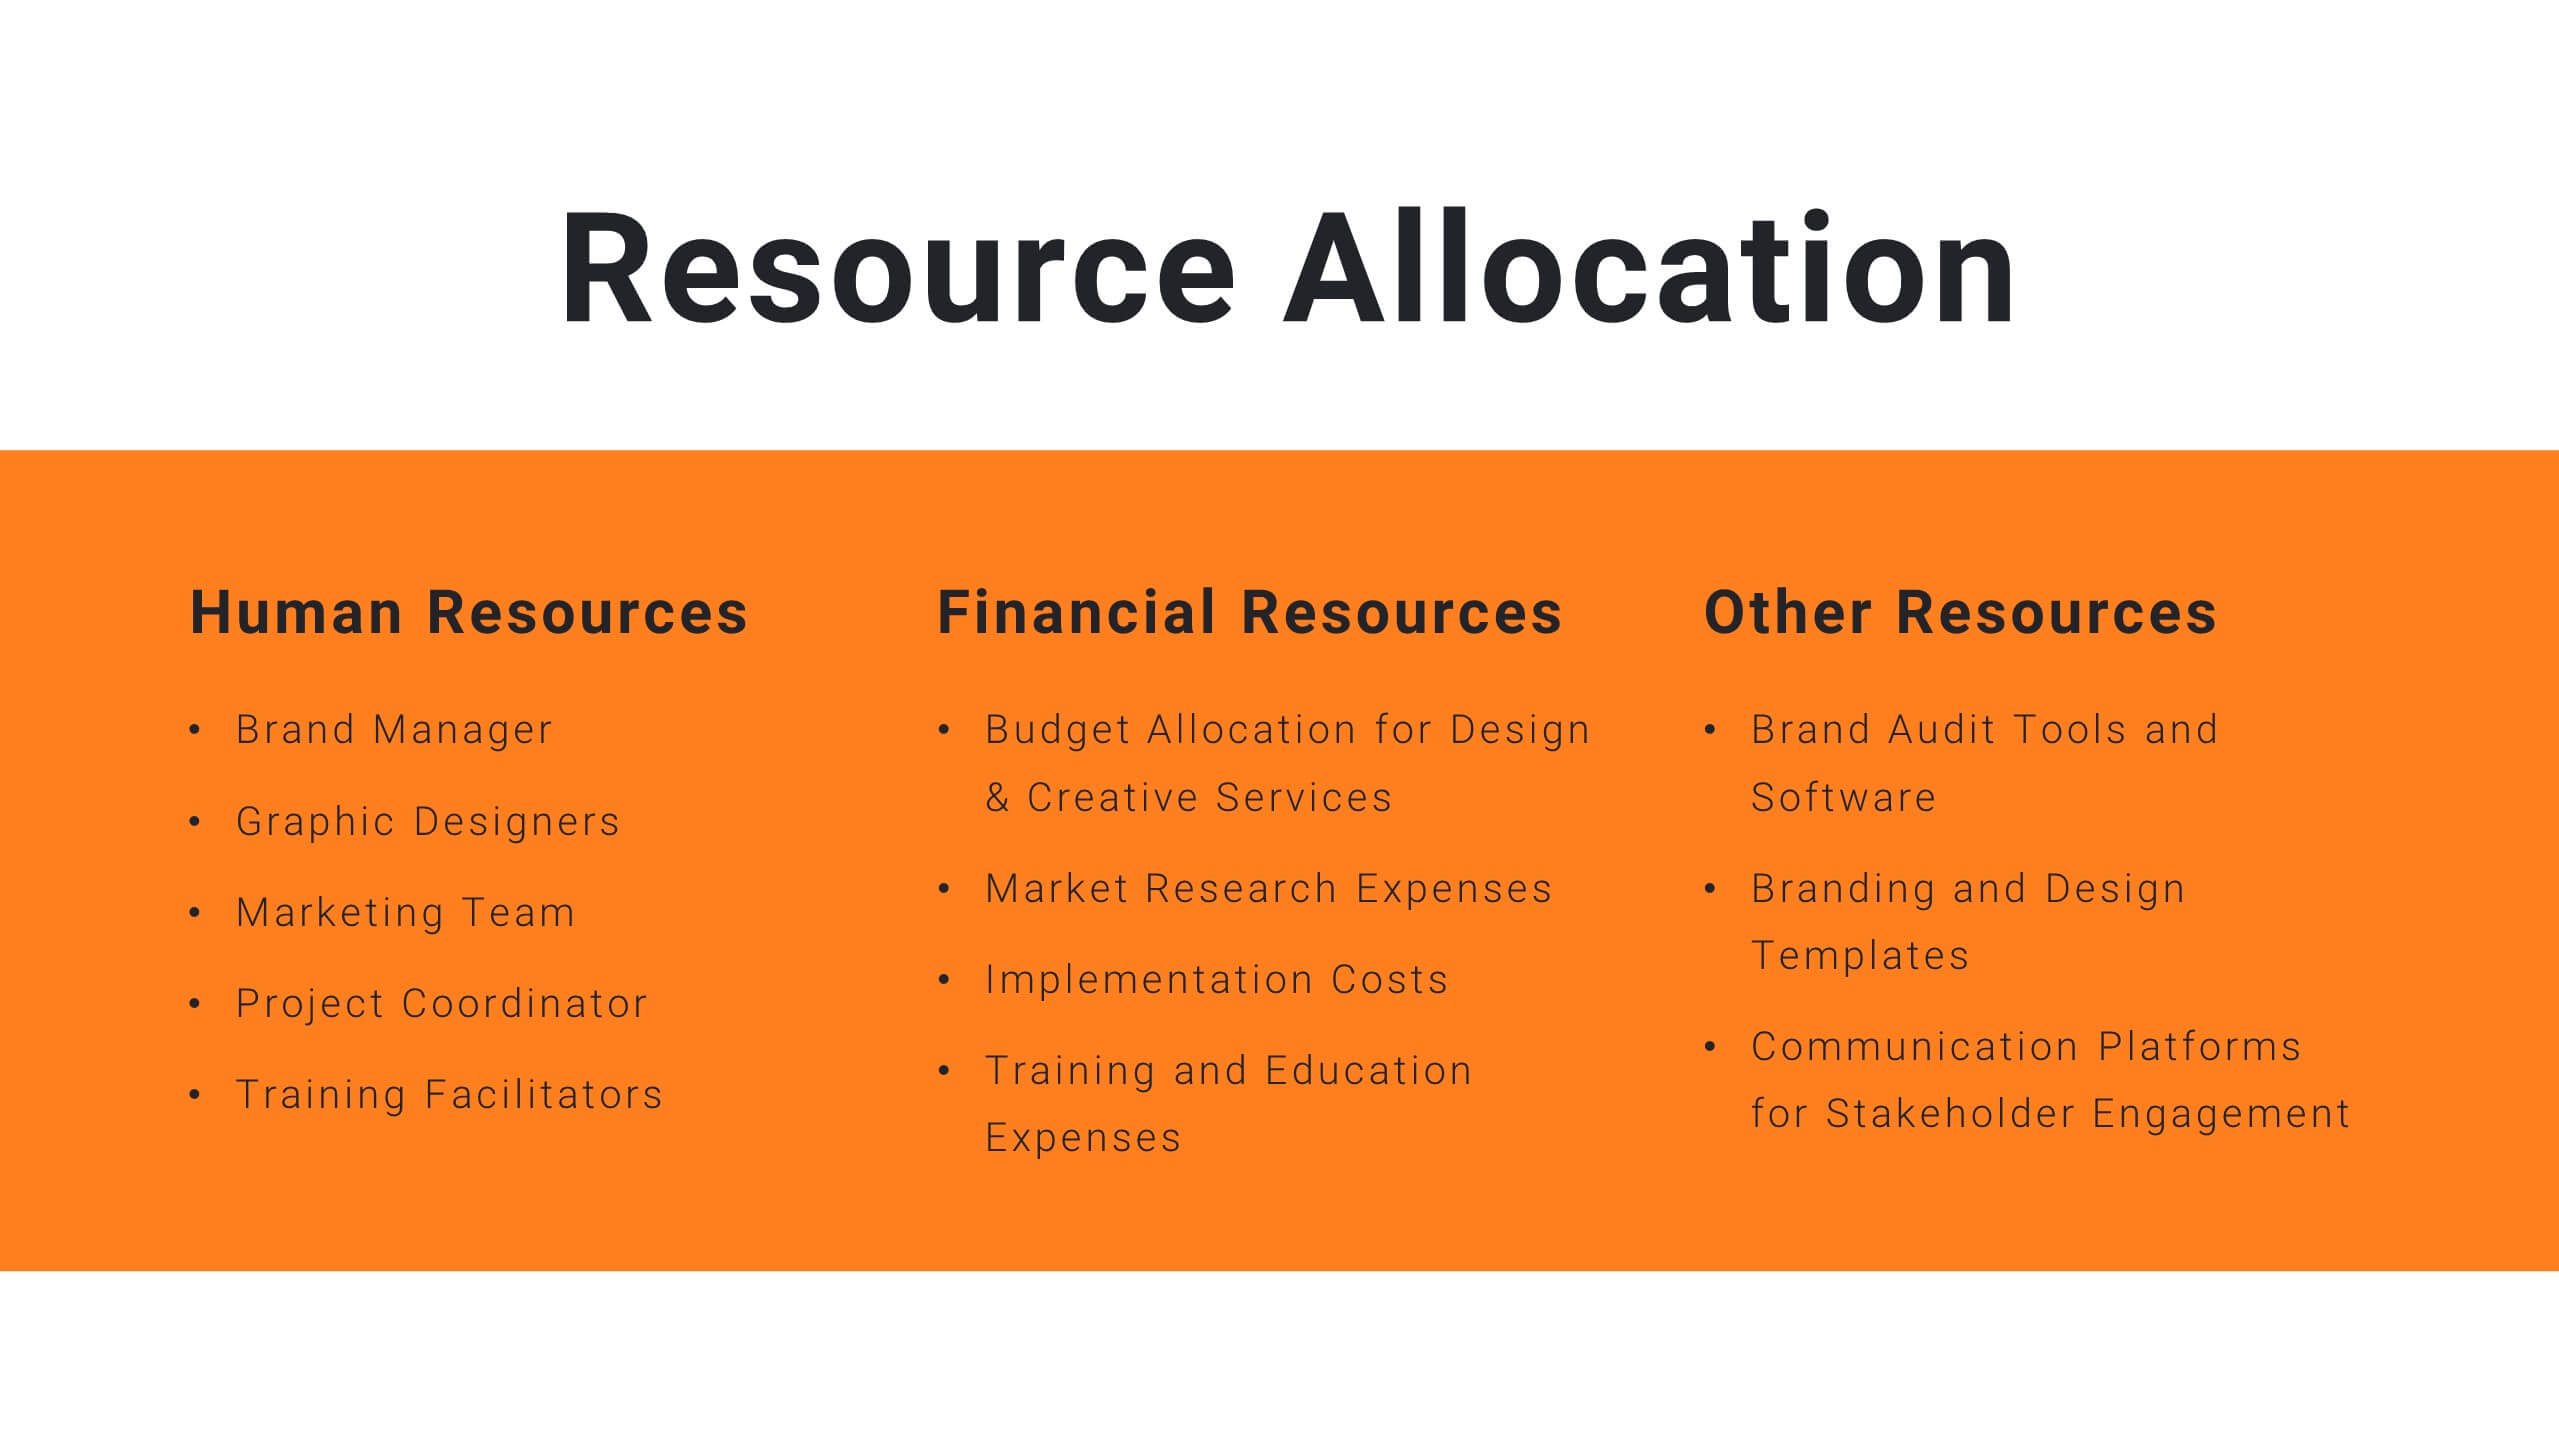
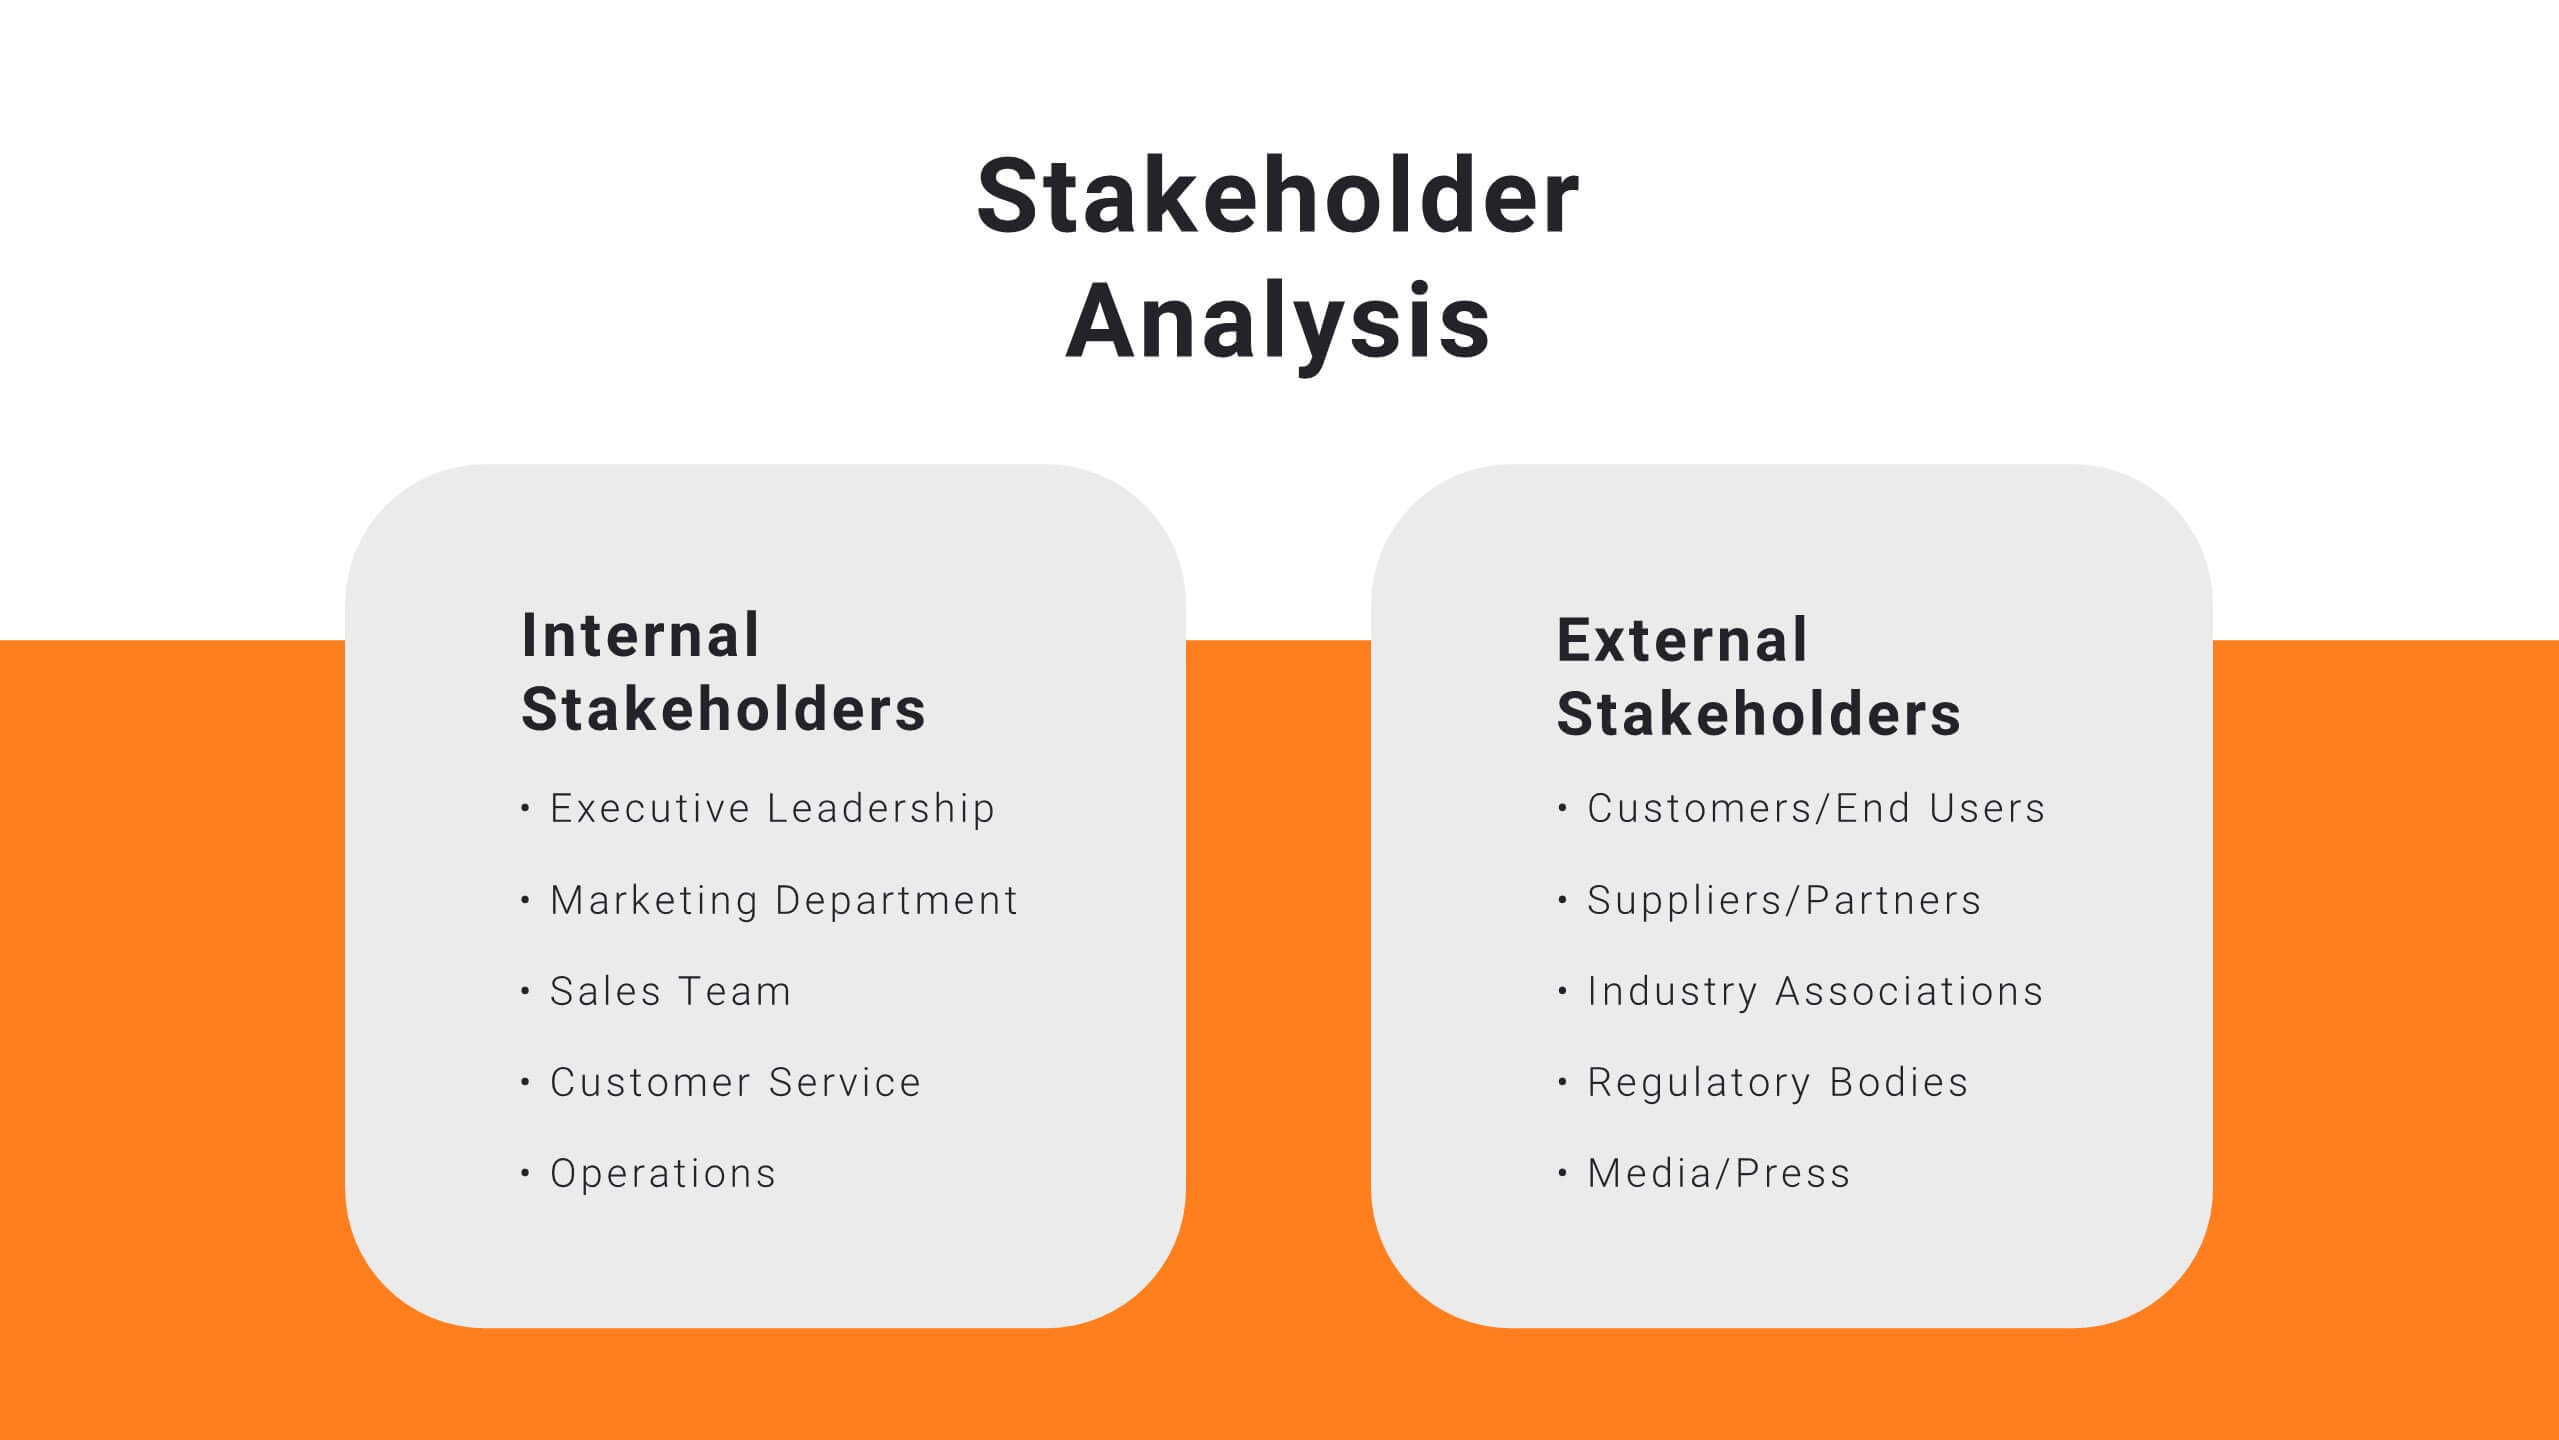
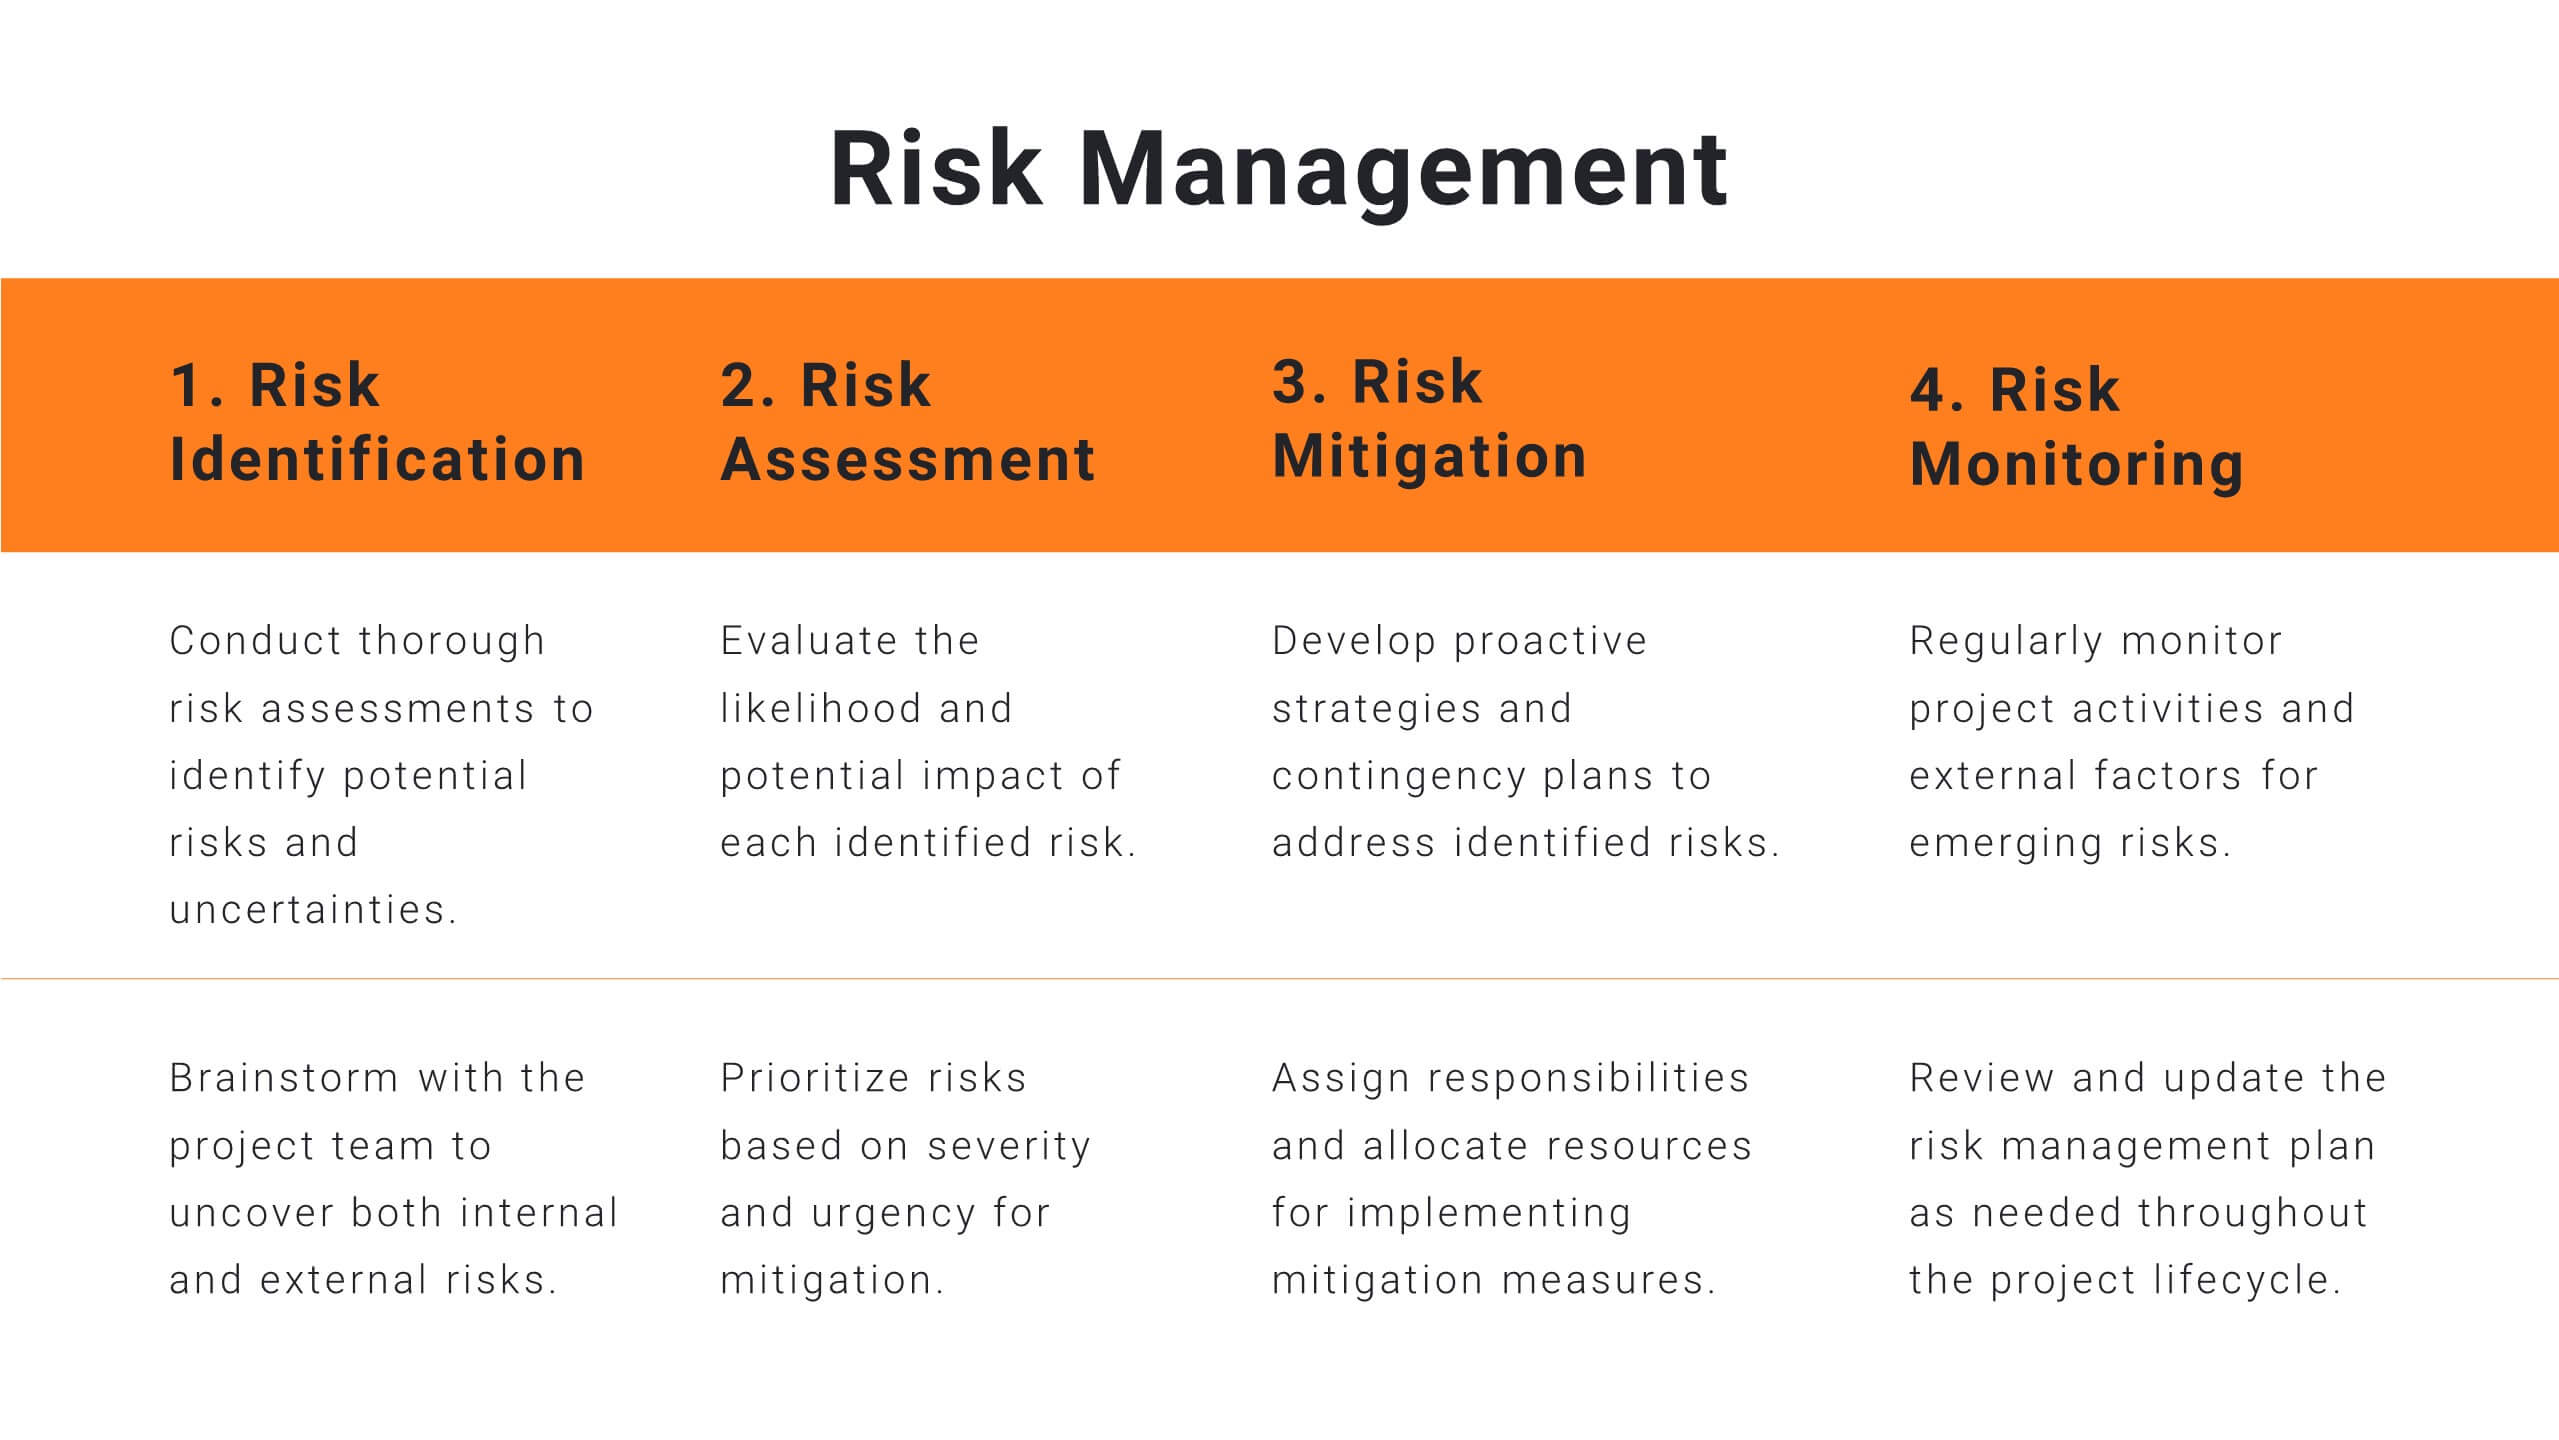
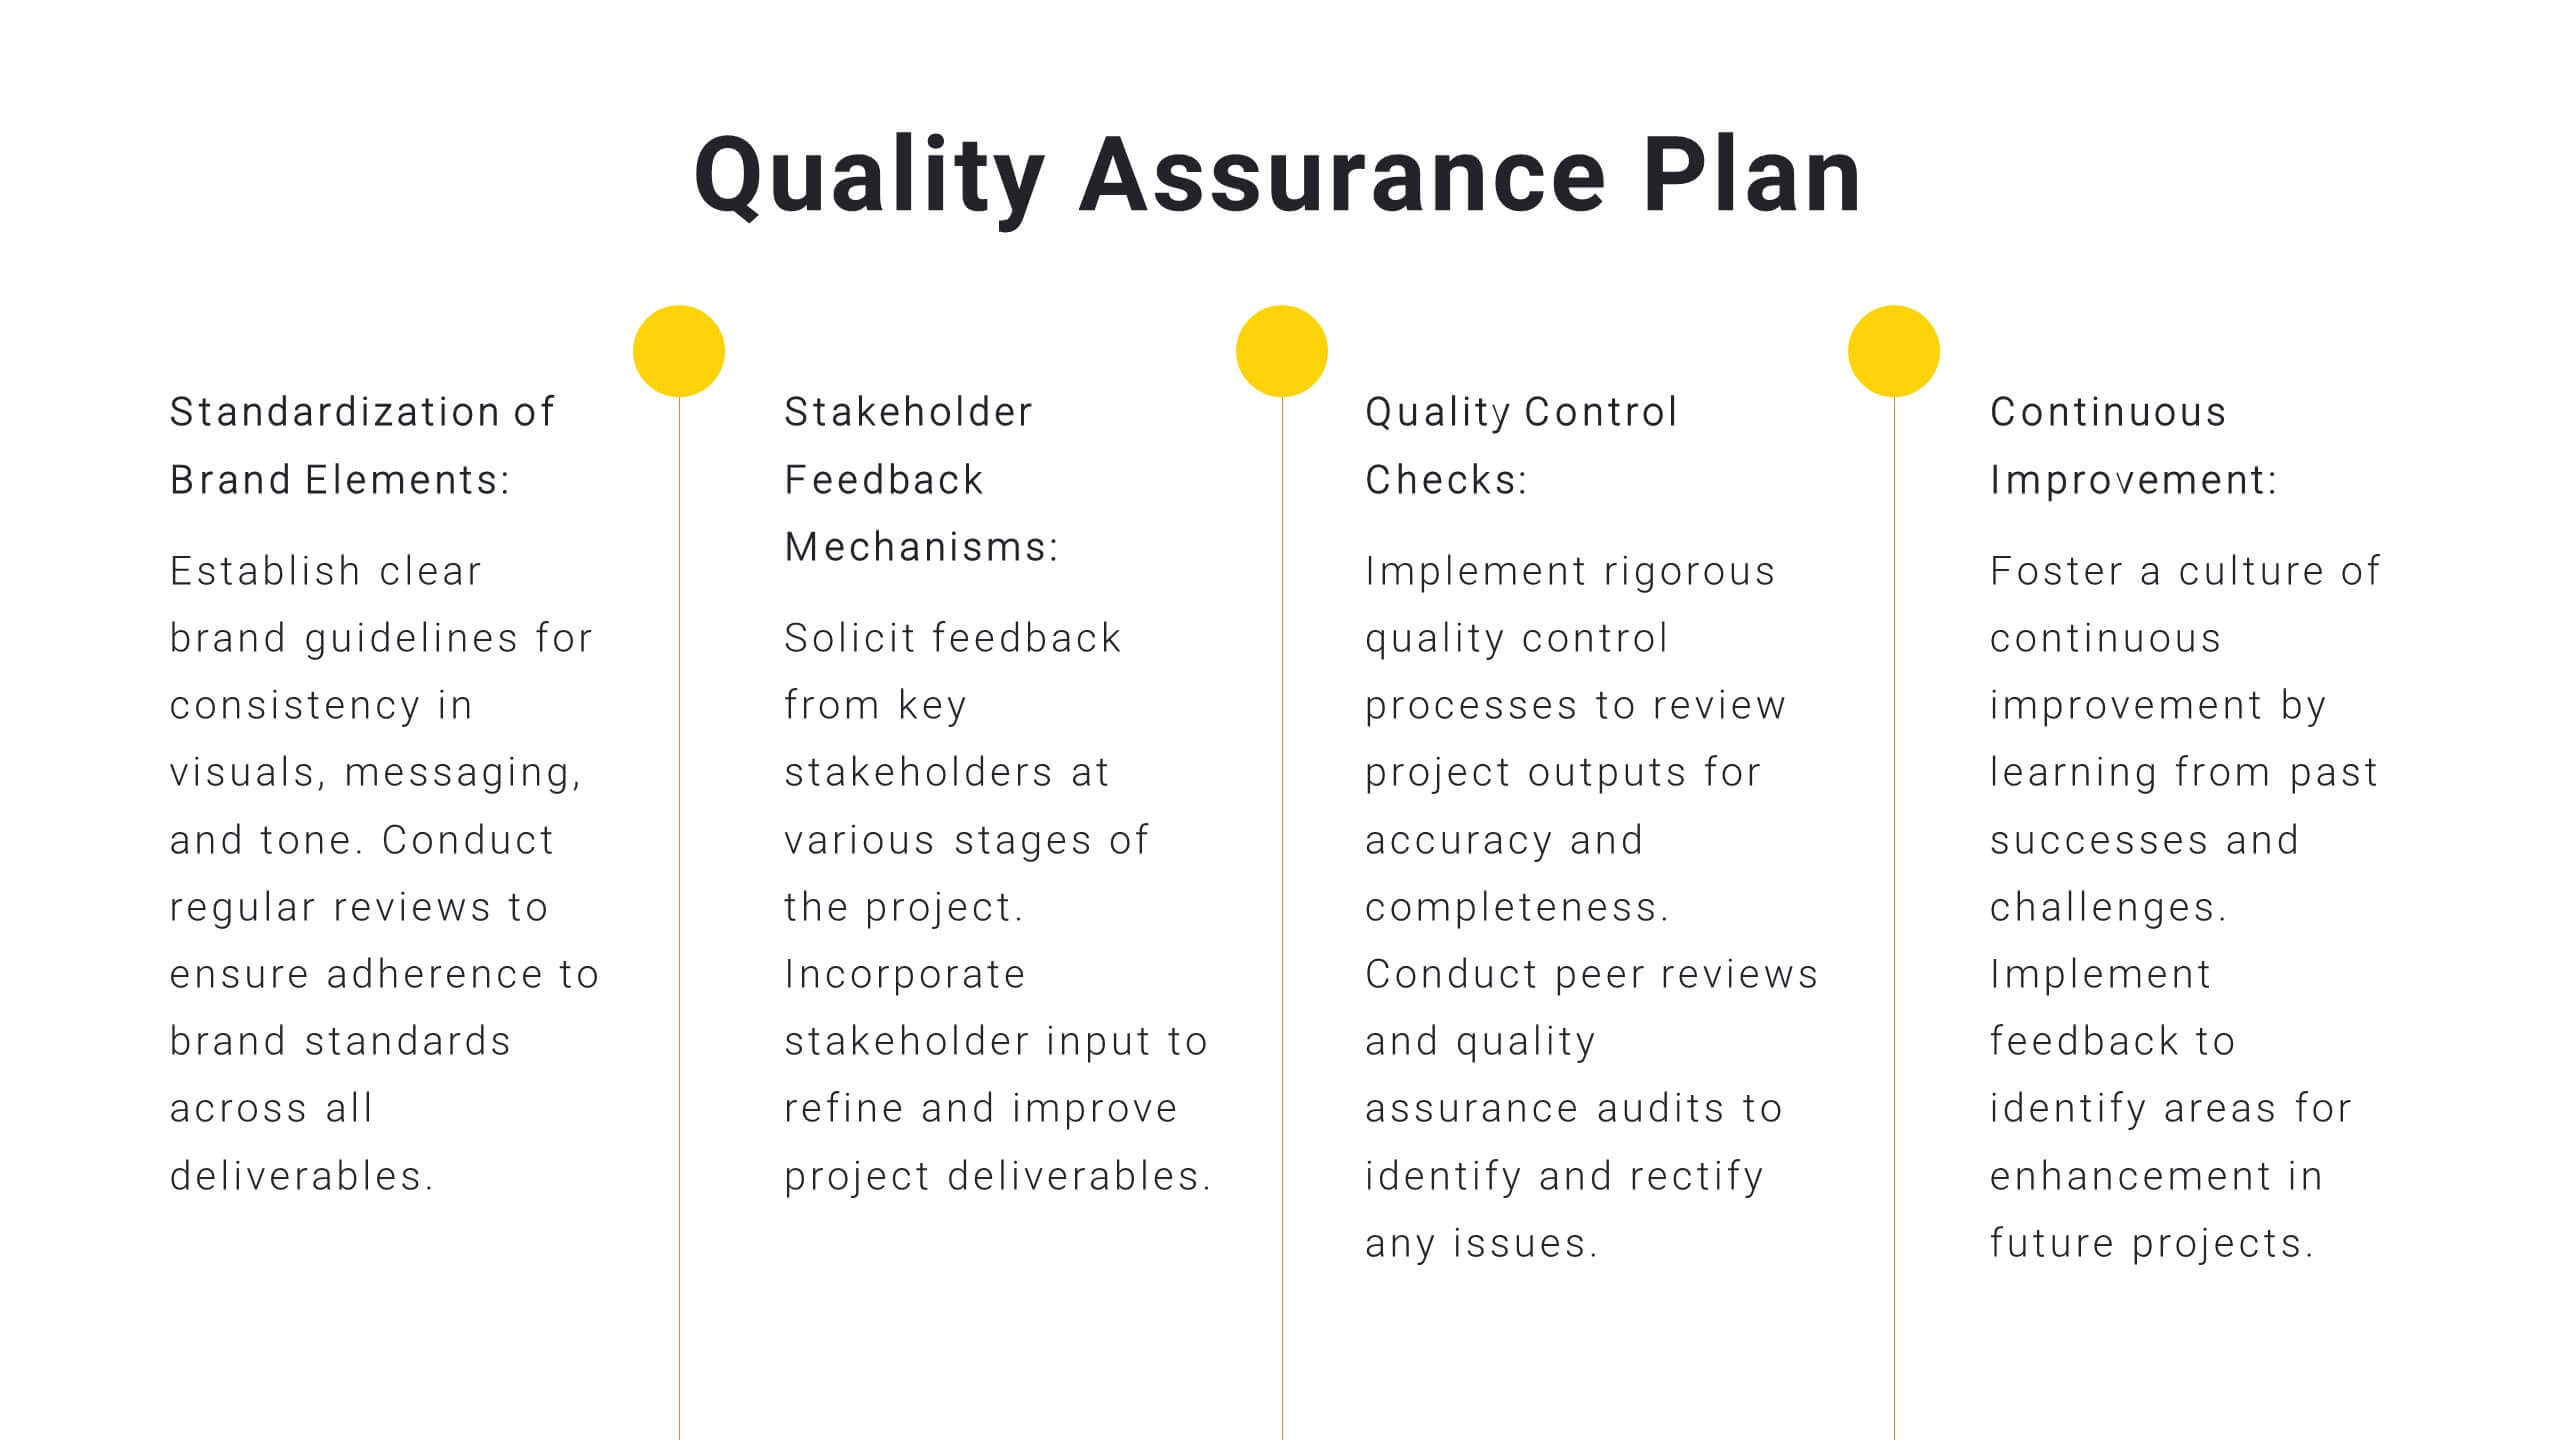
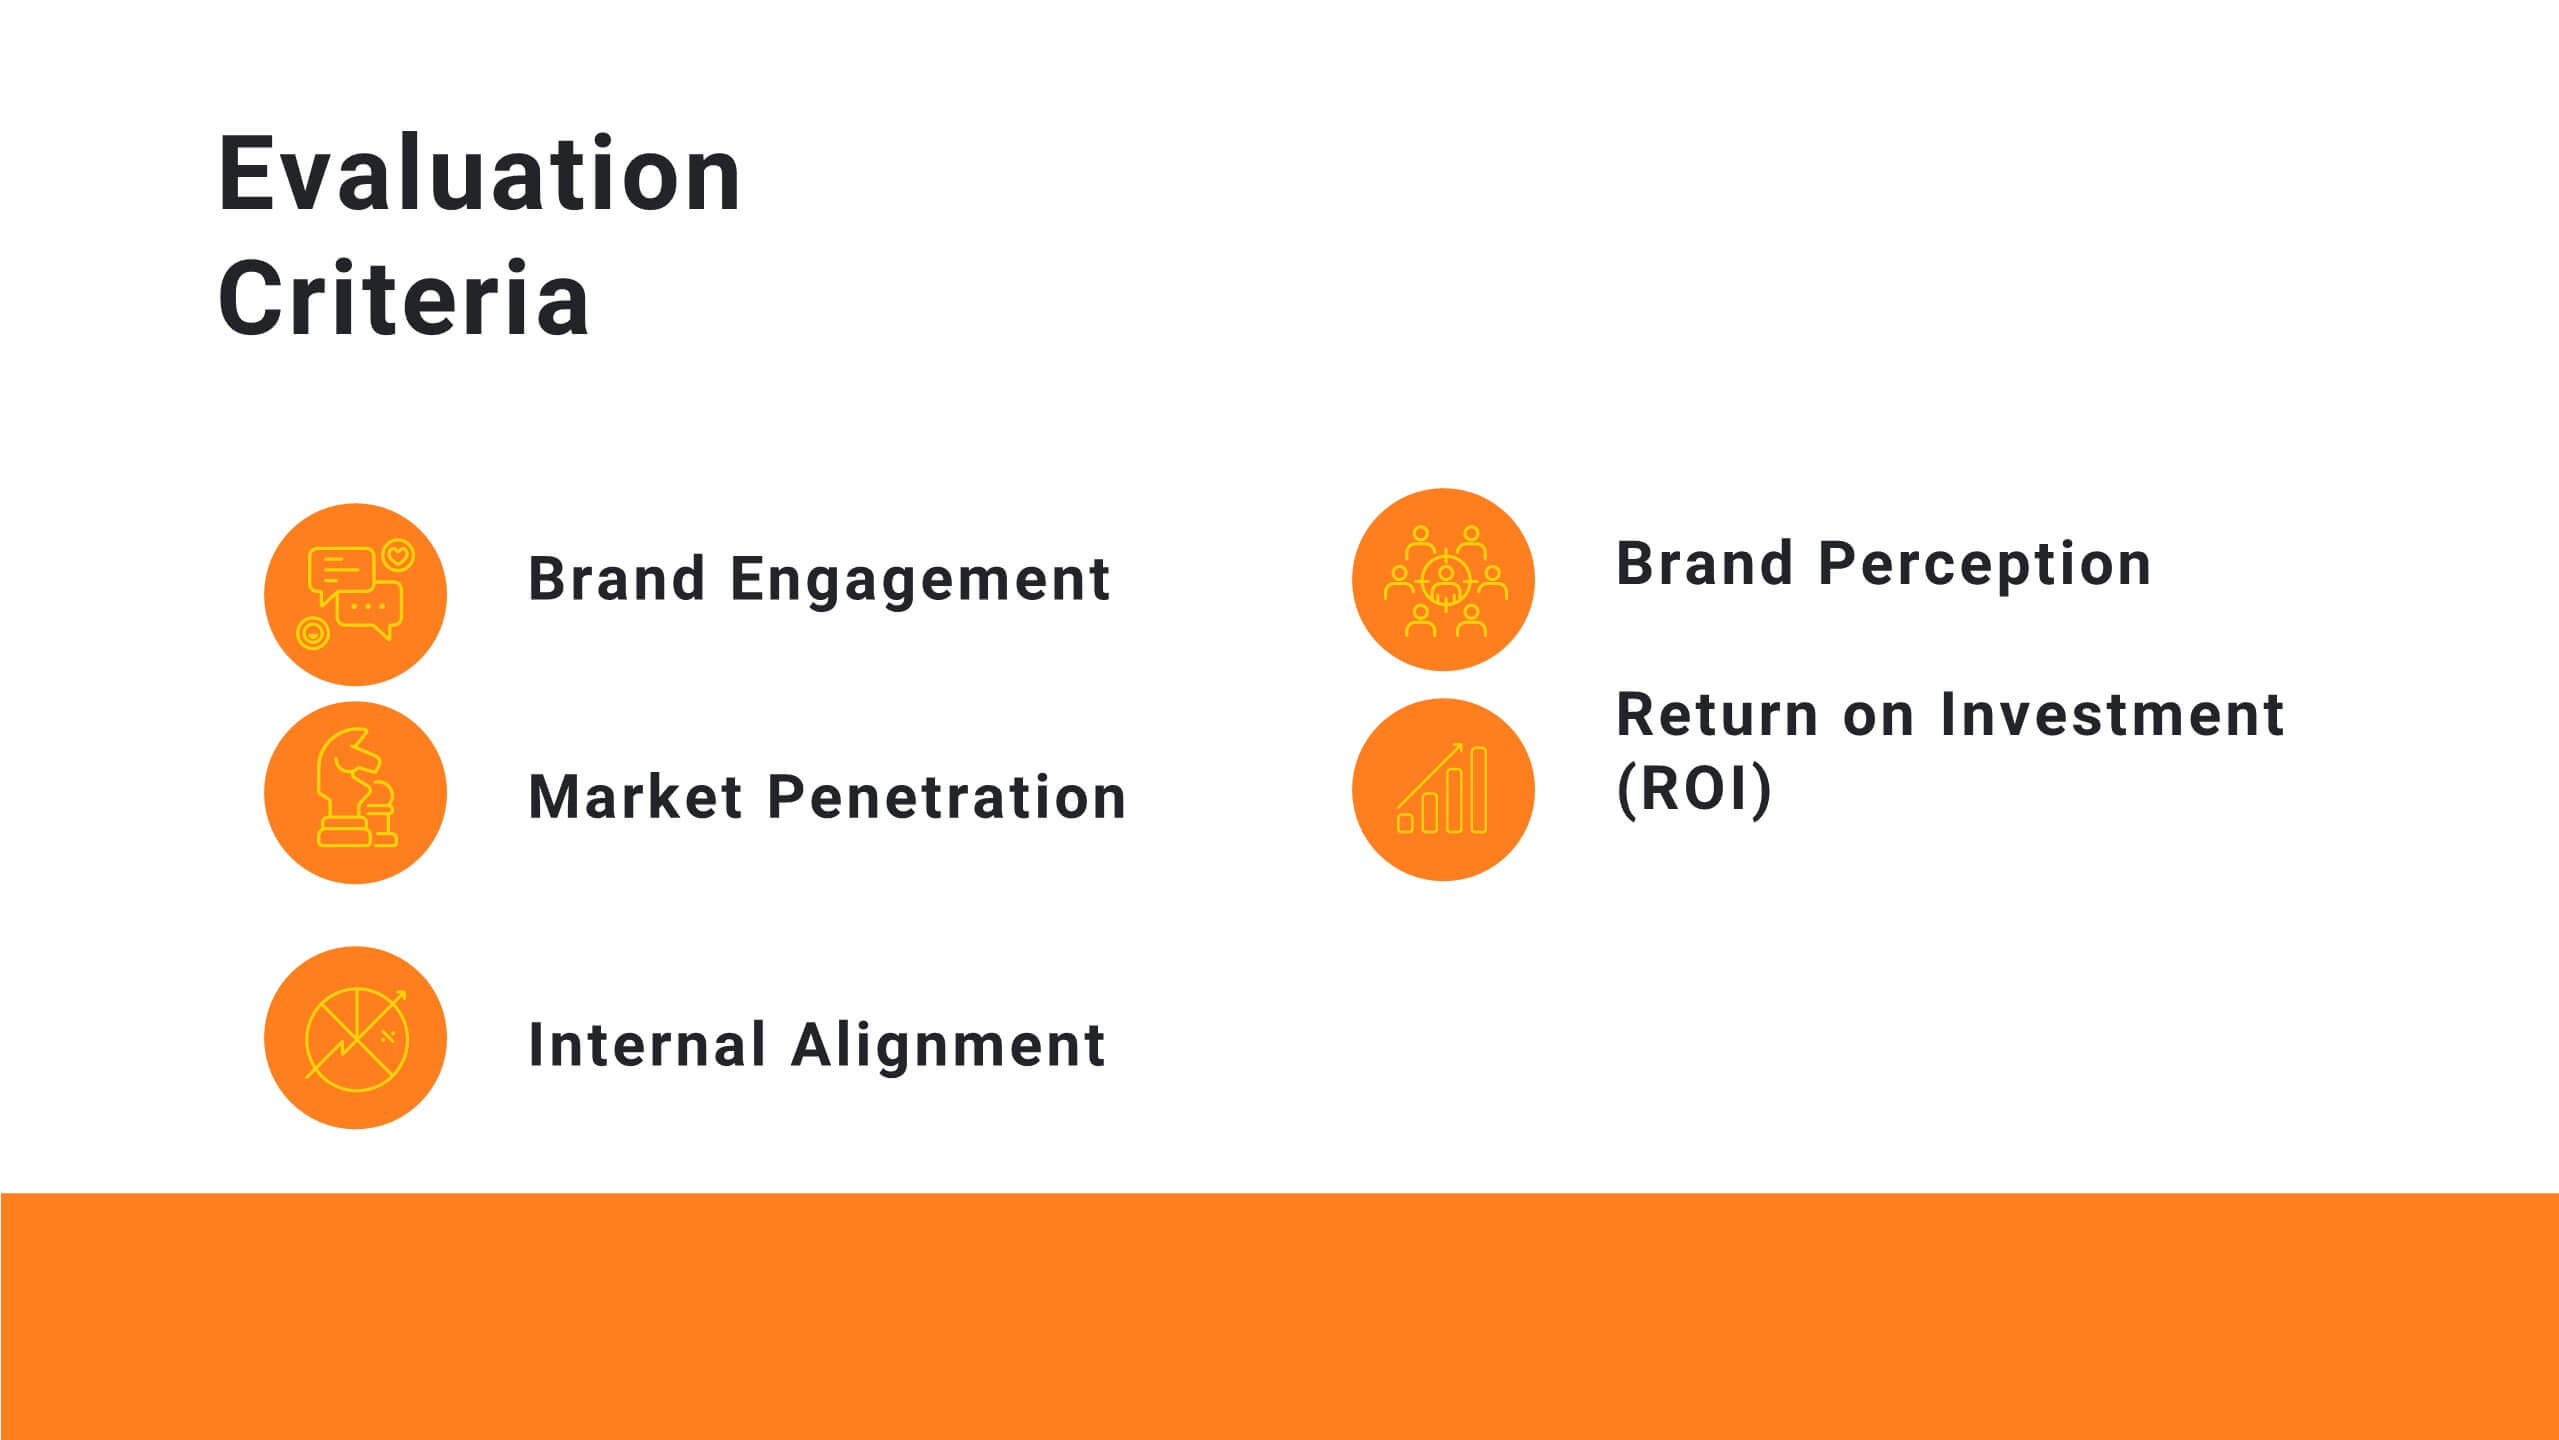
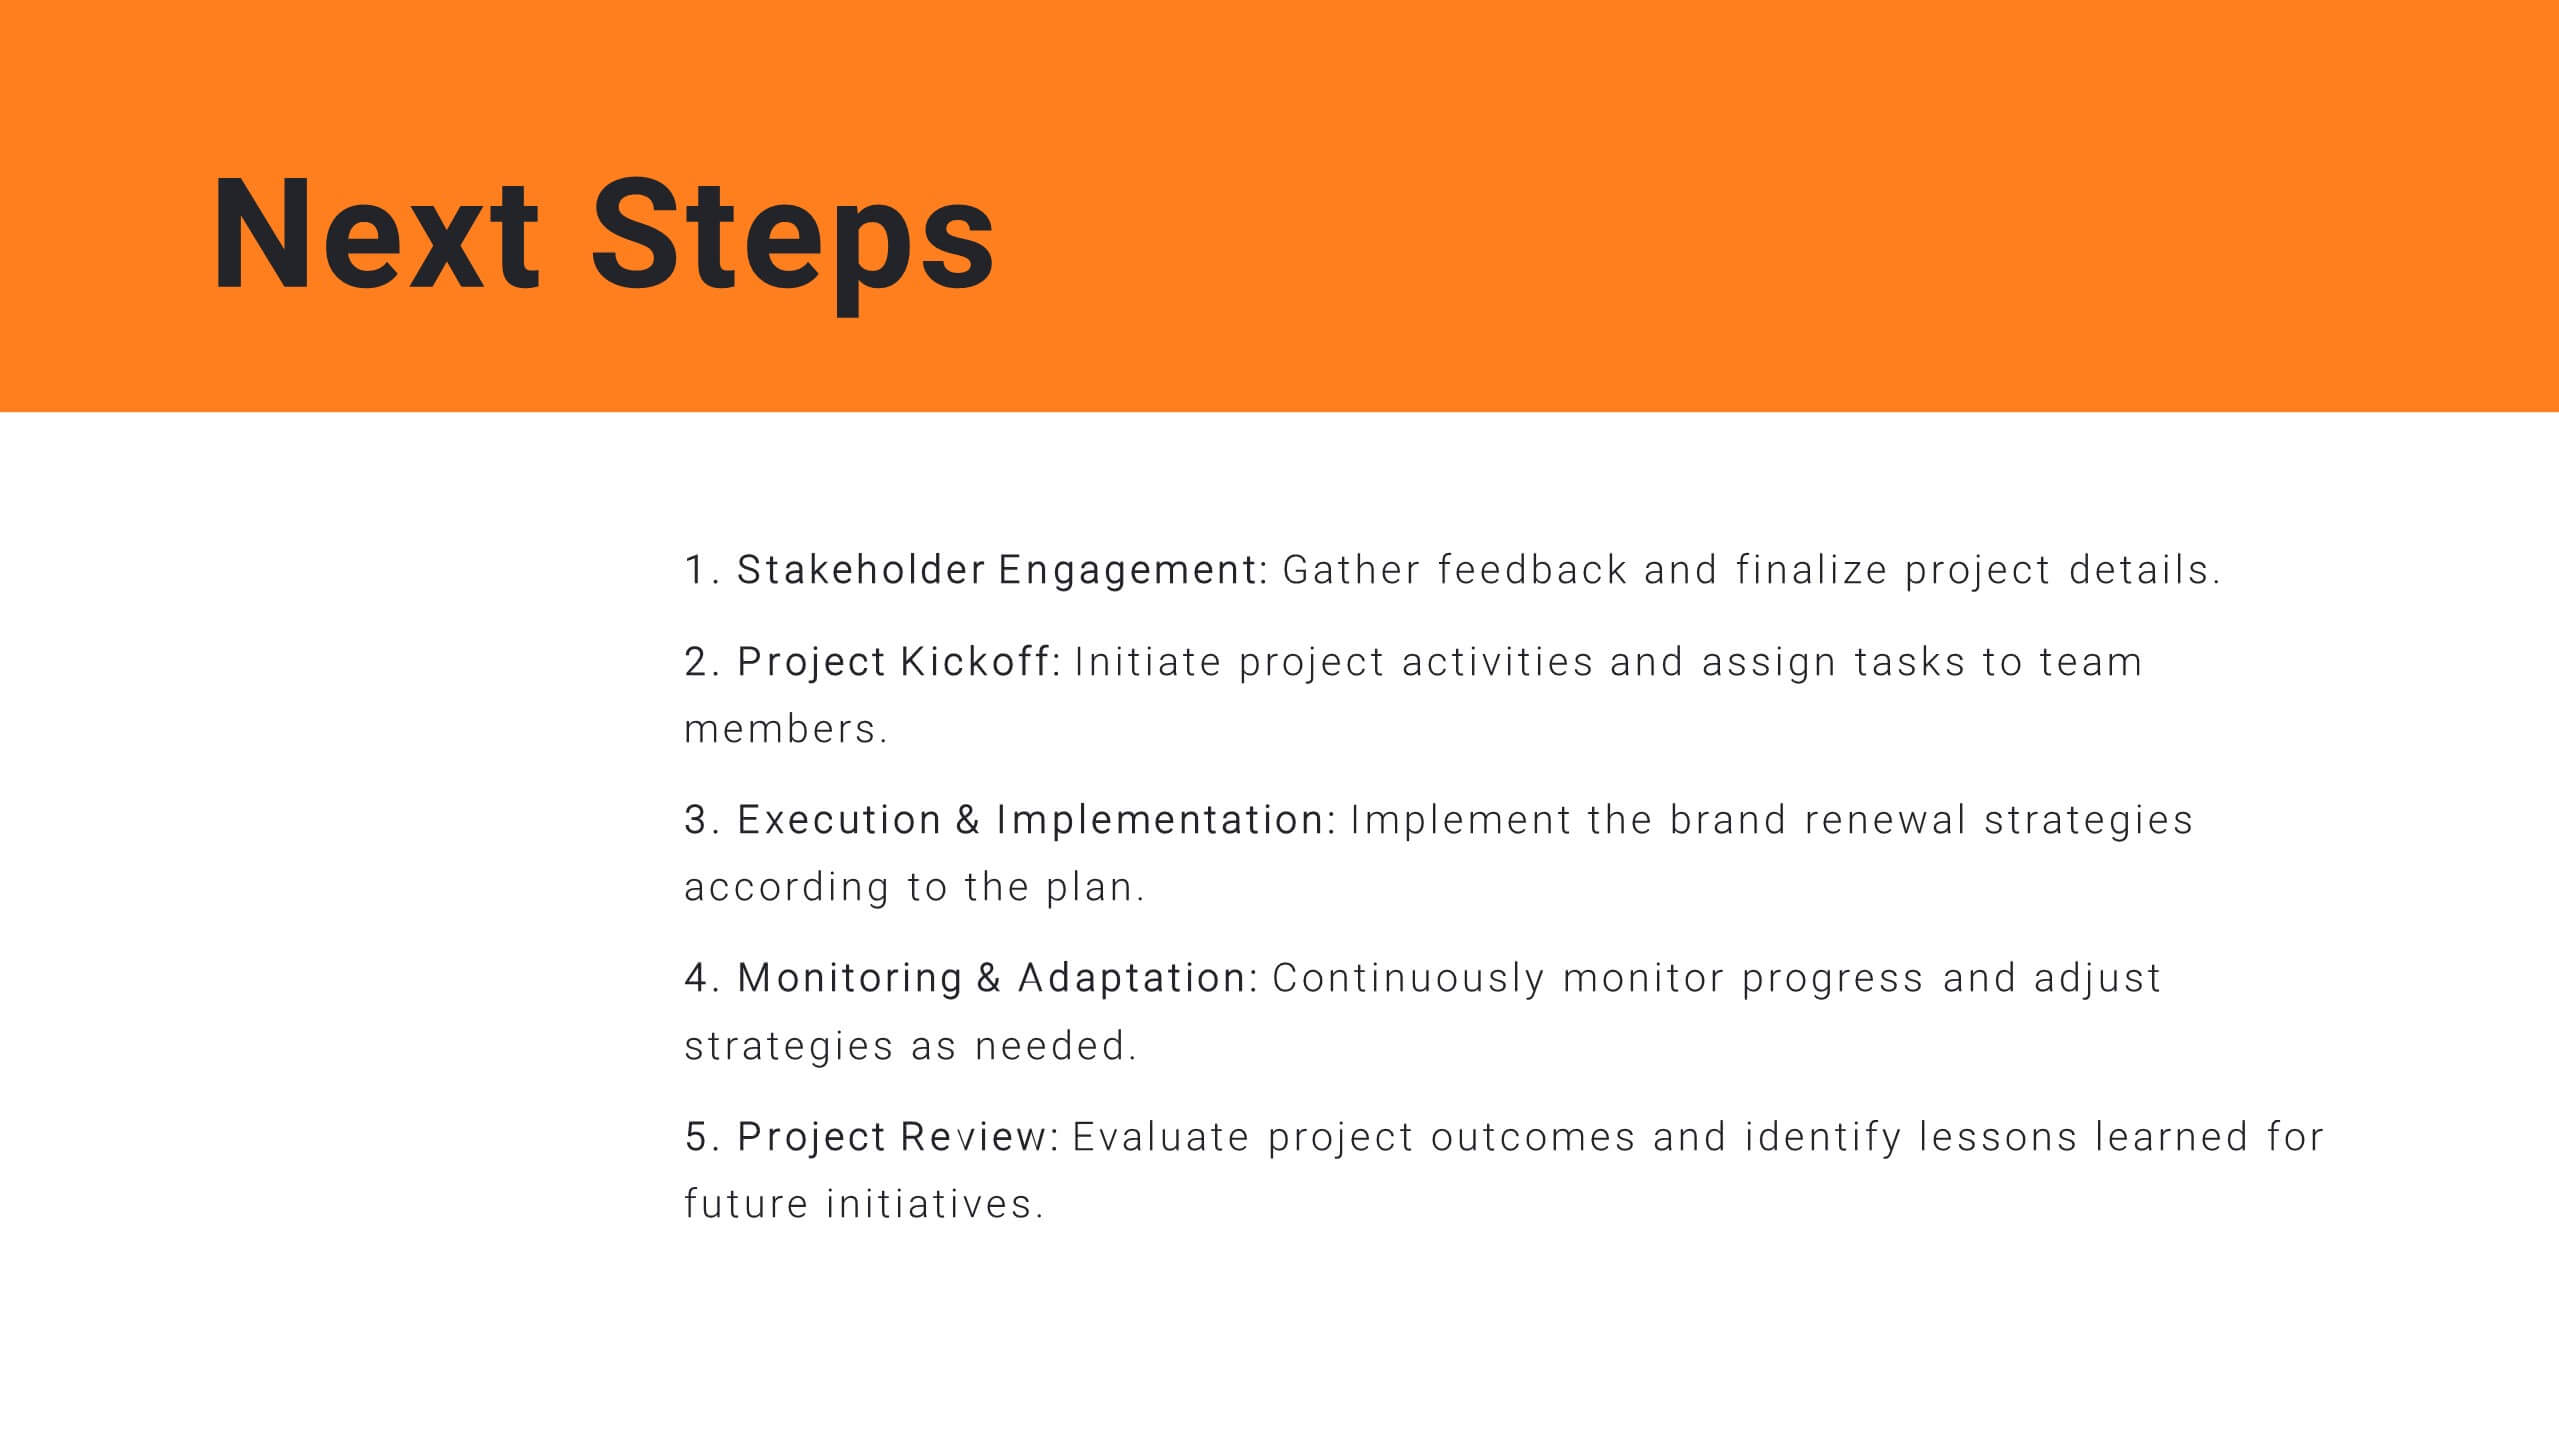
Plan your project efficiently with this comprehensive project management plan template! It covers all essential aspects including timeline, budget, resource allocation, and risk management. Ensure smooth project execution and achieve your objectives. Compatible with PowerPoint, Keynote, and Google Slides, it's designed to streamline your project planning and management process.


6 slides
Break Even Analysis Rate Infographics
Analyze your business's break-even point effectively with our Break-Even Analysis Rate infographic template. This template is fully compatible with popular presentation software like PowerPoint, Keynote, and Google Slides, allowing you to easily customize it to illustrate and communicate critical break-even analysis concepts. The Break-Even Analysis Rate infographic template offers a visually engaging platform to calculate and display the point at which your business covers all its costs and begins to generate a profit. Whether you're an entrepreneur, financial analyst, or business owner, this template provides a user-friendly canvas to create informative presentations and reports on your break-even analysis. Optimize your financial decision-making with this SEO-optimized Break-Even Analysis Rate infographic template, thoughtfully designed for clarity and ease of use. Customize it to showcase your break-even calculations, assumptions, and scenarios, helping you make informed decisions about pricing, costs, and profitability. Start crafting your personalized infographic today to enhance your break-even analysis skills and strategies.


4 slides
Progress Indicators with Harvey Visuals Presentation
Track multiple projects at a glance with the Progress Indicators with Harvey Visuals Presentation. This slide design uses Harvey balls and icons to clearly communicate status across key metrics such as schedule, budget, risk, and issues. Ideal for PMOs, stakeholder updates, or cross-functional reviews. Fully editable and compatible with PowerPoint, Keynote, and Google Slides.


21 slides
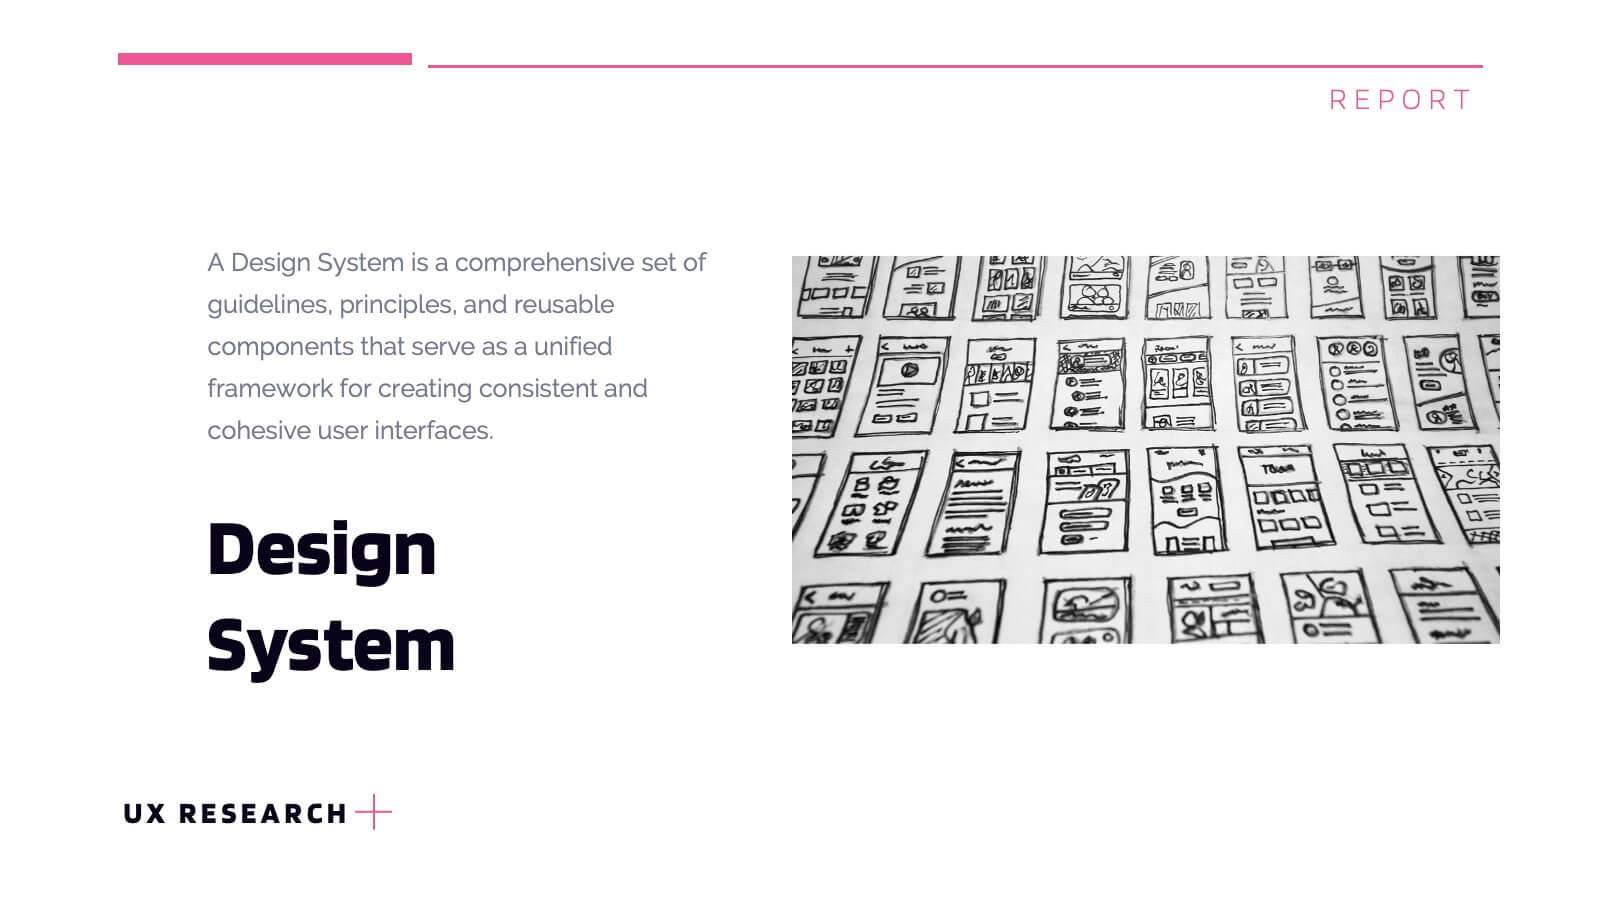
Lumascend UX Research Report Presentation
Present your UX research findings with clarity using this engaging and organized template! Covering key areas like user personas, wireframes, testing, and interaction design, it ensures all aspects of your design process are communicated effectively. Perfect for UX teams, stakeholders, or client presentations, this template works seamlessly with PowerPoint, Keynote, and Google Slides.


5 slides
Growth and Scale Indicators Overview Presentation
Highlight your company's upward momentum with the Growth and Scale Indicators Overview Presentation. This slide features a pyramid-style design to represent five progressive milestones or performance metrics, perfect for visualizing success benchmarks or key achievements. Fully customizable in Canva, PowerPoint, Keynote, and Google Slides for seamless integration into your presentations.


6 slides
Children's Smile Rating Infographic
Smile Rating refers to a method of evaluating customer satisfaction or user experience by measuring the positive emotional response elicited, often in the form of a smile. This infographic template is a visually engaging way to showcase customer satisfaction or feedback using smiley faces to represent different levels of happiness or contentment. This type of infographic is commonly used in customer service, user experience, and feedback analysis. This can provide valuable insights into emotional engagement and satisfaction. This infographic is designed to focus on providing services or products that are intended to create a positive and enjoyable experience.


2 slides
Weekly Agenda Presentation
Keep your week running smoothly with a clean, organized layout that highlights priorities, tasks, and key reminders at a glance. This presentation makes planning effortless, helping teams stay aligned and focused throughout the week. Ideal for meetings, schedules, and productivity workflows. Fully compatible with PowerPoint, Keynote, and Google Slides.


4 slides
Problem-Solving Strategy Presentation
Navigate challenges with confidence using this problem-solving strategy template! Designed to break down complex issues into manageable steps, this structured layout helps teams identify solutions effectively. Perfect for business leaders, project managers, and strategists aiming for clarity and action. Fully customizable and compatible with PowerPoint, Keynote, and Google Slides.
7 slides
Arrow Infographic Presentation Template
Arrow Infographics are a great tool to visualize changes, positioning and processes. You can use the arrows to show the direction of your startup or to explain the stages of a business plan. Present your strategies, stages, and plans in a clear & concise way. Use this arrow Infographic template to present complex topics. Arrows are great for highlighting the progress of a project and its relationship with other projects. Use this template to visualize the process of a business strategy. This Arrow Infographic Template gives you all the essentials you need when it comes to creating your own.


7 slides
Creative Thinking and Disruption Model
Visualize your strategy for breakthrough ideas with the Creative Thinking and Disruption Model Presentation. Featuring a bold head silhouette layout, this slide highlights six key elements of innovative thinking—perfect for workshops, leadership discussions, or startup pitches. Fully customizable in PowerPoint, Keynote, and Google Slides.


5 slides
Sustainable Growth and Green Policy Presentation
Showcase your eco-initiatives with the Sustainable Growth and Green Policy Presentation. This unique leaf-shaped diagram highlights four key environmental pillars—ideal for presenting climate strategies, energy policies, or green development goals. With a sleek and modern design, it’s perfect for NGOs, government briefings, or corporate sustainability reports. Editable in Canva, PowerPoint, Keynote, and Google Slides.


6 slides
Green Innovation and Eco Impact Presentation
Present your sustainability initiatives with this circular eco infographic. Ideal for showcasing six stages of environmental impact, green innovation, or lifecycle analysis. Features clean, modern icons and color-coded segments. Fully editable in PowerPoint, Keynote, and Google Slides—perfect for corporate ESG updates, eco campaigns, or environmental project planning.


6 slides
Organizational Mind Mapping Slide Presentation
Bright ideas deserve a space to grow, and this presentation turns complex thoughts into a clean, organized visual map. It helps teams outline processes, connect concepts, and structure information with clarity and flow. Perfect for planning or strategy sessions. Fully compatible with PowerPoint, Keynote, and Google Slides.