


Features
- 5 Unique slides
- Fully editable and easy to edit in Microsoft Powerpoint, Keynote and Google Slides
- 16:9 widescreen layout
- Clean and professional designs
- Export to JPG, PDF or send by email


Do you have any questions?
Recommend


5 slides
Project Task Ownership Matrix Presentation
Bring your workflow to life with a clean, engaging slide that maps out who owns what. This presentation helps clarify roles, streamline communication, and keep every task fully aligned. Perfect for teams that need structure without complexity. Fully compatible with PowerPoint, Keynote, and Google Slides.
22 slides
Beacon Product Development Plan Presentation
Develop your product strategy with this dynamic template! Perfect for highlighting company overview, product features, and market analysis. Showcase your target market, unique selling proposition, and competitive analysis with ease. Ideal for product demonstrations and sales strategy discussions. Compatible with PowerPoint, Keynote, and Google Slides. Impress your audience and elevate your product development presentations!


4 slides
Management Levels Hierarchy
Illustrate your team’s structure using this modern pyramid-style hierarchy chart. Featuring space for names, roles, and profile photos, it’s ideal for highlighting top, middle, and lower-level management. Fully editable in PowerPoint, Keynote, and Google Slides.


6 slides
Key Points Overview Presentation
Bring your message to life with a slide that makes every key point feel clear, organized, and easy to follow. This presentation helps you highlight essential ideas, compare insights, and simplify complex information for any audience. Perfect for meetings, reports, or strategy updates. Fully compatible with PowerPoint, Keynote, and Google Slides.


4 slides
Artificial Intelligence Use Cases Overview Presentation
Navigate a maze of insights with this creative template designed to showcase real-world tech applications in a visually engaging way. Whether you're covering machine learning in healthcare or automation in customer service, this AI use case infographic keeps your points clear and organized. Works seamlessly in PowerPoint, Keynote, and Google Slides.


4 slides
Mirror Data Distribution Butterfly Format Presentation
Present side-by-side comparisons with clarity using the Mirror Data Distribution Butterfly Format Presentation. This layout helps visualize balanced data sets, performance comparisons, or goal vs. outcome metrics with mirrored bars and intuitive icons. Fully customizable in Canva, PowerPoint, Google Slides, and Keynote to match your brand's aesthetic and message.


6 slides
Conversion Funnel Stages Overview Presentation
Visualize user journeys with clarity using the Conversion Funnel Stages Overview Presentation. This funnel diagram template breaks down key conversion phases—from awareness to decision—into distinct, color-coded stages. Ideal for marketing reports, sales strategies, or product demos. Fully editable in PowerPoint, Google Slides, and Canva.


6 slides
Big Data Technology Infographic
Big Data technology refers to the tools, techniques, and frameworks used to capture, store, process, analyze, and visualize large and complex datasets that are beyond the capabilities of traditional data processing systems. This infographic template is perfect for organizations that deal with massive volumes of data from various sources, including social media, sensors, machines, and more. This template enables businesses to gain valuable insights, make informed decisions, and create new opportunities. This infographic can be used for various industries, including e-commerce, healthcare, finance, manufacturing, and more.


5 slides
Responsibility Assignment Matrix Slide
Make project accountability crystal clear with this smart and structured matrix designed for assigning responsibilities across roles. Ideal for outlining who's doing what in multi-team environments, this slide keeps everyone on the same page using the classic RACI method. Fully compatible with PowerPoint, Keynote, and Google Slides.


10 slides
Home Office Scenes and Teamwork Presentation
Capture the modern remote work environment with this clean and visual layout. Featuring an illustrated home office scene on one side and four color-coded percentage blocks with text on the other, this template is ideal for presenting team productivity metrics, remote collaboration stats, or flexible work insights. Fully customizable in PowerPoint, Keynote, and Google Slides to match your brand.


5 slides
Client Engagement Journey Touchpoints
Map out every stage of client interaction with the Client Engagement Journey Touchpoints Presentation. This visual slide template highlights four key customer touchpoints, with a central user icon to emphasize the client-centric approach. Ideal for showcasing brand awareness, first contact, engagement strategies, and conversion steps. Easily customizable in PowerPoint, Keynote, and Google Slides.

18 slides
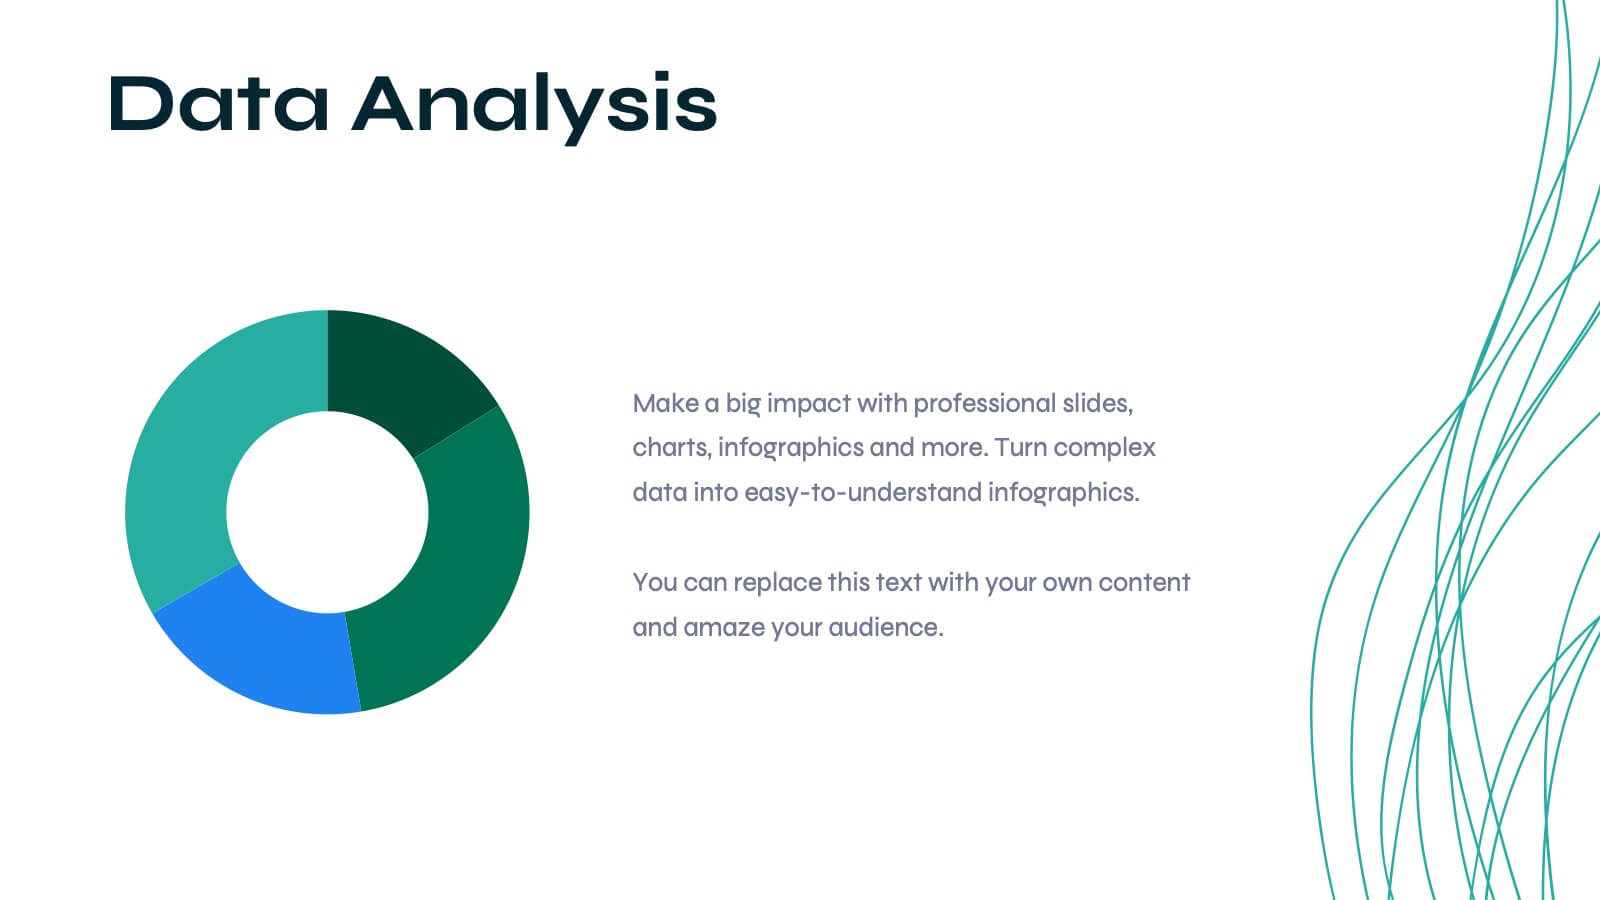
Pinnacle Academic Research Report Presentation
Present your academic research with style and precision using this comprehensive template. It covers everything from research objectives to key findings and recommendations. Perfect for making your data clear and engaging. Compatible with PowerPoint, Keynote, and Google Slides, it ensures your research is presented professionally and effectively.


5 slides
How Alcohol Affects The Body Infographics
The effects of alcohol can vary depending on factors such as the amount consumed, frequency of consumption, individual tolerance, and overall health. These infographic templates can be used as informative resources that illustrate the impact of alcohol on the human body. This template is designed to help educate and raise awareness about the physiological and health effects of alcohol consumption. Compatible with Powerpoint, Keynote, and Google Slides. With its visually appealing design, organized sections, and clear information, this template will help create awareness and promote responsible alcohol consumption practices.


6 slides
Project Overview and Key Takeaways Presentation
Summarize your project outcomes with clarity and impact using this Project Overview and Key Takeaways slide. Featuring a clean layout with a dedicated section for a brief overview and key metrics, plus four hexagonal milestones for your main insights. Perfect for wrap-up reports, client updates, or stakeholder reviews. Fully editable in PowerPoint, Keynote, and Google Slides.


6 slides
Pattern-Based Layouts Using Geometry
Present your process, timeline, or flow with clarity using the Pattern-Based Layouts Using Geometry Presentation. This clean, step-by-step format uses bold numbered icons and curved geometric blocks to guide viewers through five key stages. Ideal for sequential content, strategies, or workflows. Easily customizable in PowerPoint, Keynote, and Google Slides.


4 slides
IT Network Infrastructure Presentation
Optimize your IT infrastructure with this IT Network Infrastructure template. Designed with a cloud-based network architecture layout, this slide helps illustrate data flow, system components, and key IT connections in a structured format. Perfect for IT professionals, network engineers, and tech strategists, this fully customizable slide works seamlessly with PowerPoint, Keynote, and Google Slides.


7 slides
Budget Forecasting and Planning Infographic
The Budget Forecasting and Planning infographic template is designed to simplify financial planning and forecasting. It is compatible with PowerPoint, Google Slides, and Keynote. This set of slides offers a variety of charts, including bar graphs and dot matrices, to compare projected and actual budget figures over different periods. The template uses a color-coding system to differentiate between quarters or fiscal years, and it provides placeholders for detailed descriptions of budget items. It's an excellent tool for financial analysts, accountants, and business managers who need to present budget forecasts, variances, and financial strategies in a clear and visually engaging manner.