


Features
- 5 Unique slides
- Fully editable and easy to edit in Microsoft Powerpoint, Keynote and Google Slides
- 16:9 widescreen layout
- Clean and professional designs
- Export to JPG, PDF or send by email


Do you have any questions?
Recommend


24 slides
Brand Overview Presentation
Enhance your brand storytelling with our Brand Presentation template. Perfect for showcasing brand vision, values, and strategies, this template includes diverse slides for audience targeting and brand touchpoints. Suitable for all professional settings, it's compatible with PowerPoint, Keynote, and Google Slides.


24 slides
Petricor UX Strategy Plan Presentation
This UX Strategy Presentation offers a structured approach to user experience design, covering key aspects such as user research, wireframing, prototyping, and usability guidelines. With sections on branding, responsive design, and accessibility, this template is ideal for UX professionals. Fully editable and compatible with PowerPoint, Keynote, and Google Slides.


4 slides
Climate Change Impact Stages Presentation
The "Climate Change Impact Stages" presentation template is designed to effectively communicate the various aspects of climate change impacts on an organizational or global scale. It utilizes a straightforward tag design with letters A through D, where each tag can detail a specific area of impact or response strategy related to climate change. This visually appealing layout helps categorize information neatly, making it easier for the audience to follow along and understand the segmented data or proposals. Ideal for environmental seminars, corporate sustainability reports, or educational purposes, this template serves as a functional tool to highlight crucial information regarding climate change challenges and solutions.


23 slides
Zenith Product Launch Pitch Deck Presentation
Launch your product successfully with this compelling pitch deck! Perfect for presenting company overview, problem statements, and market opportunities. Ideal for startups and entrepreneurs aiming to attract investors and stakeholders. Compatible with PowerPoint, Keynote, and Google Slides, this template ensures your pitch is clear, persuasive, and professional. Secure your product's success today!


7 slides
Best Loyalty Program Infographic
A loyalty program is a structured marketing strategy designed to encourage customers to continue patronizing a business by offering them rewards, discounts, or other incentives based on their repeat purchases or engagement with the brand. This infographic template is a delightful and visually appealing guide to the world of rewarding loyalty. Dive into this vibrant infographic and discover how to spread happiness among your cherished customers through a top-notch loyalty program. Compatible with Powerpoint, Keynote, and Google Slides. Celebrate loyalty and reward your customers in the most delightful way.


5 slides
Creative Problem Solving with Design Thinking Presentation
Bring your innovation process to life with the Creative Problem Solving with Design Thinking Presentation. This visual layout uses gear and bulb icons to highlight four essential stages in the design thinking approach. Perfect for brainstorming sessions, innovation pitches, and product development workshops. Easily editable in Canva, PowerPoint, Google Slides, and Keynote.


6 slides
McKinsey Strategy Implementation Model Presentation
Visualize organizational alignment with the McKinsey 7S Model slide. Featuring a clean circular layout, it highlights Strategy, Structure, Systems, Shared Values, Style, Staff, and Skills. Ideal for consulting, planning, or leadership presentations. Fully editable and compatible with PowerPoint, Google Slides, and Keynote for easy customization and branding.


7 slides
Concentric Circles for Data Representation Infographic
Visualize the hierarchy and relationship of your data with our Concentric Circles Infographic, an invaluable tool for data analysts, strategic planners, and educators. This infographic is designed to represent complex data in an organized, easily interpretable format. Our Concentric Circles Infographic offers a multi-layered approach to data presentation, showcasing the interconnection between different levels of information. It's perfect for displaying structures such as organizational hierarchies, market segmentation, or product feature breakdowns. Customize this infographic to highlight core elements and their dependencies or to showcase the ripple effect of central policies on various organizational branches. This SEO-friendly infographic is crafted to make your data stand out and to facilitate a quick understanding of intricate systems. Employ our Concentric Circles Infographic to bring clarity to your data, making it an insightful resource for reports, presentations, and educational materials.


23 slides
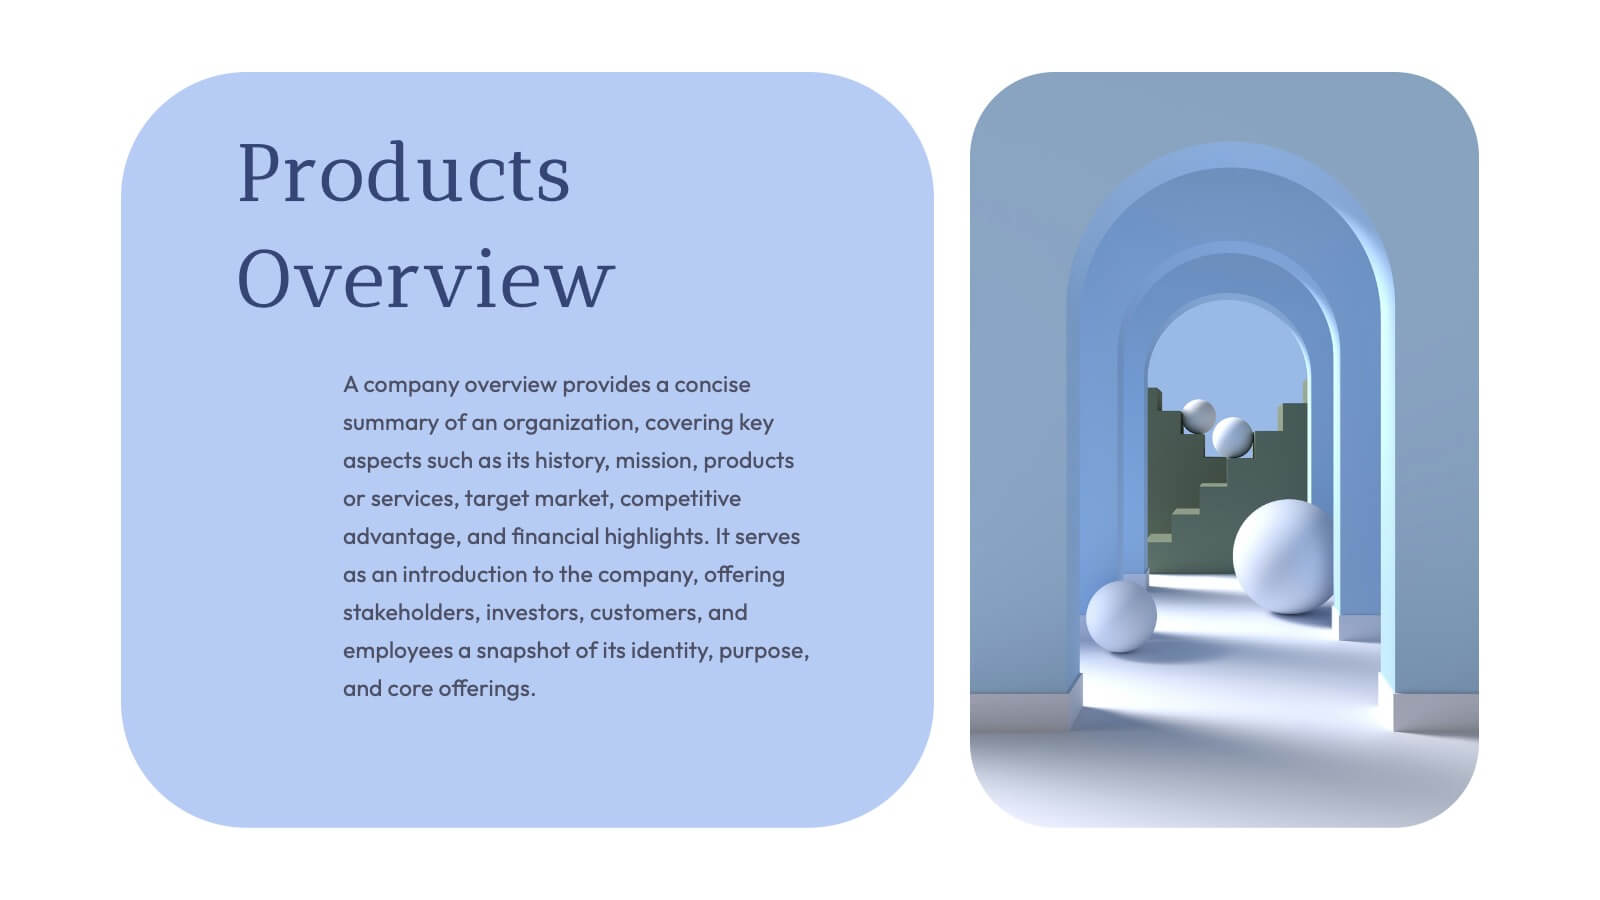
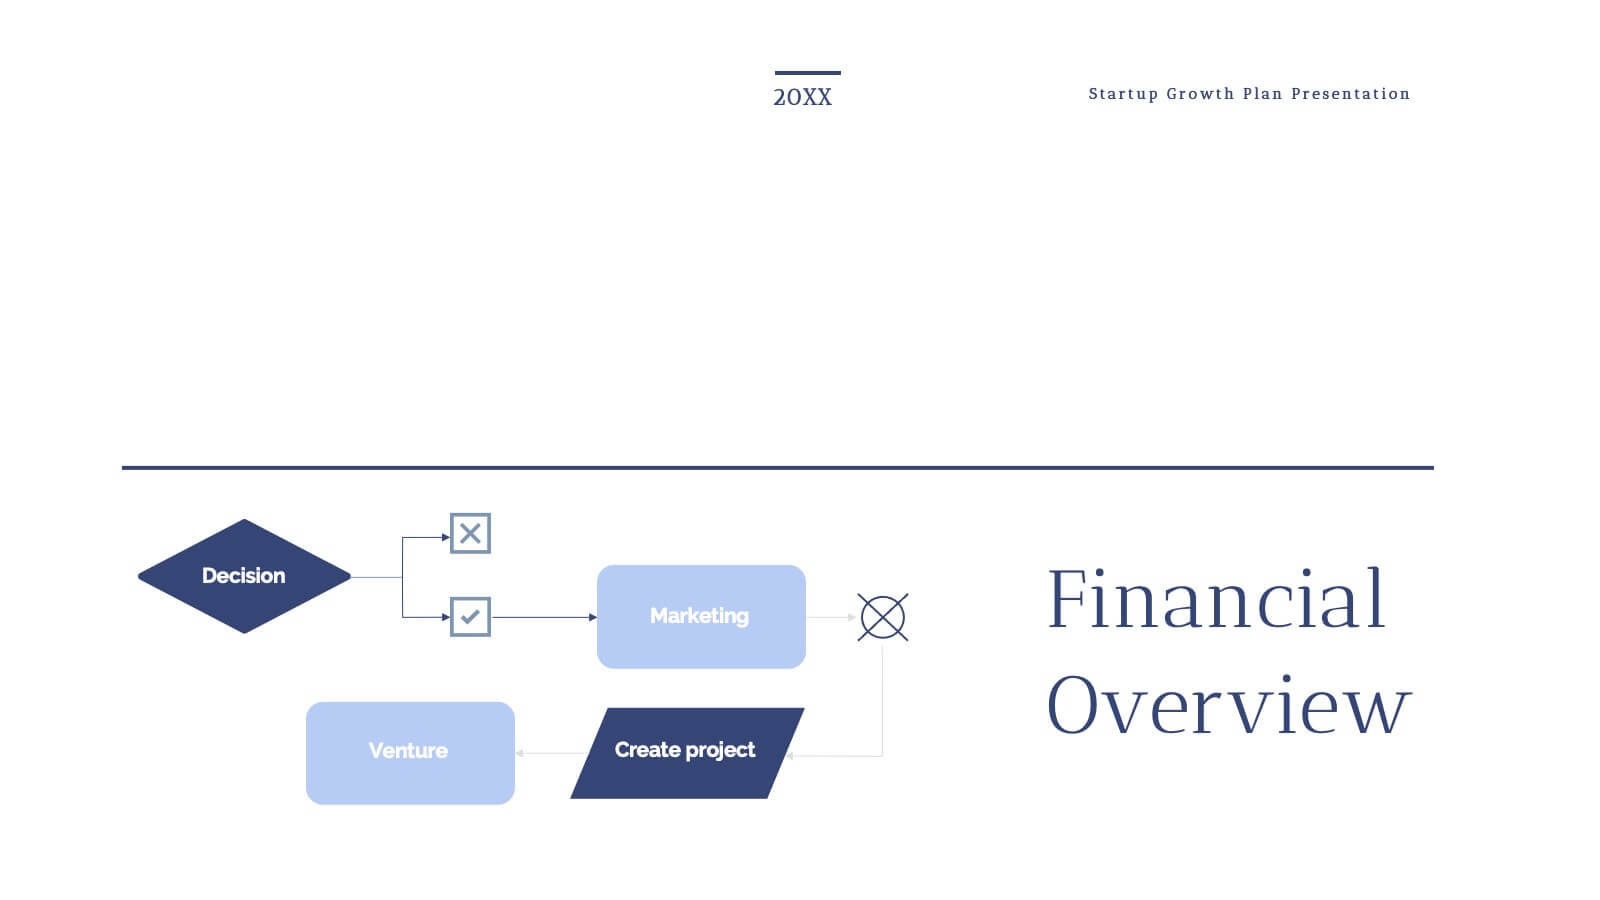
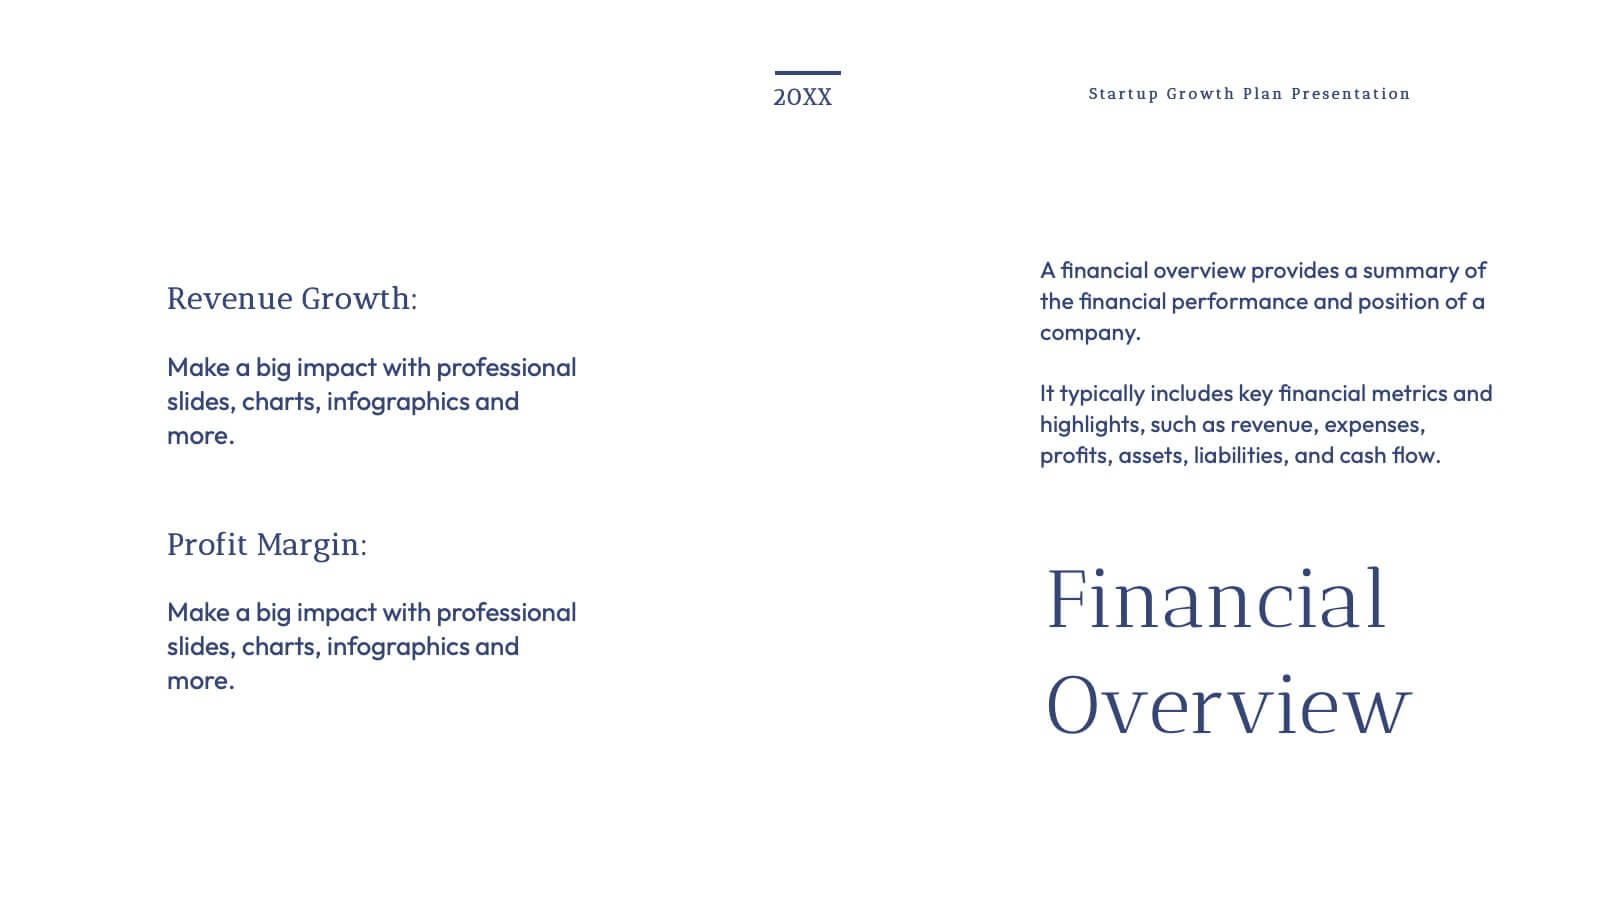
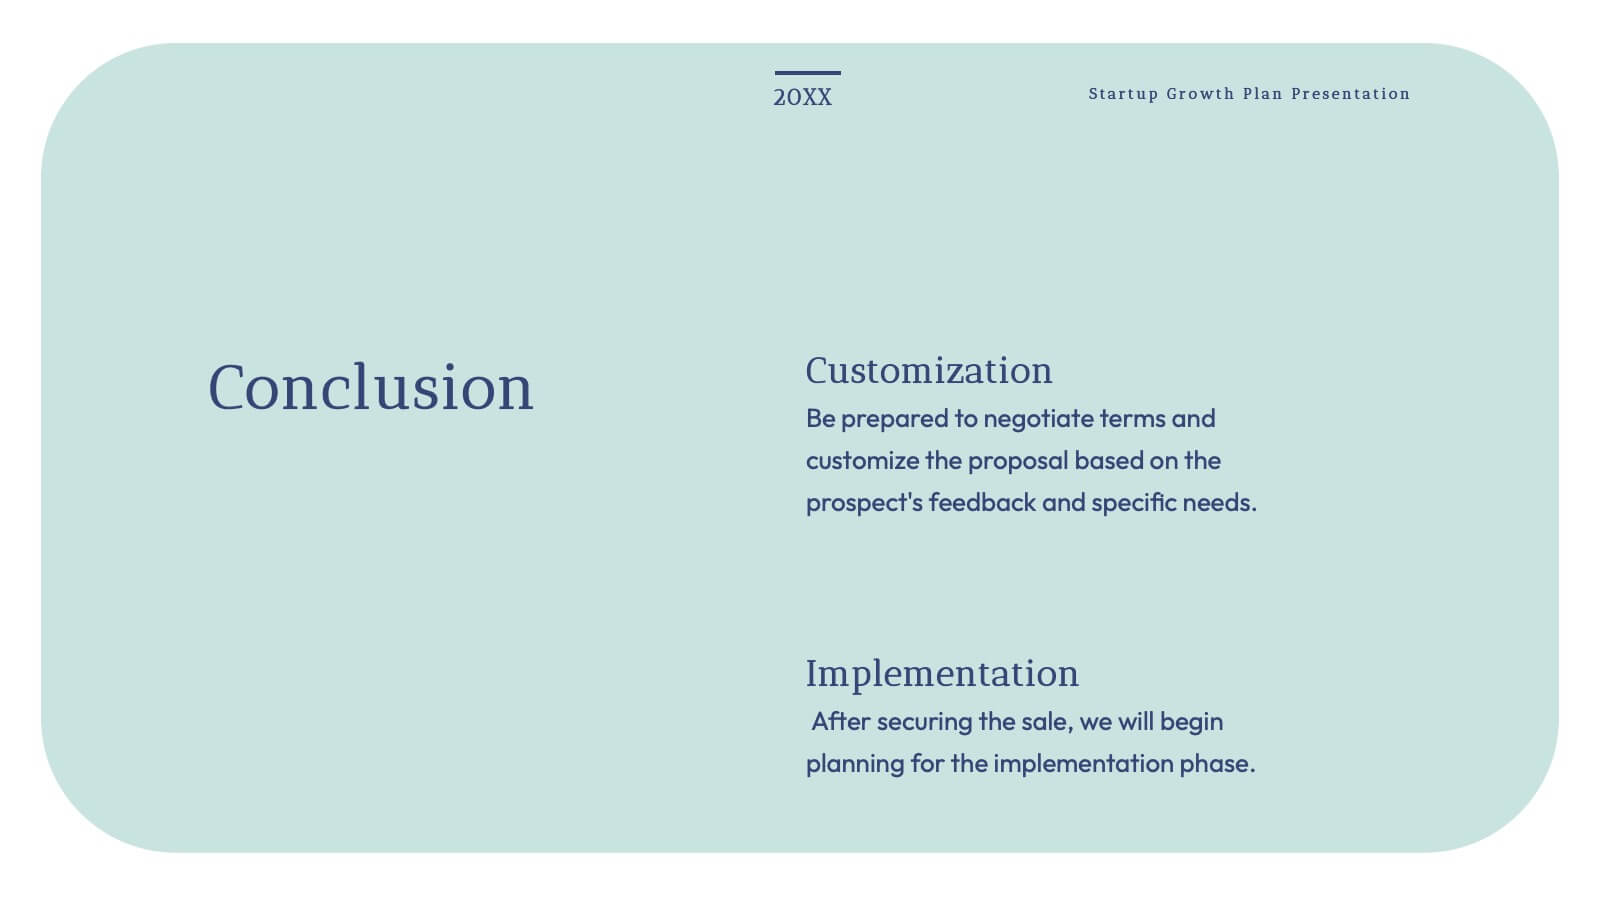
Grecian Startup Growth Plan Presentation
Elevate your pitch with this stunning Grecian-inspired presentation template, perfect for outlining your startup's growth plan! Showcase your business strategy, revenue projections, and scaling opportunities with a clean, elegant design that grabs attention. Impress investors and stakeholders with every slide. Compatible with PowerPoint, Keynote, and Google Slides for seamless customization.


6 slides
Clinical Research and Diagnostics Presentation
Showcase your research phases or diagnostic stages using this clean, capsule-themed layout. Perfect for illustrating clinical trial workflows, medical testing procedures, or pharmaceutical timelines. With six labeled sections and color-coded steps, it ensures clarity in communication. Fully customizable in PowerPoint, Keynote, and Google Slides for seamless integration into your presentations.


5 slides
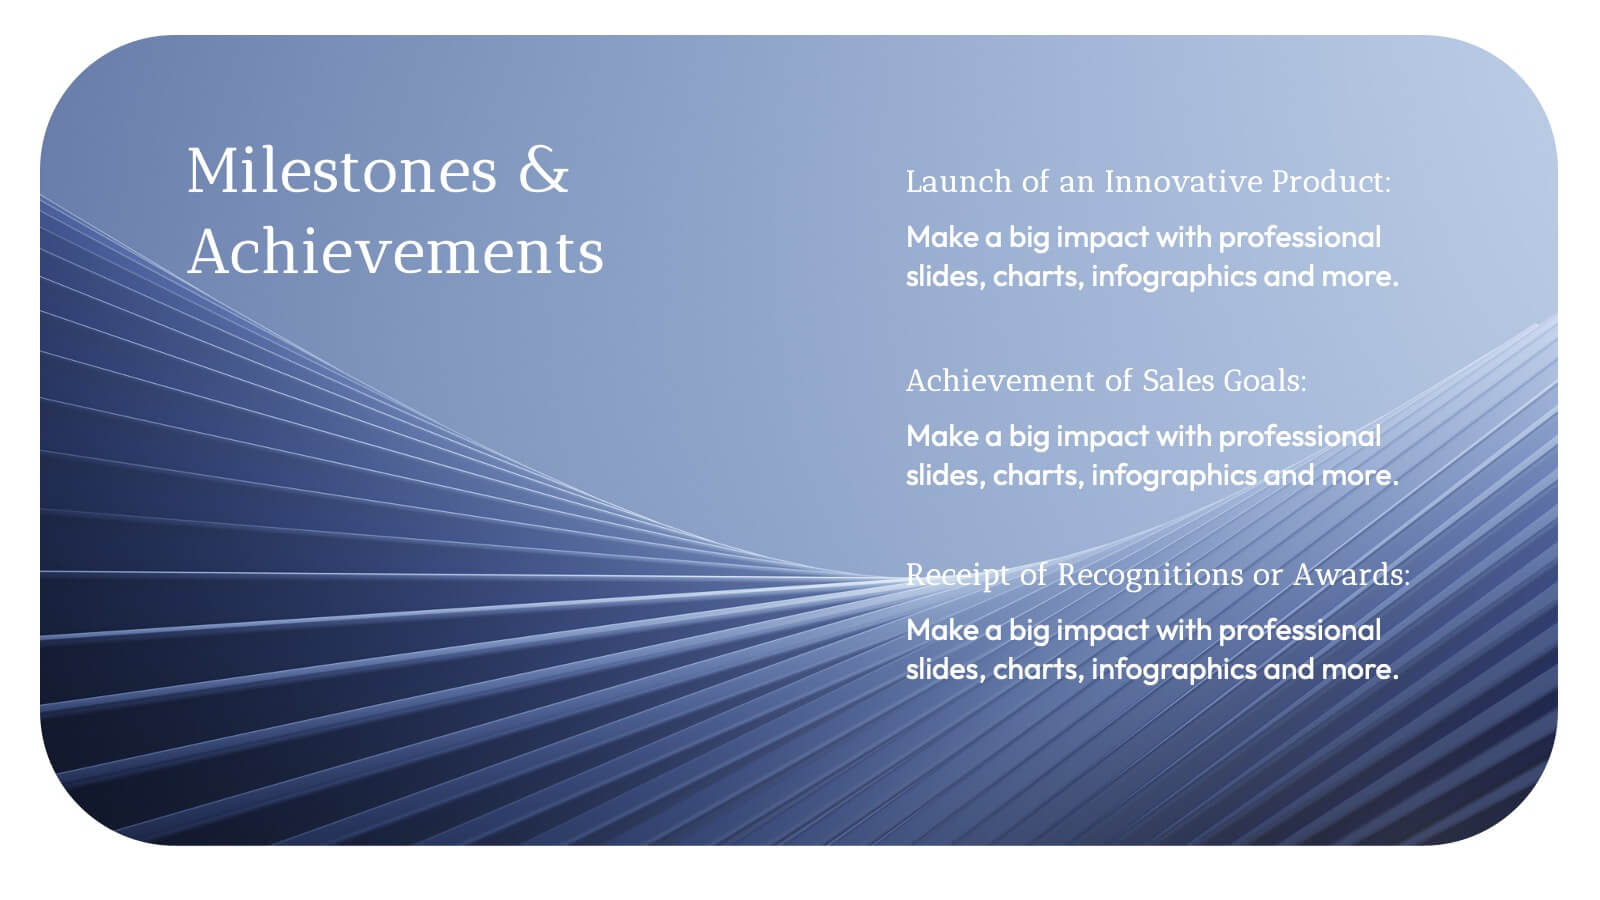
Celebrating Major Milestones Presentation
Highlight achievements and key moments with this medal-themed milestone template. Ideal for progress tracking, awards, or timeline presentations. Showcase up to four major events using a clean, structured layout. Fully editable in PowerPoint, Keynote, and Google Slides—perfect for business reviews, team celebrations, or personal growth milestones.


7 slides
Sustainability Business Management Infographic Presentation
Sustainability Management presents information related to sustainable business practices and management strategies. The goal of this template is to help you create a balance between environmental factors to ensure long-term success for a business or organization. This infographic can cover a variety of topics, including sustainable supply chain management, energy, resource efficiency, and waste reduction. This template has different layouts including diagrams and graphs. It also includes icons, symbols, and color-coding to make the information more accessible and easier to understand.


3 slides
TAM SAM SOM Strategy Slide Presentation
Transform data into strategy with a clean, layered visual that helps you present market opportunities with precision and style. Ideal for illustrating market reach and segmentation, this professional layout keeps your insights clear and impactful. Fully compatible with PowerPoint, Keynote, and Google Slides for seamless customization and presentation use.


6 slides
Business Marketing Strategy Infographic
Enhance your business presentations with our Business Marketing Strategy Infographic, tailored for PowerPoint, Google Slides, and Keynote. This comprehensive template is designed to help you effectively communicate complex marketing strategies in a visually engaging manner. Each slide offers a unique layout to present your marketing plans, from analysis to execution. Highlight key components like market research, goals, target audiences, and planned actions. With its customizable features, it's perfect for marketers aiming to outline strategies, set objectives, and convey tactics in a clear, concise way to team members and stakeholders alike.


5 slides
Insurance Risk Management Presentation
Make complex risk strategies easy to understand with this clean and professional presentation design. Perfect for explaining insurance coverage, threat assessment, or business protection plans, it blends clear visuals with modern design elements. Fully editable and compatible with PowerPoint, Keynote, and Google Slides for effortless customization and presentation.


5 slides
Construction Processes Infographics
Dive into the construction industry with this detailed infographic template that provides a comprehensive overview of construction processes, careers, and competitive strategies. Ideal for professionals, educators, and students involved in construction, this resource offers a clear and structured presentation of various aspects of the field. The infographic is divided into sections detailing key areas such as industry sectors, job roles, and strategic approaches for sustainable competitiveness. It highlights important segments like planning, finance, legal aspects, and on-site construction activities, all designed to give a well-rounded view of the construction process. Additionally, it includes data on job growth, employment statistics, and future projections, which are crucial for understanding labor market trends within the construction sector. Vibrant colors and easy-to-understand layouts make this template not only informative but also visually appealing. Whether used in training sessions, academic courses, or professional presentations, this infographic is a valuable tool for conveying the dynamic and multifaceted nature of the construction industry.


4 slides
Layered Strategy with Circular Focus Presentation
Highlight core initiatives and surrounding strategies with the Layered Strategy with Circular Focus Presentation. This template features a clean radial layout to emphasize a central goal supported by key components. Ideal for visualizing strategic alignment, organizational priorities, or team roles. Fully editable in PowerPoint, Keynote, and Google Slides.