


Features
- 5 Unique slides
- Fully editable and easy to edit in Microsoft Powerpoint, Keynote and Google Slides
- 16:9 widescreen layout
- Clean and professional designs
- Export to JPG, PDF or send by email


Do you have any questions?
Recommend


8 slides
Target Demographic Insights
Get a clear view of your audience with the Target Demographic Insights Presentation. This template uses a visual bullseye layout to highlight key demographic data through concentric circles and percentages. Ideal for marketers, brand strategists, or analysts, it helps you communicate audience segmentation and market reach effectively. Fully editable in PowerPoint, Keynote, and Google Slides.


26 slides
Financial Literacy Simple Presentation
Our "Financial Literacy" template is a must-have for anyone teaching money management, savings, and investment strategies. Compatible with PowerPoint, Keynote, and Google Slides, it makes financial education accessible and engaging. Introduce the basics with "Financial Literacy: Creating a Smarter Tomorrow" and outline your agenda with the "Table of Contents." The "Meet Our Team" slide can spotlight your financial experts, and the "Three Option Slide" breaks down key concepts like budgeting, saving, and investing. The "This is your big image slide" can visualize financial goals, while "Earn, Save, Invest, Protect." reinforces sound financial habits. Use "This is your Chart Slide" to present data on spending patterns and "Brain Infographic" to explore the psychology of spending. The template's clean design and customizable features make it easy to tailor your financial literacy presentation to any audience, ensuring that your message on smart money management is clear and impactful.


5 slides
Online Video Games Infographics
Dive into the digital realm with our online video games infographics template, tailored in striking shades of purple, blue, pink, and black that echo the electric ambiance of the gaming world. This dynamic ensemble, perfect for game developers, and gaming communities, brings to life the universe of online gaming. Compatible with Powerpoint, Keynote, and Google Slides. It features creative graphics and gaming icons, capturing everything from player statistics to game mechanics. Whether you're spotlighting trends or unveiling a revolutionary game, this template levels up your presentation, engaging your audience right from the start screen.


22 slides
Synchrony New Product Proposal Presentation
Present your innovative ideas effectively with this sleek and organized product proposal template, tailored to showcase every aspect of your new product. From introduction to execution, this template covers every detail, ensuring your proposal is both comprehensive and visually appealing. Key features include slides for product overview, features, target audience analysis, and customer pain points. Additionally, it provides sections for competitive analysis, pricing strategy, and distribution channels, equipping you with all the tools to communicate your value proposition clearly. Technical specifications and production processes are also included, perfect for presenting intricate details. Compatible with PowerPoint, Google Slides, and Keynote, this template is fully customizable to align with your brand’s aesthetics. Whether pitching to stakeholders, potential investors, or internal teams, this presentation ensures your proposal is structured, impactful, and engaging. Save time and leave a lasting impression with this professional design, suitable for any new product launch.


6 slides
Ideas Connection Venn Presentation Design
Present interconnected ideas with creativity and impact using the Ideas Connection Venn Presentation Design. This colorful, lightbulb-themed 5-section layout helps you visualize related concepts or stages, ideal for brainstorming, innovation mapping, or content planning. Each segment includes icons, titles, and descriptions to showcase your thoughts clearly. Fully customizable in PowerPoint, Keynote, and Google Slides.
8 slides
3-Step Arrow Process Flow Presentation
Kickstart your message with a bold, directional visual that makes every step feel clear and intentional. This presentation showcases a simple three-stage progression ideal for explaining workflows, strategies, or business processes with clarity and impact. Easy to customize and fully compatible with PowerPoint, Keynote, and Google Slides.


7 slides
Agile Scrum Framework Presentation
Streamline your workflow with this Agile Scrum Framework Presentation Template. Ideal for visualizing iterative processes, sprints, team collaboration, and project planning stages. The circular arrow diagram with editable text placeholders helps communicate each agile step clearly. Fully compatible with PowerPoint, Keynote, and Google Slides.


5 slides
Business Insights Through Dashboard Visualization Presentation
Visualize key metrics with this Business Insights Through Dashboard Visualization presentation. The funnel chart layout is ideal for showcasing conversion rates, customer journeys, or sales processes. Each section includes clear labels and percentage indicators. Fully editable in Canva, PowerPoint, and Google Slides to suit your business reporting needs.


7 slides
Mind Map Process Infographic
A Mind Map Process Infographic is a visual representation that illustrates a process or a series of steps using the structure and principles of a mind map. This template diagram is a dynamic visual guide to help individuals and teams harness the true potential of mind mapping. This is used to visually organize information in a hierarchical and interconnected manner, often starting with a central concept or theme and branching out into related ideas or subtopics. Mind maps are the ultimate tool for brainstorming, planning, and innovating, and this template is your gateway to unlocking their full potential.


7 slides
Stock Market Sectors Infographic
Dive deep into the intricacies of stock market sectors with our comprehensive infographic. Utilizing a palette of white, green, and red, this visual tool breaks down the vast expanse of the stock market into distinct sectors, making it easier to comprehend and analyze. Ideal for investors, stock market enthusiasts, financial educators, and students alike, this infographic provides a clear snapshot of the financial landscape. With its effortless integration into PowerPoint, Keynote, and Google Slides, sharing and presenting this crucial market information becomes seamless and engaging.


26 slides
Natlea Presentation Template
Need help presenting your next travel destination? This template is a unique and sophisticated way to present your travel destination. The Natlea travel template is a fun, surprisingly sophisticated and easy to use template that allows you to list all the details of your trip. With bold colors, charts, budget slides and venn diagrams this template has it all. It's simple yet fun design makes it stand out and at the same time keep your audience engaged. This is the perfect choice for marketers, tourism professionals or anyone who needs to make a great looking presentation on their next trip.


19 slides
Kinetic Sales Forecast Presentation
Forecast your sales with style using this vibrant template! Perfect for detailing company overview, sales process, team, and strategy. Includes sections for case studies, pricing, and future opportunities. Ideal for sales teams to impress stakeholders. Compatible with PowerPoint, Keynote, and Google Slides.


20 slides
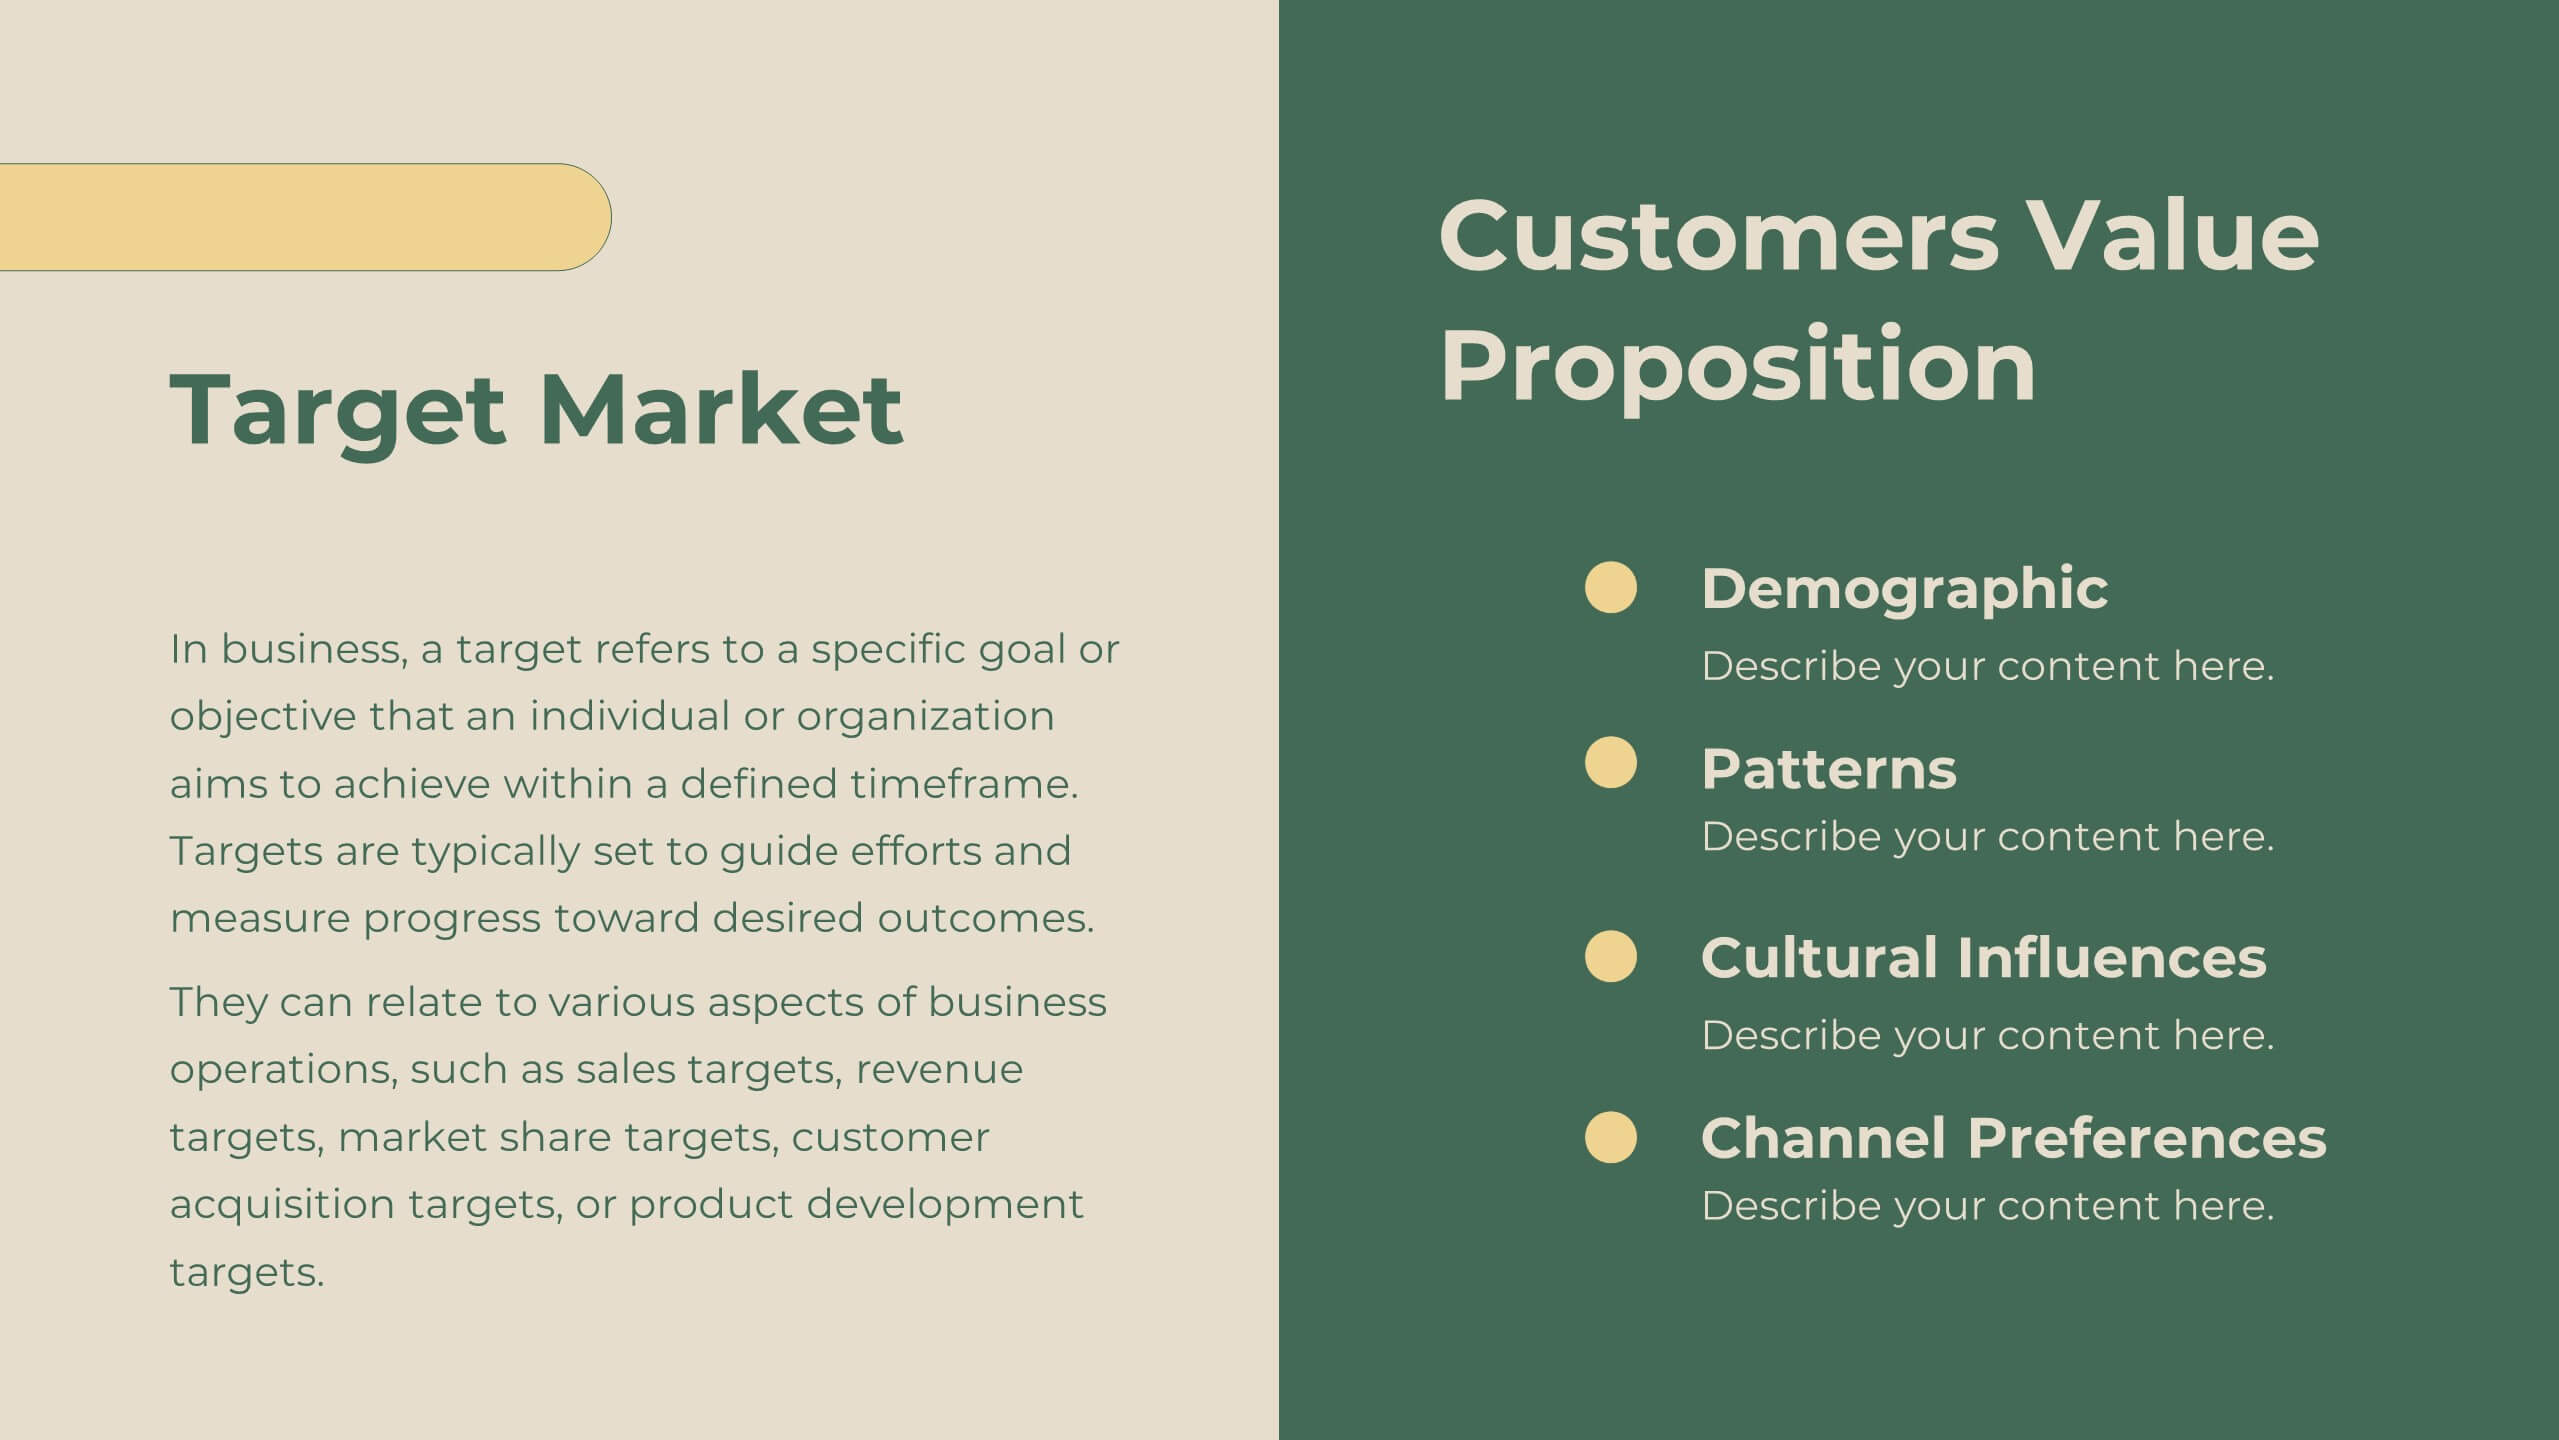
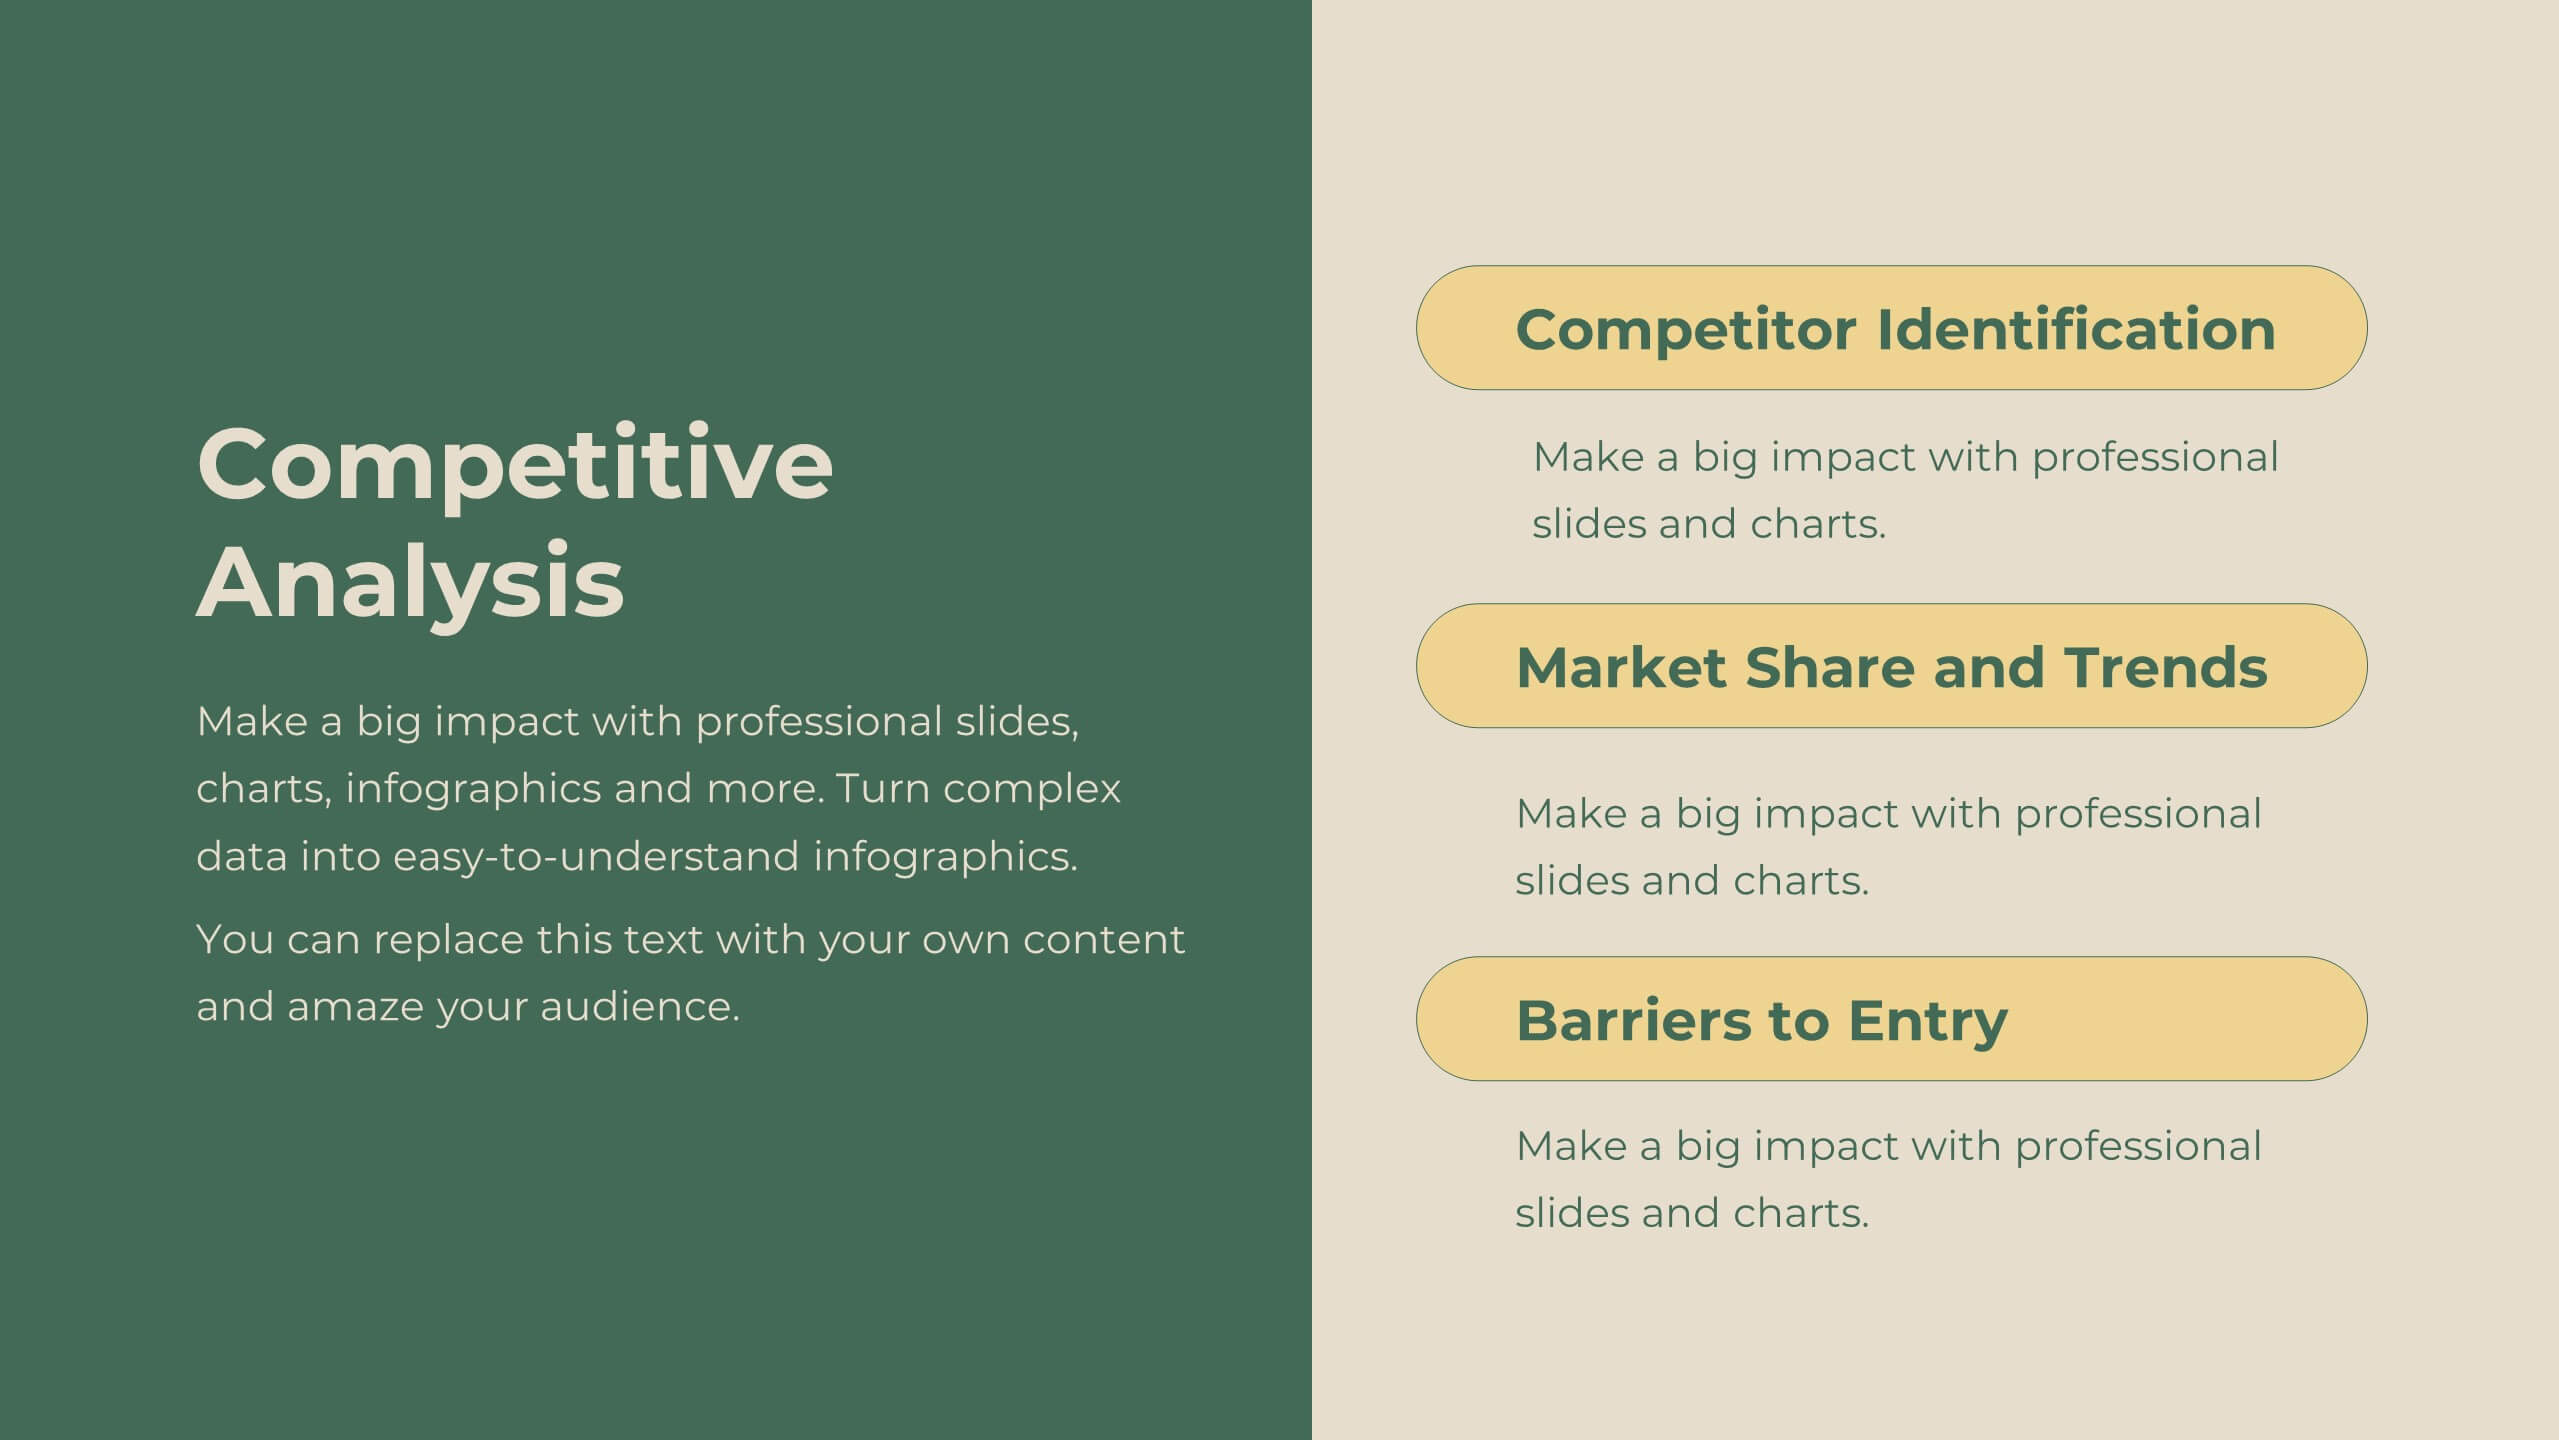
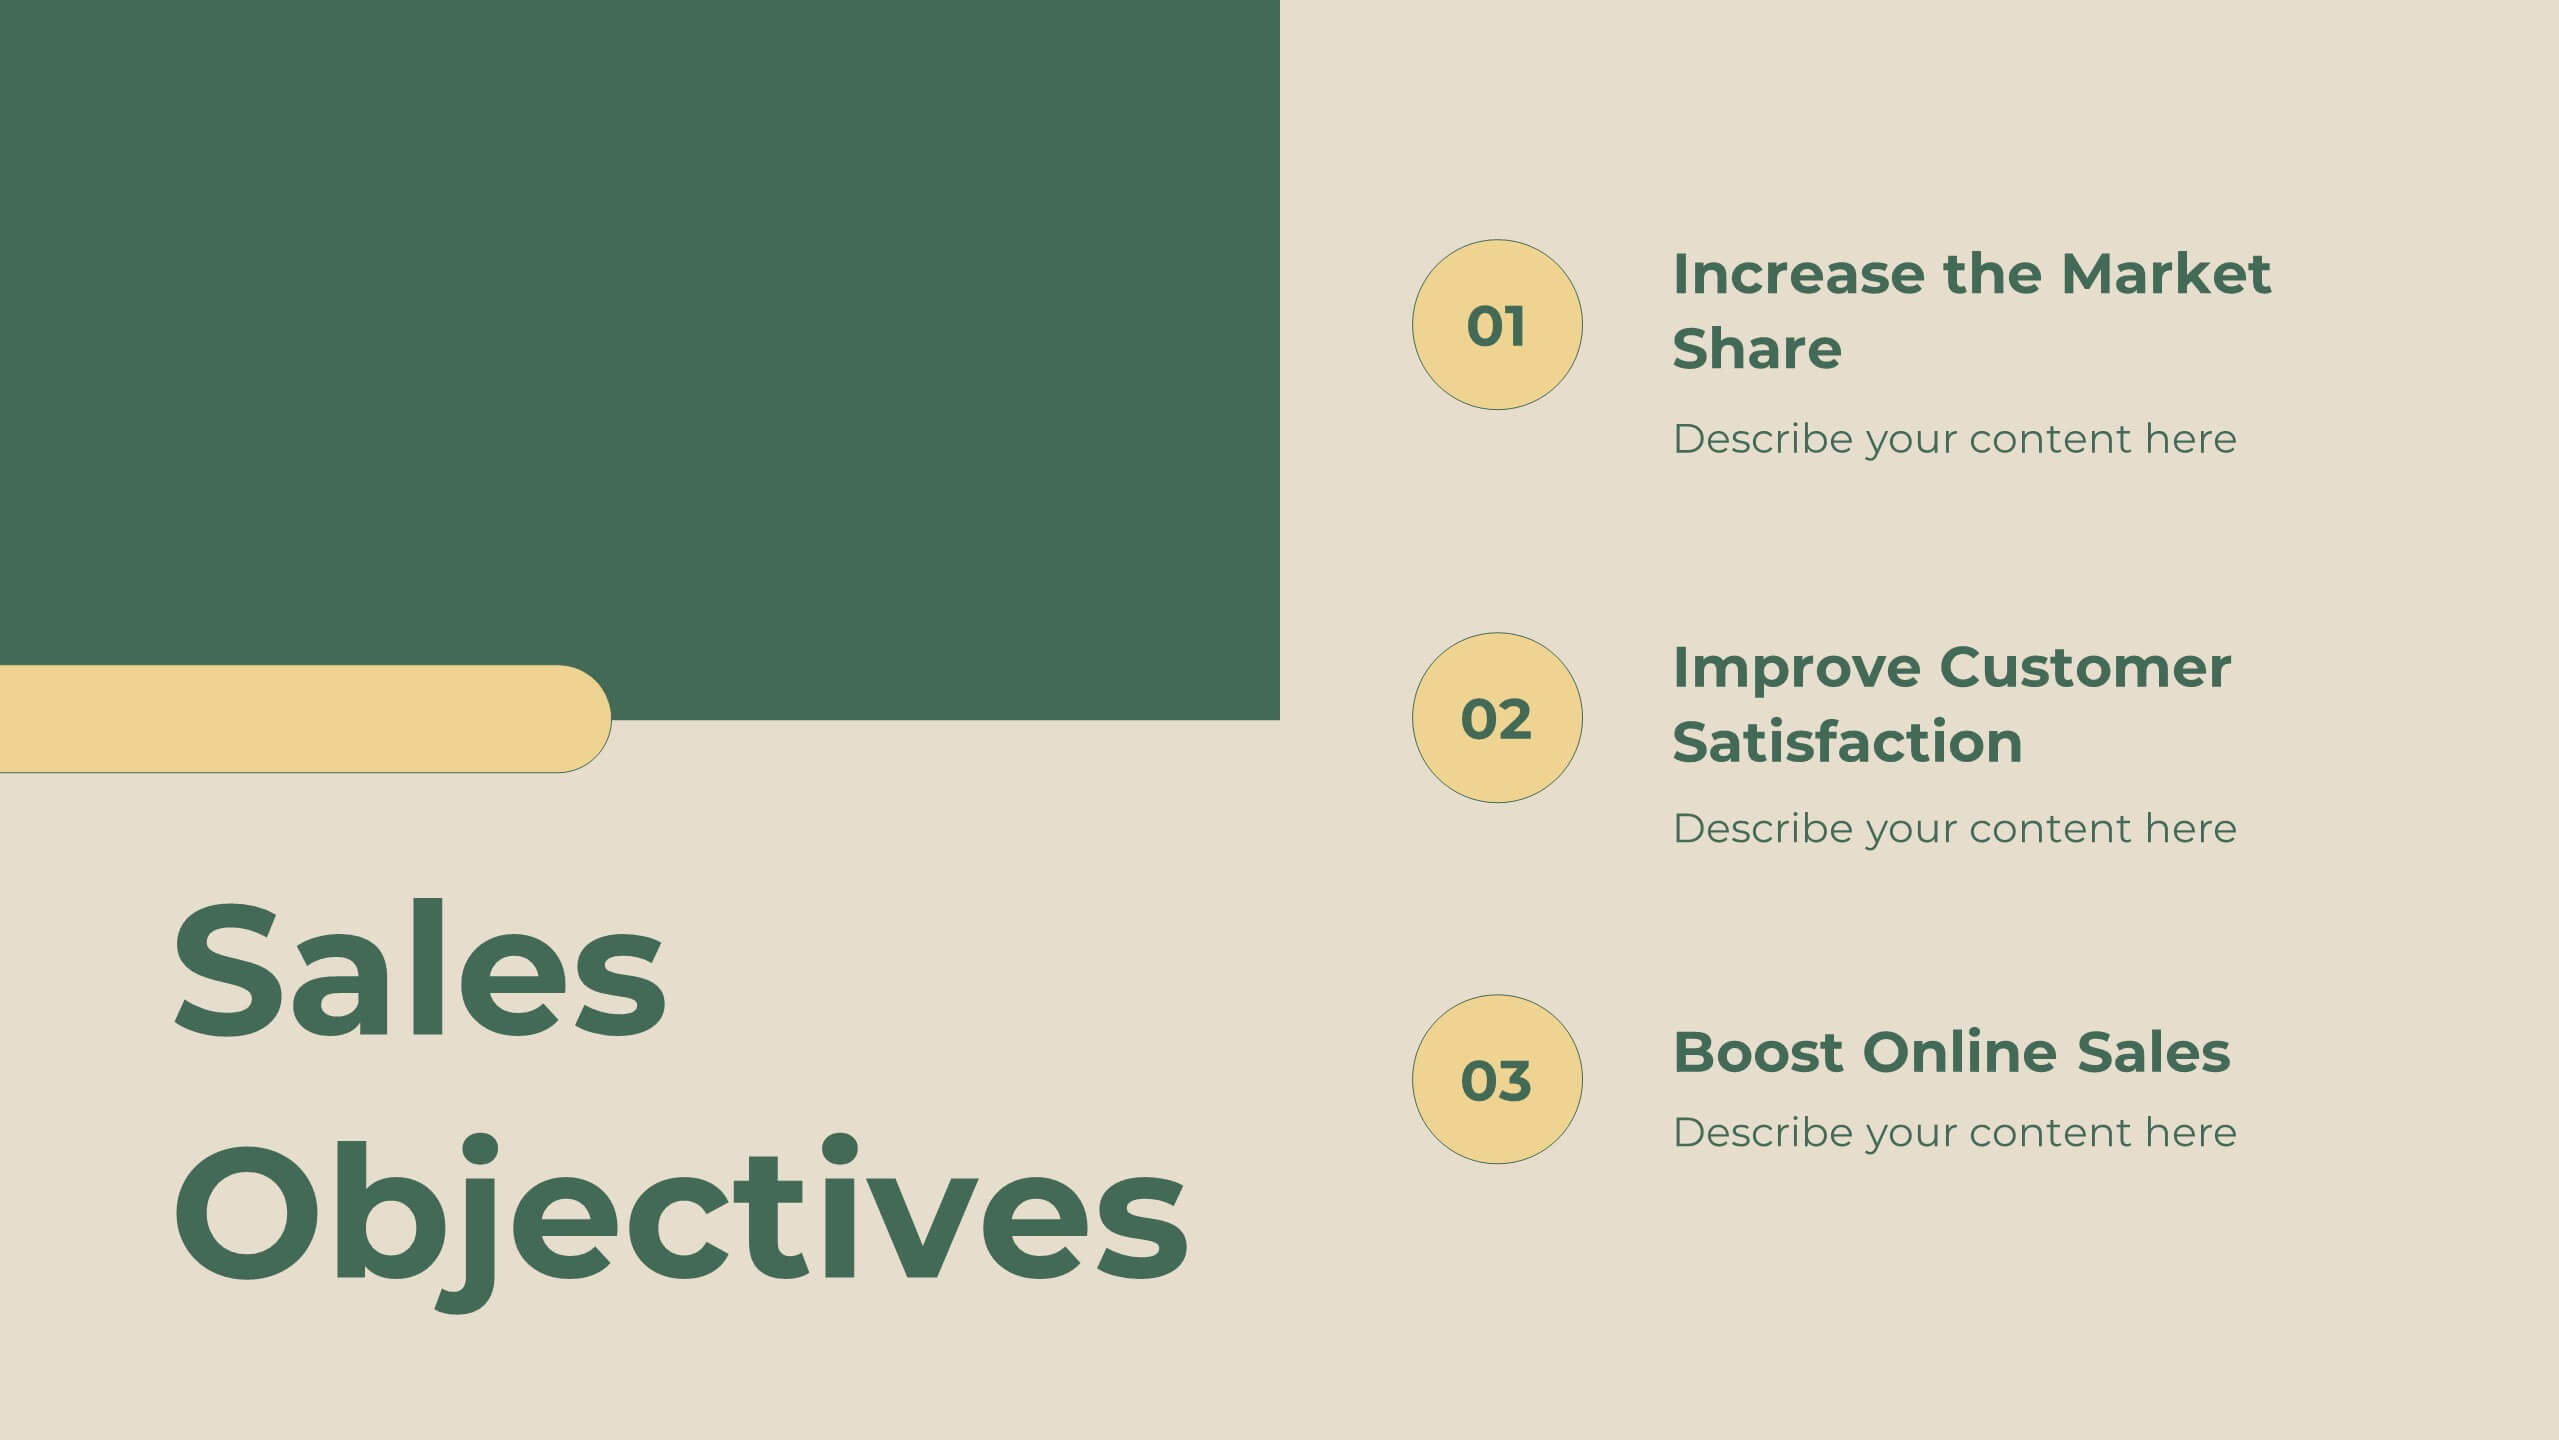
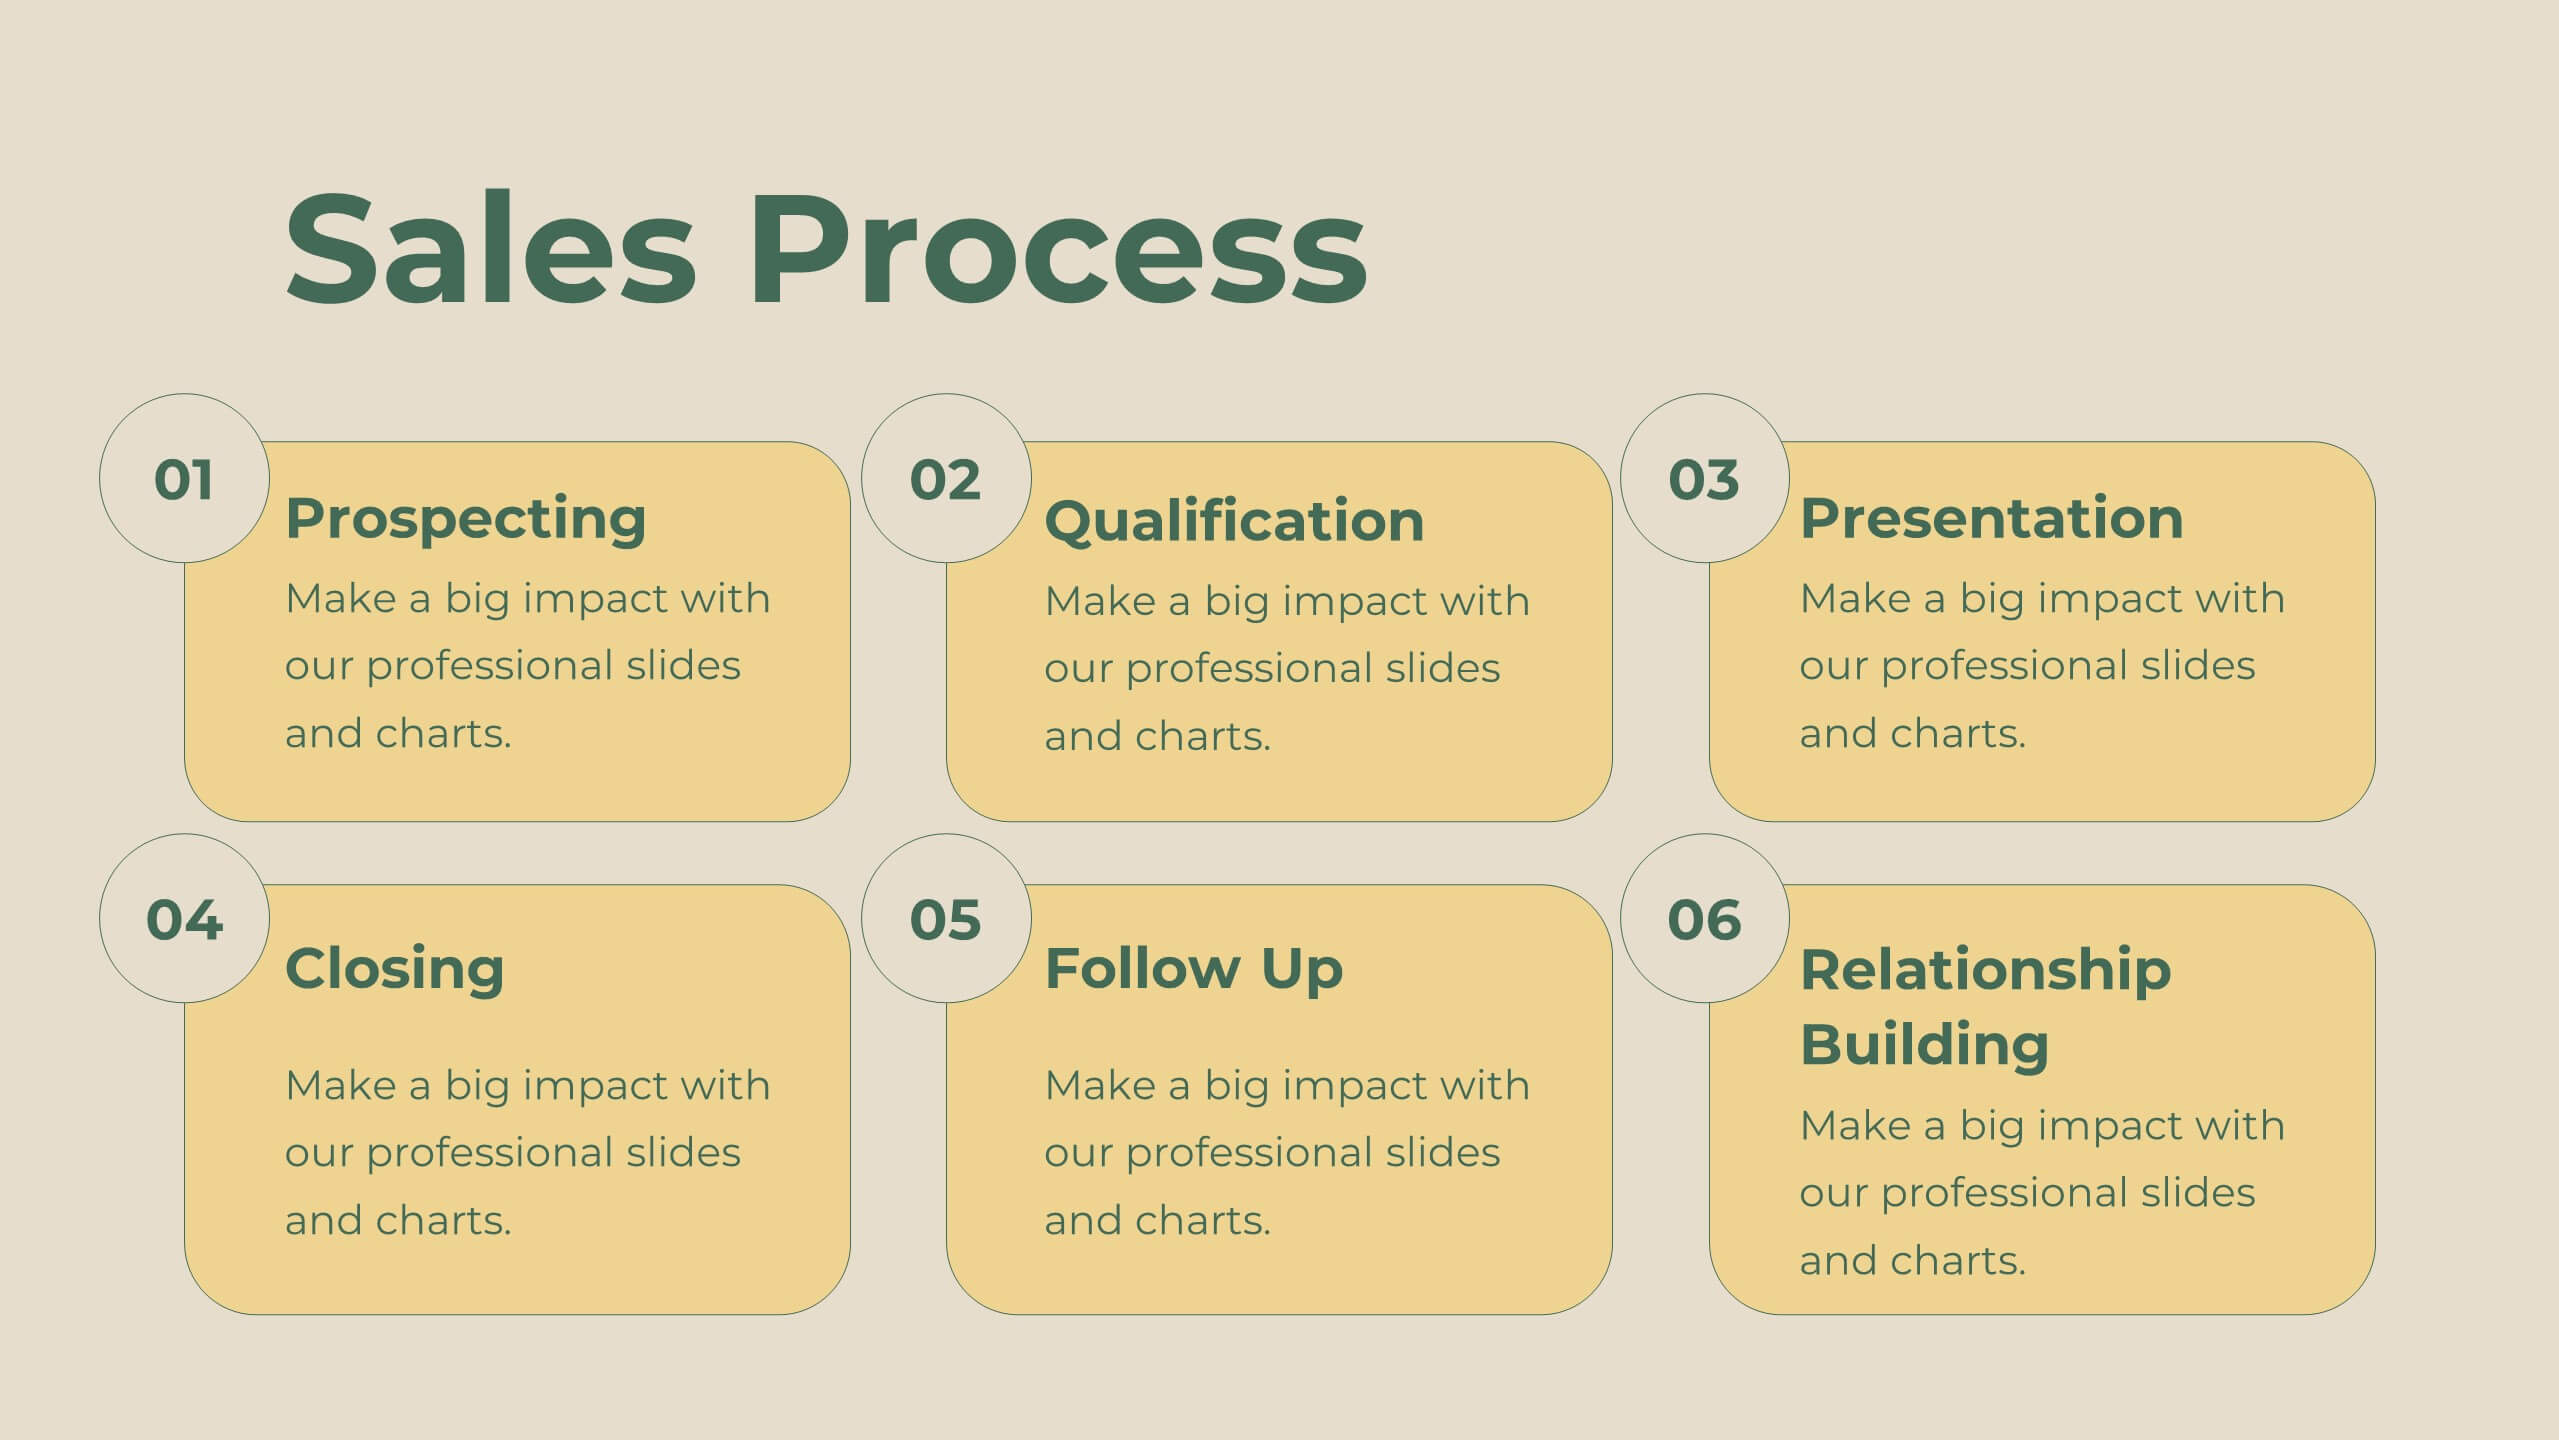
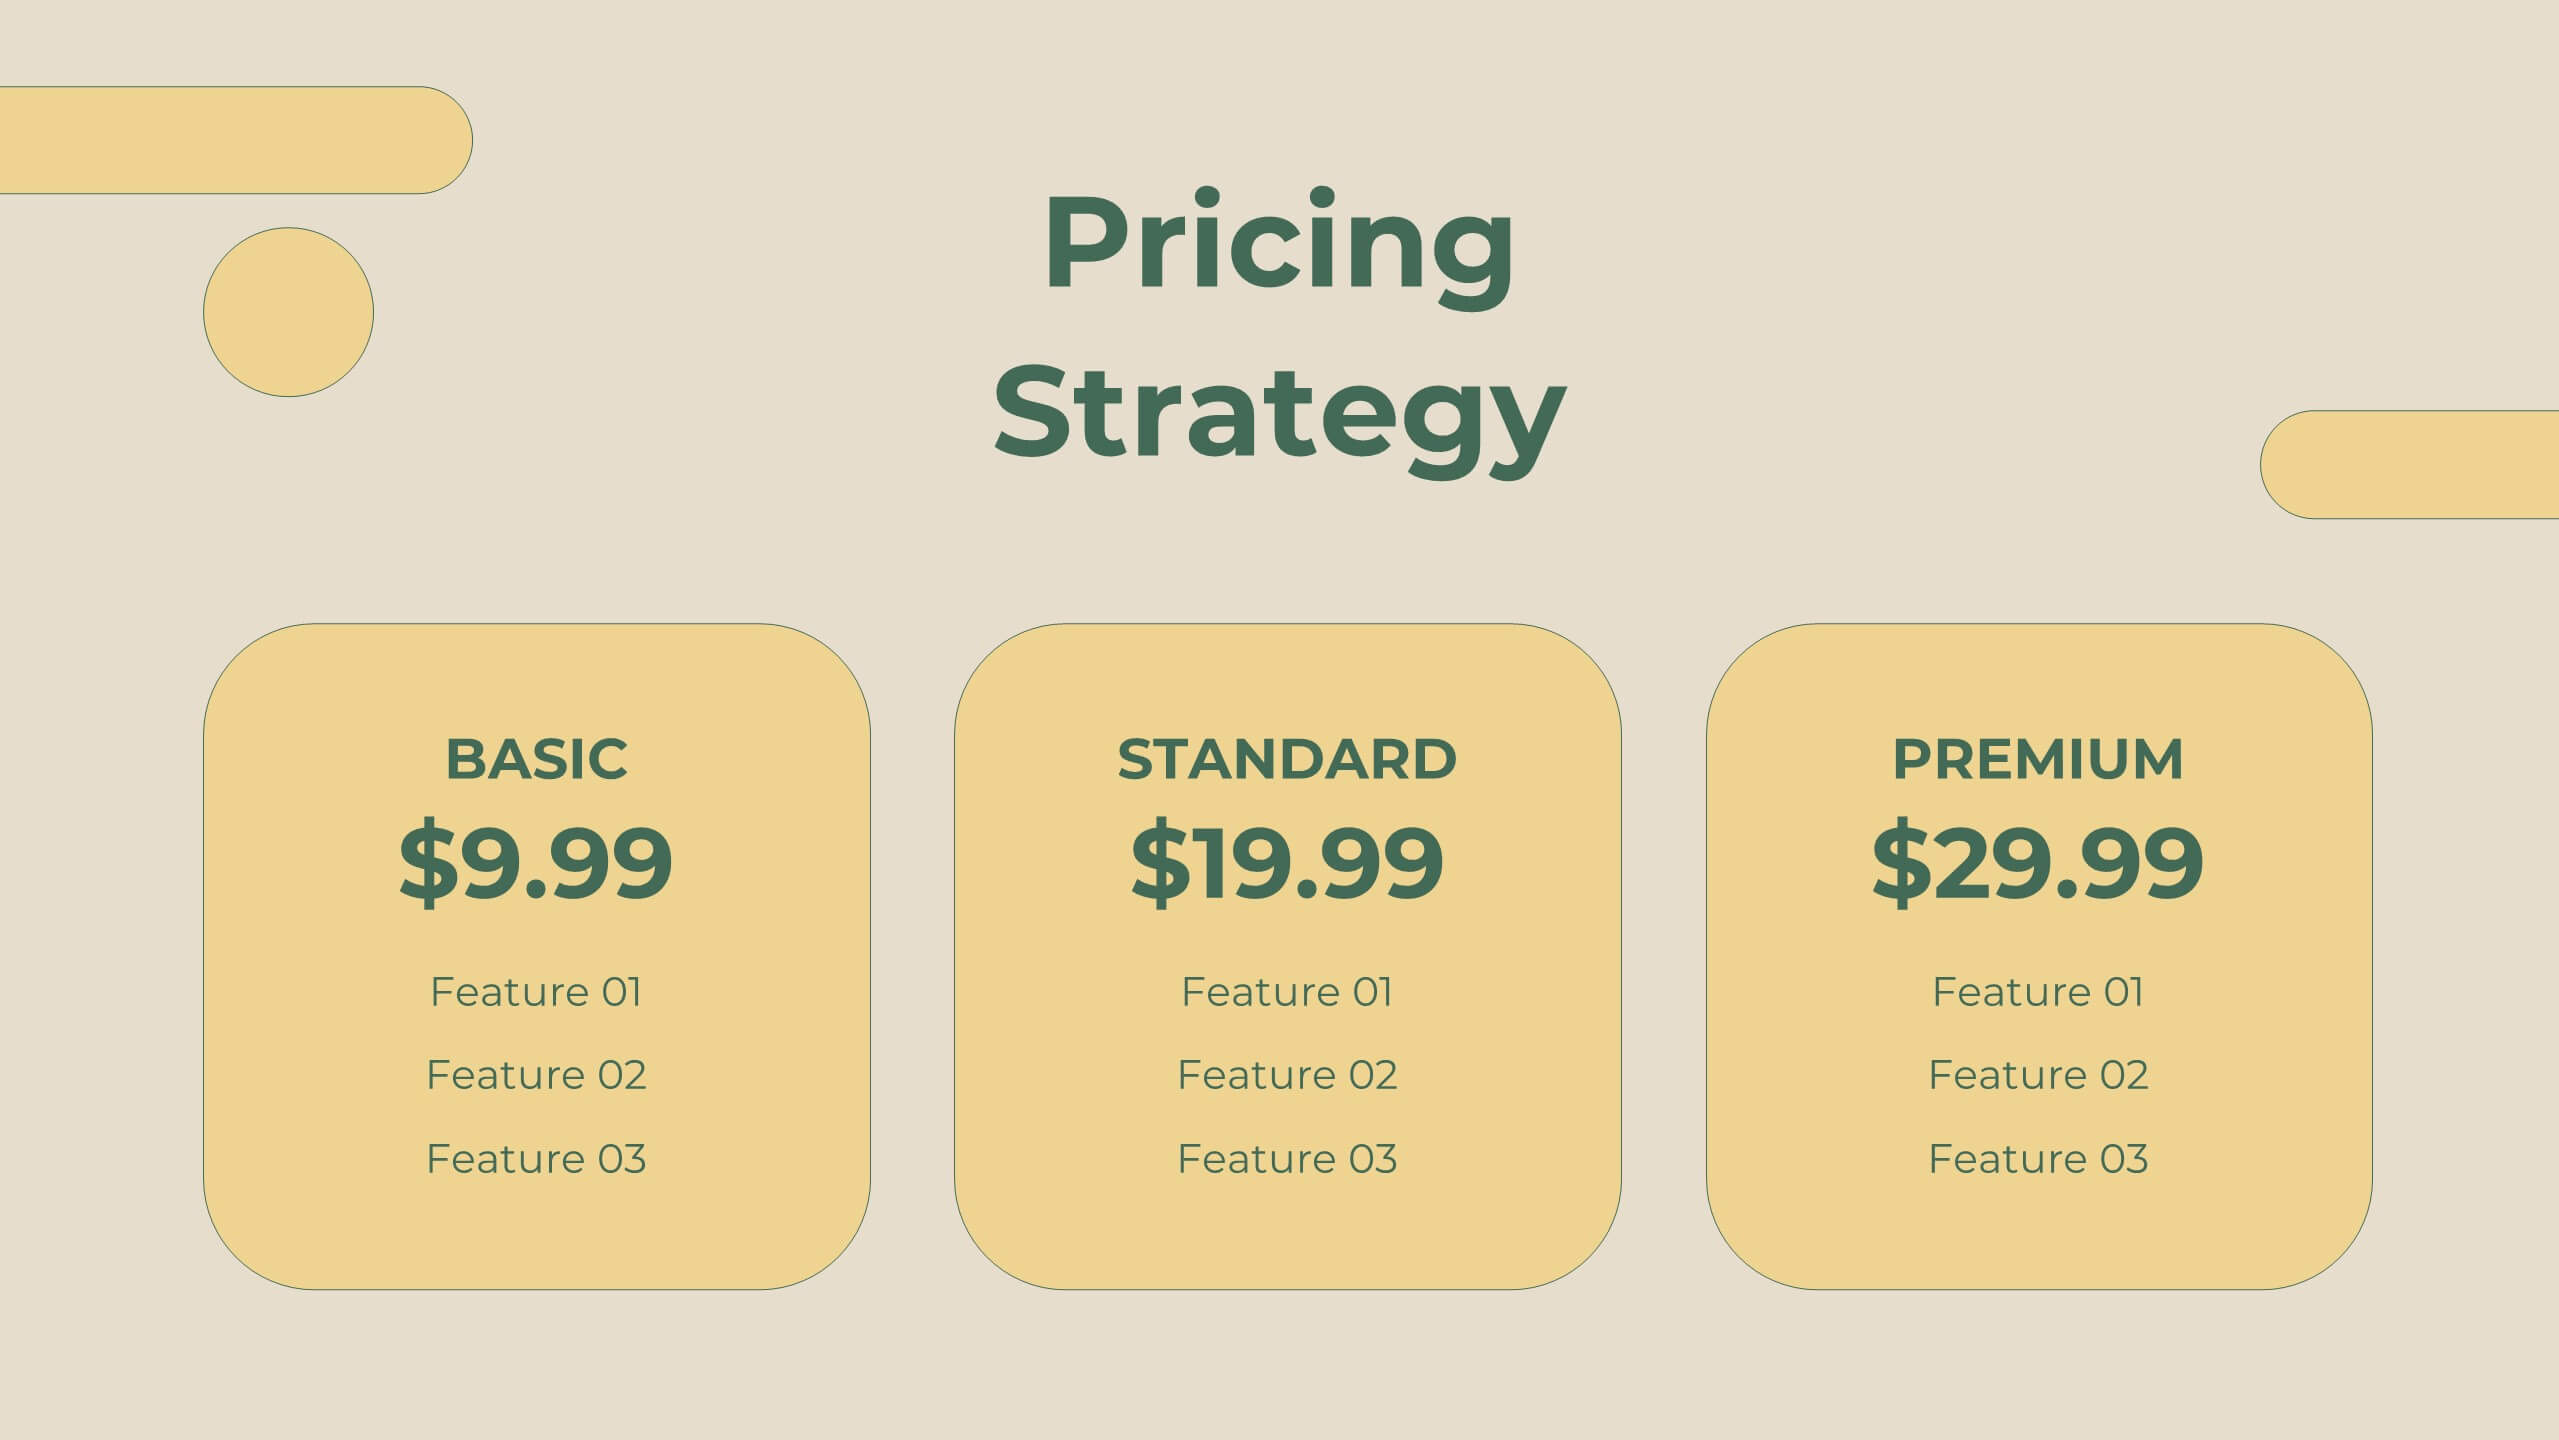
Legacy Sales Strategy Presentation
Boost your sales presentations with this modern template! It features sections for objectives, process, team introduction, customer testimonials, and performance metrics. Ideal for outlining strategies, opportunities, and pricing. Engage your audience with a professional, clean design. Compatible with PowerPoint, Keynote, and Google Slides for seamless integration. Make your sales strategy stand out!


5 slides
Hidden Risks Iceberg Model Diagram Presentation
Spotlight what lies beneath the surface with the Hidden Risks Iceberg Model Diagram Presentation. This slide helps you visually distinguish between visible issues and deeper, less obvious risks—perfect for risk assessments, compliance, safety briefings, and executive strategy discussions. Fully editable in PowerPoint, Keynote, and Google Slides for quick customization.


5 slides
Editable Circular Flow Presentation
Streamline your presentations with this Editable Circular Flow template. Ideal for processes, workflows, and strategic planning, this diagram visually represents key steps in a structured format. Fully customizable and compatible with PowerPoint, Keynote, and Google Slides, it ensures clarity and professionalism for engaging, data-driven presentations.


8 slides
Airline Business Strategy Presentation
Leverage key insights into the aviation sector with the "Aviation Industry Market Analysis" presentation template. This design allows professionals in the aviation industry to effectively communicate market trends and forecasts. Its compatibility with PowerPoint, Keynote, and Google Slides ensures a versatile use across different platforms, making it ideal for industry analyses, investor meetings, or internal strategy discussions.


5 slides
Coffee Brewing Methods Infographics
Coffee brewing methods refer to the various techniques and processes used to extract flavor and aroma from coffee beans. These infographic templates are a visually appealing and informative presentation tool designed to showcase various methods of brewing coffee. Whether you're a coffee enthusiast, a barista, or someone interested in learning more about coffee preparation, this template provides an engaging way to explore different brewing techniques and their unique characteristics. These allows you to showcase and educate others about various coffee brewing techniques. Fully customizable and compatible with Powerpoint, Keynote, and Google Notes.