


Features
- 2 Unique slides
- Fully editable and easy to edit in Microsoft Powerpoint, Keynote and Google Slides
- 16:9 widescreen layout
- Clean and professional designs
- Export to JPG, PDF or send by email


Do you have any questions?
Recommend


7 slides
Question Infographic
Enhance your presentations and encourage audience engagement with our collection of slide templates, designed to prompt interactive discussions and feedback. This assortment features a variety of styles, from clean and simple to colorful and dynamic, ensuring the perfect fit for the atmosphere and theme of any presentation. Each template is thoughtfully crafted to captivate your audience and facilitate a seamless transition into Q&A sessions. Whether concluding a business meeting, educational lecture, or training seminar, these slides provide an elegant and effective way to invite questions and foster open communication. Fully customizable, these templates can be tailored to align seamlessly with your presentation's overall aesthetic, reinforcing your message while encouraging participation. Ideal for drawing attention and sparking dialogue, they help create a more interactive and engaging presentation experience.


5 slides
Health Care Access and Equity Infographics
Health Care Access refers to the ability of individuals and communities to obtain medical services and receive appropriate care when needed. These infographic templates serve as an educational and advocacy tool, helping to raise awareness about the importance of equitable healthcare access and the need for addressing disparities. Whether used in healthcare organizations, educational settings, or public awareness campaigns, this template effectively communicates the urgency of achieving health equity and encourages individuals to take action towards a more equitable healthcare system. Compatible with Powerpoint, Keynote, and Google Notes.


6 slides
Mission and Values Overview Presentation
Your company's purpose deserves a visually stunning story! This infographic presentation template helps you clearly outline core values and mission statements with an engaging, structured design. Ideal for business strategy meetings, corporate presentations, and branding discussions, it keeps your content professional and impactful. Fully customizable and compatible with PowerPoint, Keynote, and Google Slides.


12 slides
Business Issue Root Cause Identification Presentation
Pinpoint Business Challenges with Precision using this Business Issue Root Cause Identification presentation template. Designed to uncover underlying problems efficiently, this template features structured visuals, hierarchical frameworks, and clear labeling to facilitate root cause analysis. Whether you're a business strategist, operations manager, or consultant, this template helps identify, analyze, and resolve critical business issues. Fully customizable and compatible with PowerPoint, Keynote, and Google Slides, ensuring a seamless and professional presentation experience.


22 slides
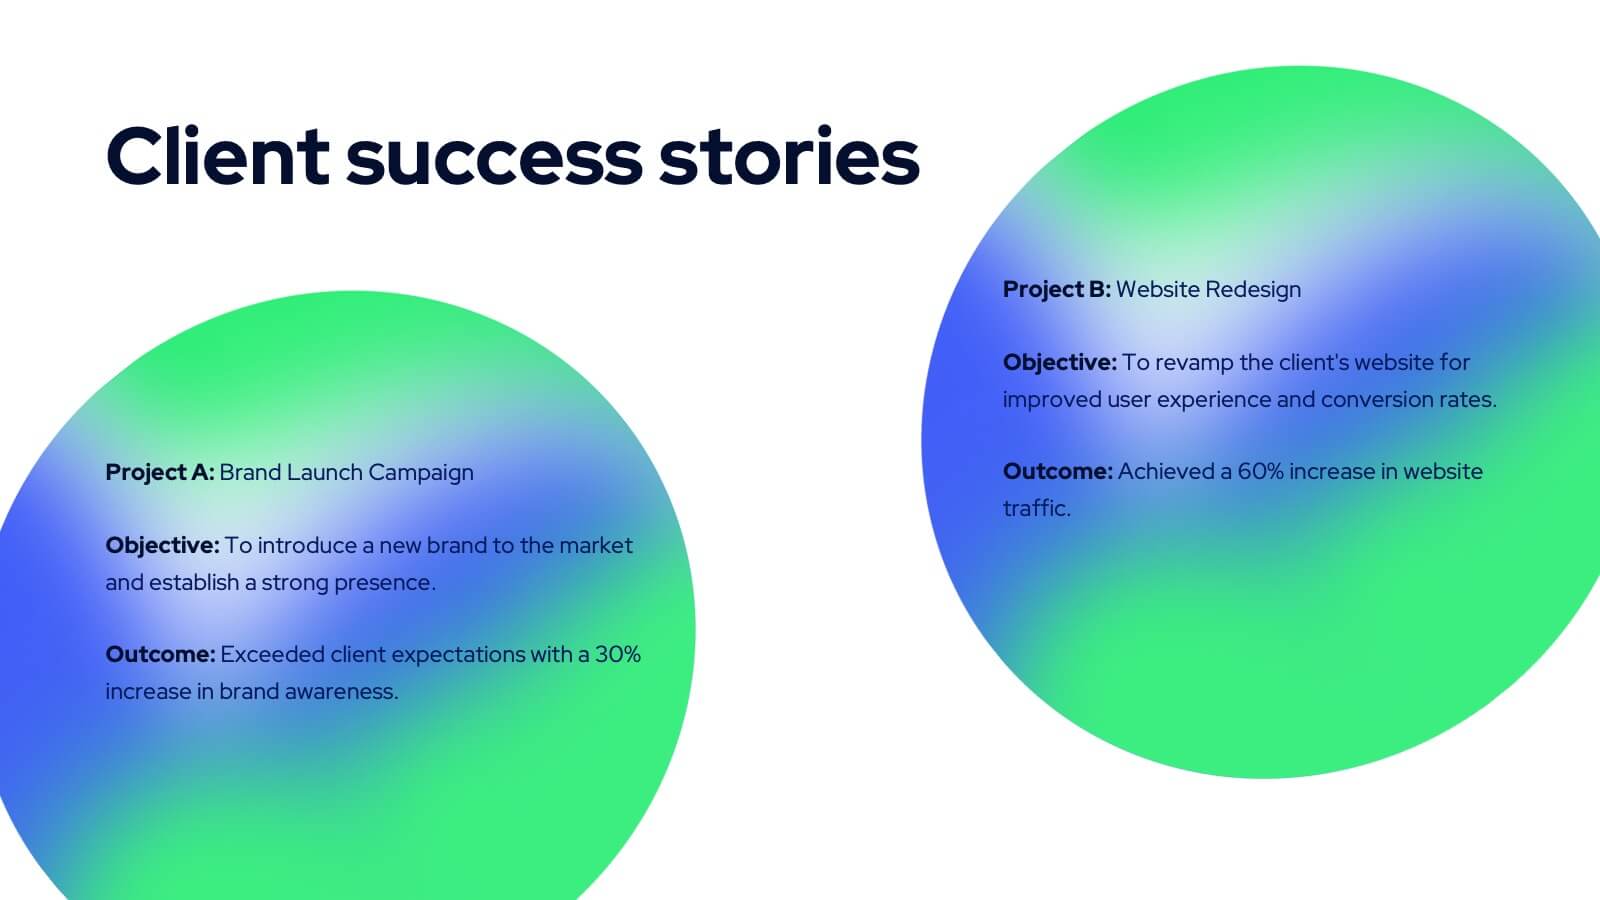
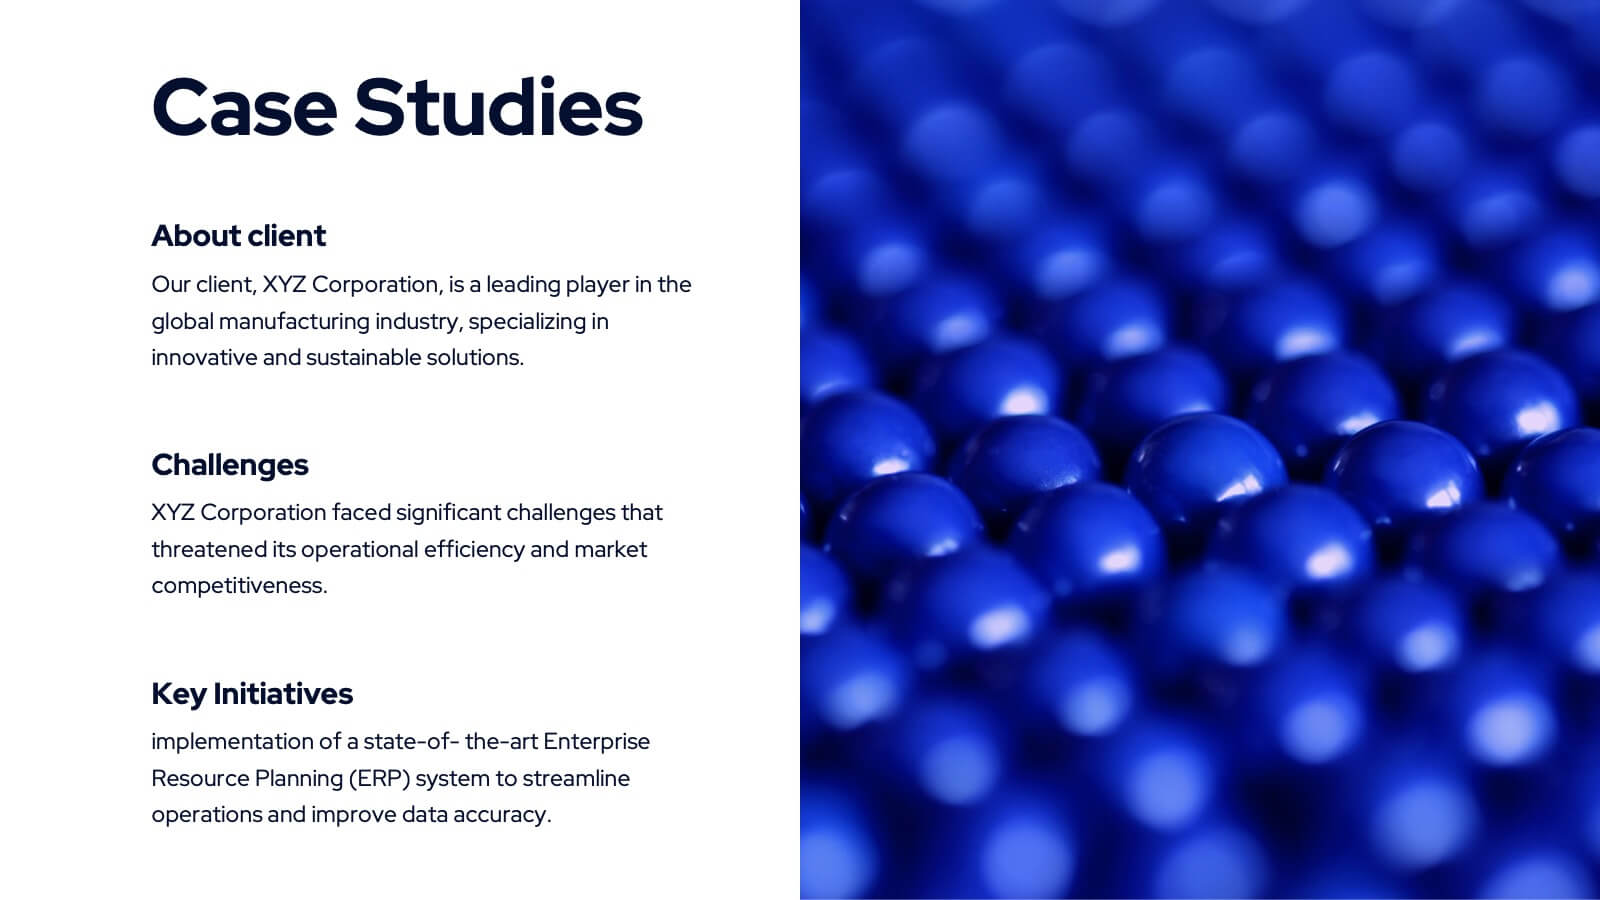
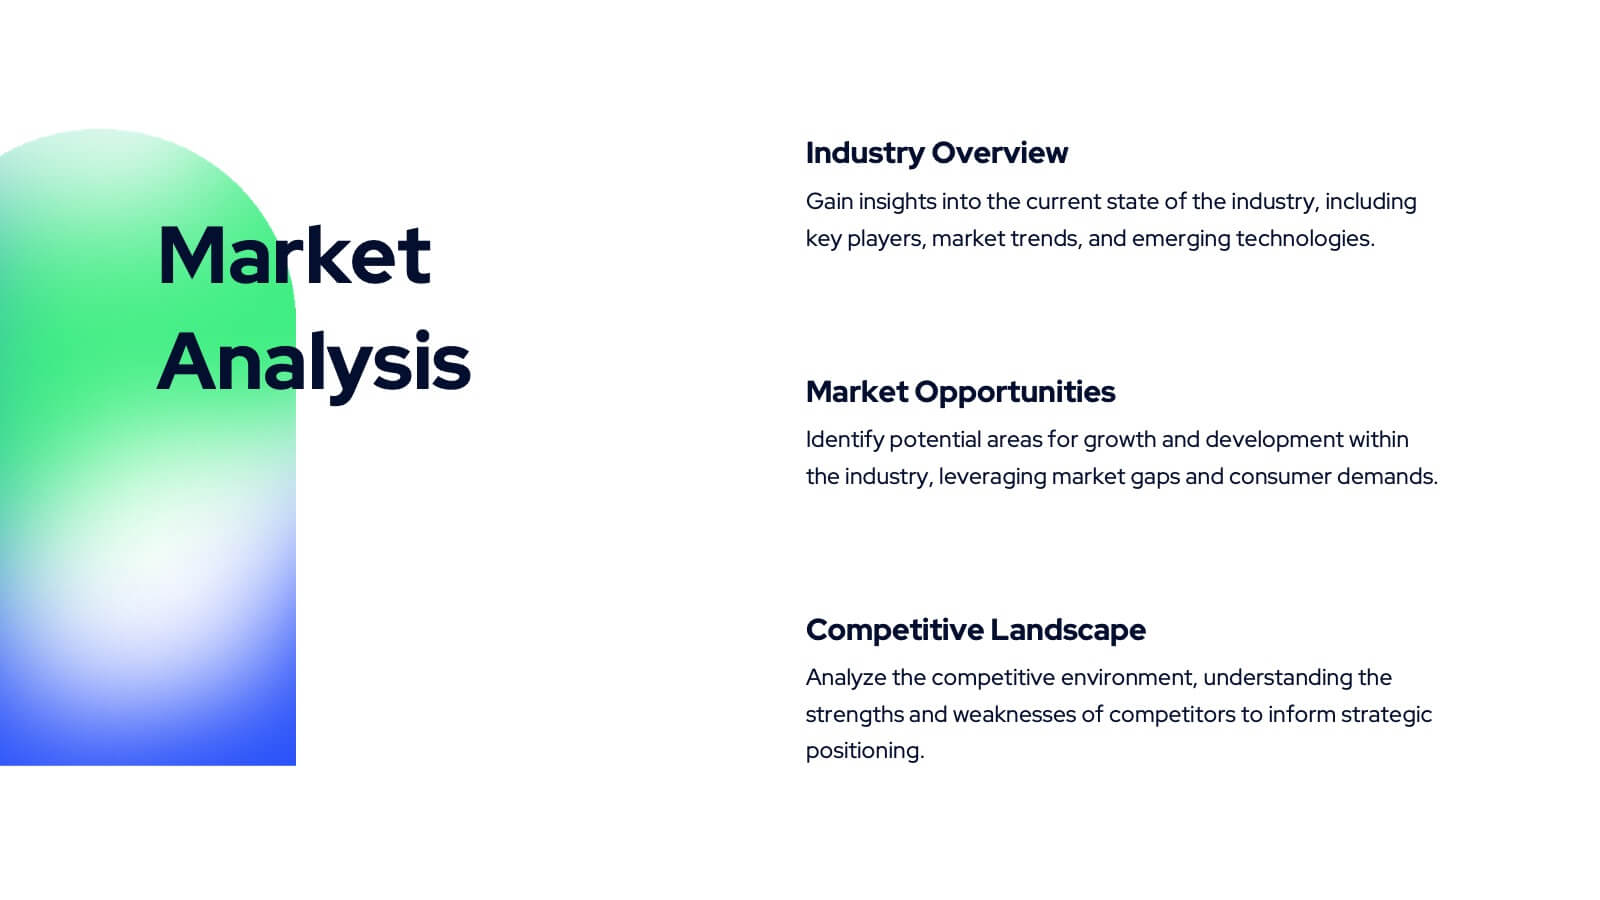
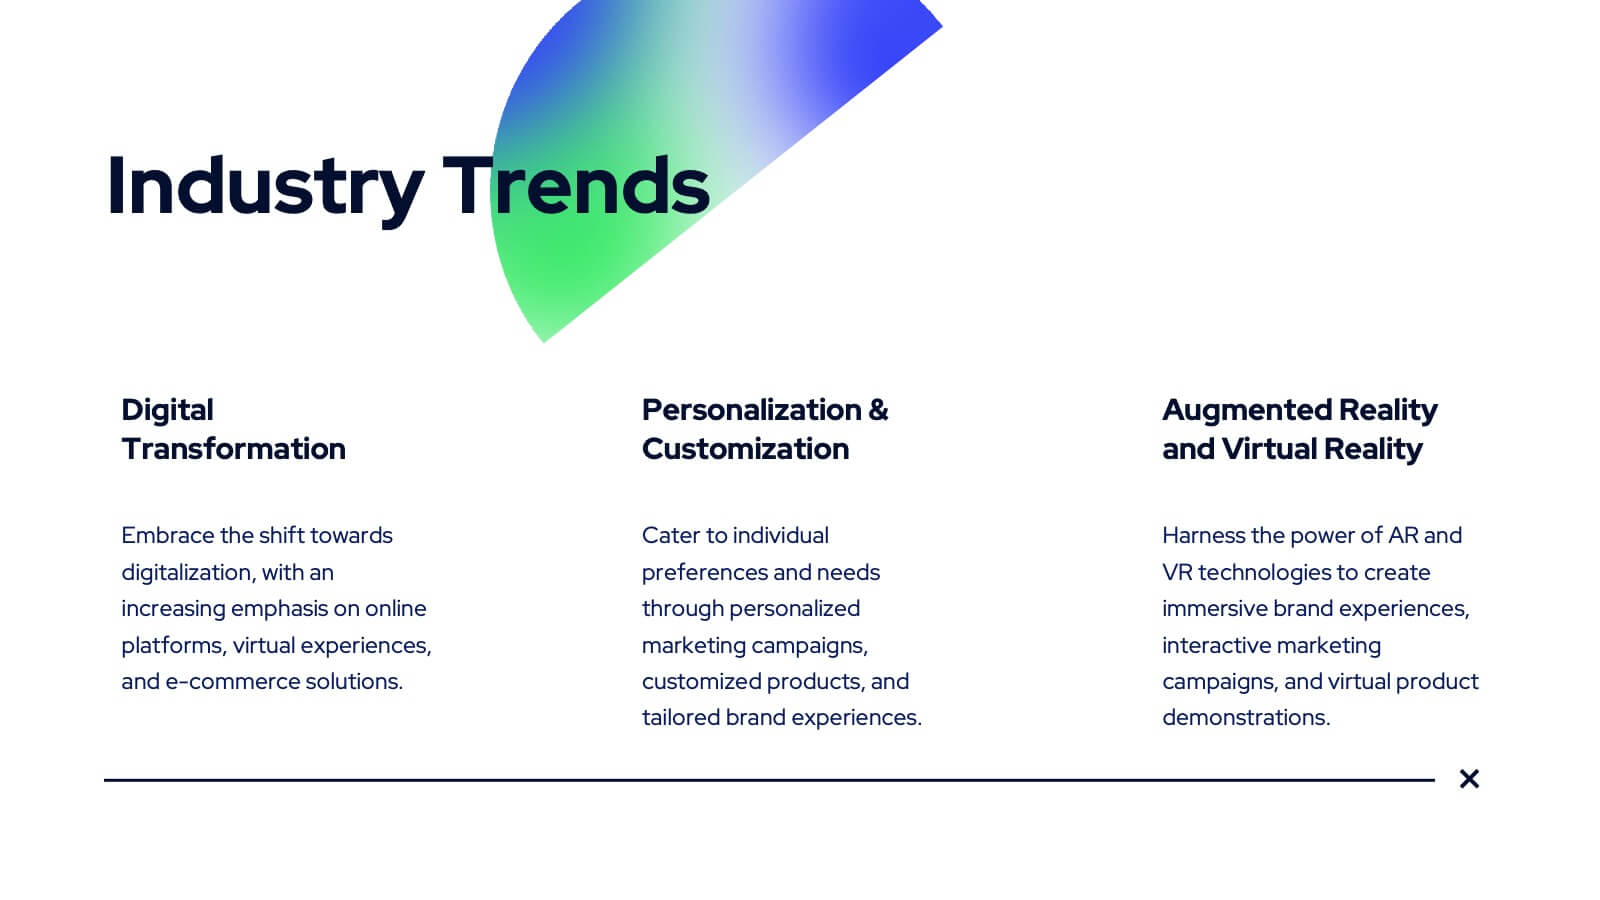
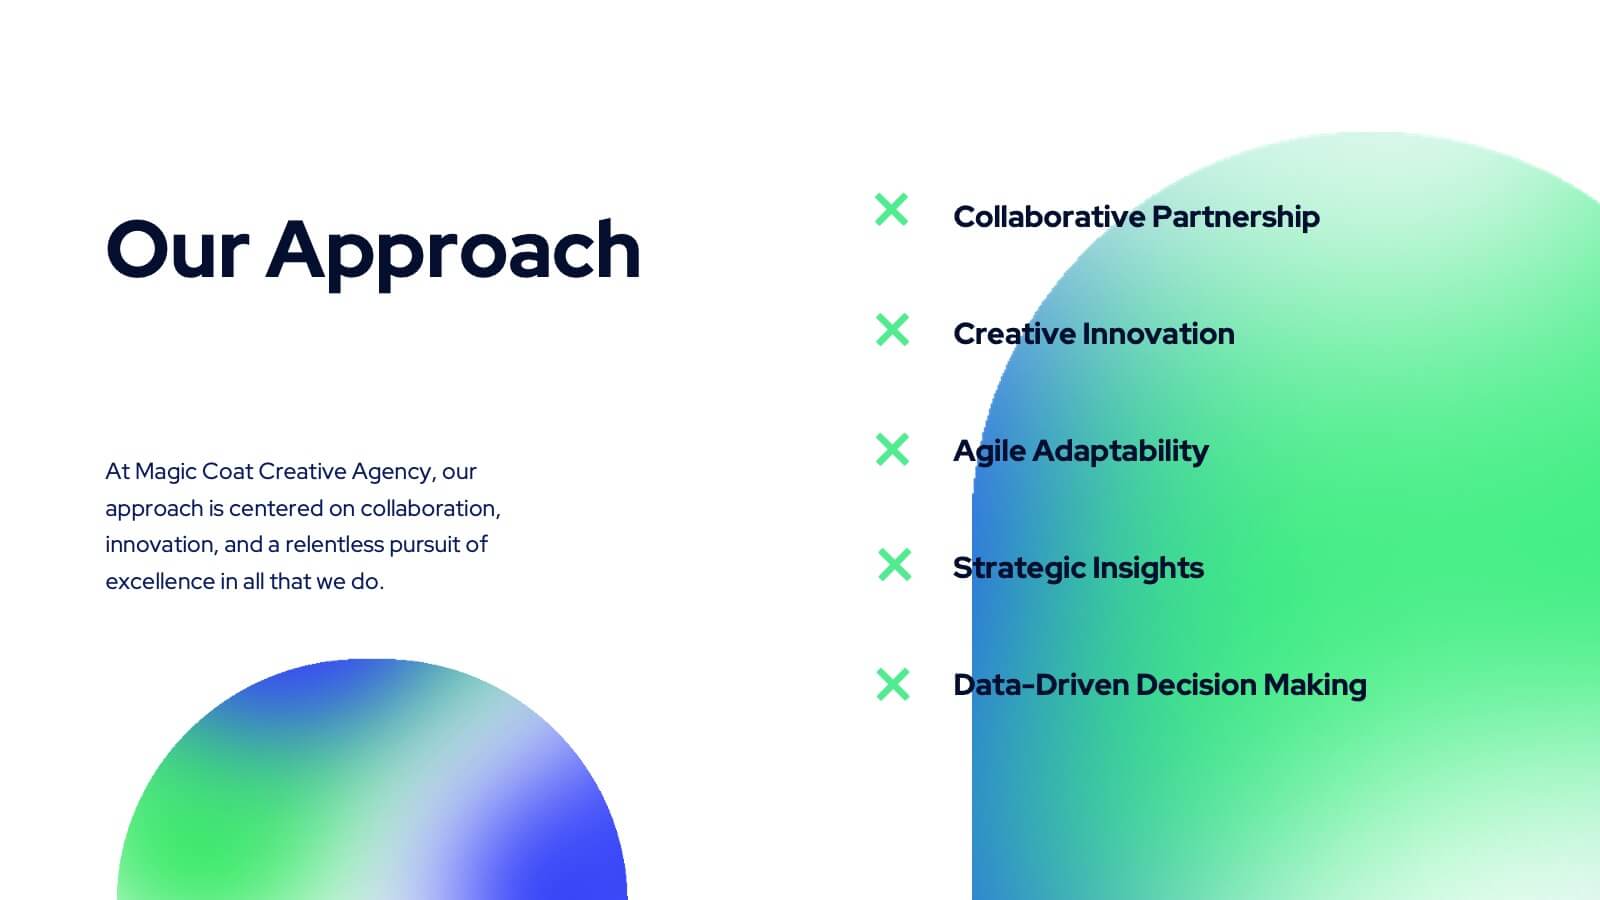
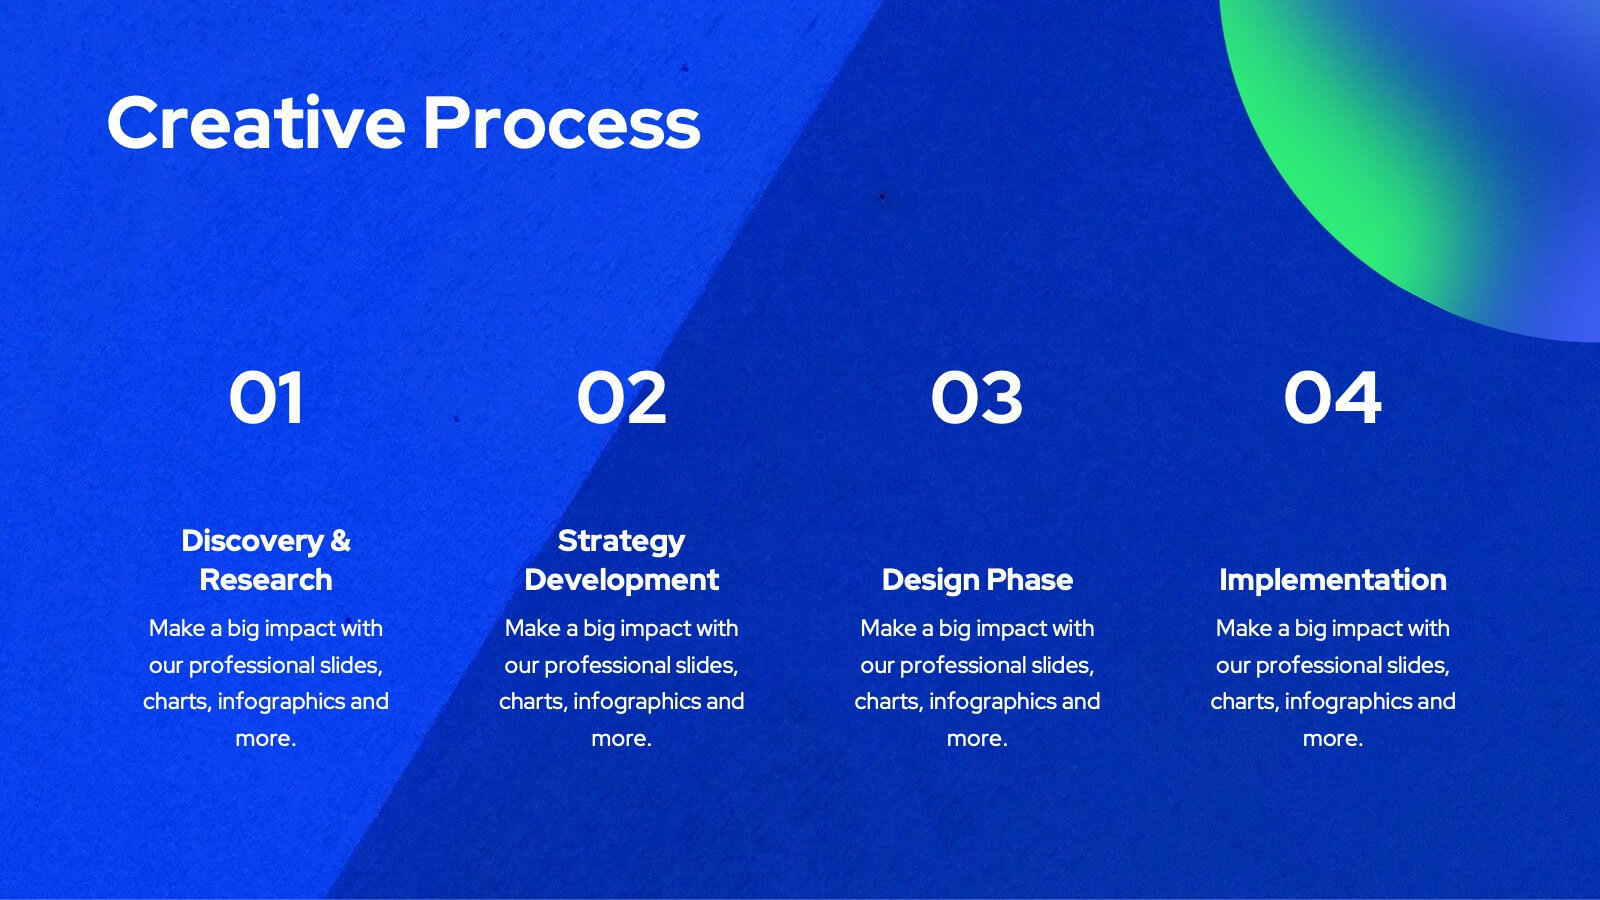
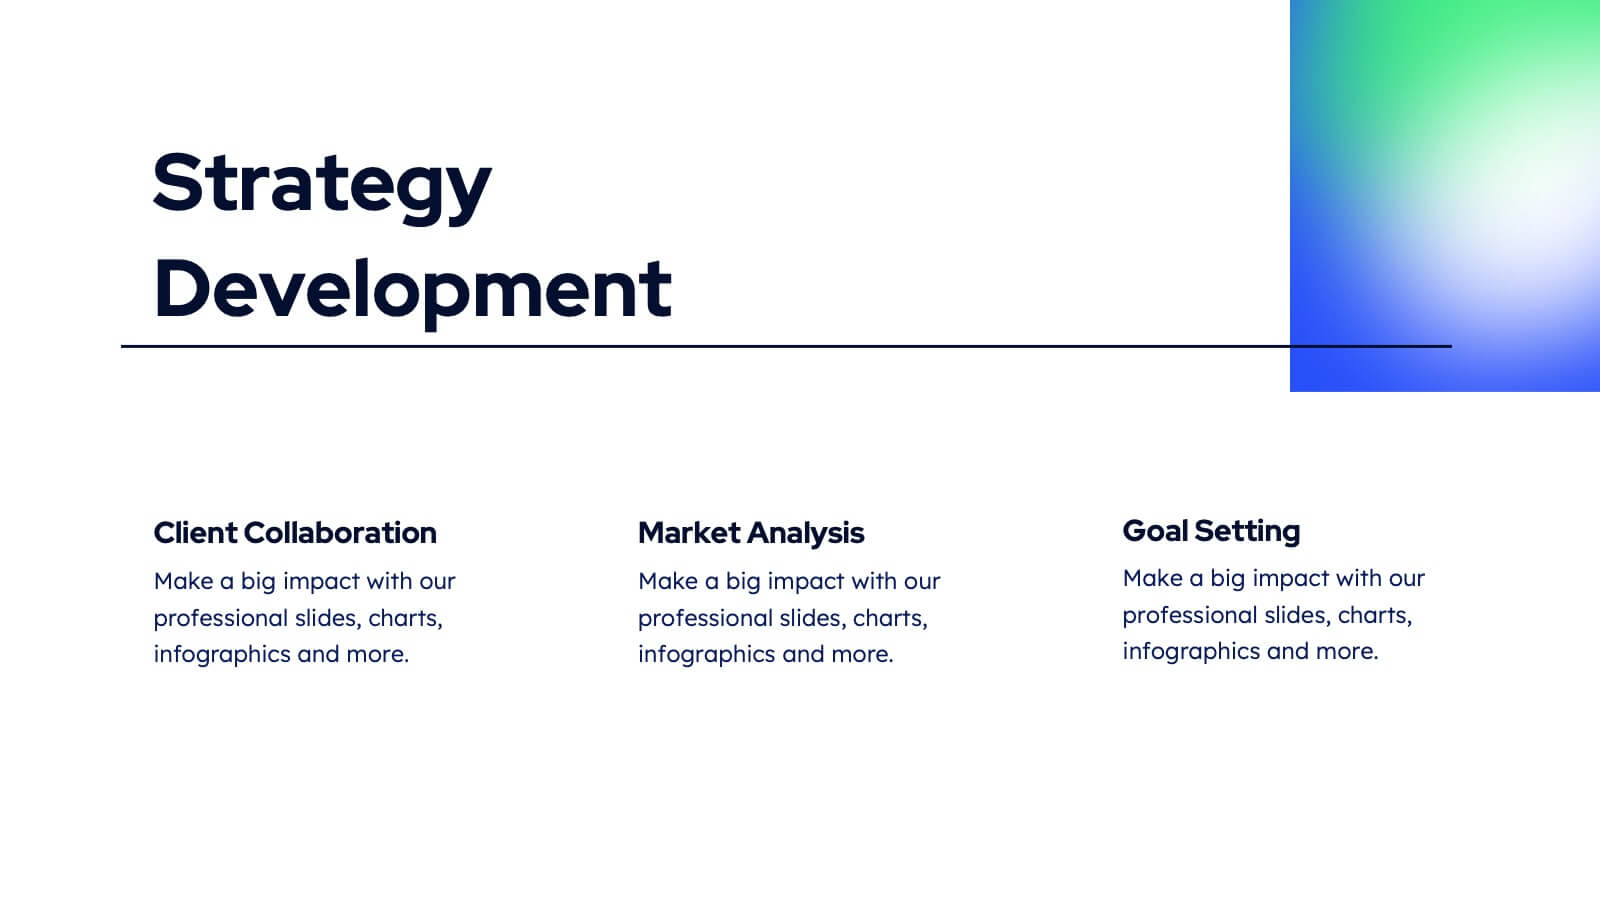
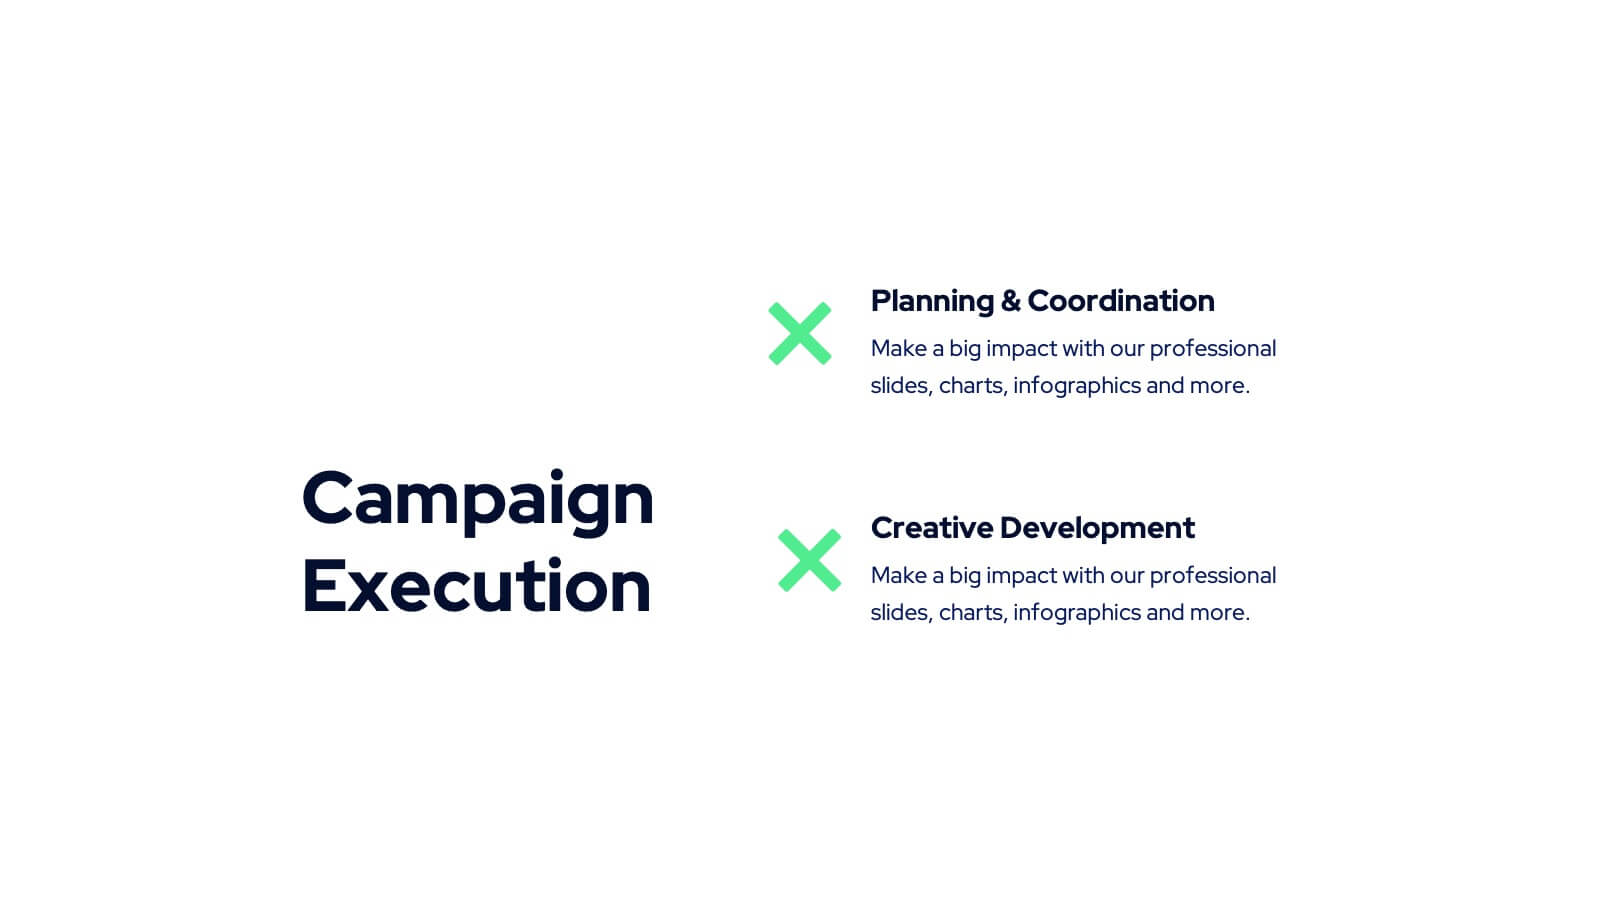
Tanzanite Full-Service Agency Project Plan Presentation
Showcase your agency's strengths with this bold and modern portfolio presentation template! From client success stories and case studies to market analysis and strategy development, this template highlights your expertise and approach. Perfect for agencies looking to present their services, creative processes, and partnerships. Compatible with PowerPoint, Keynote, and Google Slides, making it easy to impress any audience.


7 slides
Process Solution Infographic
Streamline intricate workflows with our process solution infographic. Anchored in a pristine white base and infused with varying shades of professional blue, our template elegantly delineates step-by-step solutions and systematic approaches. Decked with meticulous infographics, representative icons, and versatile image placeholders, it transforms complexities into a navigable visual journey. Masterfully curated for Powerpoint, Keynote, or Google Slides. An invaluable asset for process managers, business analysts, strategists, or any organization keen on optimizing workflows. Navigate processes with confidence; let each slide chart the path to optimized solutions.


26 slides
Poseidon Sales Pitch Deck Template Presentation
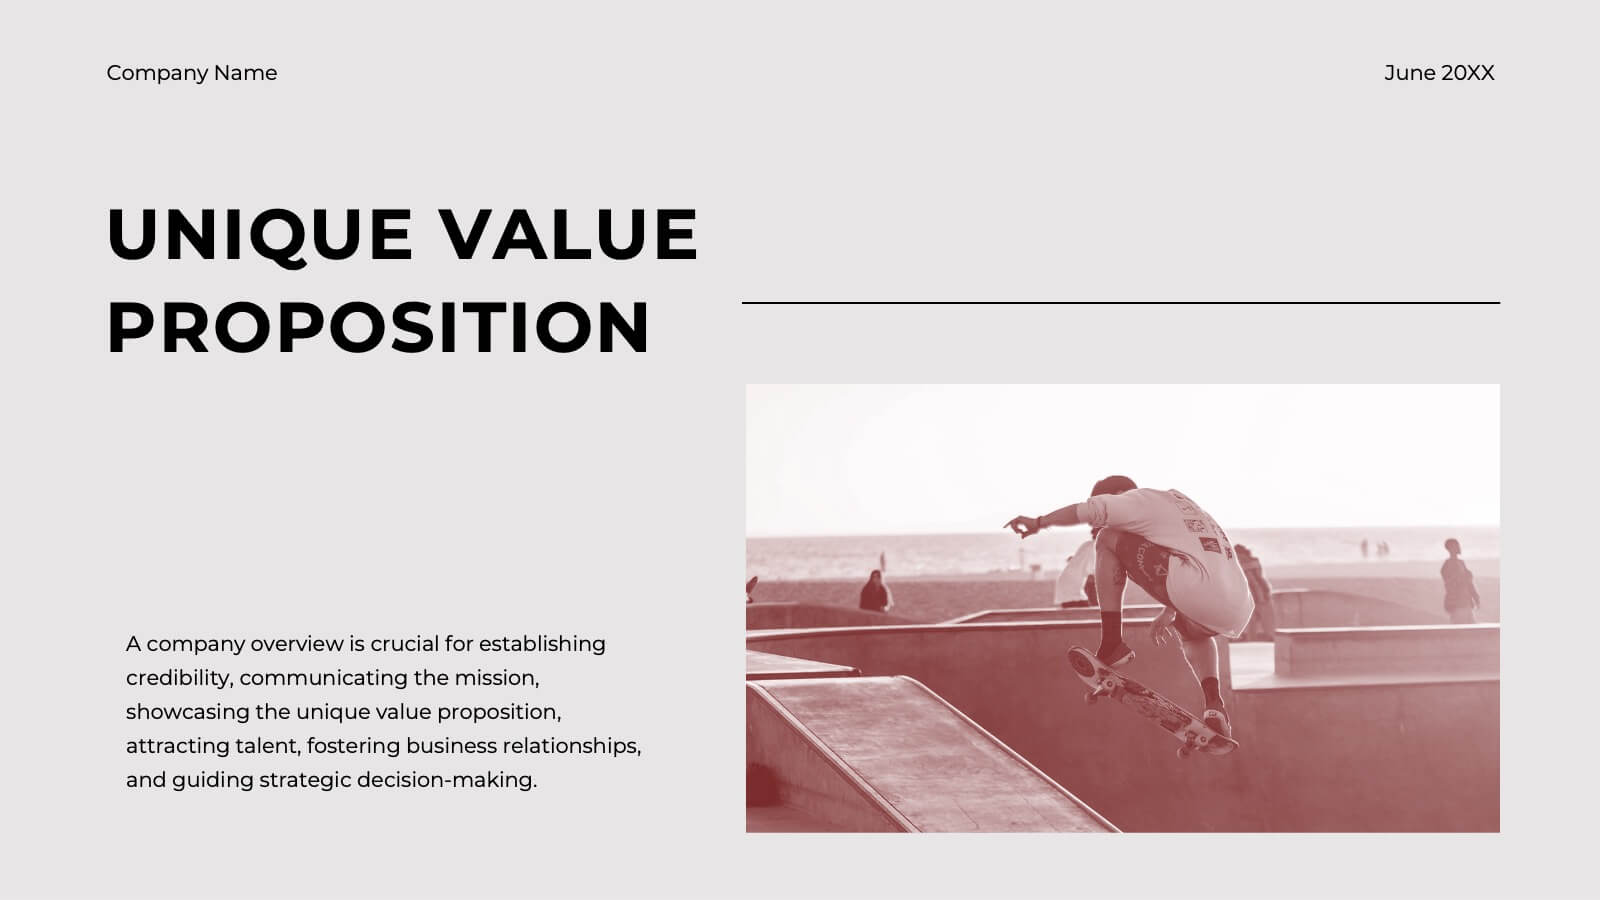
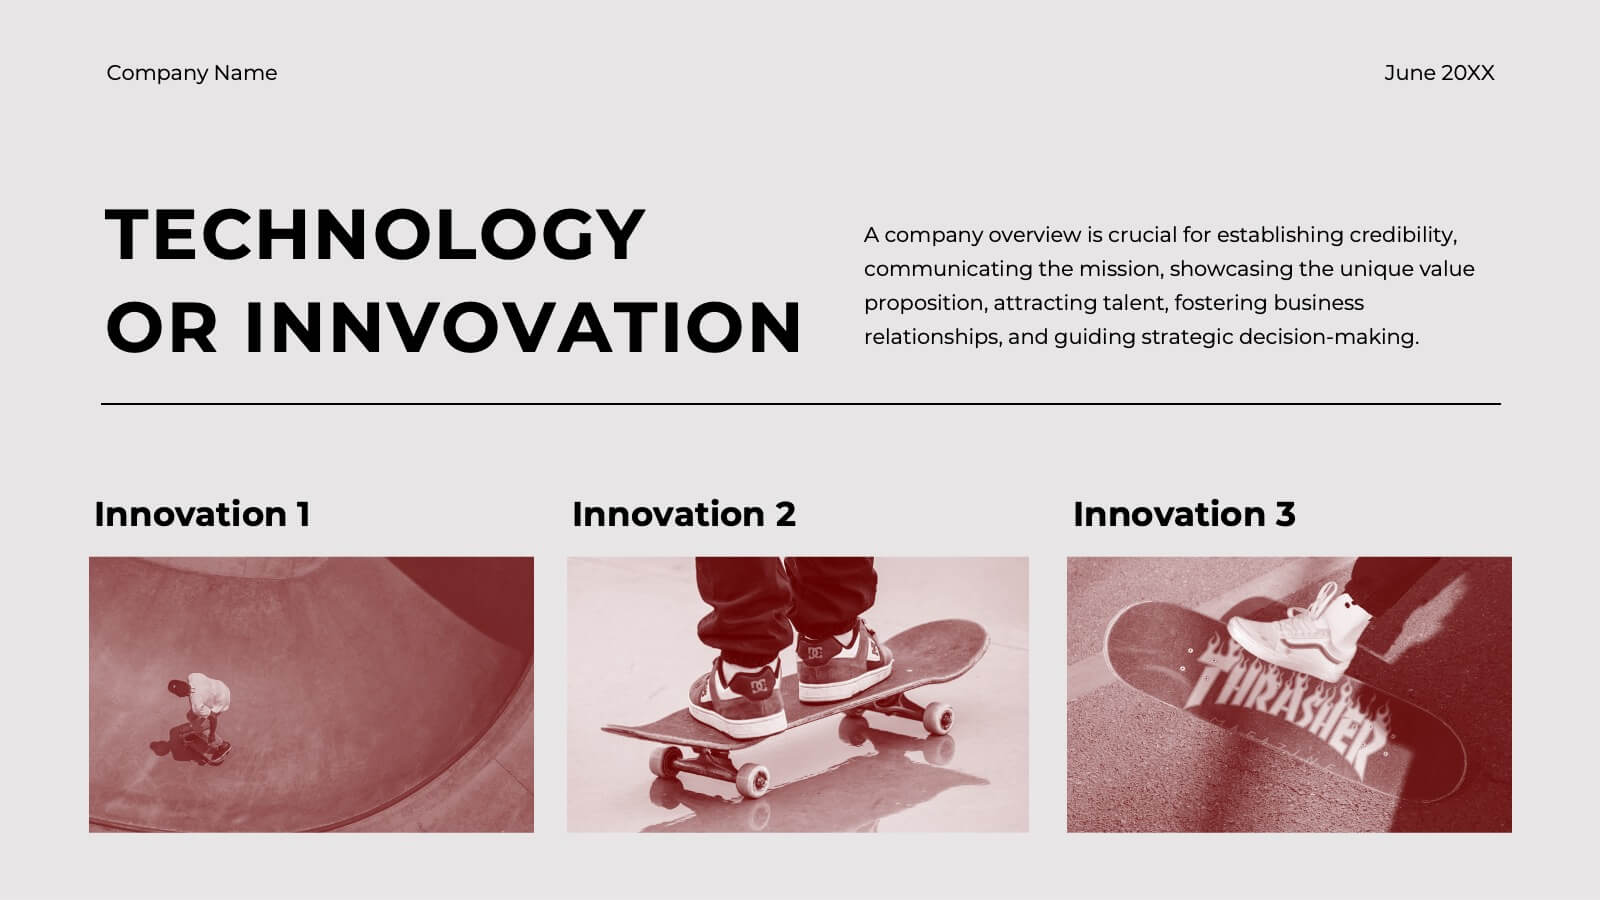
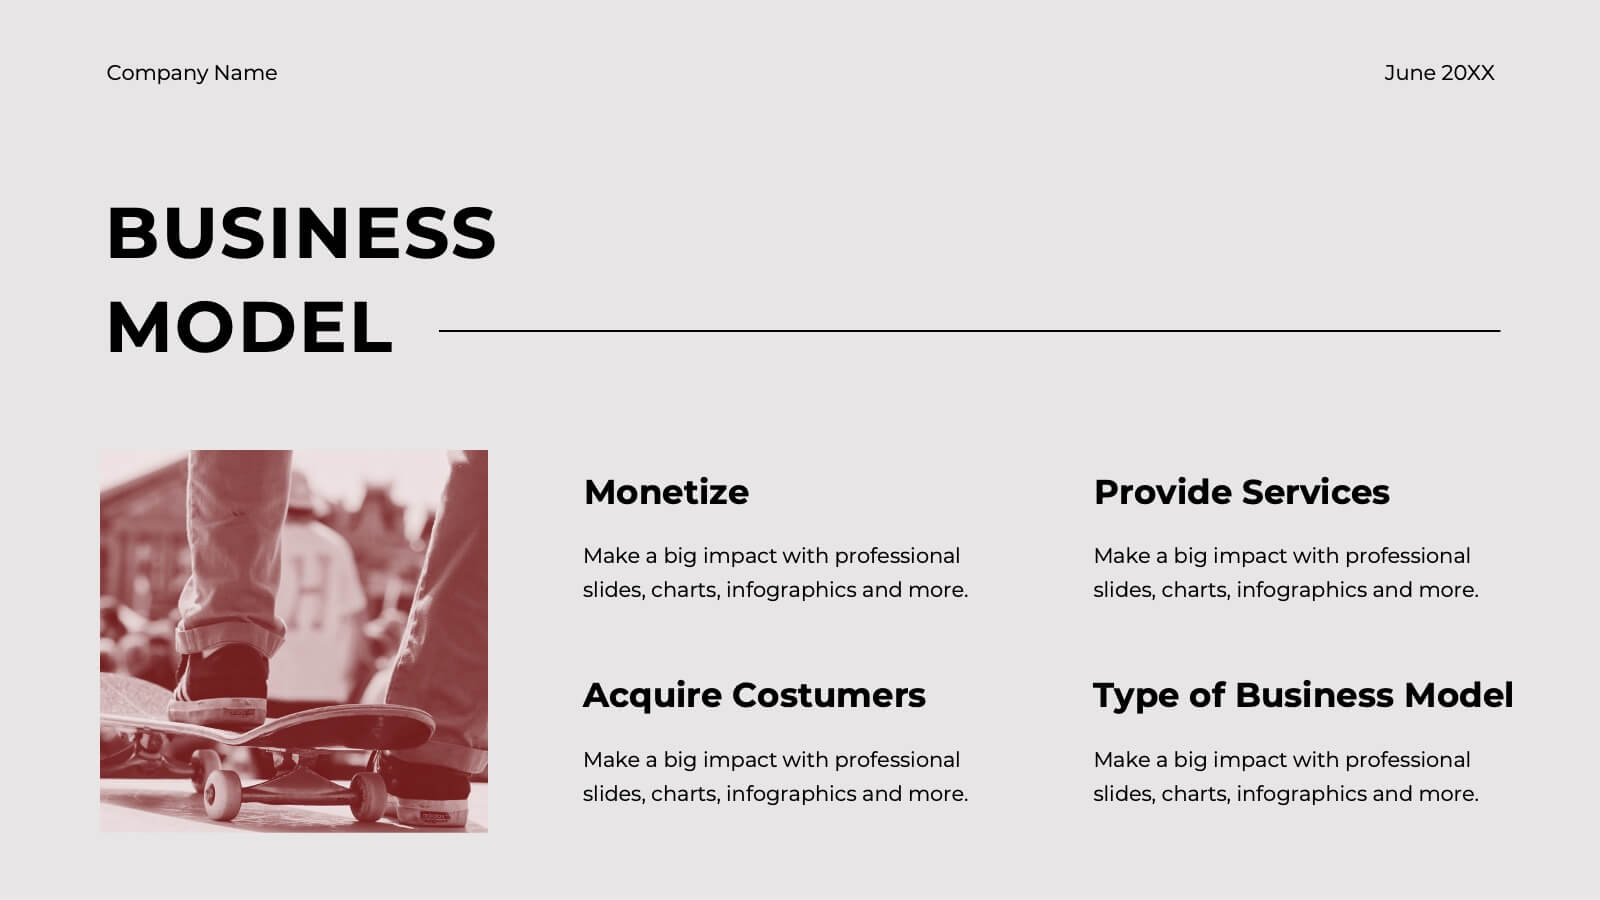
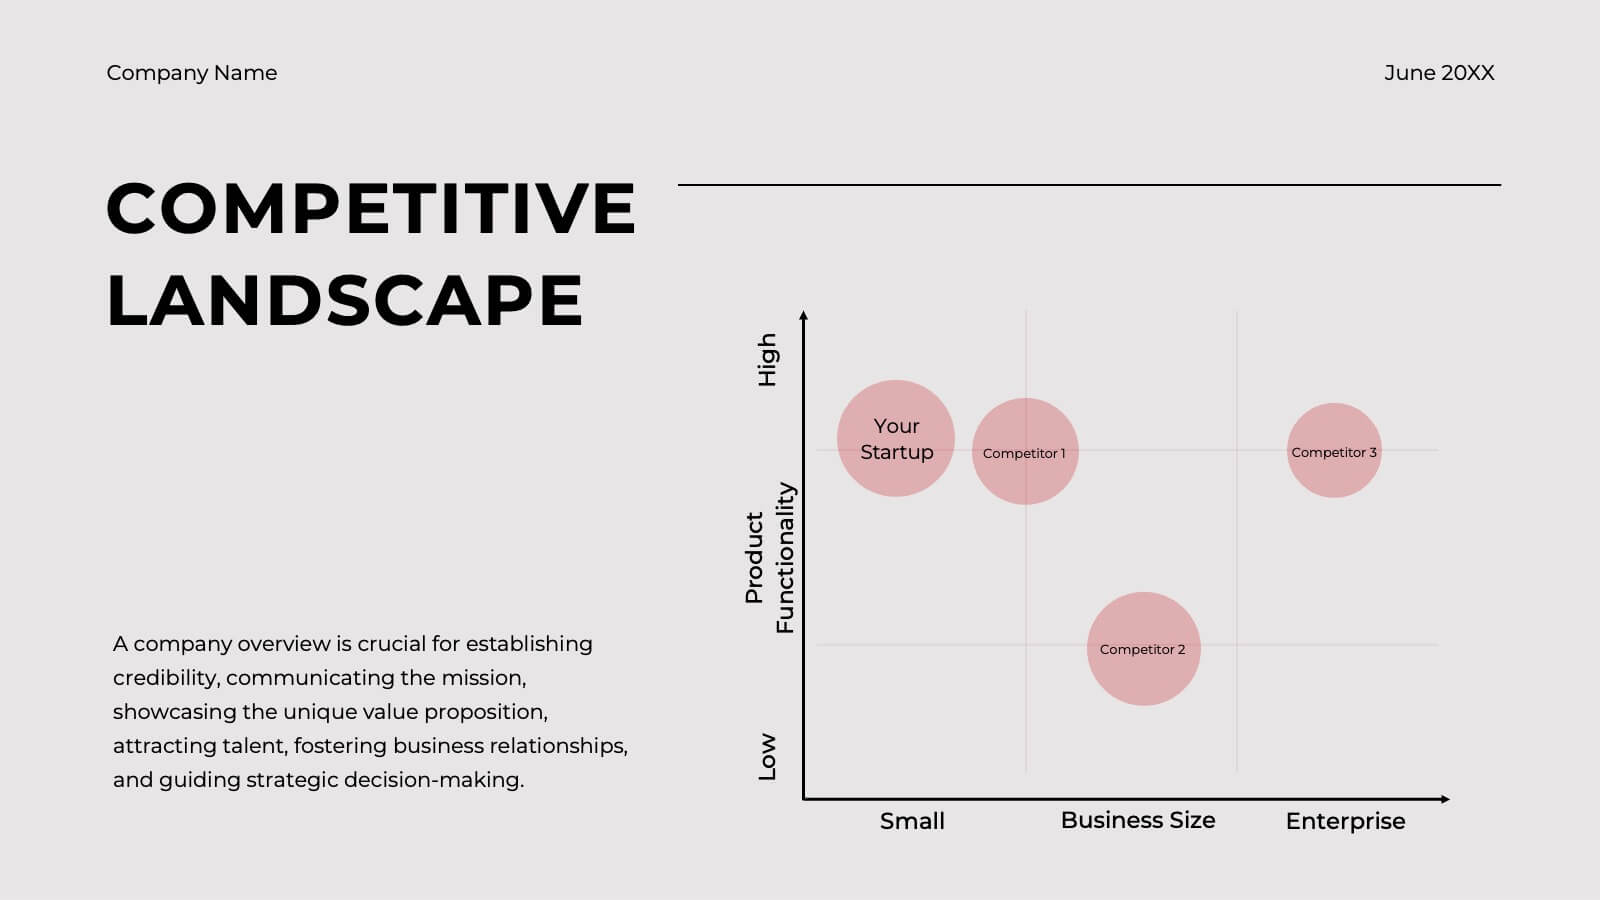
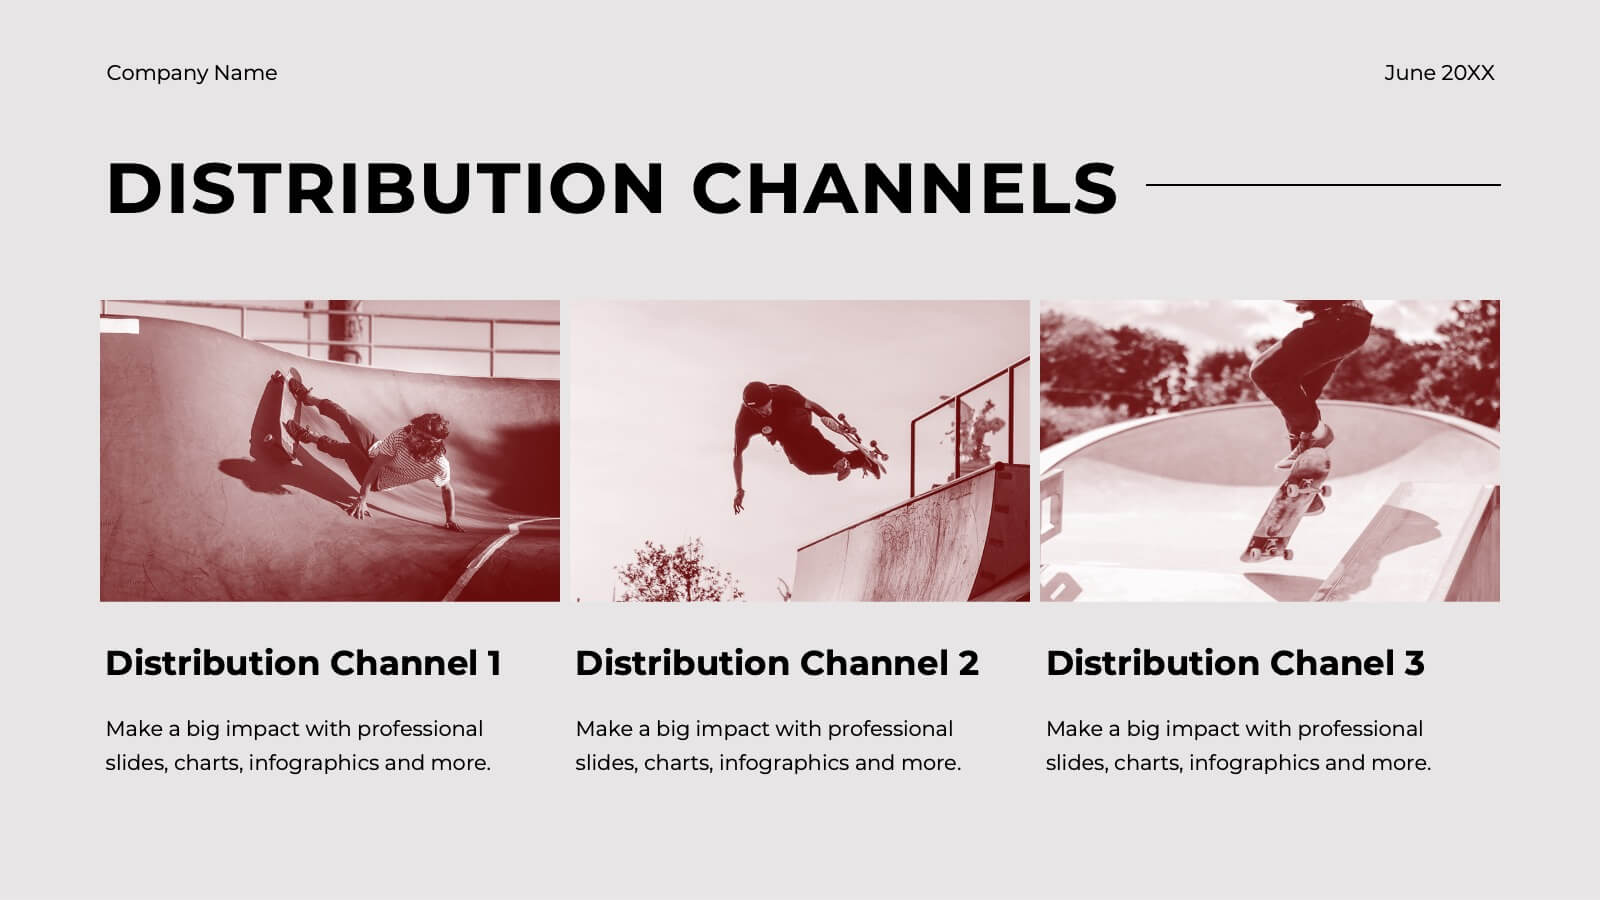
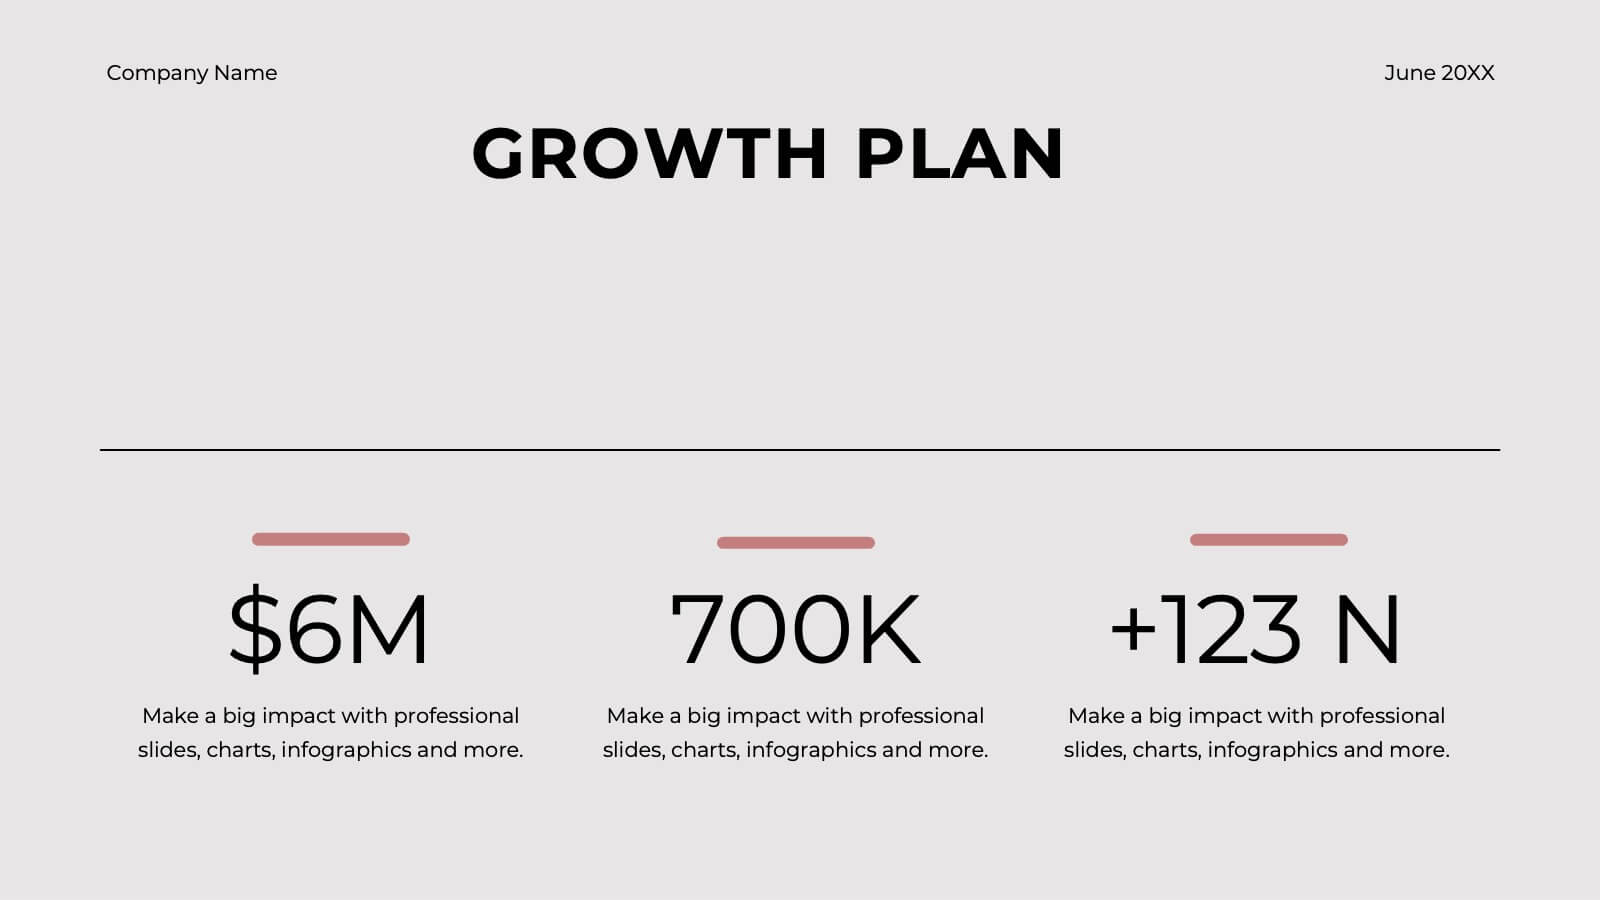
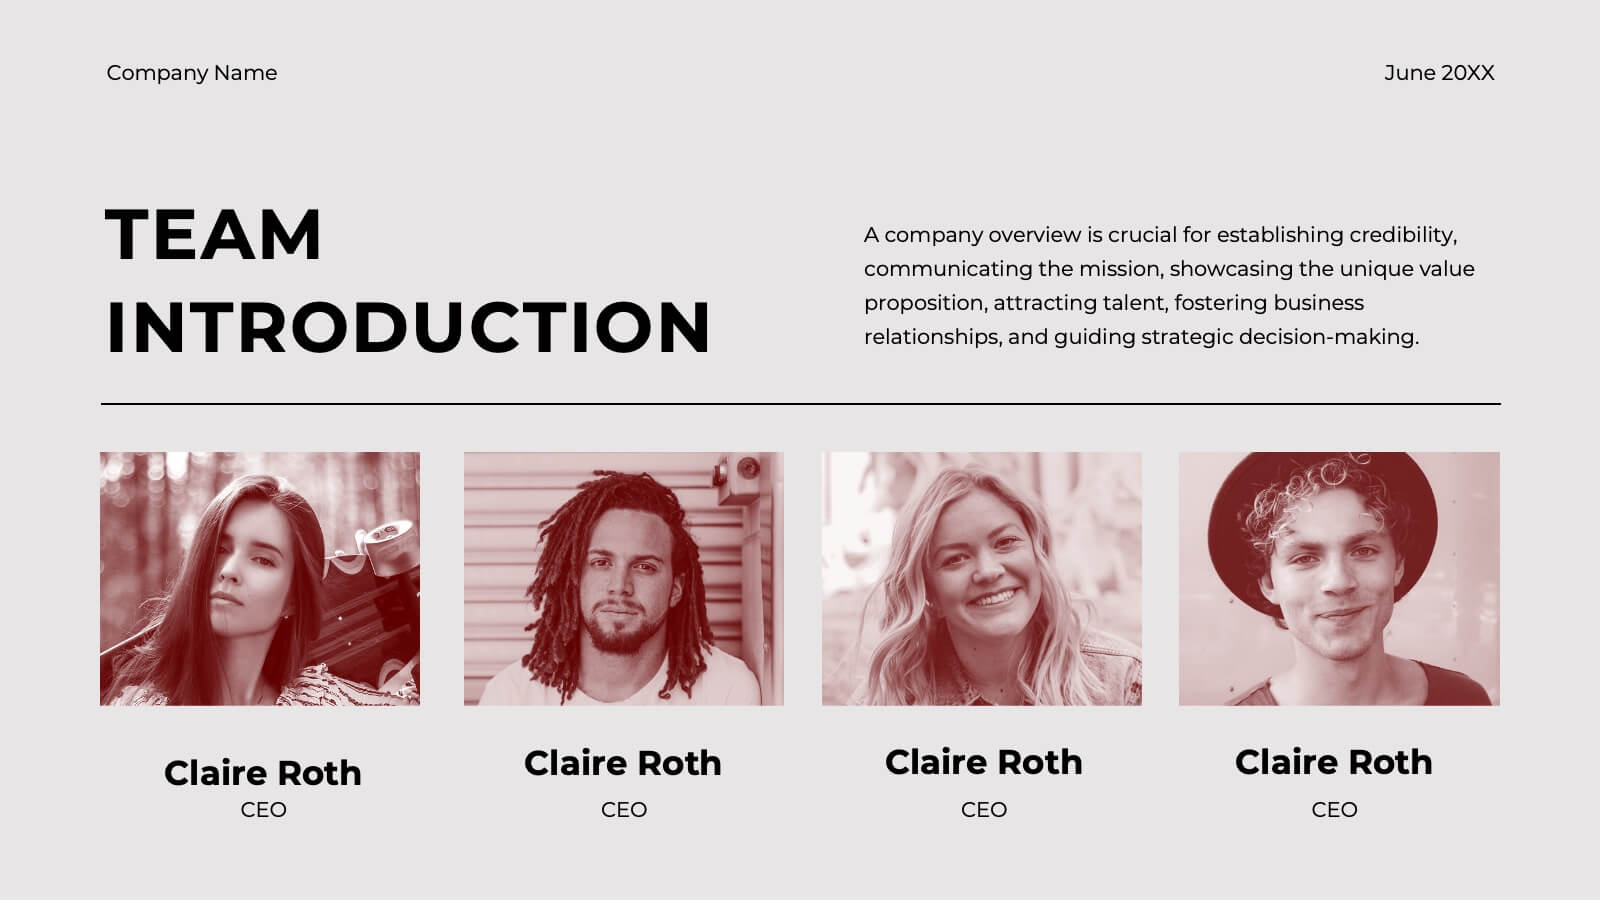
Unleash your persuasive power with the Poseidon Sales Pitch Deck template! This sleek and modern deck is designed to elevate your pitch, making your business the undeniable choice for potential clients or investors. With a compelling company overview and a clear problem statement, this template sets the stage for presenting your solution as the ultimate answer to your market’s challenges. The deck includes essential slides like competitive landscape analysis, revenue models, and marketing strategies to give your pitch a comprehensive edge. The visually appealing design combined with well-organized sections ensures your message is clear, concise, and impactful. Customize it to fit your brand identity and make your unique selling proposition stand out. Perfect for startups, established businesses, or anyone looking to make a powerful impression, this template is compatible with PowerPoint, Keynote, and Google Slides. Take your pitch to the next level and close those deals with confidence!


4 slides
Big Data Analytics Business
Simplify data complexity with this layered stack diagram designed for big data workflows and insights. Ideal for IT professionals, analytics teams, and consultants, it visually represents data input, processing, and output stages. Fully editable in PowerPoint, Keynote, and Google Slides for flexible customization.


4 slides
IT Operations Management Presentation
Enhance your IT strategy with the IT Operations Management Presentation template. This clean, modern slide layout helps illustrate key operational processes, performance metrics, and strategic improvements with an easy-to-follow, upward trajectory design. Ideal for IT managers and business leaders looking to showcase efficiency, scalability, and innovation. Fully editable in PowerPoint, Keynote, and Google Slides for seamless customization.


6 slides
Workforce Development Strategy Presentation
Enhance your workforce development strategies with our "Workforce Development Strategy Presentation" template. This infographic effectively displays essential workforce statistics and initiatives, organizing data into visually distinct segments for clarity. It covers various demographics and departmental roles, color-coded to differentiate data points like gender distribution and participation rates. Ideal for HR professionals and corporate trainers, this template supports strategic decisions in talent management and training. It simplifies complex information, making it accessible for all stakeholders. Compatible with PowerPoint, Keynote, and Google Slides, this template is essential for delivering impactful and strategic human resource presentations.


2 slides
Visual Resume and Project Gallery Presentation
Showcase your personality and creative work with the Visual Resume and Project Gallery Presentation. This vibrant layout blends a professional “About Me” section with a clean, image-focused gallery—ideal for designers, freelancers, or artists. Fully editable in Canva, PowerPoint, Keynote, and Google Slides for easy customization and seamless presentation.
21 slides
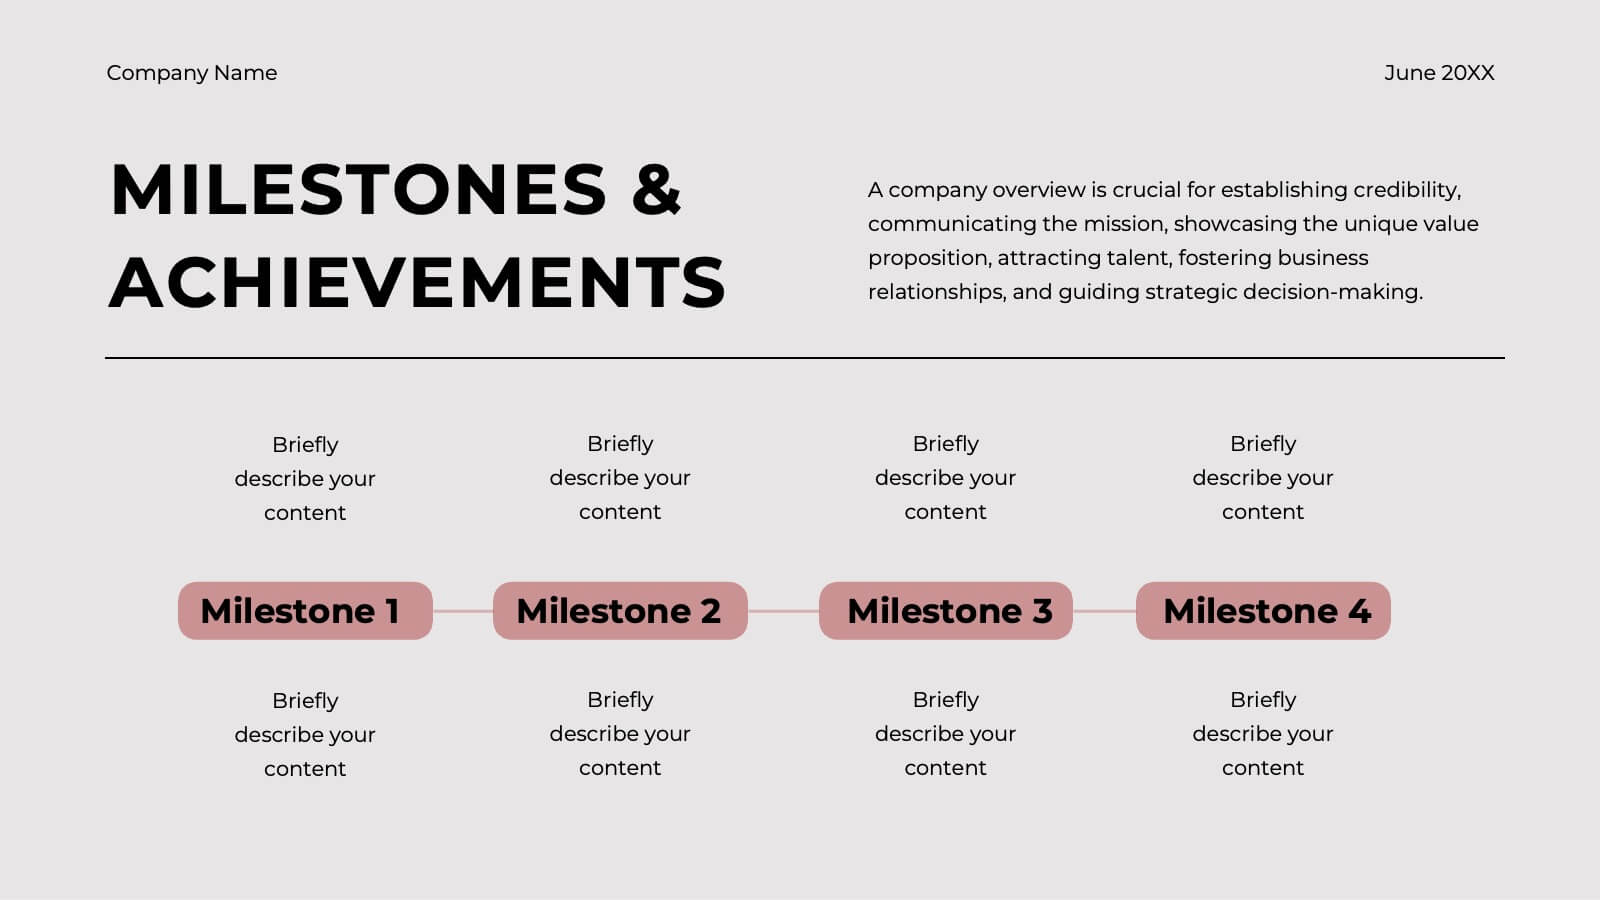
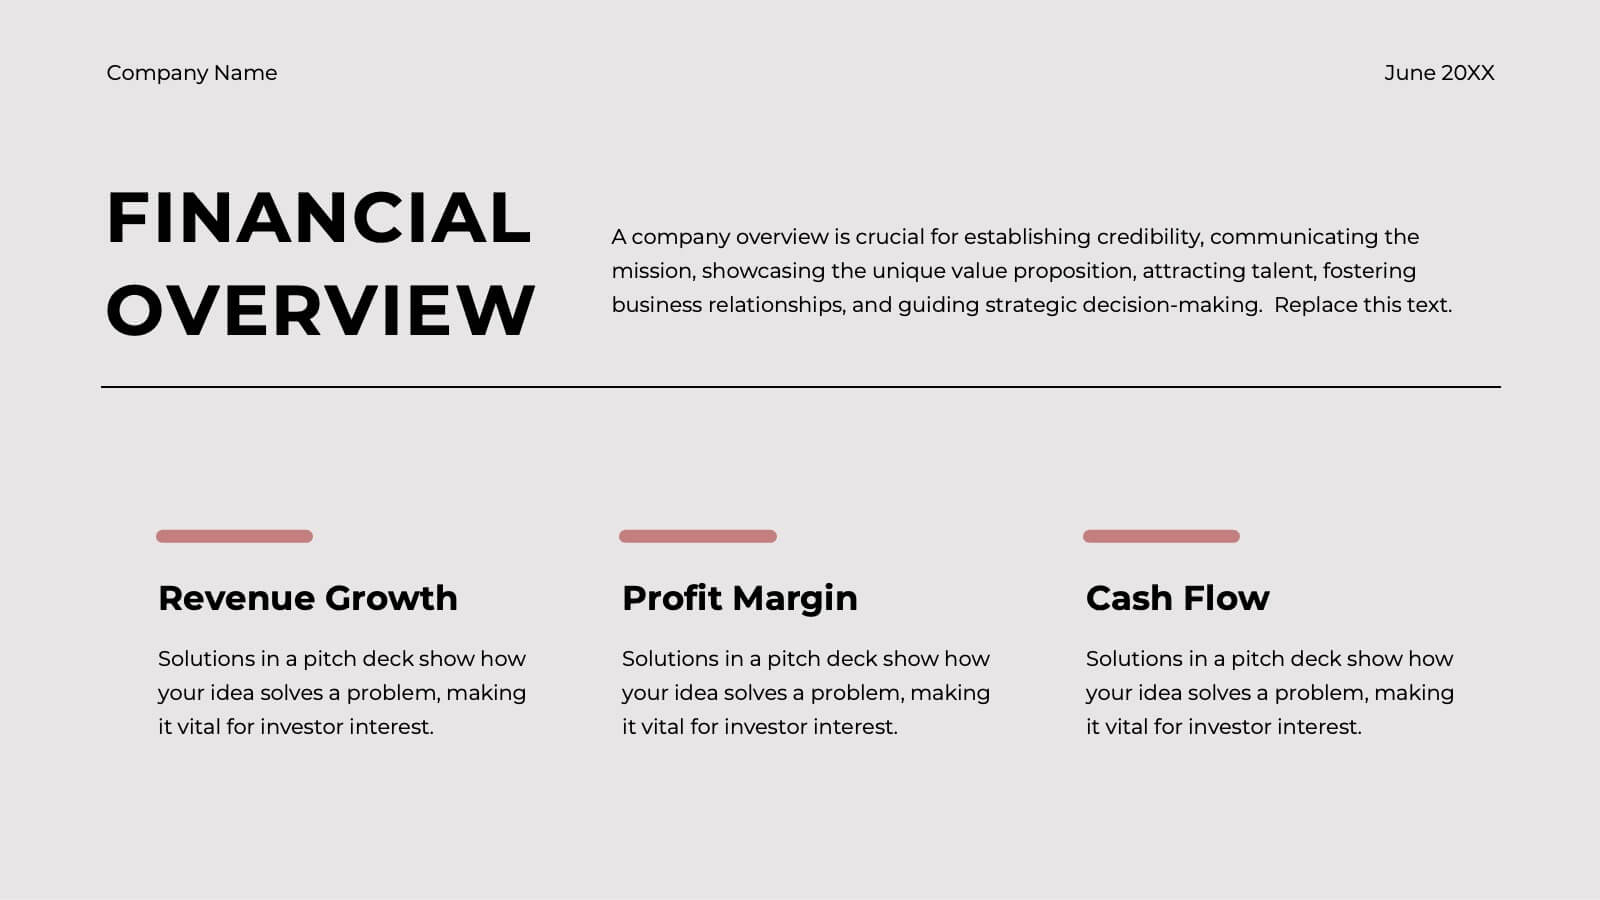
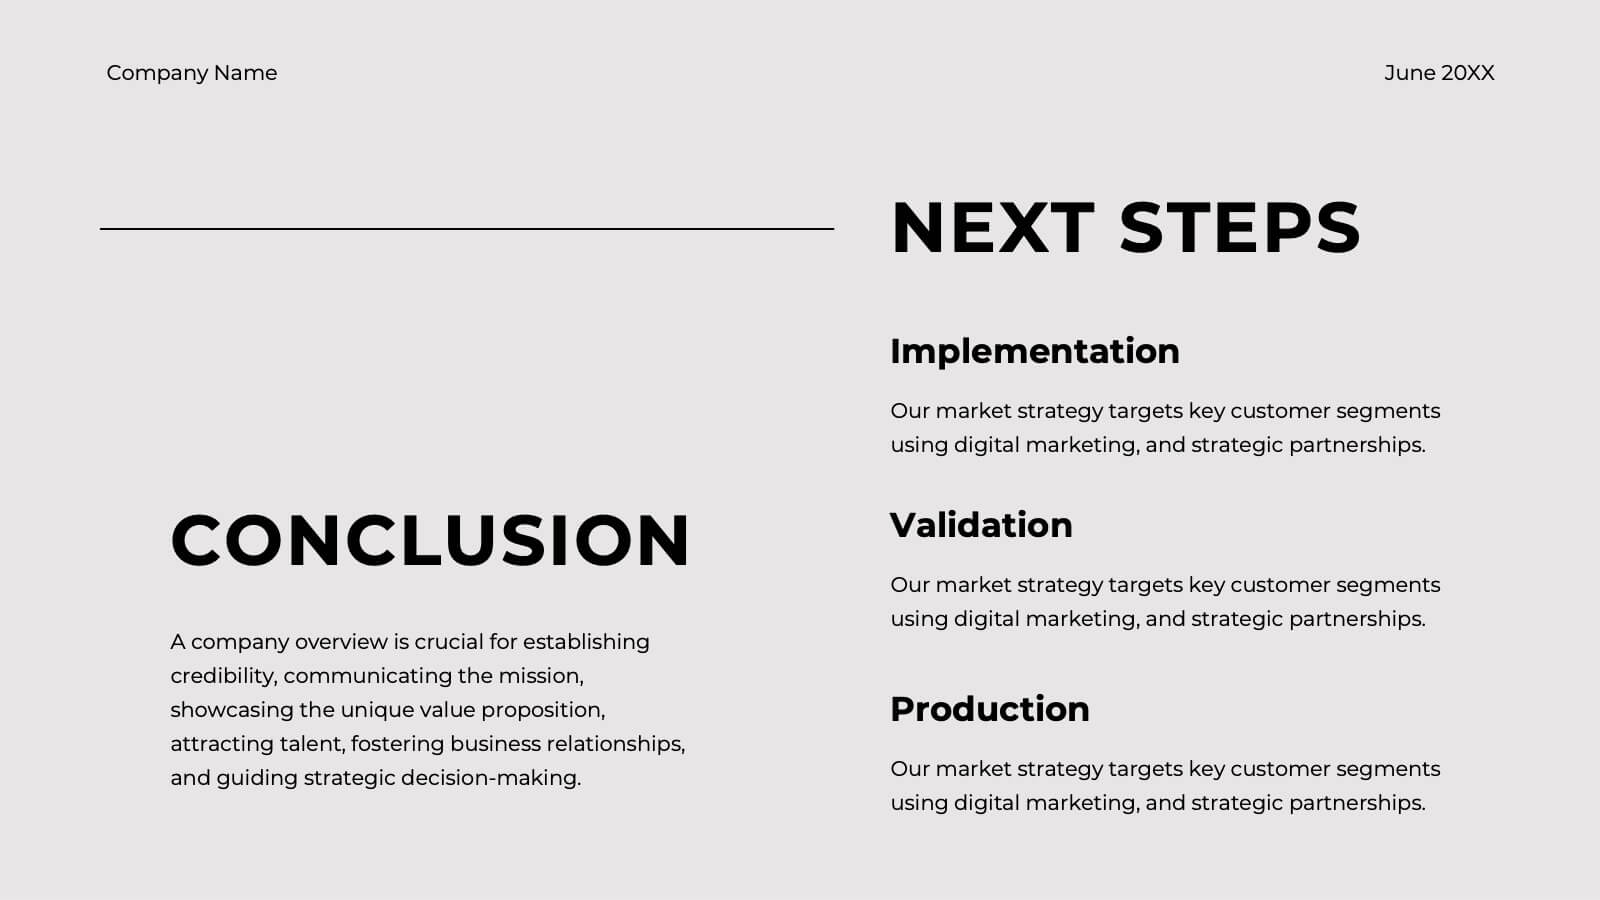
Ember Startup Growth Plan Presentation
Launch your entrepreneurial journey with this dynamic startup plan template! Perfect for detailing your mission, market strategy, and unique value proposition, it features professional slides for customer analysis, business models, and financial projections. Present your innovative ideas clearly and convincingly. Compatible with PowerPoint, Keynote, and Google Slides for seamless presentations on any platform.


7 slides
Problem Infographic
These slides focus on presenting problem statements and their contexts in a professional and accessible format. The use of a soft, consistent color palette helps to keep the presentation visually appealing while ensuring that the content remains the focal point. Each slide is designed with ample space for text and icons, which aids in breaking down complex issues into understandable segments. The variety of layouts ensures that you can tailor the presentation to the nature of the problem being addressed, whether it requires more textual explanations or benefits from the use of infographics and icons. These templates are well-suited for business meetings, academic presentations, or any scenario where clear communication of challenges is necessary. They can be effectively used to initiate discussions, brainstorm solutions, or simply to highlight issues that need attention in a structured and organized manner.


6 slides
Optimizing Business Through Value Chain Presentation
Improve operational efficiency and gain competitive advantage with the Optimizing Business Through Value Chain Presentation. This template breaks down each segment of your business activities—from inbound logistics to service delivery—using a modern chain-style visual layout. Perfect for strategy meetings, operational planning, or business model analysis. Fully editable in PowerPoint, Keynote, Canva, and Google Slides.


4 slides
ABC Learning Slide Deck Presentation
Kickstart your ideas with a playful, rocket-shaped layout that turns simple ABC steps into a clear, engaging story. This presentation helps break down processes, lessons, or concepts in a way that feels intuitive and dynamic. Fully customizable and compatible with PowerPoint, Keynote, and Google Slides.


6 slides
Big Data Technology Infographic
Big Data technology refers to the tools, techniques, and frameworks used to capture, store, process, analyze, and visualize large and complex datasets that are beyond the capabilities of traditional data processing systems. This infographic template is perfect for organizations that deal with massive volumes of data from various sources, including social media, sensors, machines, and more. This template enables businesses to gain valuable insights, make informed decisions, and create new opportunities. This infographic can be used for various industries, including e-commerce, healthcare, finance, manufacturing, and more.


6 slides
Conversion Funnel Infographic Presentation
Optimize your marketing strategy with this Conversion Funnel Infographic template. Clearly illustrate lead generation, customer retention, and sales processes in a structured format. Fully editable to match your branding—customize colors, icons, and text effortlessly. Compatible with PowerPoint, Keynote, and Google Slides for a smooth presentation experience.