


Features
- 6 Unique slides
- Fully editable and easy to edit in Microsoft Powerpoint, Keynote and Google Slides
- 16:9 widescreen layout
- Clean and professional designs
- Export to JPG, PDF or send by email


Do you have any questions?
Recommend


20 slides
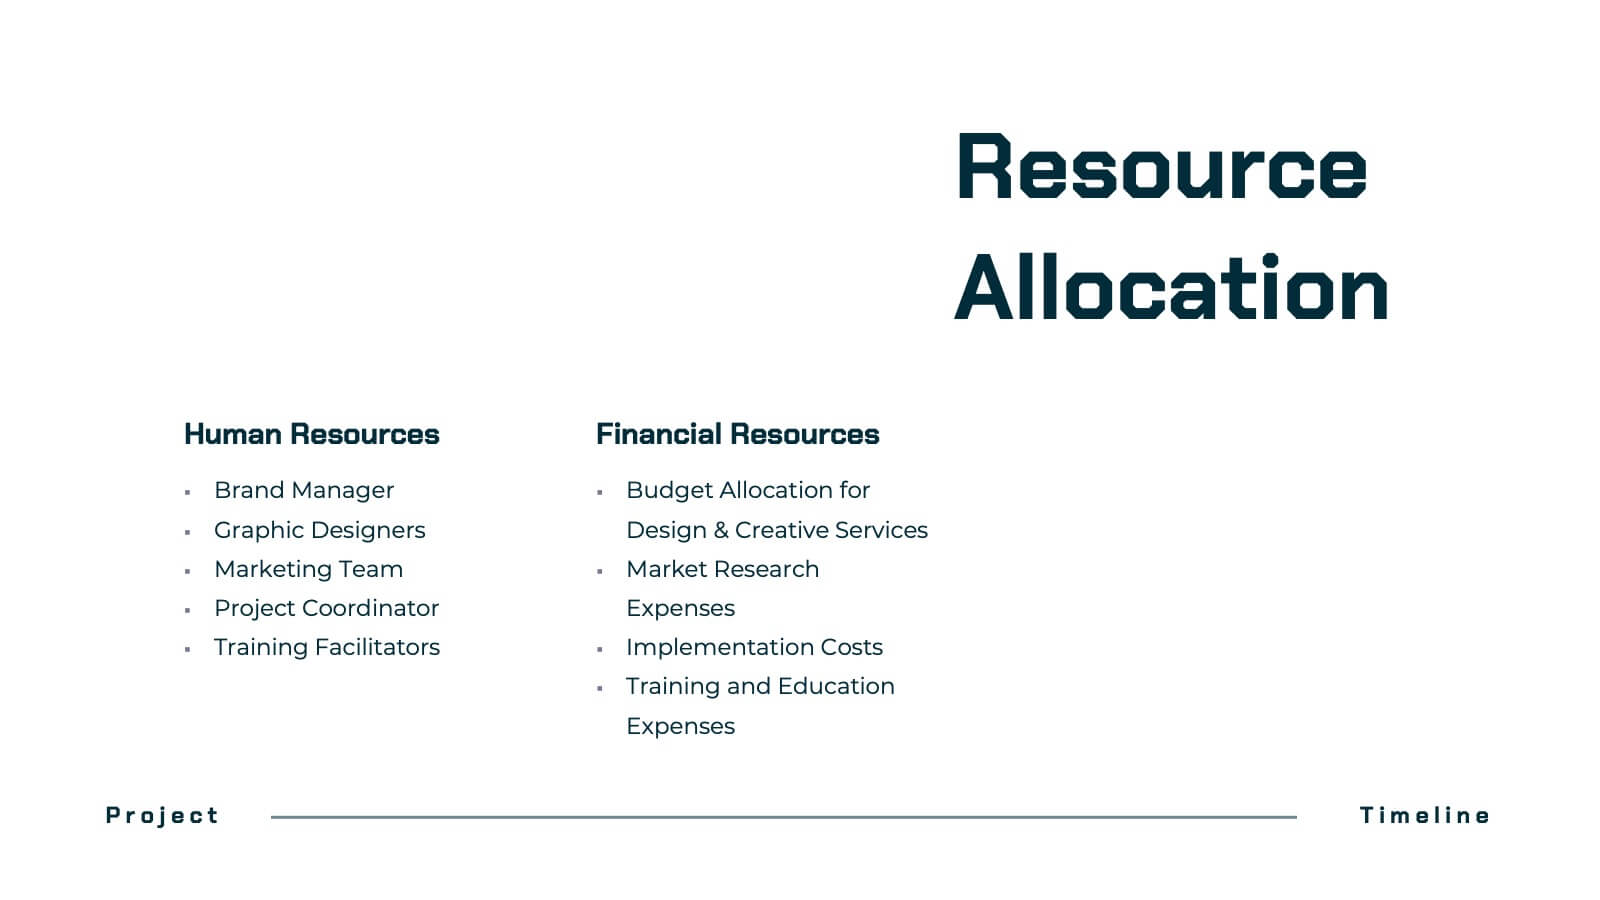
Dynastream Project Timeline Presentation
Stay on track with this detailed and well-organized project plan presentation designed for success! Covering essential areas like scope, objectives, timeline, budget breakdown, and risk management, it ensures every aspect of your project is clear and actionable. Perfect for team meetings or stakeholder updates, this template is fully compatible with PowerPoint, Keynote, and Google Slides.


4 slides
Incident Prevention and Safety Culture Presentation
Promote a proactive approach to workplace wellbeing with the Incident Prevention and Safety Culture presentation. This visually structured slide uses bold safety icons—such as warning signs, first aid, and hazard symbols—to represent core pillars of a safety-first environment. Ideal for outlining safety protocols, risk mitigation strategies, training initiatives, and cultural values, each section includes editable placeholders for concise messaging. The clean layout supports quick communication in HR briefings, onboarding, or compliance meetings. Fully customizable and compatible with PowerPoint, Keynote, and Google Slides.


6 slides
5-Step SEO Marketing Funnel Presentation
Ignite your marketing story with a bold, flowing visual that makes every step feel purposeful and easy to follow. This presentation breaks down each stage of the SEO funnel, helping you explain strategy, performance, and conversion paths with clarity. Fully compatible with PowerPoint, Keynote, and Google Slides.


12 slides
Breast Cancer Awareness Day Presentation
The Breast Cancer Awareness Day presentation template is an essential tool for health awareness campaigns. With distinctive pink icons symbolizing support and education, this template is perfect for seminars and presentations. It's fully compatible with PowerPoint, Keynote, and Google Slides, enhancing accessibility and user experience.


6 slides
Data-Driven Decision Making Presentation
Showcase your data-to-action process with this clean, step-by-step layout. Ideal for illustrating analytics workflows, this template features five connected stages with modern icons and clear labeling. Perfect for business, tech, or strategy presentations. Fully editable in Canva, PowerPoint, and Google Slides to match your branding and communication needs.


5 slides
DMAIC Six Sigma Framework
Visualize process improvement with this clear and structured DMAIC Six Sigma slide. Perfect for business analysts, quality teams, and project managers, it highlights each phase—Define, Measure, Analyze, Improve, and Control—in a streamlined format. Fully editable in PowerPoint, Keynote, and Google Slides.


10 slides
Milestone Roadmap Infographic Presentation
Track progress with clarity using this Milestone Roadmap Infographic template. Designed to highlight key achievements and project phases, it’s perfect for presentations, team updates, and strategic planning. Editable in PowerPoint, Keynote, and Google Slides, it's an efficient way to visualize goals, timelines, and accomplishments.


5 slides
Workout Motivation Infographics
Finding and maintaining Workout Motivation is a personal journey. These vertical infographics are informative designs that aim to inspire and motivate individuals to maintain an active and healthy lifestyle. This template is perfect for fitness professionals, personal trainers, health coaches, or anyone looking to create engaging content about workout motivation. With its vibrant and dynamic visuals, the template captures the essence of fitness and encourages viewers to embark on their fitness journey. They are designed with eye-catching icons, illustrations, and color schemes that grab attention and make the information easy to understand and remember.


20 slides
Team Meeting Presentation
Streamline your team meetings with this professional presentation template, designed in striking purple tones. It covers all essential aspects from agenda setting to feedback collection, ensuring efficient and effective communication. Compatible with PowerPoint, Google Slides, and Keynote, this template is perfect for keeping your team aligned and focused.


6 slides
Market Differentiation with Blue Ocean Strategy Presentation
Set your brand apart with our Market Differentiation with Blue Ocean Strategy template. This visually compelling tool helps you chart a course through uncharted business waters, emphasizing innovation in cost management, value creation, and buyer engagement. Compatible with PowerPoint, Keynote, and Google Slides, it’s perfect for presenting strategic insights that escape the competitive red ocean into the clear, blue waters of uncontested market space.


21 slides
Mercurion Project Status Report Presentation
Stay on top of your project's progress with this structured and visually engaging presentation template. Covering key highlights, performance metrics, financial summaries, team productivity, and future priorities, this template helps you communicate project updates effectively. Whether for stakeholders, management, or team meetings, it provides clear insights and actionable recommendations. Fully customizable and compatible with PowerPoint, Keynote, and Google Slides.


5 slides
RAPID Decision-Making Framework Presentation
Streamline your choices and boost collaboration with a clear, structured framework that defines every role in the decision-making process. This modern circular layout helps teams visualize responsibilities, actions, and approvals for faster, smarter outcomes. Fully editable and compatible with PowerPoint, Keynote, and Google Slides for effortless customization and presentation.


4 slides
Modern 3D Business Diagram Presentation
Bring your metrics to life with this sleek 3D chart that adds instant dimension to any business presentation. Designed to visualize comparisons or progress across three data sets, this diagram helps you communicate clearly without overloading the slide. Fully compatible with PowerPoint, Keynote, and Google Slides for a seamless workflow.


4 slides
Meet the Business Team Presentation
Ignite curiosity from the start with a clean, modern layout designed to introduce your team with clarity and confidence. This presentation highlights key roles, expertise, and contributions, helping audiences quickly understand who drives the work forward. Fully editable and easy to customize in PowerPoint, Keynote, and Google Slides.


7 slides
Africa Regions Map Infographic
This Africa Regions Map infographic template is a comprehensive visual tool designed to highlight key data points across the continent's diverse regions. It is versatile and easily adaptable for use in PowerPoint, Google Slides, and Keynote. The template includes various geographic layouts and data visualization elements like human figures for population representation, color-coded regions for quick reference, and icon-based markers for specific data points such as economic indicators or social statistics. Each slide is crafted to allow for clear presentation of information ranging from demographic distributions to project locations, making it an invaluable resource for educators, and organizations working with African continental data.


6 slides
Safety Equipment Infographic
Safety equipment refers to various tools, devices, and gear that are designed to protect individuals from potential hazards and accidents in various environments and situations. This infographic involves presenting essential safety equipment, their uses, and benefits. With this template you can encourage your audience to prioritize the use of appropriate safety equipment. The combination of clear text, icons, and visuals will help viewers understand the significance of safety equipment and its role in preventing accidents and injuries. Compatible with Powerpoint, Keynote, and Google Slides. Choose a color scheme that aligns with safety and caution.


5 slides
Timeline Road Infographics
Timelines are important tools for organizing and presenting information chronologically. This timeline infographic is designed to help ensure that all your tasks are completed on time, and that the project stays on track. This is perfect for identifying potential issues that may arise during a project, so that they can be addressed before they become major problems. This template consists of a road or a horizontal line, with markers or milestones placed at specific intervals. Each marker represents a significant event or achievement, and is accompanied by a short description, date or time frame.