


Features
- 6 Unique slides
- Fully editable and easy to edit in Microsoft Powerpoint, Keynote and Google Slides
- 16:9 widescreen layout
- Clean and professional designs
- Export to JPG, PDF or send by email


Do you have any questions?
Recommend


7 slides
Pyramid Analytics Infographic
Pyramid Infographics are the best way to show off your data in a visually appealing way that's easy to understand. They're fast, they're fun, and they're flexible enough to work with all sorts of data sets. This infographic template is the perfect way to bring your data to life. Designed with a hierarchical structure, the information is organized into groups of related items. This is perfect to showcase numbers, facts, and figures in an engaging way. Fully compatible with Powerpoint, Keynote, and Google Slides. This customizable template allows you to choose the color scheme, size, and orientation of the graphic, so you can pick what looks best for your presentation.


5 slides
Sustainable Fashion Infographics
Sustainable fashion, also known as eco-fashion or ethical fashion, is an approach to clothing and accessories that aims to minimize the negative environmental and social impacts of the fashion industry. These vertical templates are designed to raise awareness about sustainable practices in the fashion industry. They aim to educate viewers about the environmental and social impacts of fast fashion and highlight the importance of adopting sustainable fashion choices. The template incorporates relevant statistics and facts about the fashion industry's impact on the environment and society. Compatible with Powerpoint, Keynote, and Google Slides.


6 slides
Professional Business Plan Presentation
Make every idea count with a clean, professional presentation that helps you communicate your business strategy clearly and confidently. Ideal for showcasing goals, market insights, and performance plans, it delivers structure with style. Fully compatible with PowerPoint, Keynote, and Google Slides for easy customization and seamless presentation design.


5 slides
Global Market Trends World Map Presentation
Visualize your market insights with this sleek and professional Global Market Trends World Map slide. Designed to highlight key regional data with pinpoint accuracy, it’s ideal for presenting statistics, regional performance, or global expansion strategies. The sidebar gradient layout offers space for five categories, each linked to map locations. Fully customizable and compatible with PowerPoint, Keynote, and Google Slides.


7 slides
Environment United States Map Infographic
An Environment United States Map refers to a map that displays various environmental aspects or features across the United States. This template is a powerful tool for visualizing sustainability initiatives and environmental data across the diverse landscapes of the United States. With a combination of insightful graphics, this template enables you to present a compelling narrative about the nation's environmental efforts. This Infographic is a call to action to protect and preserve our planet, highlighting the efforts that are shaping a more sustainable and harmonious coexistence with nature.


21 slides
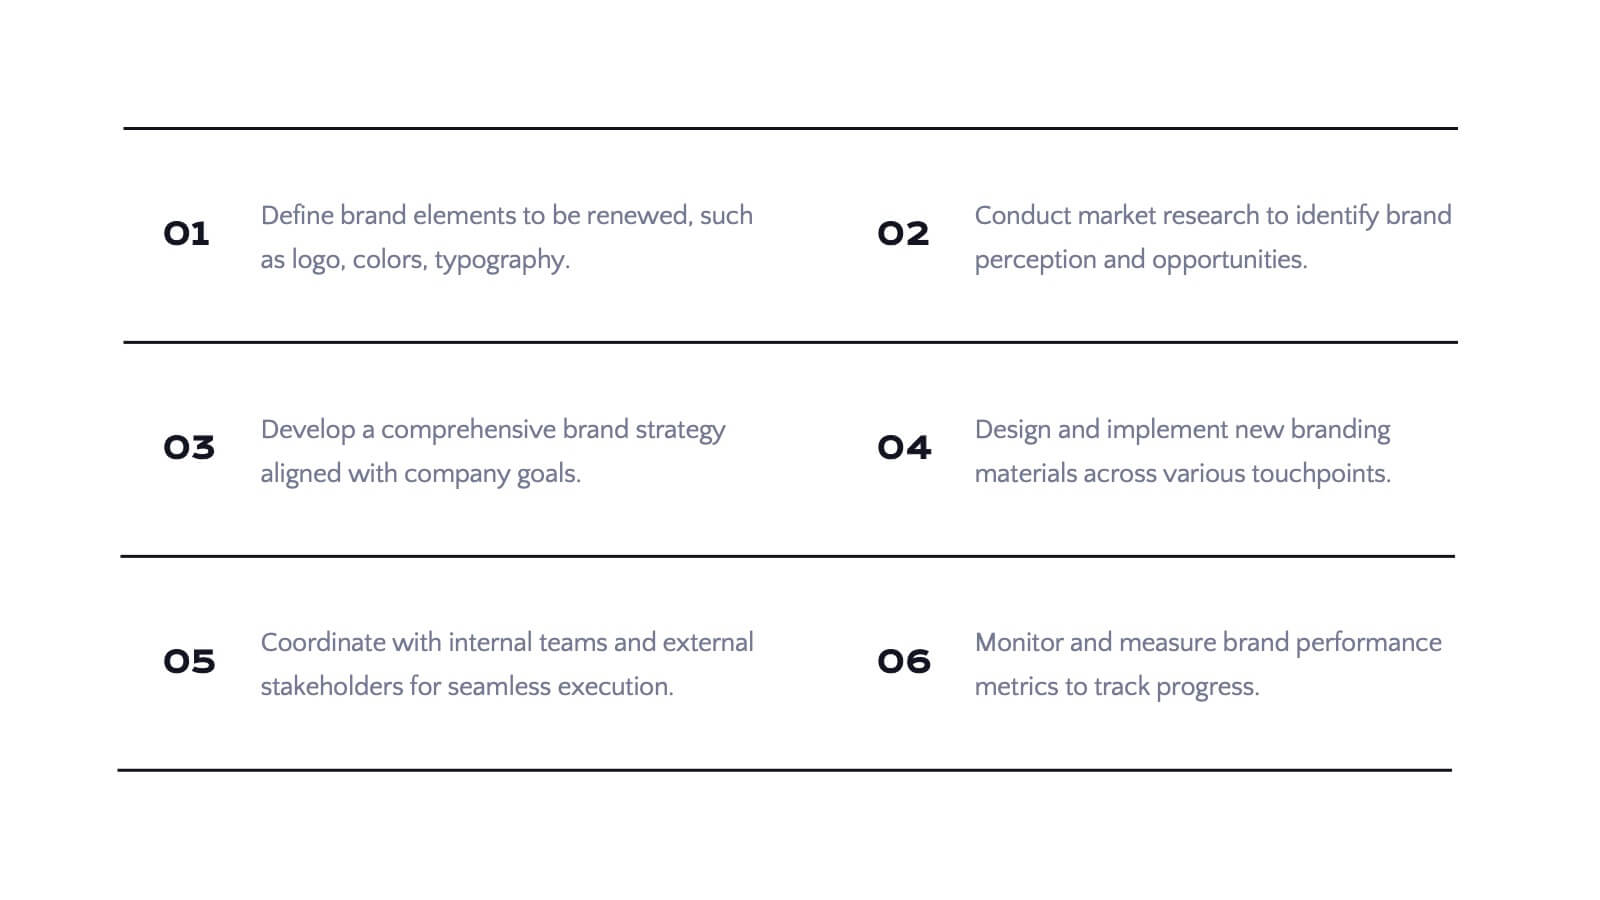
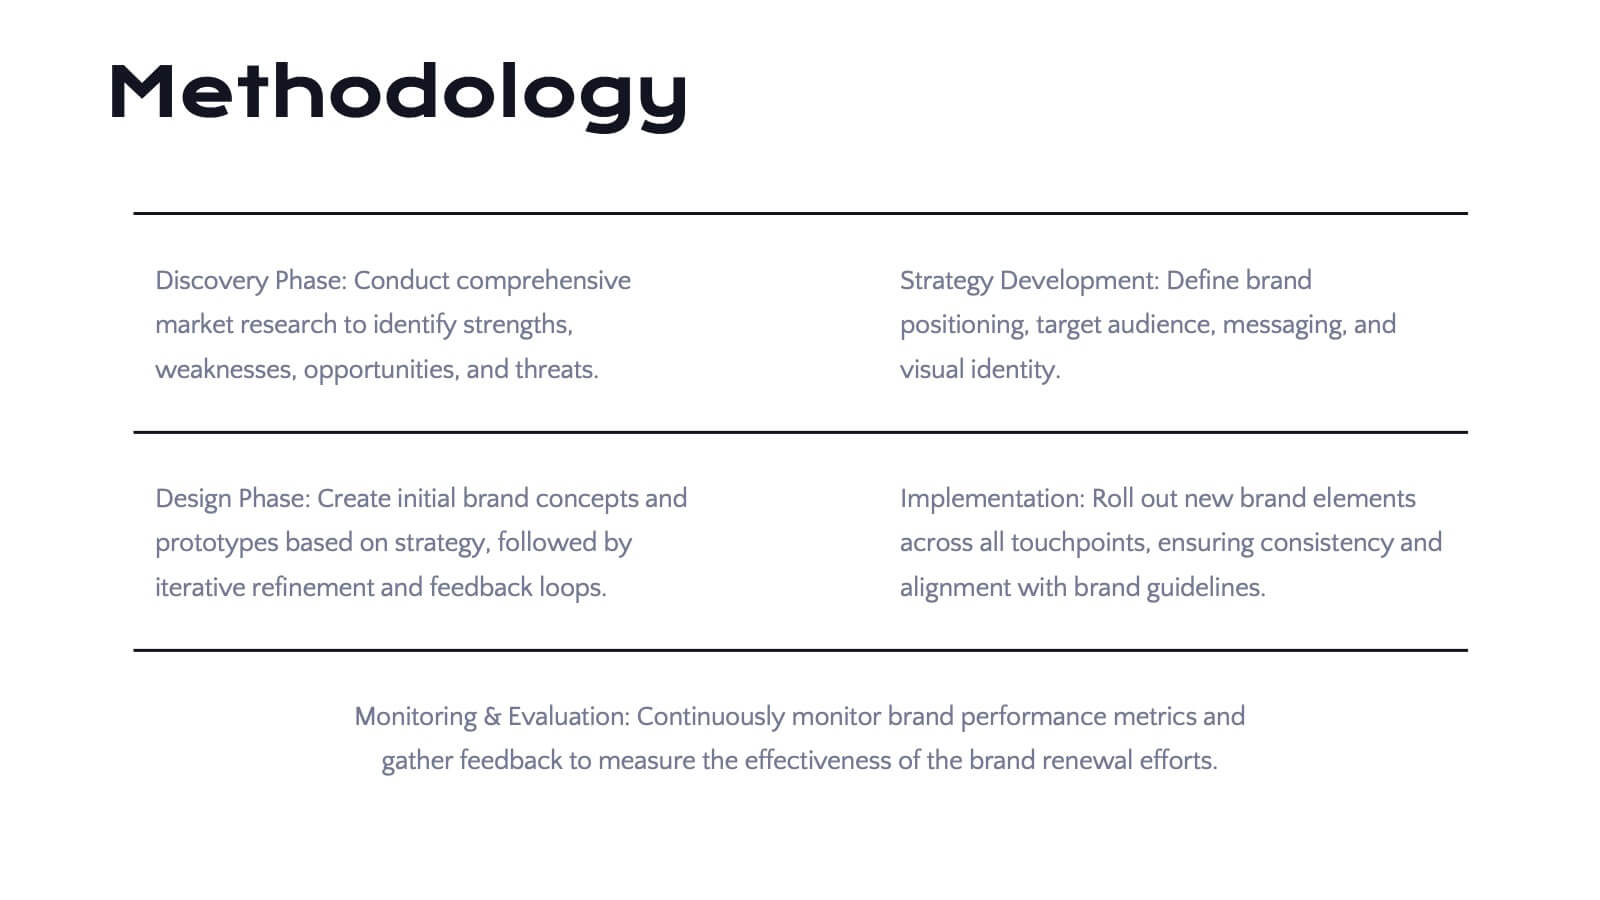
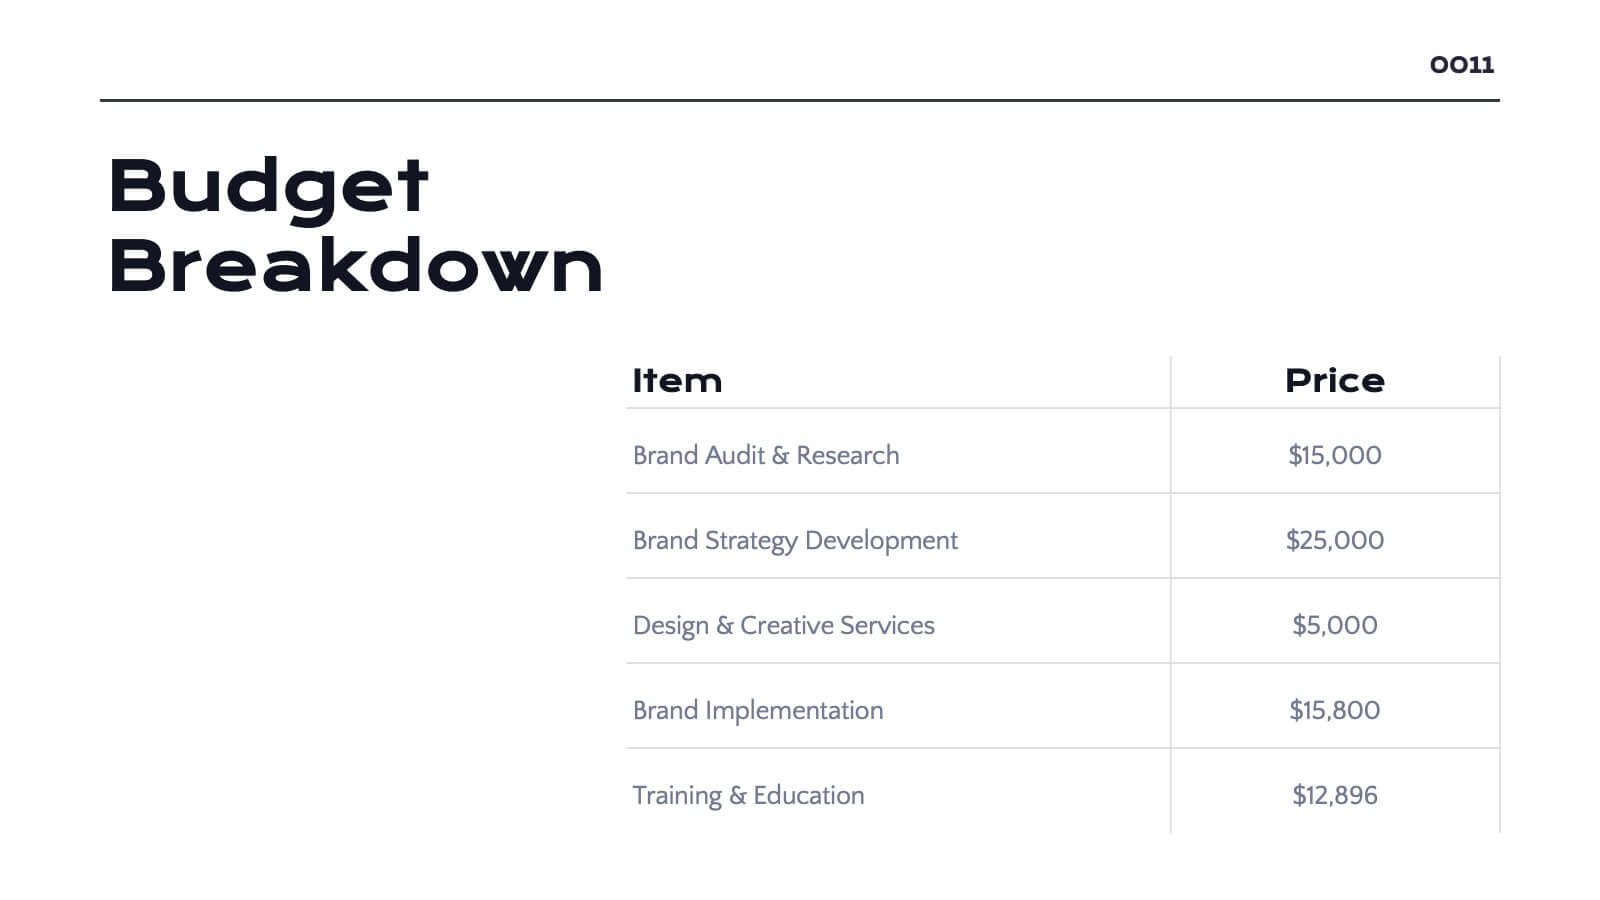
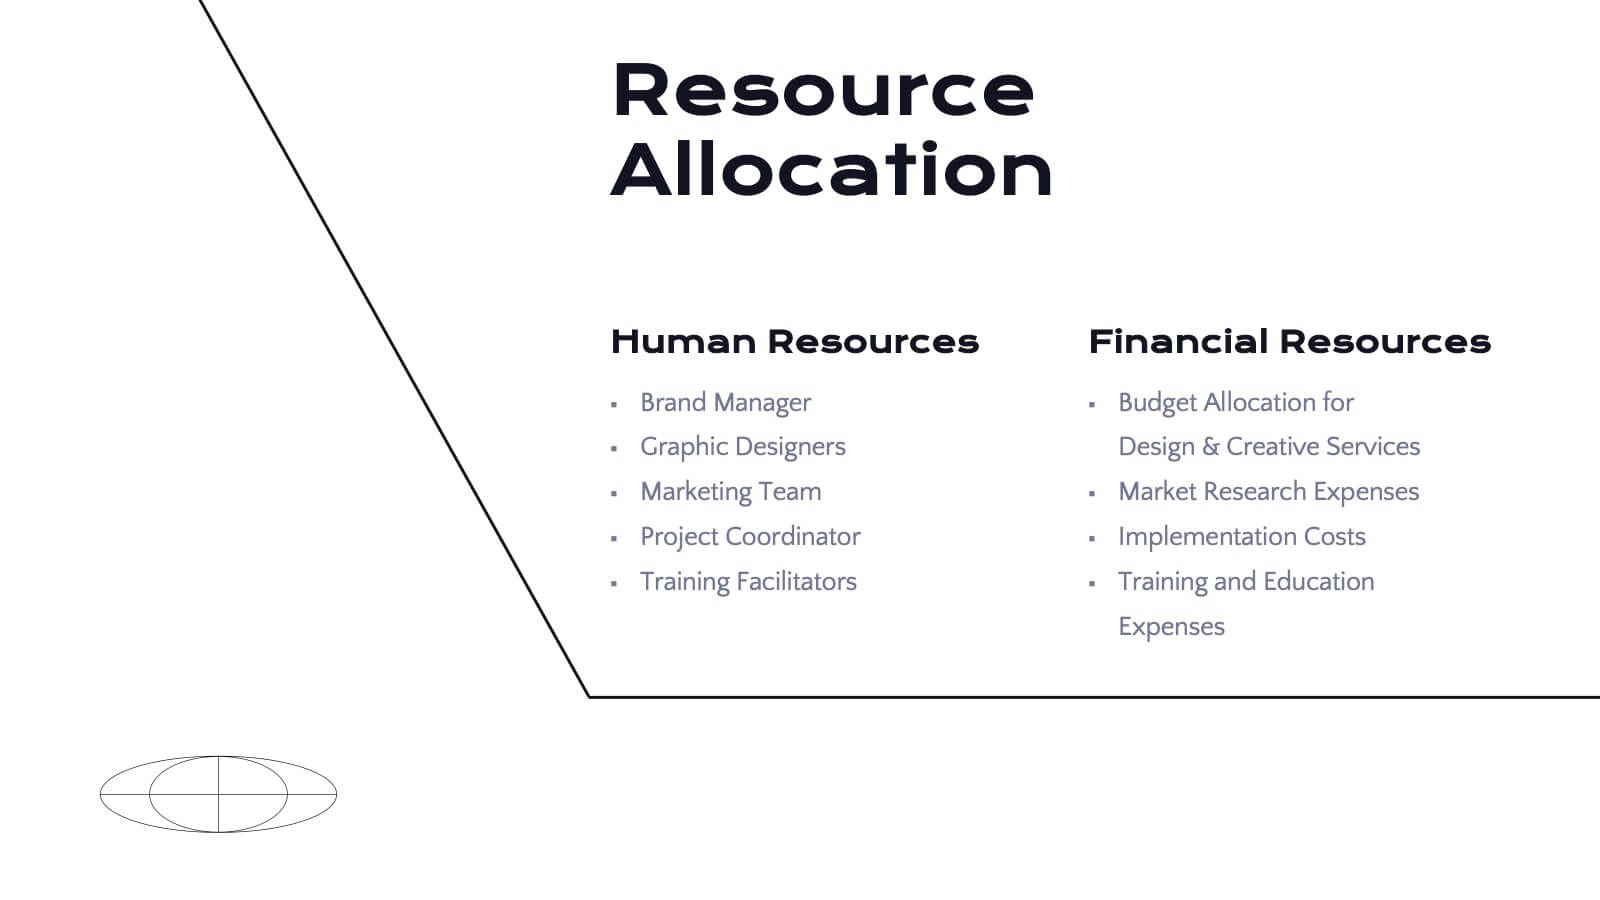
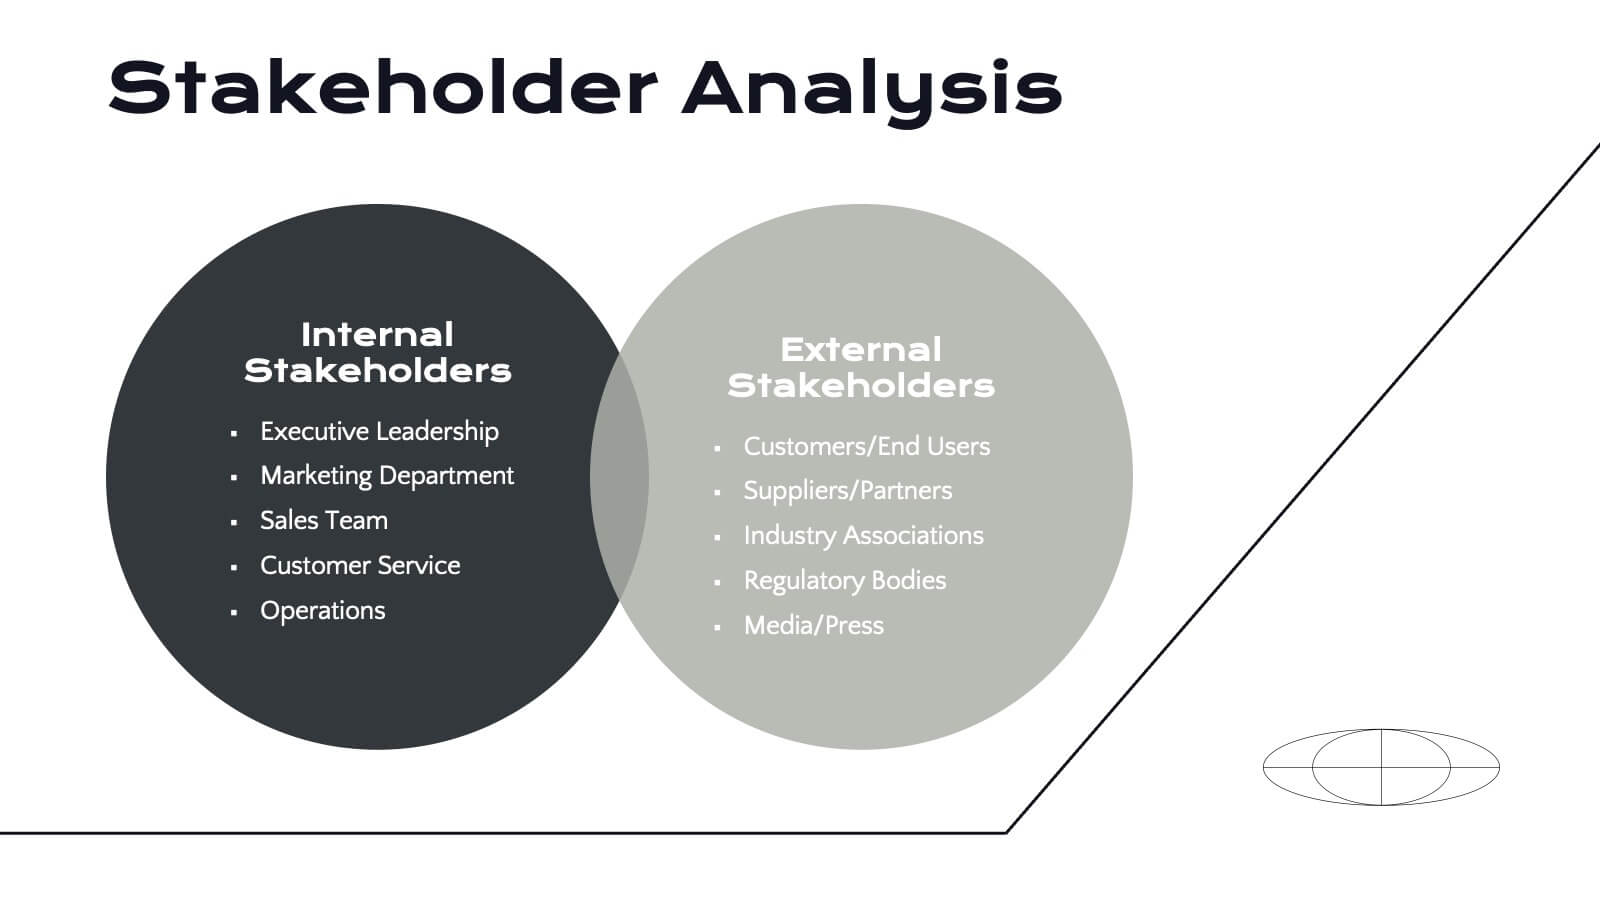
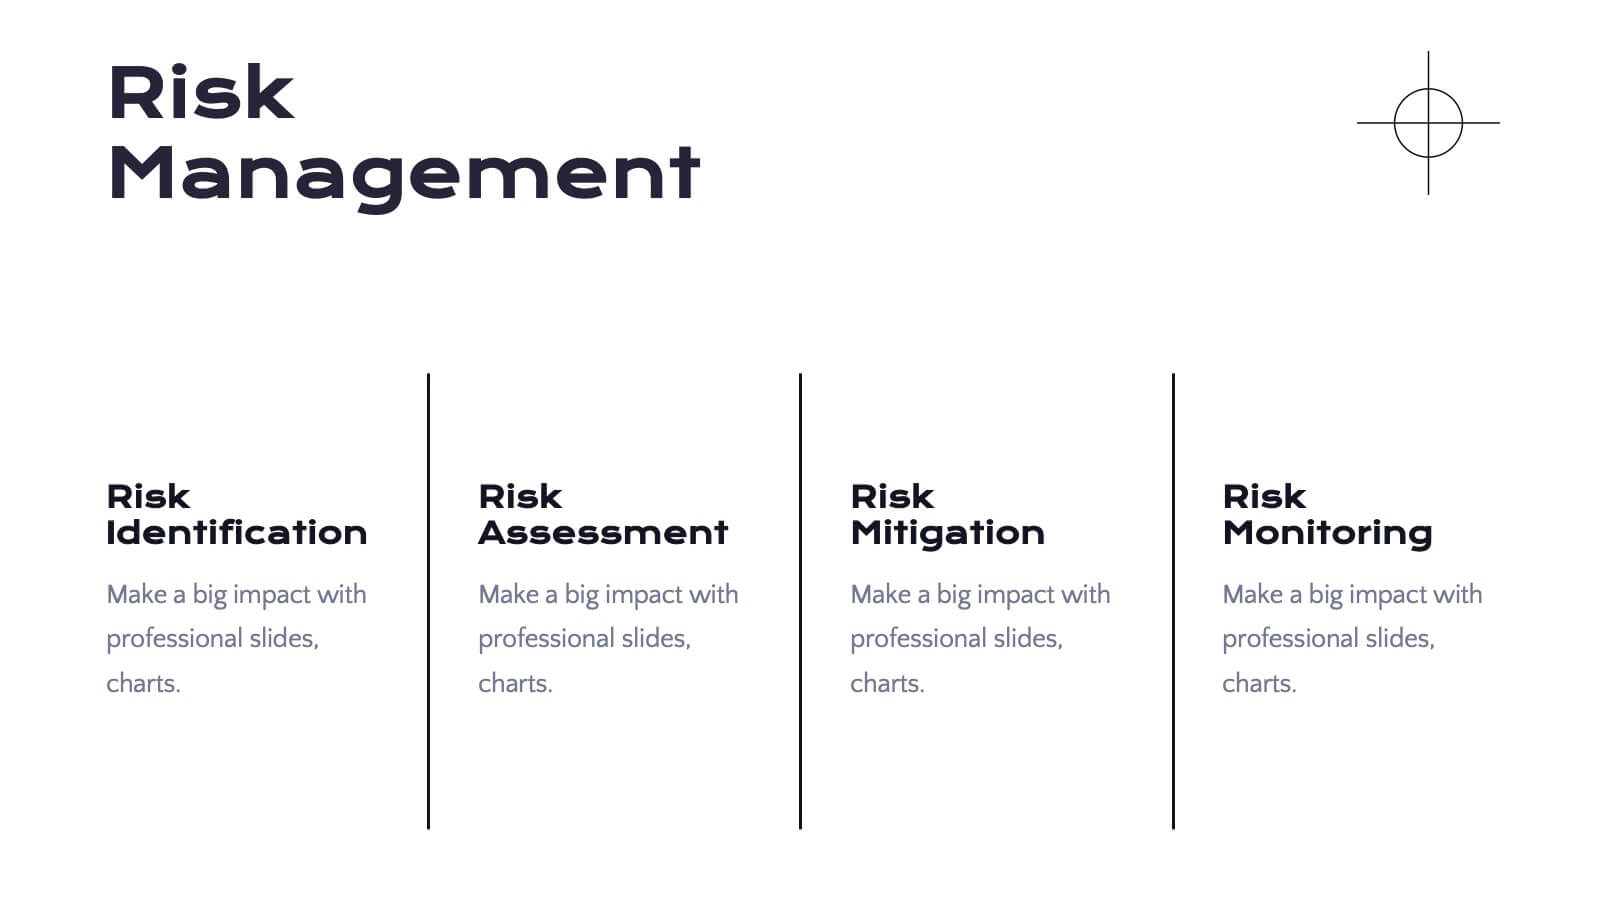
Radiance Detailed Project Execution Plan Presentation
Elevate your project execution presentations with this sleek template, covering everything from objectives to timelines and budget breakdowns. It's perfect for aligning your team and stakeholders. Compatible with PowerPoint, Keynote, and Google Slides, it ensures professionalism and clarity in showcasing your project plans.


6 slides
2-Option Comparison Chart Presentation
Make your decision-making story pop with a clean, energetic layout that clearly contrasts two paths side by side. This presentation helps you compare options, outline pros and cons, and guide audiences toward confident choices with sharp visual structure. Fully compatible with PowerPoint, Keynote, and Google Slides.


6 slides
Medical School Infographics
The "Medical School" infographic template is a meticulously curated and visually sophisticated tool, expertly tailored for PowerPoint, Keynote, and Google Slides. This template is an indispensable asset for medical educators, students, and healthcare professionals, aiming to illustrate the rigorous and multi-faceted journey of medical education. This template masterfully outlines key components of medical school, including curriculum structure, clinical rotations, research opportunities, and key milestones like exams and residencies. Its organized and detailed layout is perfect for guiding prospective students, orienting new enrollees, or showcasing medical programs during educational fairs and open houses. The design is as professional as it is educational, with a color scheme that is both serene and scholarly. This not only ensures your presentation is visually appealing but also aligns with the serious and life-changing nature of medical education. Whether it's used for orientation, academic presentations, or informational seminars, this template ensures that the journey through "Medical School" is presented in a manner that's both comprehensive and visually compelling.


7 slides
Enforcement Law Infographic Presentation
A Law Enforcement Infographic is a visual representation of key concepts, statistics, and procedures related to law enforcement. This template can be used to provide an overview of various aspects of law enforcement, such as crime rates, policing strategies, and legal procedures. This infographic includes a variety of icons, illustrations, and other design elements law themed to enhance the visual appeal and make it more appealing for your viewers. This template is compatible with Powerpoint, Keynote and Google Slides making it easy to customize and edit with your own text and information.


6 slides
Travel Insurance Infographics
Our "Travel Insurance" infographic template, compatible with PowerPoint, Keynote, and Google Slides, is crafted for insurance companies, travel agencies, and financial advisors. This template is an excellent tool for explaining the benefits and details of travel insurance to clients and customers. The template comprehensively covers vital elements such as coverage options, emergency assistance services, and claim procedures. Its clear and organized layout makes it easy to convey complex insurance information in a manner that is both accessible and engaging. This is particularly useful for presentations aimed at educating travelers about the importance and benefits of travel insurance. Designed with a bright and inviting travel-themed color scheme, the template incorporates elements that reflect global travel and security. This not only makes the presentation visually appealing but also resonates with the theme of travel and protection. Whether used in client consultations, marketing materials, or informational workshops, this template ensures that the key aspects of travel insurance are presented clearly and attractively.


7 slides
Risk Management Processes Infographic
A Risk Management infographic is a visual representation of the process of identifying, assessing, and mitigating risks in a particular context or organization. This template can be used to convey important information about potential risks and how they can be managed to minimize negative consequences and maximize positive outcomes. You can use this infographic for various purposes, such as to inform stakeholders, to guide decision-making, or to promote risk awareness and best practices. Compatible with Powerpoint, Keynote and Google Slides, this can be designed in different styles and formats.


5 slides
Consideration in Contract Law Infographics
Navigate the complexities of contract law with our consideration in contract law infographics. Crafted with a vintage aesthetic, using a palette of brown, tan, and blue, this sophisticated template radiates a classic legal ambiance. Ideal for law students, legal professionals, and educators, this collection aids in dissecting intricate contractual principles with clarity and elegance. Compatible with Powerpoint, Keynote, and Google Slides. The creative, vintage-themed design, adorned with graphics and icons, not only enriches your presentation but also serves as a compelling educational tool, transforming legal jargon into accessible information.


5 slides
Employee Benefits and Compensation Presentation
Effectively communicate your company’s value proposition with this Employee Benefits and Compensation Presentation. This clean and professional diagram highlights four key benefit categories in a circular flow, perfect for HR teams, onboarding materials, or internal strategy reviews. Easily editable in PowerPoint, Keynote, or Google Slides, it's ideal for showcasing wellness perks, bonuses, insurance, and more.


5 slides
Agile Project Roadmap Presentation
Visualize your quarterly project plans with clarity using this Agile roadmap slide. Designed with a horizontal layout for Q1 to Q4, this infographic includes three workstreams and color-coded bars to represent initiatives or sprints. Icons provide quick visual cues for different teams or objectives. Ideal for agile teams, product managers, or project leads who need a clean, editable layout. Compatible with PowerPoint, Keynote, and Google Slides.


26 slides
Real Estate Company Profile Presentation
Step into the world of real estate, where every brick tells a story and every home harbors a dream. Our warm and bold template, draped in varying shades of brown, encapsulates the essence of properties, from cozy homes to towering skyscrapers. Boasting tailored graphics, detailed icons, and versatile image placeholders, it's more than just a visual aid; it's an experience. Seamless compatibility ensures it's ready for Powerpoint, Keynote, or Google Slides. An invaluable asset for realtors, property managers, housing agencies, or anyone looking to make an impact in the real estate market. Present with confidence; let every property shine.


5 slides
Iceberg Chart Template Infographics
Navigate the depths beneath the surface with the iceberg chart template infographics. This resource, bathed in varying shades of blue, captures the essence of uncovering hidden data, much like an iceberg reveals only a fraction of its mass above water. Professionals across diverse sectors, including business analysts and educators, will find value in this creative, ice-themed vertical template. It's especially beneficial for presentations aiming to explore beneath-the-surface dynamics, or unseen risks. The template is complete with customizable graphics, icons, and image placeholders, structured to visually break down complex concepts into digestible information.


4 slides
Wheel of Progress Planning Tool Presentation
Visualize goals, track development stages, or outline key initiatives with the Wheel of Progress Planning Tool Presentation. This dynamic circular design divides progress into four customizable quadrants (A–D), perfect for strategic planning, KPI tracking, or team milestone updates. Each segment features editable labels and supporting descriptions. Ideal for PowerPoint, Keynote, and Google Slides.