


Features
- 2 Unique slides
- Fully editable and easy to edit in Microsoft Powerpoint, Keynote and Google Slides
- 16:9 widescreen layout
- Clean and professional designs
- Export to JPG, PDF or send by email


Do you have any questions?
Recommend


20 slides
Chordstream Professional Portfolio Showcase Presentation
The Portfolio Presentation Template offers a modern and creative design, perfect for showcasing your projects, philosophy, and services. With 20 customizable slides, it includes sections for project highlights, pricing, client testimonials, and contact information. Compatible with PowerPoint, Keynote, and Google Slides, this template ensures professional impact for creatives.


5 slides
K–12 School Planning and Curriculum Map Presentation
Visualize your school year with the K–12 School Planning and Curriculum Map Presentation. Designed for academic teams and administrators, this circular diagram helps outline yearly goals, subject milestones, or grade-level plans in five clear segments. Fully editable in PowerPoint, Keynote, Google Slides, and Canva for total customization.


4 slides
Fishbone Diagram for Root Cause Analysis
Dive into the source of any problem—literally. This fishbone diagram template offers a smart and visual way to map out causes leading to a business issue, helping teams brainstorm solutions effectively. Ideal for workshops, meetings, and audits. Easily editable in PowerPoint, Keynote, and Google Slides.


5 slides
Pricing Structure and Cost Allocation Presentation
Show stakeholders how every dollar works with this colorful arc-style financial slide. Explain product tiers, service fees, or project budgets in clear segments that highlight what matters most. Ideal for finance updates, sales decks, or board reviews, and fully compatible with PowerPoint, Keynote, and Google Slides for seamless team collaboration.


5 slides
Product Marketing Slide Presentation
Spark interest instantly with a bold, circular layout that transforms product insights into a clean, memorable story. This presentation helps you explain features, audience needs, and value propositions in an organized, visual flow that keeps attention on what matters most. Fully customizable for PowerPoint, Keynote, and Google Slides.


26 slides
E-commerce Presentation
Venture into the digital marketplace with a presentation template that embodies the innovative spirit of e-commerce. This template, with its vibrant colors and modern design elements, is tailored to highlight the fast-paced world of online retail. The slides offer a digital storefront for your ideas, from introducing the creative minds behind the operation to showcasing the latest trends in online shopping. Utilize engaging layouts to compare products, outline sales strategies, or highlight consumer behavior with clear, concise infographics. With promotional slide options to announce special deals and a design that captures the convenience and excitement of shopping with a click, this collection is an essential tool for marketers, online retailers, and startups. It’s optimized for conveying complex data in a user-friendly format, ensuring your audience stays engaged and informed. Compatible with PowerPoint, Keynote, and Google Slides, it’s the perfect cart to carry your message in the bustling online marketplace.


20 slides
Emerald Sales Forecast Presentation
Shine bright with this emerald-inspired presentation, perfect for sharing your sales forecast! Designed to showcase revenue projections, market trends, and sales strategies, this template keeps your data organized and visually impactful. Its vibrant, clean design ensures your forecast captures attention. Compatible with PowerPoint, Keynote, and Google Slides.


6 slides
Risk Prevention and Security Measures Presentation
Enhance your safety strategy with this professional infographic slide. Designed to highlight five key risk and security areas, it features a clean, diamond layout with icon-based callouts. Ideal for business continuity plans, risk assessments, or compliance reports. Fully editable in PowerPoint, Keynote, and Google Slides.


7 slides
Root Cause Model Infographic
Unlock problem-solving efficiency with our Root Cause Analysis Model Infographic, designed for process engineers, quality assurance teams, and business managers. This infographic is a strategic tool to dissect complex issues and identify underlying causes of operational challenges. Our infographic outlines a step-by-step methodology to trace problems back to their fundamental causes, using visual diagrams to map out cause-and-effect relationships. It's crafted to facilitate a thorough examination of processes, systems, and outcomes, promoting a deep understanding of business issues. Customizable elements allow you to detail specific causes, impacts, and the interplay between different contributing factors. This SEO-optimized infographic is designed to be an accessible resource for professionals dedicated to continuous improvement and corrective action planning. Employ this infographic to guide your team through root cause analysis, fostering a culture of proactive problem-solving and sustainable solutions within your organization.


5 slides
Process Improvement Cycle Mapping Presentation
Illustrate continuous growth and optimization with this modern process improvement cycle template. Featuring a dynamic circular flow design, it’s ideal for showcasing iterative strategies, workflow enhancements, or business development stages. Fully editable in Canva, PowerPoint, and Google Slides, it ensures clarity and professionalism in mapping each step toward better performance.


5 slides
Business Organizational Structure Presentation
Showcase your Business Organizational Structure with this modern and professional infographic template. Designed to visually represent company hierarchy, this slide enhances clarity in roles, team relationships, and reporting structures. Fully customizable in PowerPoint, Keynote, and Google Slides, making it perfect for corporate strategy presentations, HR reports, and leadership meetings.


7 slides
Business Credit Card Infographic
Navigating business credit cards can seem overwhelming, but with our vibrant infographic, it becomes effortless. Drenched in playful pinks and dynamic colors, this tool is more than just eye-catching—it's a roadmap to the intricate realm of corporate credit. Tailored for everyone from financial educators to seasoned business owners, this infographic offers a clear, concise breakdown of business card essentials, benefits, and best practices. Whether you're presenting, learning, or simply seeking clarity, this resource promises invaluable insights with a dash of flair. Dive in and demystify the world of business credit cards with us!
25 slides
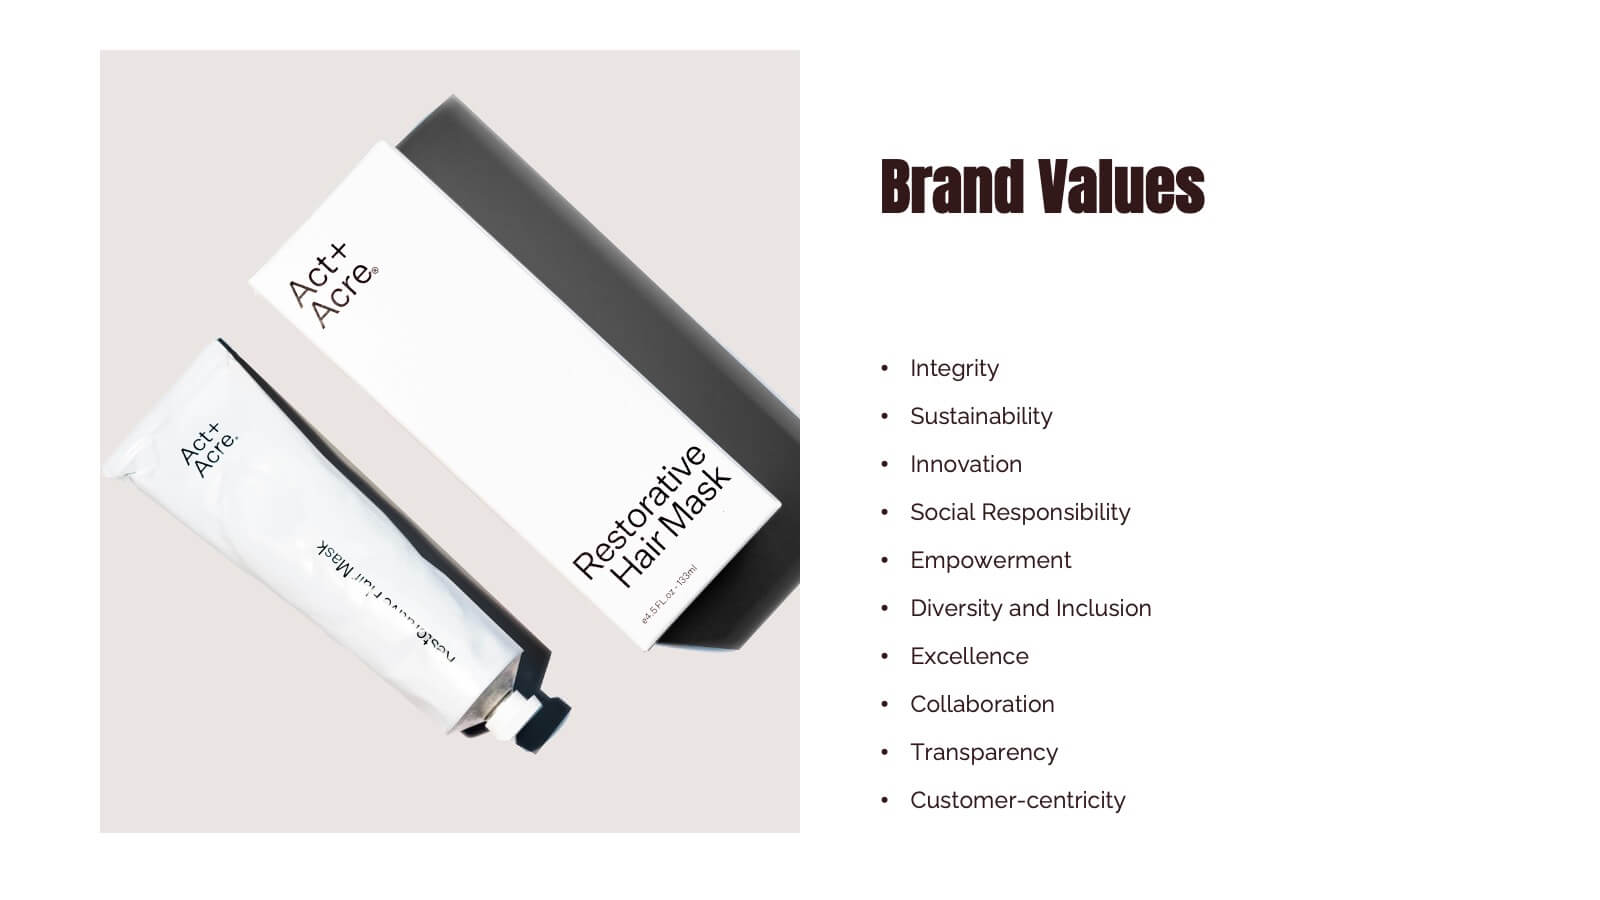
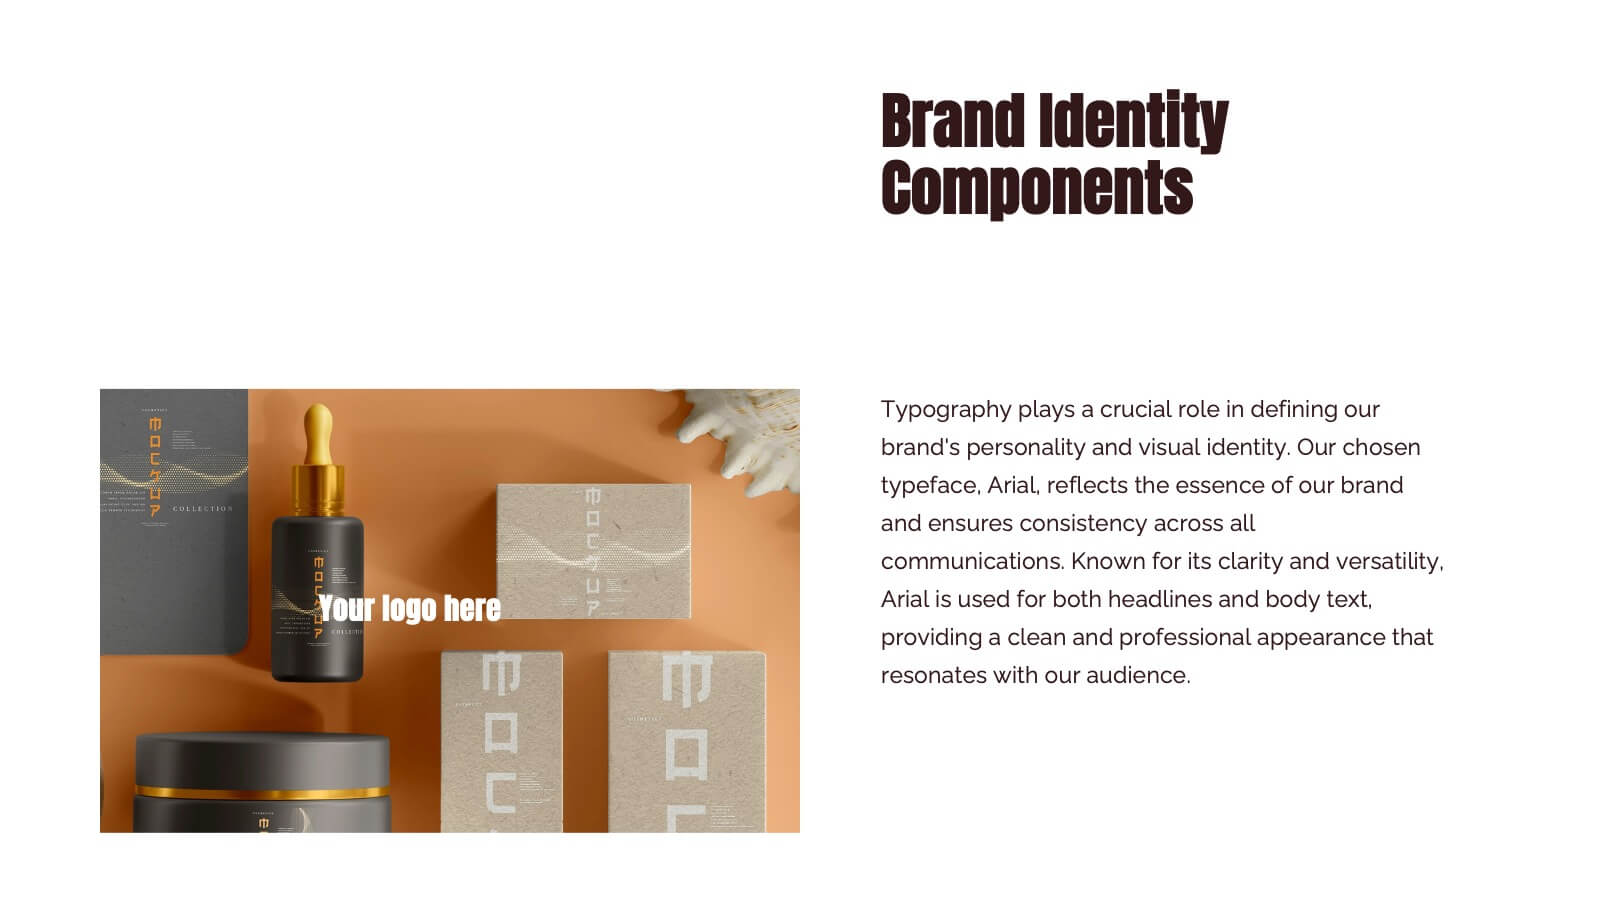
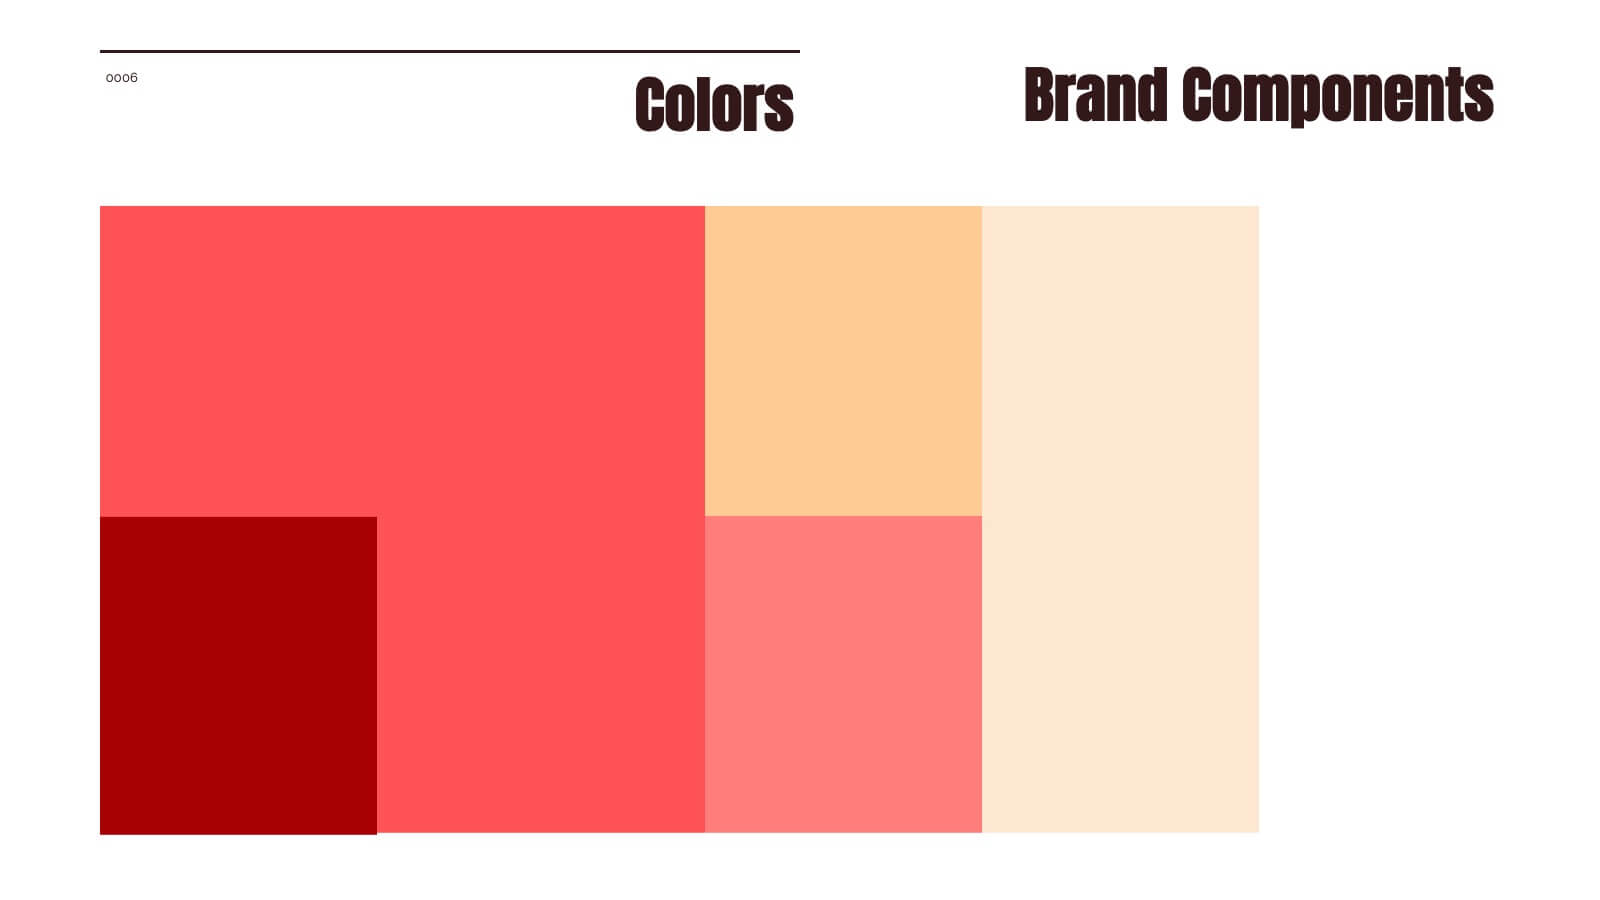
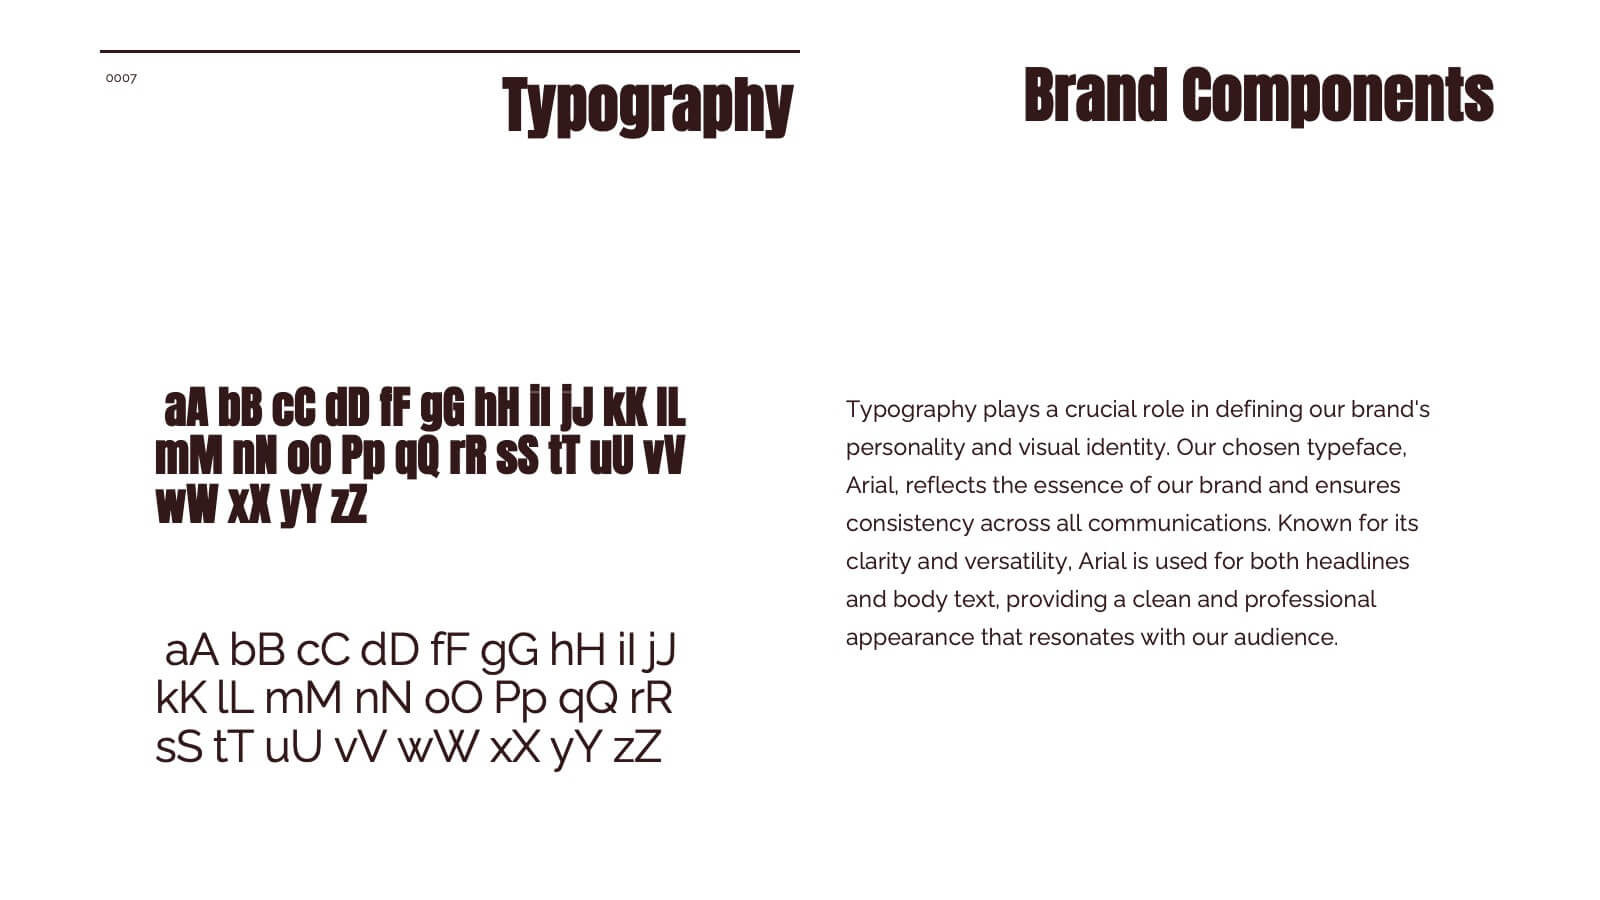
Blaze Brand Identity Presentation
Ignite your brand's potential with this vibrant, blaze-inspired presentation! Ideal for showcasing your brand identity, this template highlights key elements like logo design, color palette, and brand messaging with bold visuals and a modern layout. Perfect for making your brand stand out. Compatible with PowerPoint, Keynote, and Google Slides.


5 slides
Enterprise IT System Design
Visualize the core components of your IT infrastructure with this centralized cloud-style diagram. Perfect for mapping enterprise systems, network architectures, and data flows, each slide allows you to highlight up to five integrated elements in a clean, modern layout. Fully editable in PowerPoint, Keynote, and Google Slides.


6 slides
Business Ethics and Governance Presentation
Navigate the complexities of ethical decision-making with our Business Ethics and Governance Presentation template. This visually engaging tool highlights key aspects of corporate ethics and governance, ideal for workshops and training sessions. Compatible with PowerPoint, Keynote, and Google Slides, it's designed to facilitate clear and effective discussions.


6 slides
Onboarding 30-60-90 Day Roadmap Presentation
Get your team excited from day one with this colorful, easy-to-follow visual layout! This presentation template helps clearly map out onboarding goals and key activities across 30, 60, and 90 days. Perfect for HR professionals and team leads, it's fully editable and works with PowerPoint, Keynote, and Google Slides.


6 slides
Best Solution Proposal Presentation
Present your ideas with clarity and confidence using this modern, structured layout that highlights problems, opportunities, and proposed solutions step by step. Ideal for showcasing strategies or business improvements, it keeps information organized and persuasive. Fully compatible with PowerPoint, Keynote, and Google Slides for effortless customization and presentation.