


Features
- 2 Unique slides
- Fully editable and easy to edit in Microsoft Powerpoint, Keynote and Google Slides
- 16:9 widescreen layout
- Clean and professional designs
- Export to JPG, PDF or send by email


Do you have any questions?
Recommend


7 slides
Porter's Five Forces Infographics Presentation Template
Porter's Five Forces model is a framework for analyzing the competitive environment of an industry. The five forces are: threat of new entrants, bargaining power of suppliers, bargaining power of buyers, threat of substitute products or services, and rivalry among existing competitors. By using this template to analyze these five forces, you can gain a better understanding of the industry's environment and make more strategic decisions. Use this template to help your business analyze. This will help you make a great presentation evaluating the potential profitability of entering a new market.


20 slides
Wonderis Design Proposal Presentation
Deliver an impeccable pitch with this minimalistic and professional design proposal template. Crafted for designers, agencies, and creative professionals, this presentation allows you to seamlessly showcase your expertise, methodology, and deliverables. Walk your audience through a polished narrative that includes a project summary, proposed solutions, objectives, methodology, and timeline. Highlight your expertise with dedicated slides for team introductions, budget breakdowns, and pricing structures. Ensure confidence with risk mitigation strategies, references, and clear next steps to solidify trust in your approach. This template is fully editable and works flawlessly with PowerPoint, Google Slides, and Keynote, providing the flexibility you need to tailor your proposal to specific client needs. Perfect for client pitches, project proposals, and business presentations that need a sophisticated and concise design.


6 slides
School Goals and Administration Presentation
Visualize key academic priorities with this notebook-style layout, perfect for school administrators and teachers. Featuring colorful pushpin markers and a two-page spread, this template is great for outlining goals, responsibilities, or class guidelines. Fully editable in PowerPoint, Keynote, and Google Slides for customized, classroom-ready presentations.


8 slides
Financial Growth Planning Presentation
Plan and track financial success with this Financial Growth Planning template. This visually engaging slide features a stepwise roadmap with hexagonal icons, helping you outline budgeting, investments, and financial milestones in a clear and structured format. Perfect for financial analysts, business strategists, and executives, this slide is fully editable and compatible with PowerPoint, Keynote, and Google Slides.


10 slides
Search Engine Optimization (SEO) Strategy Presentation
Present your digital marketing plan with clarity using this vibrant SEO strategy layout. Featuring a magnifying glass infographic at the center and five segmented areas for key actions, this template is ideal for mapping keyword research, on-page optimization, content creation, link building, and performance tracking. Great for marketing agencies, SEO consultants, and website owners. Fully editable in PowerPoint, Keynote, and Google Slides.


20 slides
Unity Sales Proposal Presentation
Boost your sales strategy with this comprehensive sales proposal template! Perfect for outlining objectives, processes, and customer value propositions. Ideal for sales teams aiming to close deals and impress clients. Compatible with PowerPoint, Keynote, and Google Slides, this template ensures your sales presentations are clear, persuasive, and professional. Drive your sales success today!


6 slides
Asia Market Map Infographic
Asia is the largest and most populous continent on Earth, covering a vast area that includes diverse landscapes, cultures, and countries. This map infographic displays the countries, capitals, major cities, rivers, mountain ranges, and other Asia geographical features. This template can be used for various purposes, such as market research presentations, business reports, and marketing materials. This template showcases the business and economic landscape in the Asian market. This provides valuable insights into the economic landscape of various Asian countries and help businesses make informed decisions for market expansion and opportunities in the region.


21 slides
Stellar Content Marketing Pitch Deck Presentation
The Stellar Marketing Pitch Deck template is designed to make your marketing strategies shine like never before! This template is perfect for showcasing your business's potential and engaging your audience with sleek, modern designs that capture attention. Start with a powerful introduction, leading into an in-depth industry overview that highlights key trends and consumer behaviors. With dedicated sections for emerging technologies, content marketing trends, and data-driven marketing, you'll have everything you need to present your innovative approach. The template also includes slides for social media strategies, influencer marketing, and SEO trends, ensuring you're covering all the bases. Personalization trends and video marketing evolution are featured to show your forward-thinking approach, while the customer experience focus slide emphasizes your commitment to quality. Finish strong with insights into e-commerce trends, brand storytelling, and sustainability in marketing. This template is fully compatible with PowerPoint, Keynote, and Google Slides, making it versatile and easy to use for any marketing presentation.


4 slides
Sustainability Report Slide Deck Presentation
Bring your sustainability story to life with a bright, modern layout that turns complex environmental data into a clear visual narrative. This presentation helps you outline key initiatives, performance metrics, and long-term goals in a clean, structured format. Fully editable and compatible with PowerPoint, Keynote, and Google Slides.


4 slides
Risk Assessments Matrix Presentation
Bring clarity to complex decisions with this bold, color-coded layout designed to pinpoint threats, compare impact levels, and communicate risks with confidence. This presentation makes evaluation simple, structured, and visually clear for any audience. Fully editable and ready for professional use. Compatible with PowerPoint, Keynote, and Google Slides.


8 slides
Organizational Maturity and Scaling Model Presentation
Visualize growth with the Organizational Maturity and Scaling Model Presentation. This slide design illustrates progress across four strategic phases using vertical bars and icons—ideal for showcasing business development, capability building, or team evolution. Clean, professional, and fully editable in PowerPoint, Keynote, Google Slides, and Canva.


5 slides
Personal SWOT Infographics
Embark on a journey of self-discovery and professional development with our personal SWOT infographics template. Rendered in a palette that combines the tranquility of blue, the growth associated with green, and the innovative spirit of purple, this resource is a catalyst for introspection. Whether you're a career coach or individual standing at a crossroads, these vertical, creatively informative graphics illuminate strengths, weaknesses, opportunities, and threats in a visually compelling spectrum. Compatible with Powerpoint, Keynote, and Google Slides. The inclusion of intuitive icons and adaptable image placeholders simplifies complex introspection.


6 slides
Multiple Business Solutions Options Slide Presentation
Explore diverse strategies with the Multiple Business Solutions Options Slide Presentation. Featuring a vertical stack of labeled briefcases (A–F), this slide is designed to compare and communicate multiple business ideas, solutions, or pathways in a clear, structured layout. Ideal for pitching product variations, workflow choices, or market entry tactics. Each option is paired with customizable text fields for added clarity. Compatible with PowerPoint, Keynote, and Google Slides for easy editing and integration into your existing decks.


5 slides
Environment Preservation Infographics
Environment preservation refers to the protection, conservation, and sustainable management of natural resources and ecosystems to maintain their integrity and ensure their long-term viability. These vertical infographics are designed to raise awareness about the current environmental challenges and inspire individuals and communities to take action to protect and conserve the environment. It can be used in presentations, workshops, educational campaigns, and sustainability initiatives to inspire individuals, organizations, and communities to take steps towards a more sustainable and resilient future. Compatible with Powerpoint, Keynote, and google Slides.


23 slides
Journey Product Roadmap Presentation
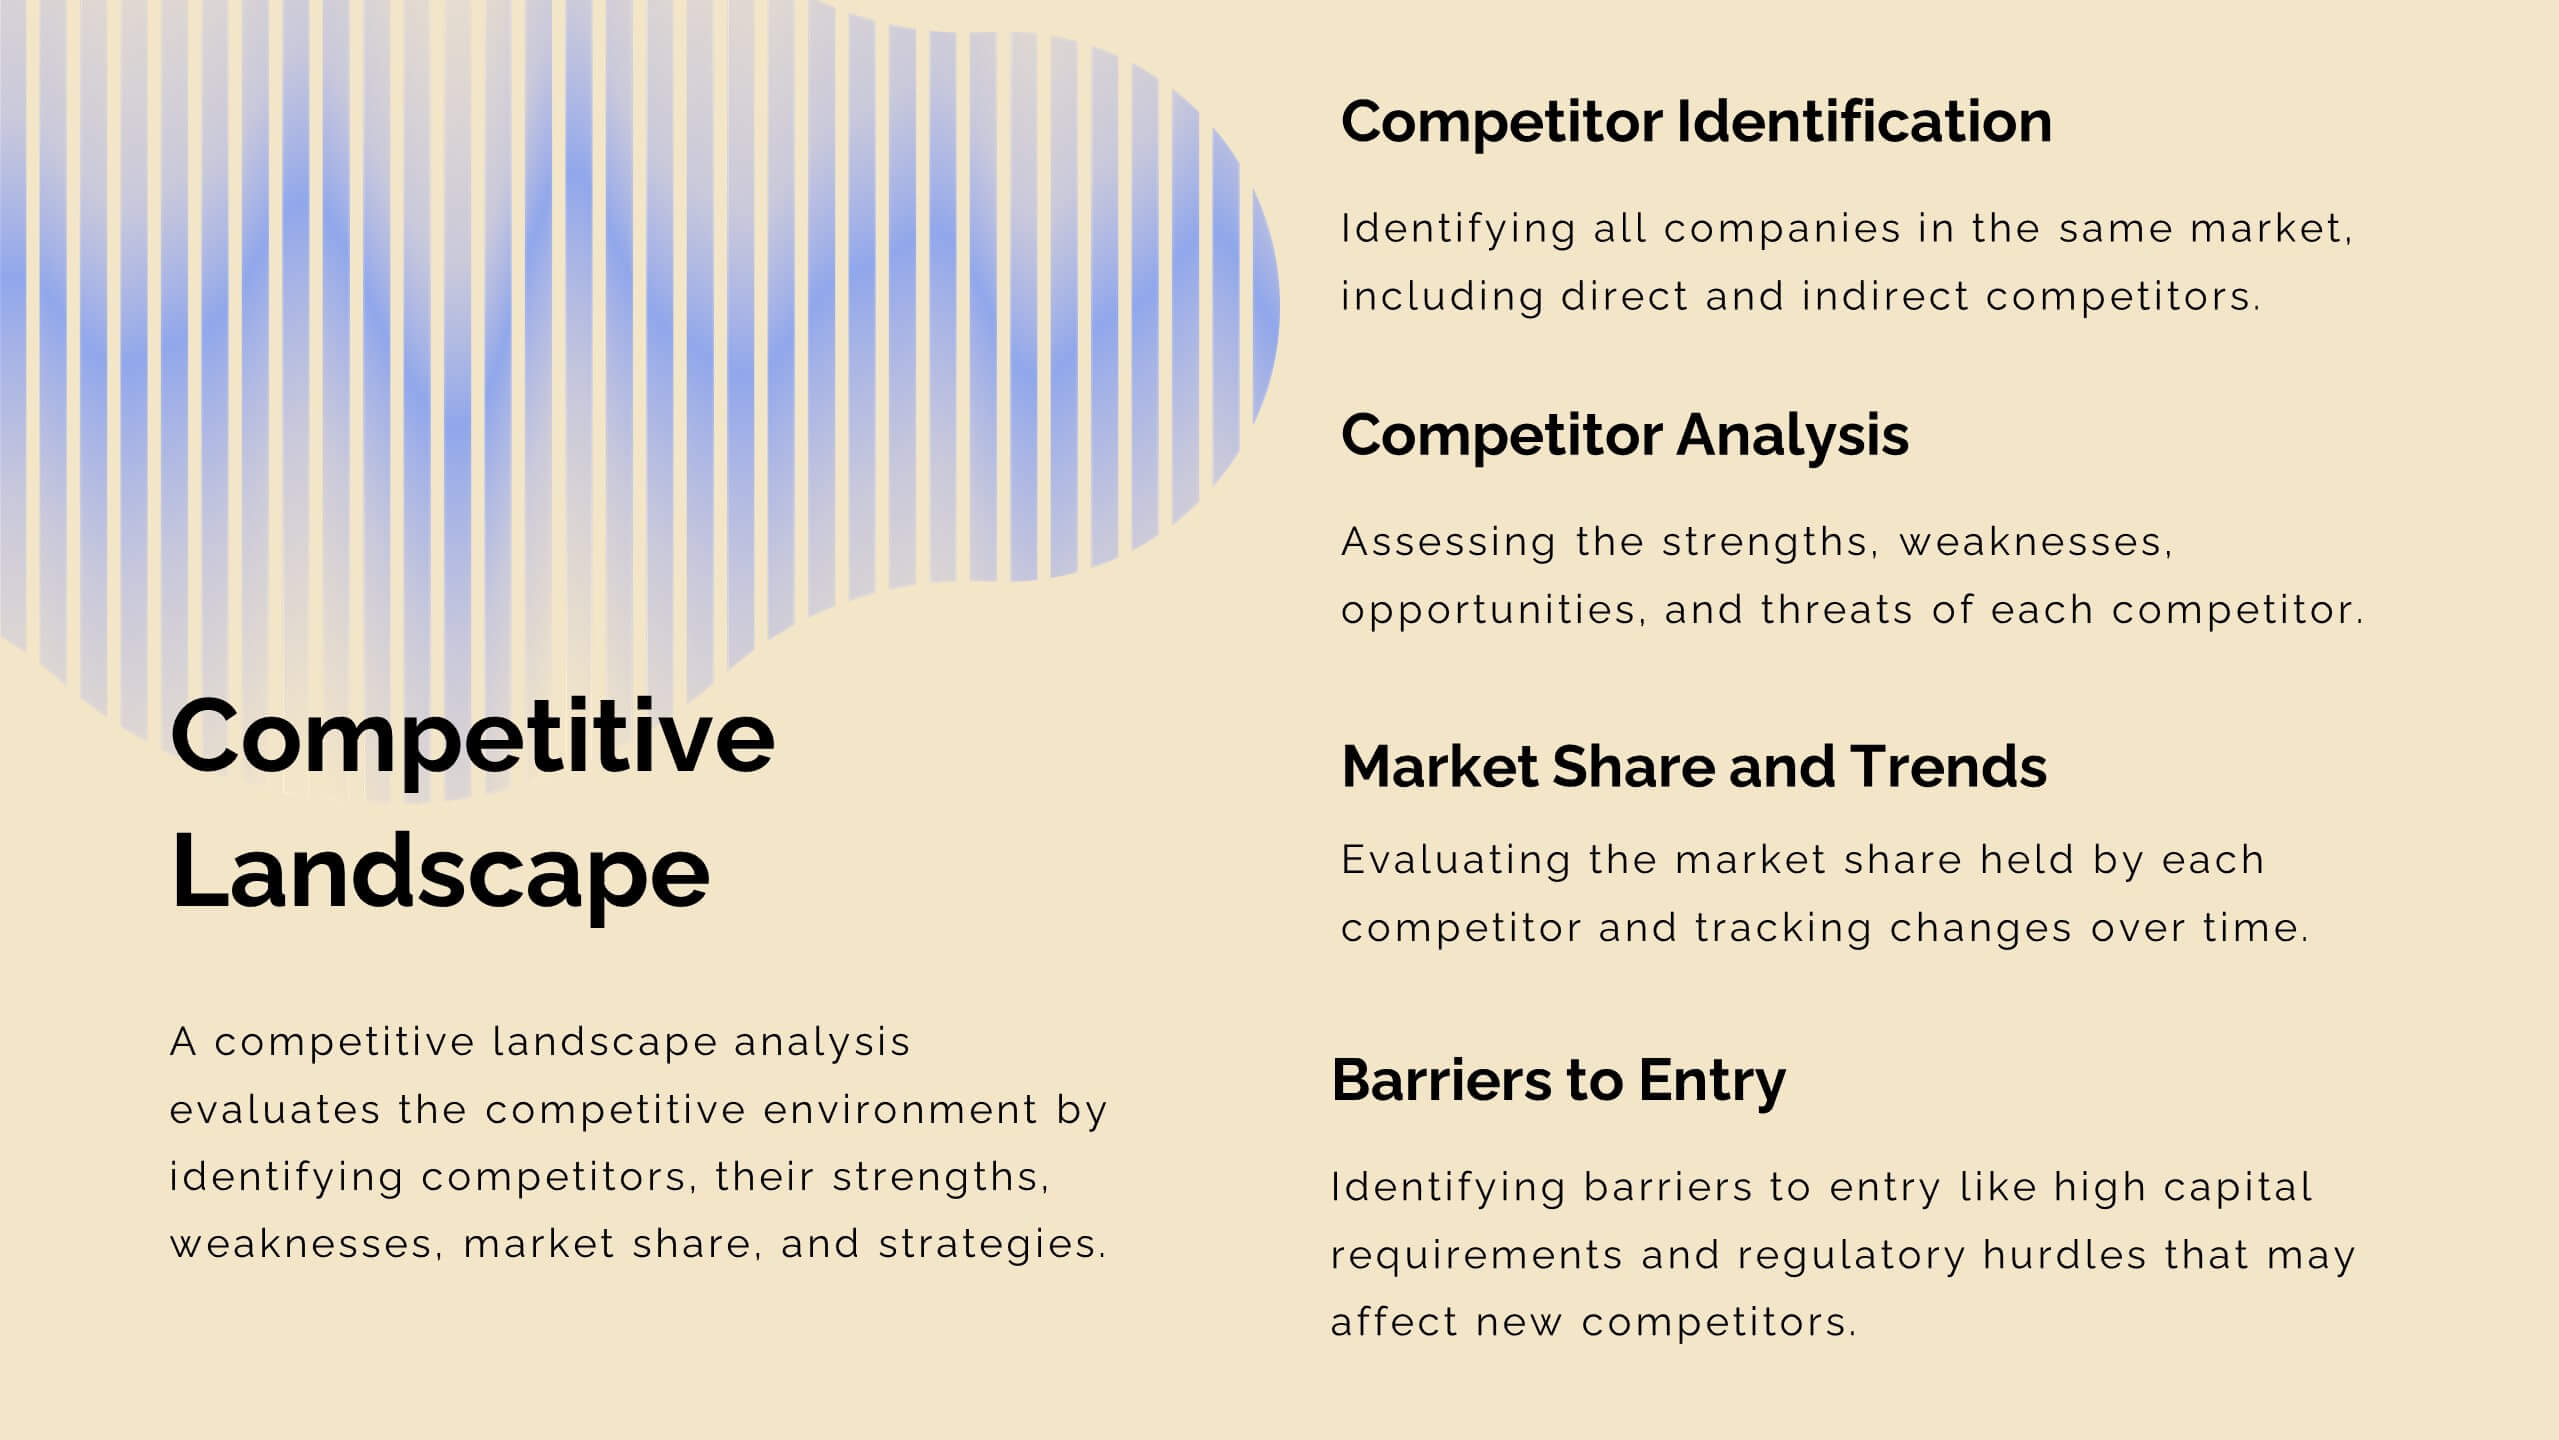
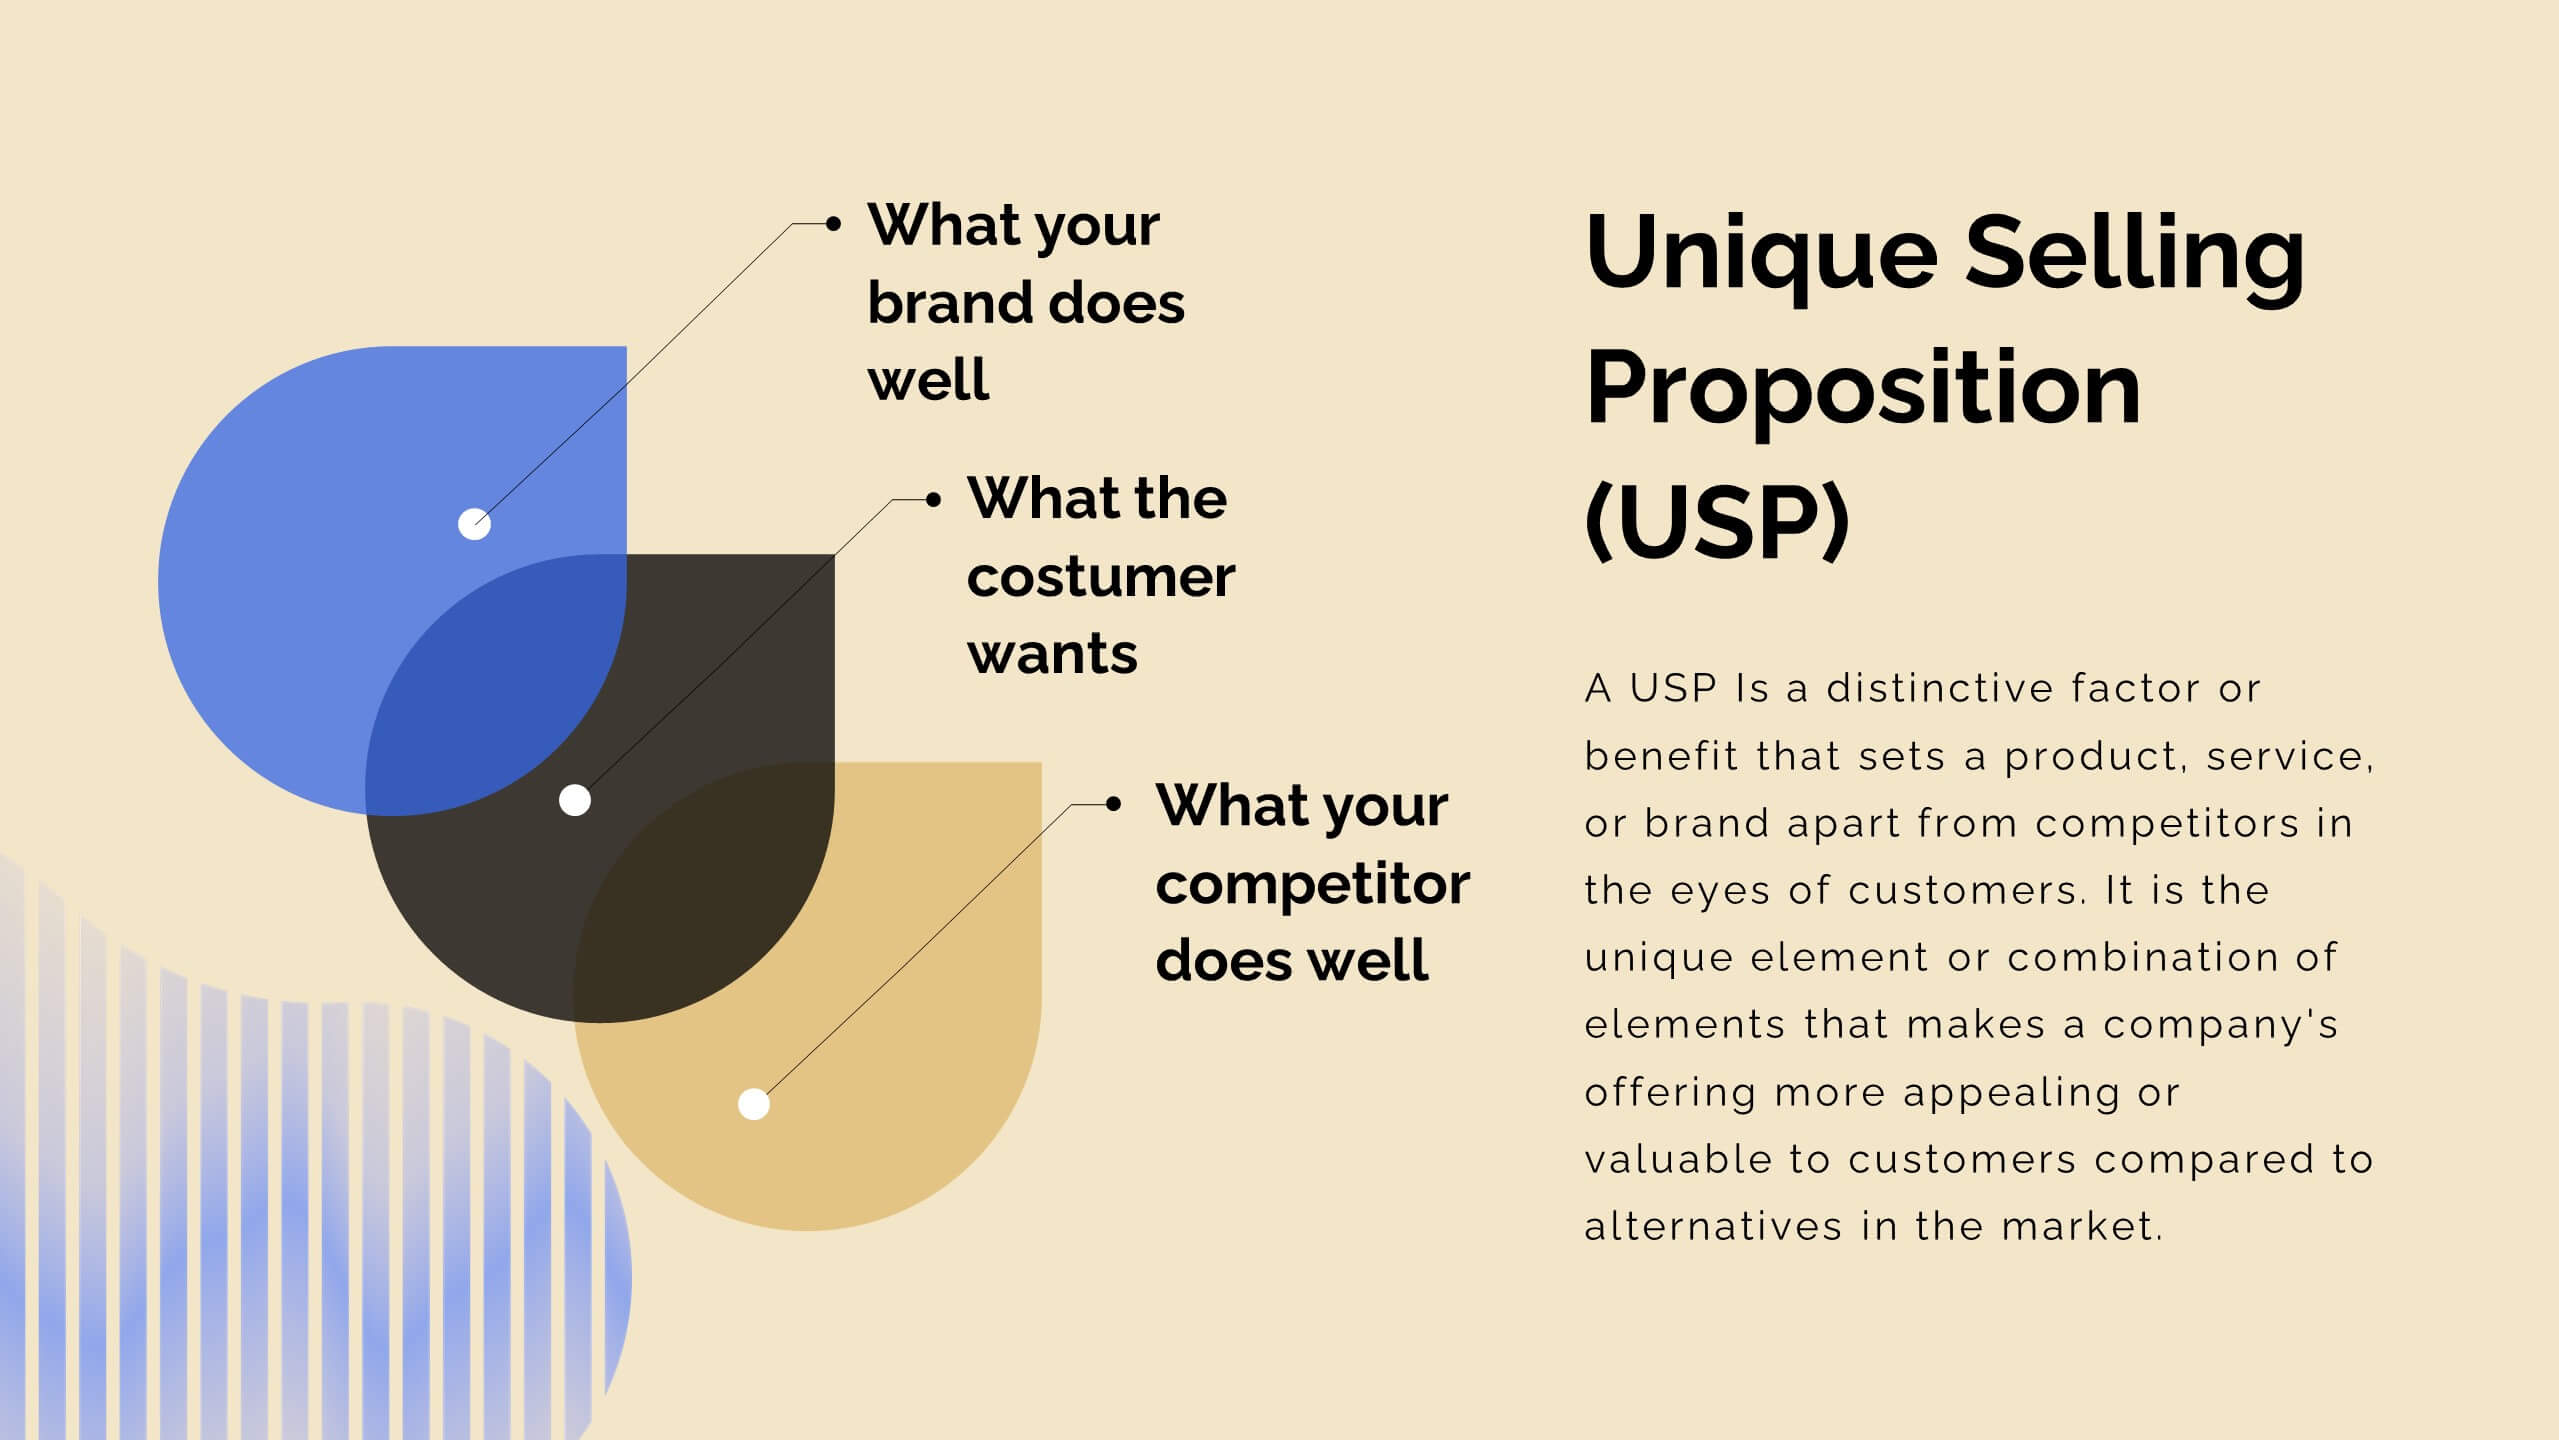
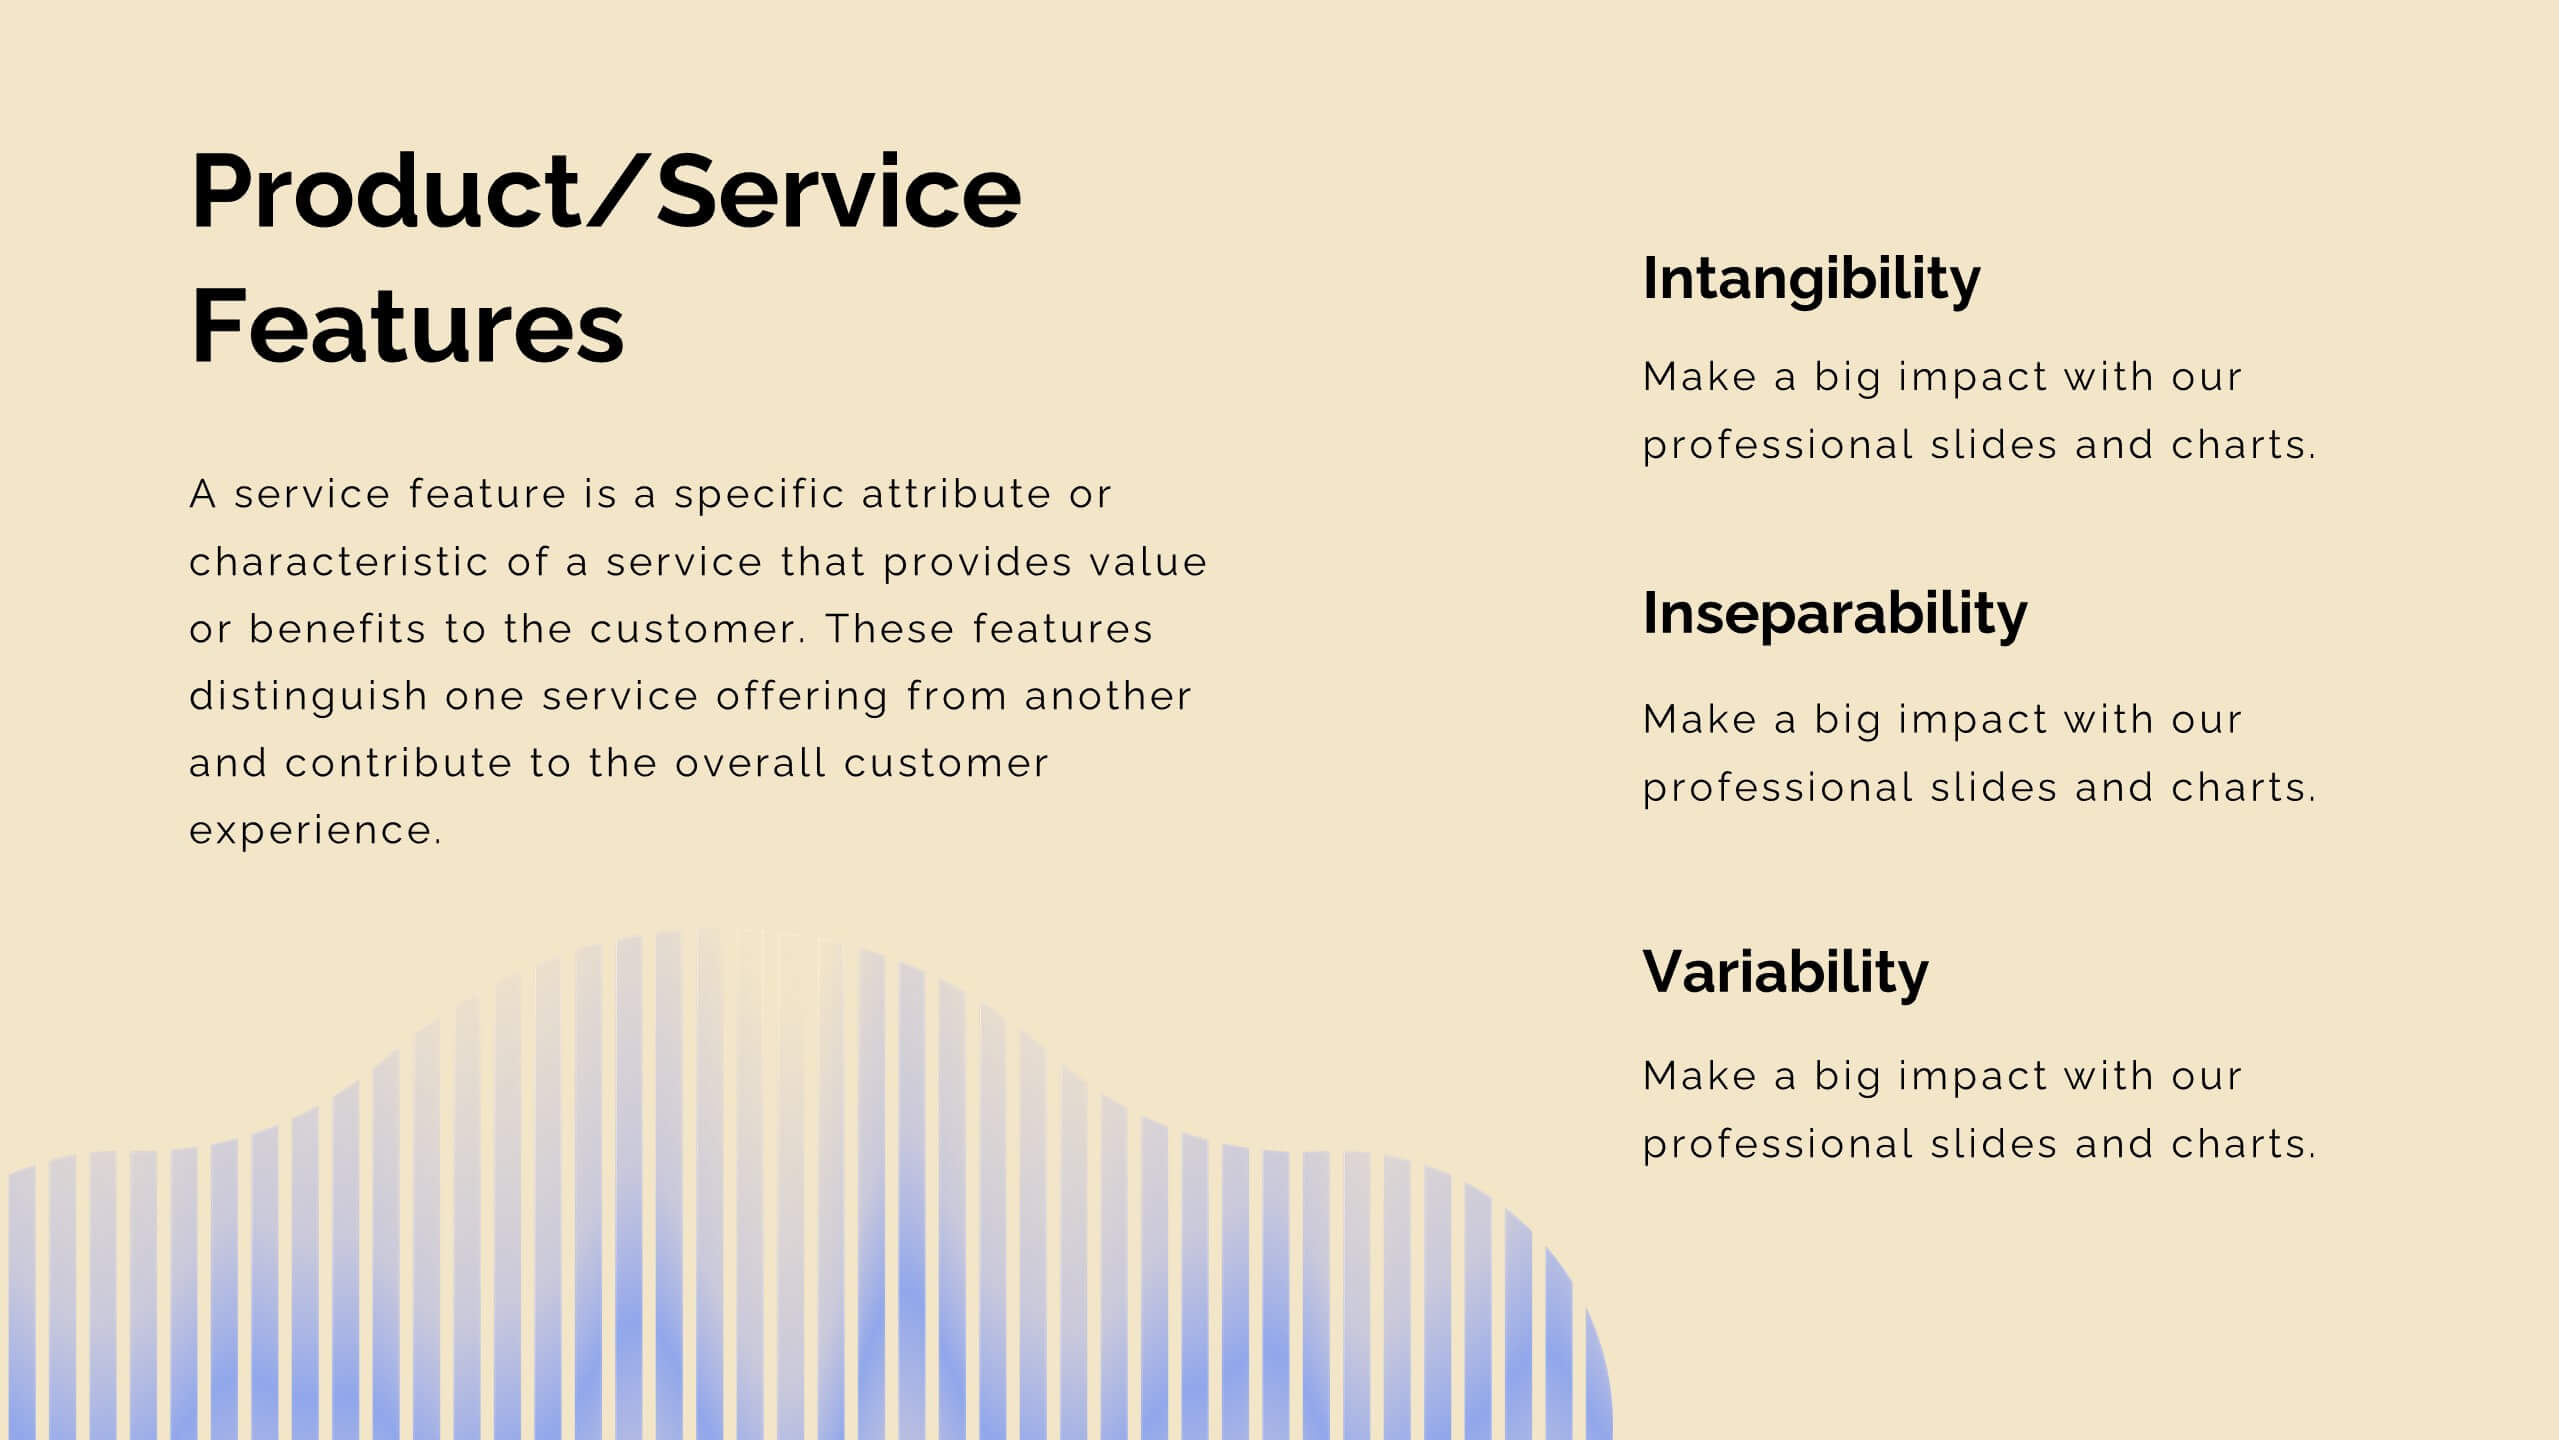
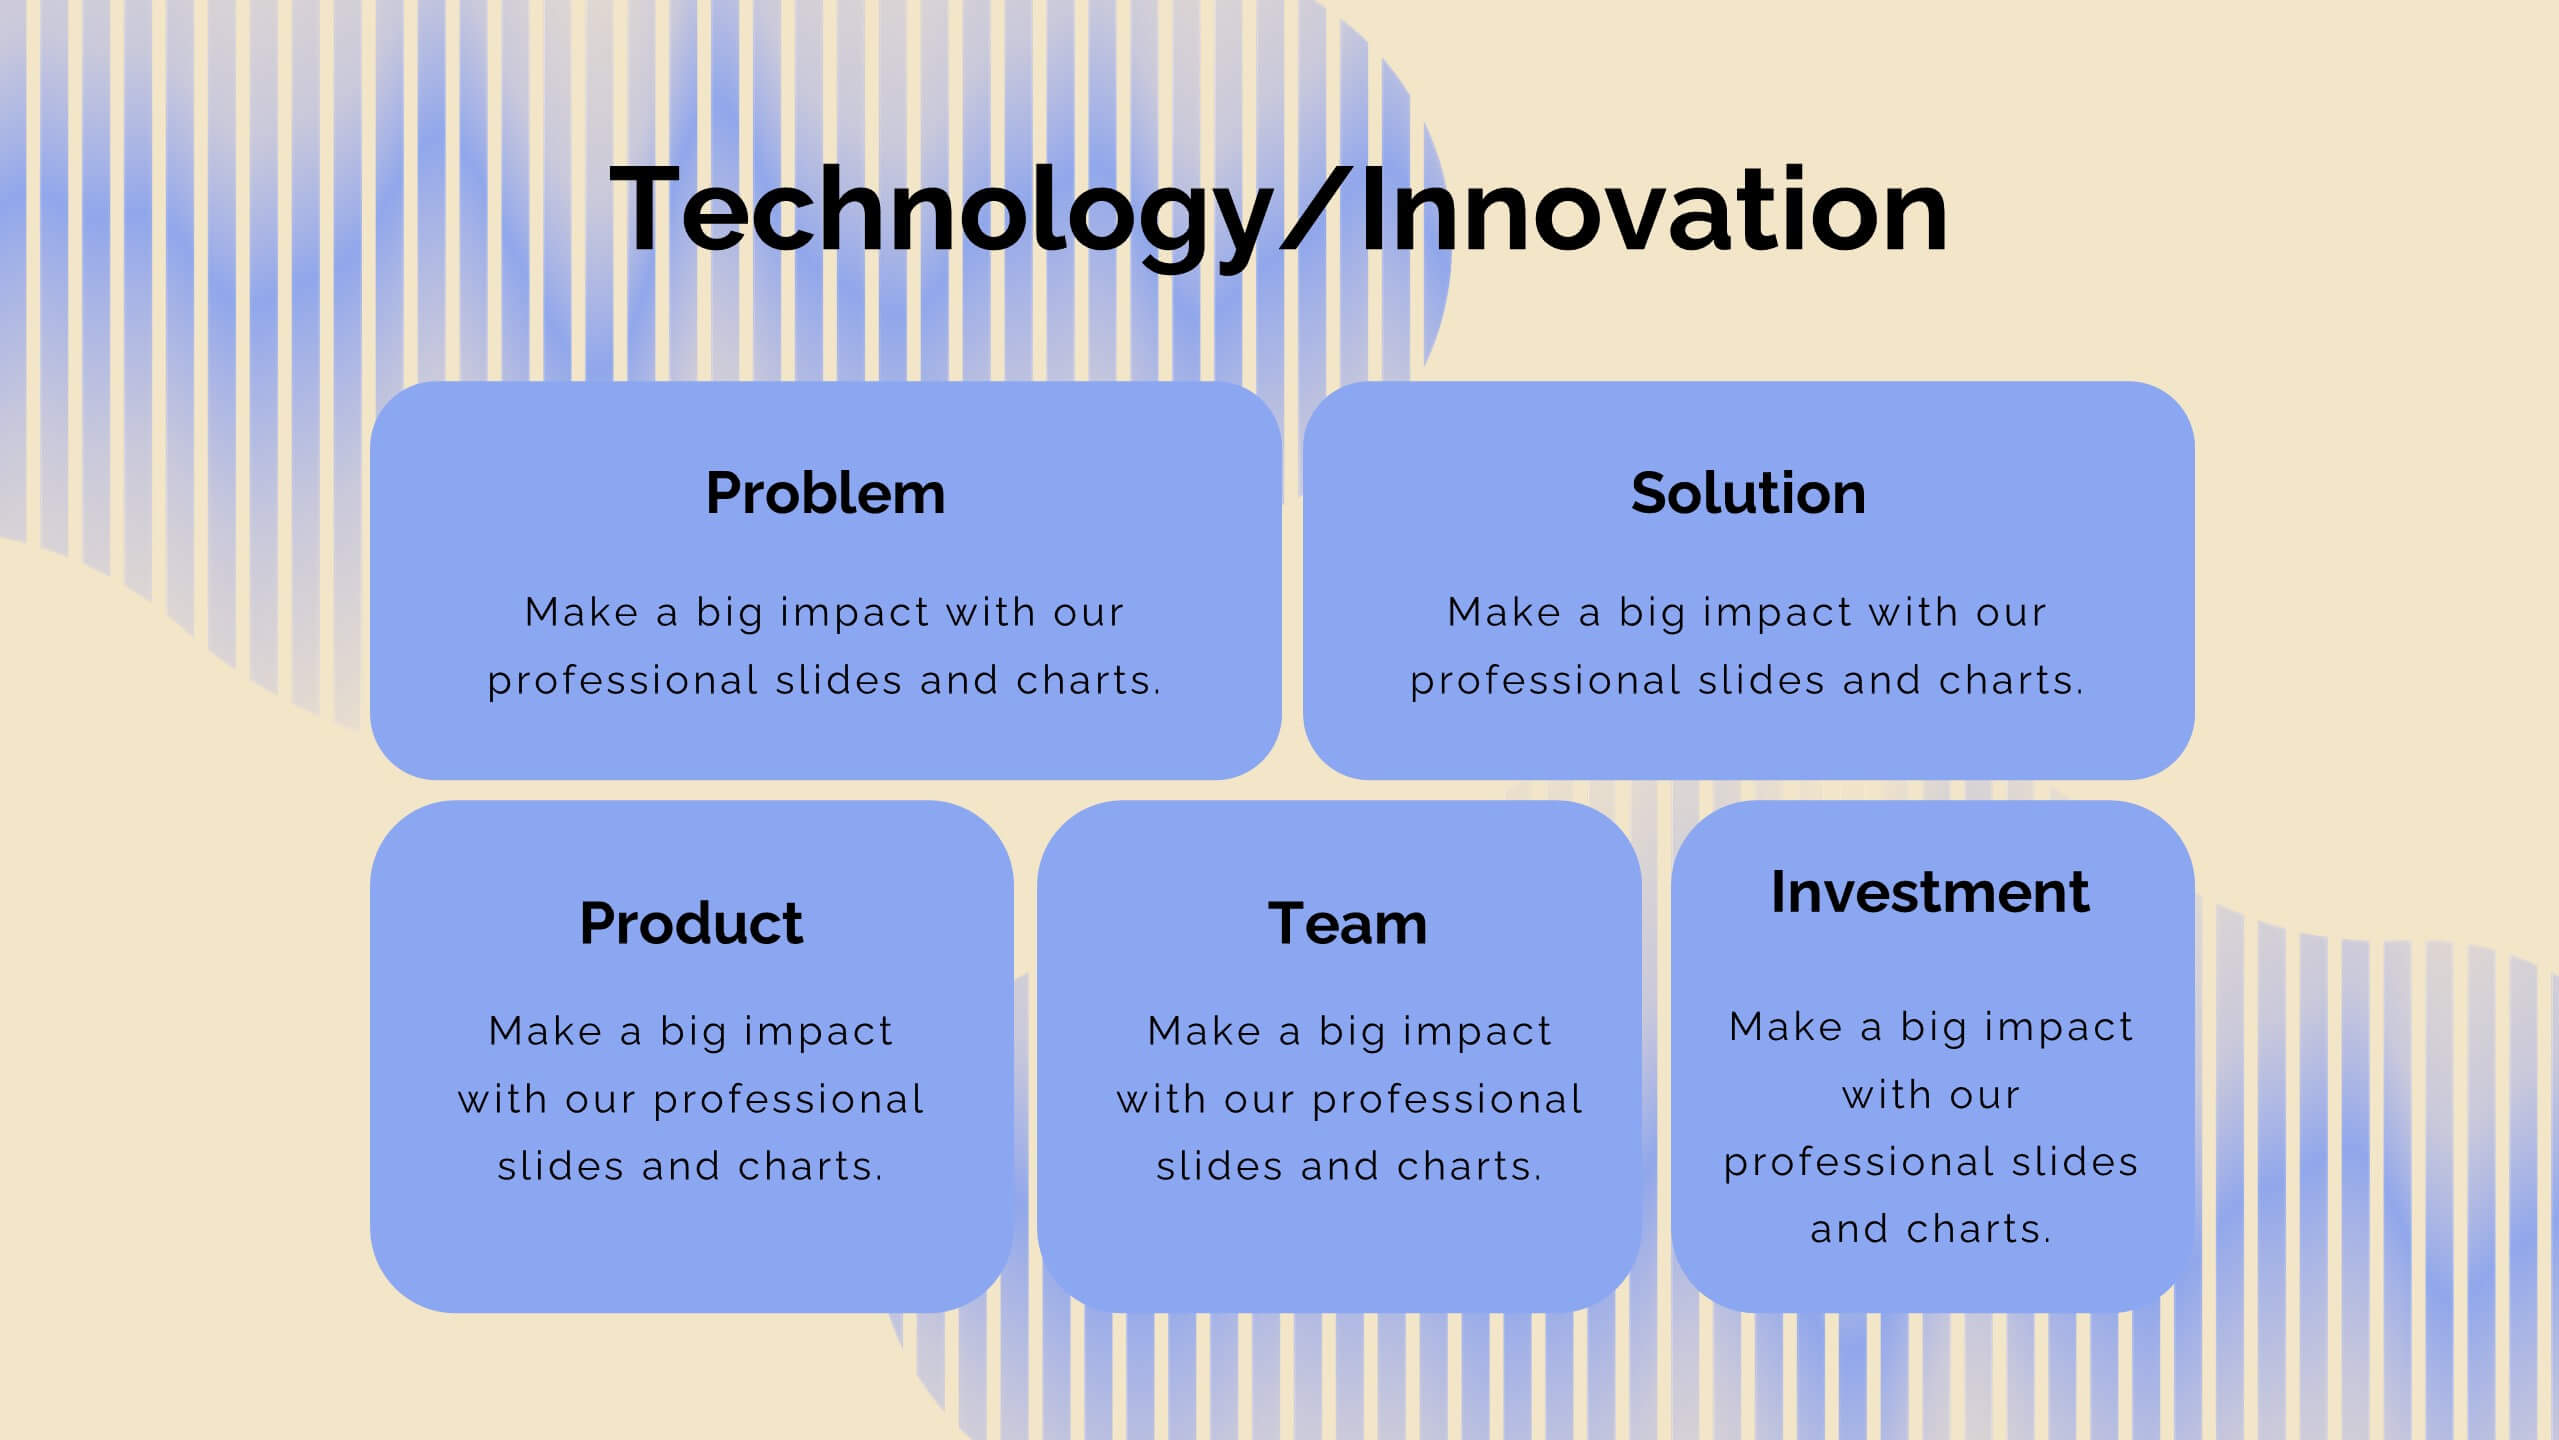
Embark on a seamless journey through your product’s lifecycle with this comprehensive roadmap template! Perfect for illustrating key milestones, business models, and market opportunities, it’s your go-to for clear and engaging presentations. Dive into competitive analysis, showcase your unique selling proposition, and outline your growth projections with style. Compatible with PowerPoint, Keynote, and Google Slides.


6 slides
Construction Project Timeline and Stages Presentation
Map out your project from groundbreaking to completion with the Construction Project Timeline and Stages Presentation. This visual timeline uses illustrated trucks to represent key construction phases—ideal for progress reports, planning reviews, or contractor briefings. Fully editable in PowerPoint, Keynote, and Google Slides.


13 slides
Simple Sales Proposal Presentation
This proposal template provides a streamlined approach for presenting sales strategies and solutions. Starting with a visually striking cover slide, it sets the scene for an engaging pitch. The template meticulously organizes content from the initial problem identification to the presentation of real numbers that underscore the proposal's validity. Each section, from the elucidation of the problem to the detailed solutions and real-world case studies, is laid out for maximum impact and understanding. Personable touches are incorporated through the 'Meet Our Team' segment, bolstering the proposal with credibility. The template culminates with a strong call to action, urging the audience to seize the collaborative opportunity, and is rounded off with a polite 'Thank You' to leave a lasting impression. This template is a boon for sales professionals seeking to communicate their value proposition with clarity and persuasiveness.