


Features
- 6 Unique slides
- Fully editable and easy to edit in Microsoft Powerpoint, Keynote and Google Slides
- 16:9 widescreen layout
- Clean and professional designs
- Export to JPG, PDF or send by email


Do you have any questions?
Recommend


26 slides
Cutting-Edge AI Breakthroughs Presentation
Step into the future with this exciting presentation on cutting-edge AI breakthroughs. Covering advancements in machine learning, automation, ethical AI, and real-world applications, this template helps you present complex innovations with clarity and impact. Fully customizable and compatible with PowerPoint, Keynote, and Google Slides for a seamless and engaging presentation experience.


5 slides
Financial Budget Infographics
Financial goals refer to specific objectives and targets that individuals or businesses set to manage their finances effectively and achieve financial success. These vertical infographics are designed to help individuals and businesses effectively present their financial budgets and plans. Whether you're a financial analyst or a business owner, this template is perfect for conveying complex financial information in a clear and concise manner. These infographics provide an overview of the budget, showcasing key financial goals, total income, and total expenses. This features visuals to help users set and track financial goals.


7 slides
State-by-State Business Data Presentation
Break down insights with this State-by-State Business Data Presentation. Featuring a U.S. map segmented by regions, this slide is ideal for illustrating localized performance, regional statistics, or market segmentation. Customize text labels and highlight specific zones to match your business needs. Fully editable in PowerPoint, Keynote, and Google Slides.


5 slides
Startup Growth Roadmap and Milestones Presentation
Present your startup journey clearly with the Startup Growth Roadmap and Milestones Presentation. This timeline-style layout breaks down your key phases, from initial concept to market traction. Ideal for investor decks, pitch presentations, or internal planning. Fully editable in PowerPoint, Canva, and Google Slides for seamless customization.


6 slides
International Law Infographics
Our International Law infographic is a versatile and informative tool for professionals and educators to incorporate into presentations on Powerpoint, Keynote, and Google Slides. It's specially crafted to elucidate the complexities of international law, making it an indispensable aid for lawyers, law students, and legal analysts. The infographic is thoughtfully designed to summarize the principles, mechanisms, and impact of international law on global relations. It provides a visual breakdown of treaties, jurisdiction, and the functions of international legal bodies. The layout is intended to guide the audience through the intricacies of international legal processes in a straightforward and comprehensible manner. Utilizing this infographic will enhance your ability to communicate the nuances of international legal frameworks effectively. It's particularly useful for lectures, seminars, or presentations that require a concise yet thorough explanation of international legal concepts. By presenting this graphic, you can foster a better understanding of how legal norms are applied across borders, promoting a more informed discussion on the subject.


5 slides
Strategic Planning with OKRs Presentation
Optimize goal-setting with the Strategic Planning with OKRs presentation. This visually engaging template uses a trophy-inspired design to highlight key objectives and results, making it perfect for business strategy sessions, team alignment, and performance tracking. Fully customizable and compatible with PowerPoint, Keynote, and Google Slides for seamless use.


6 slides
Community Ecology Infographic
Ecology is the scientific study of the interactions between organisms and their environment. This infographic template is an informative representation of the interactions and relationships among different species in a specific ecological community. It highlights the key concepts and principles of community ecology, helping the audience understand the intricate connections that exist in nature. This infographic features an illustration of a diverse ecosystem, showcasing various plants, animals, and microorganisms that coexist within the community. The illustration visually represents the complexity and diversity of the community.


6 slides
Constructive Feedback Infographics
Improve your feedback processes with our Constructive Feedback infographic template. This template is fully compatible with popular presentation software like PowerPoint, Keynote, and Google Slides, allowing you to easily customize it to illustrate and communicate the principles of providing effective constructive feedback. The Constructive Feedback infographic template offers a visually engaging platform to outline the key elements of delivering feedback that promotes growth and improvement. Whether you're a manager, team leader, educator, or simply interested in enhancing your feedback skills, this template provides a user-friendly canvas to create informative presentations and educational materials. Optimize your feedback delivery with this SEO-optimized Constructive Feedback infographic template, thoughtfully designed for clarity and ease of use. Customize it to showcase the importance of specific, actionable, and balanced feedback, helping you enhance communication and drive positive change within your team or organization. Start crafting your personalized infographic today to become more proficient in providing constructive feedback.


4 slides
Scrum Team Retrospective Overview Deck Presentation
Reflect on past sprints with this structured Scrum Team Retrospective Deck. Featuring four quadrants for clear team feedback—what worked, what didn’t, ideas for improvement, and action items. Ideal for agile coaches and team leads. Fully editable in PowerPoint, Keynote, and Google Slides to match your team's review process.


6 slides
Cryptocurrency Analysis Infographics
Analyze cryptocurrency effectively with our Cryptocurrency Analysis infographic template. This template is fully compatible with popular presentation software like PowerPoint, Keynote, and Google Slides, allowing you to easily customize it to illustrate and communicate various aspects of cryptocurrency analysis. The Cryptocurrency Analysis infographic template offers a visually engaging platform to explore and explain the key elements of analyzing cryptocurrencies, including market trends, technical analysis, fundamental analysis, and investment strategies. Whether you're a cryptocurrency enthusiast, trader, or investor, this template provides a user-friendly canvas to create informative presentations and educational materials. Enhance your cryptocurrency knowledge and analysis skills with this SEO-optimized Cryptocurrency Analysis infographic template, thoughtfully designed for clarity and ease of use. Customize it to showcase cryptocurrency charts, indicators, risk management techniques, and insights into the volatile world of digital assets, ensuring that your audience gains valuable insights into this evolving field. Start crafting your personalized infographic today to become a more proficient cryptocurrency analyst.


5 slides
Energy Sector Analysis Infographics
The Energy Sector refers to the industry and activities related to the production, generation, distribution, and consumption of energy. This template is a simple and informative tool that allows you to present key information and statistics about the energy sector in an engaging manner. This template is designed to help you showcase data, trends, and insights related to aspects of the energy sector, including renewable energy, fossil fuels, and environmental impacts. Its customizable design and informative layouts make it an ideal choice for educational presentations, or raising awareness and understanding of this and its various dimensions.


21 slides
Cerberus Project Timeline Presentation
Bring your project vision to life with a well-structured plan that flows effortlessly. This presentation covers everything from objectives and timelines to budget breakdowns, team introductions, and next steps, helping you communicate key details with clarity. Perfect for internal or client presentations, and fully compatible with PowerPoint, Keynote, and Google Slides.


5 slides
Strengths, Weaknesses, Opportunities & Threats Presentation
Visualize your SWOT analysis with clarity using the Strengths, Weaknesses, Opportunities & Threats Presentation. This editable puzzle-style slide makes it easy to present key insights and strategic positioning in a visually engaging format. Compatible with PowerPoint, Canva, and Google Slides for seamless customization and professional business planning.


26 slides
Solar Energy Company Profile Presentation
Step into the radiant world of solar energy, where the sun’s power promises a greener tomorrow. This playful, vibrant template, painted in refreshing shades of green and light tan yellow, encapsulates the joy and promise of renewable energy. Decked with sun-kissed graphics, spirited icons, and illuminating image placeholders, it brings the power of solar to the forefront. Effortlessly adaptable to Powerpoint, Keynote, or Google Slides. A ray of sunshine for green startups, environmental educators, energy consultants, or anyone eager to spread the word about solar solutions. Illuminate your ideas; let the power of the sun shine through.


28 slides
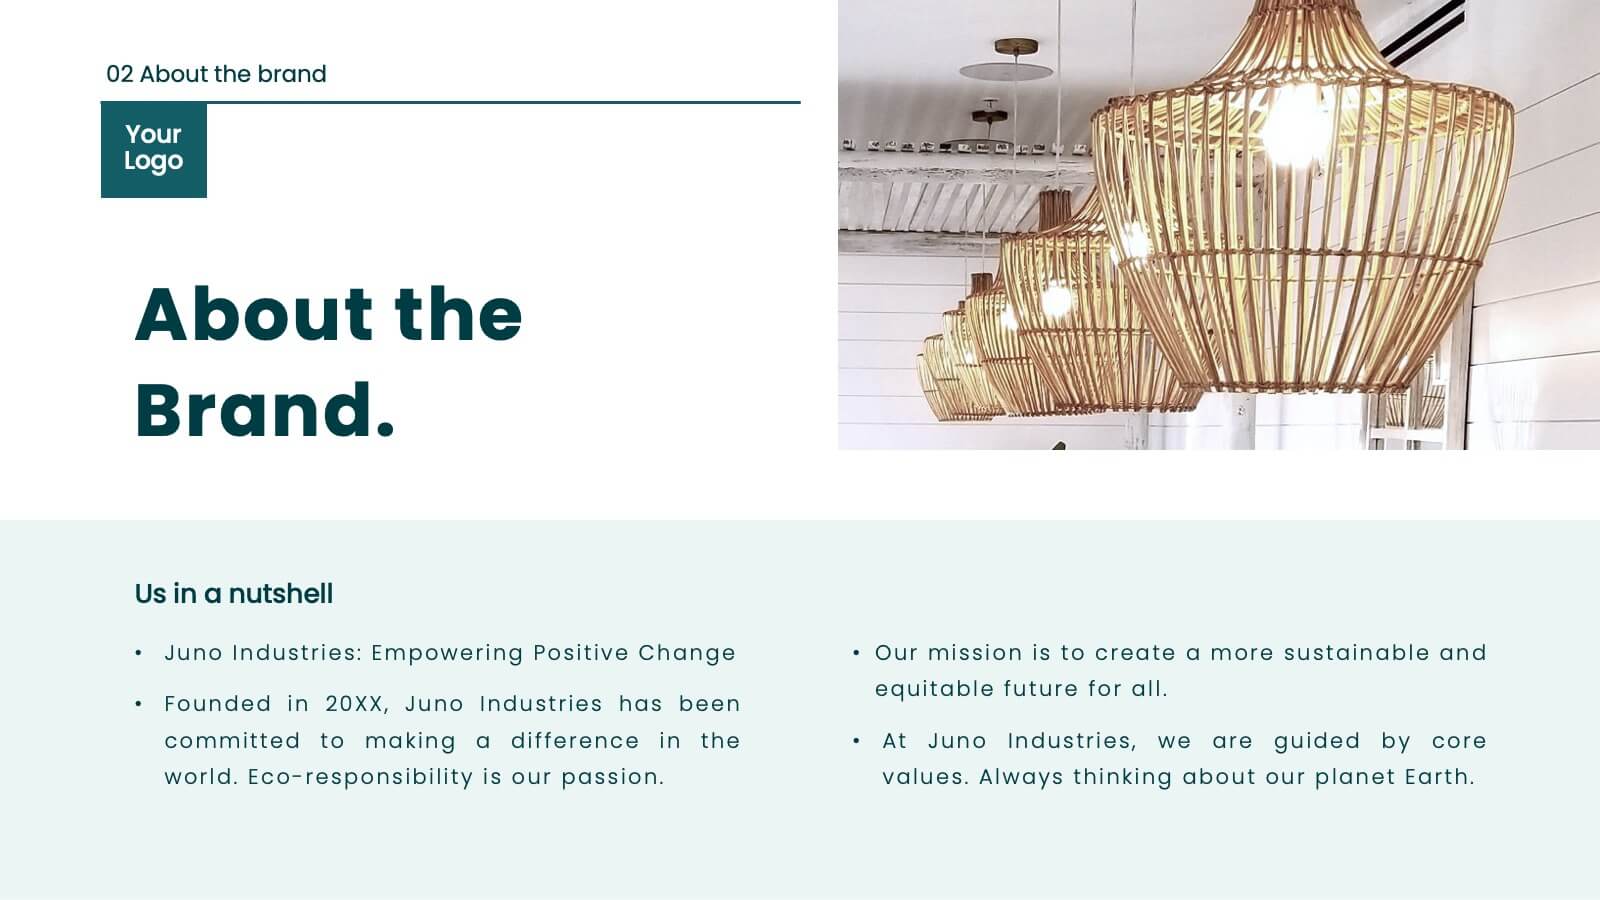
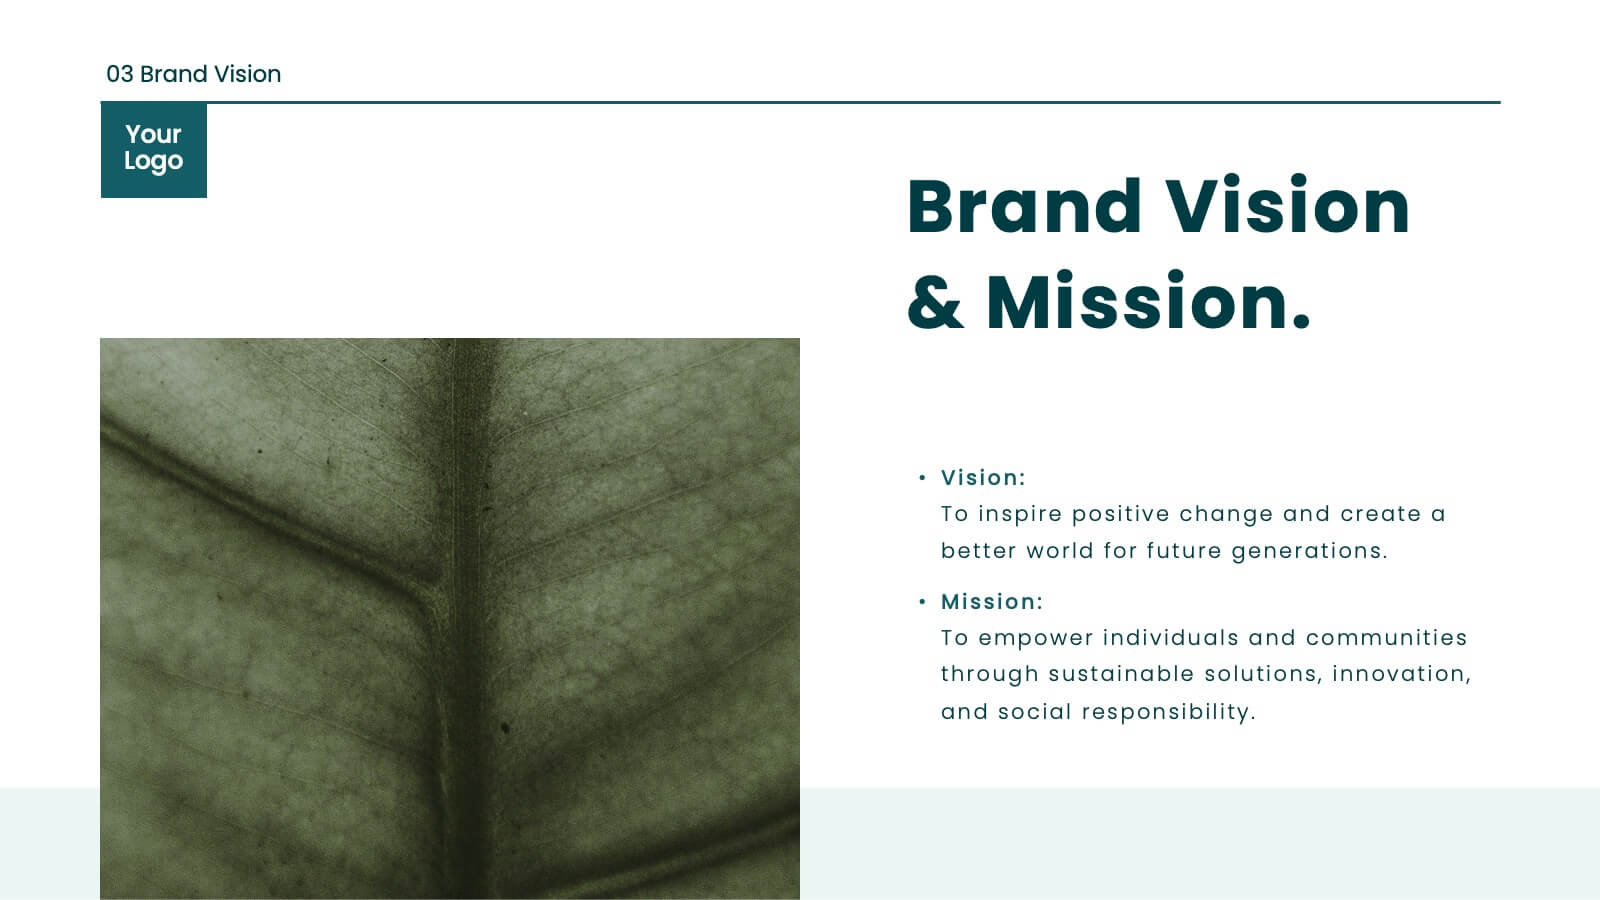
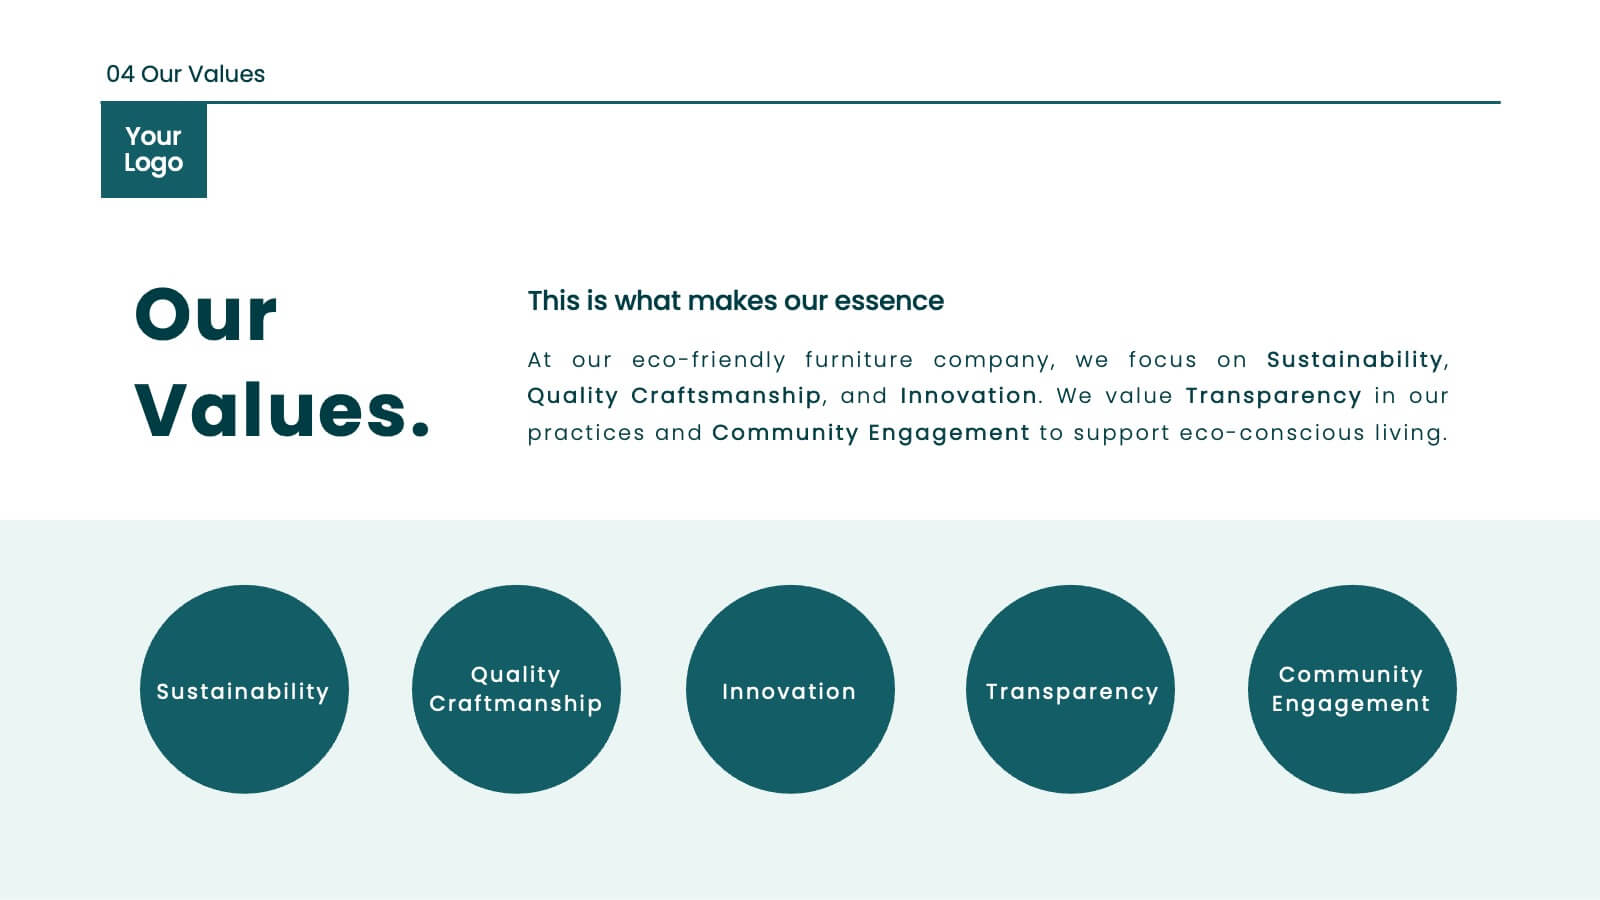
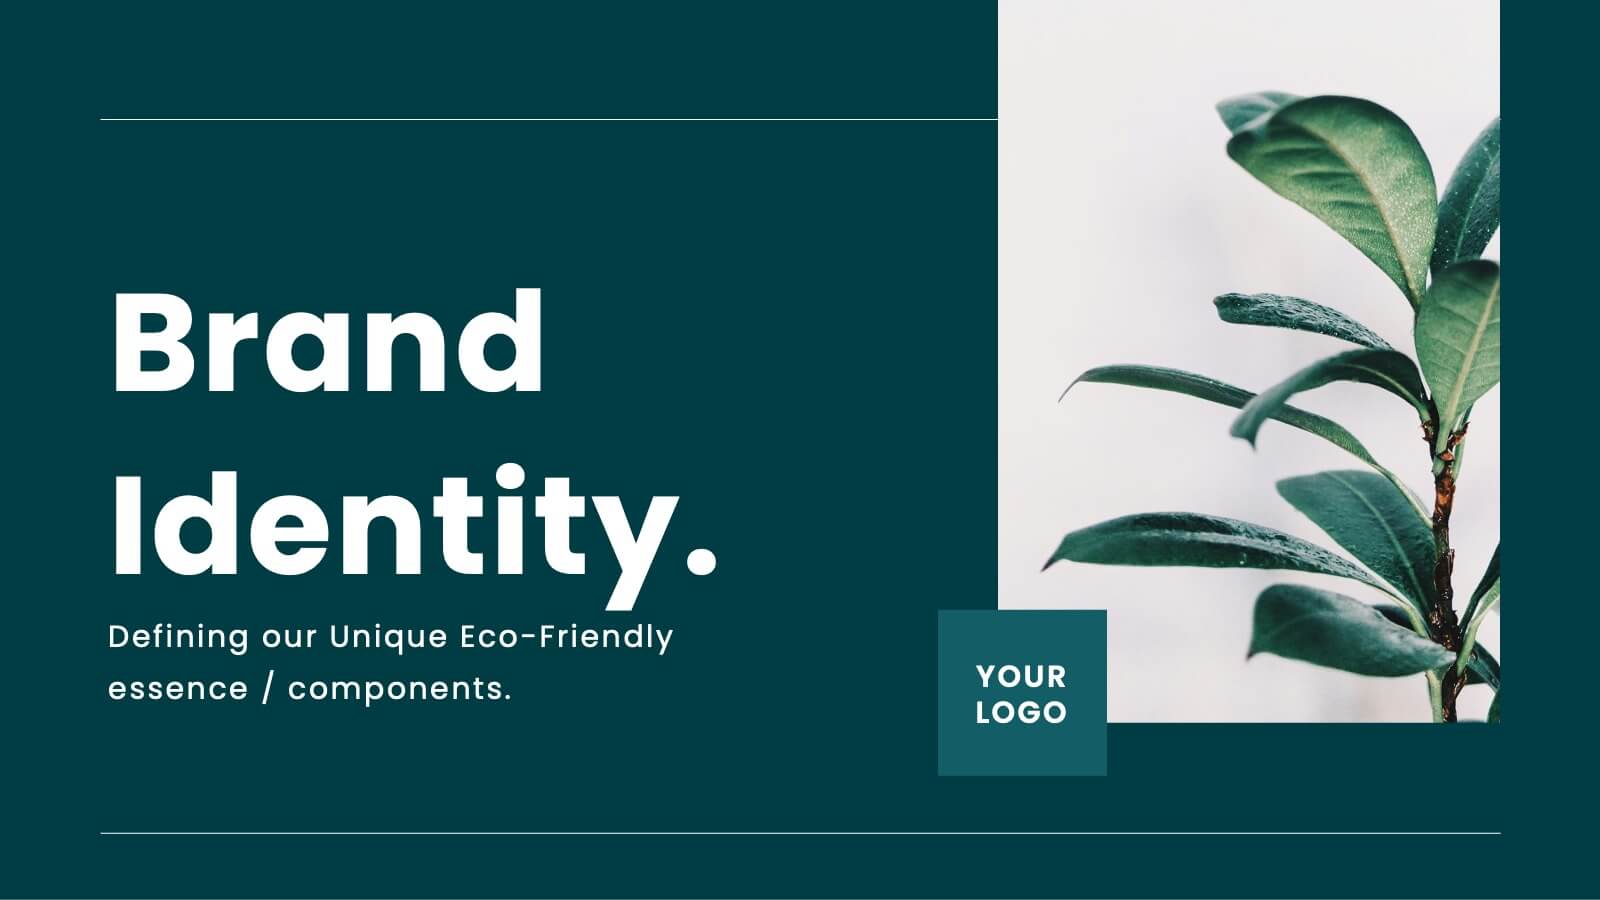
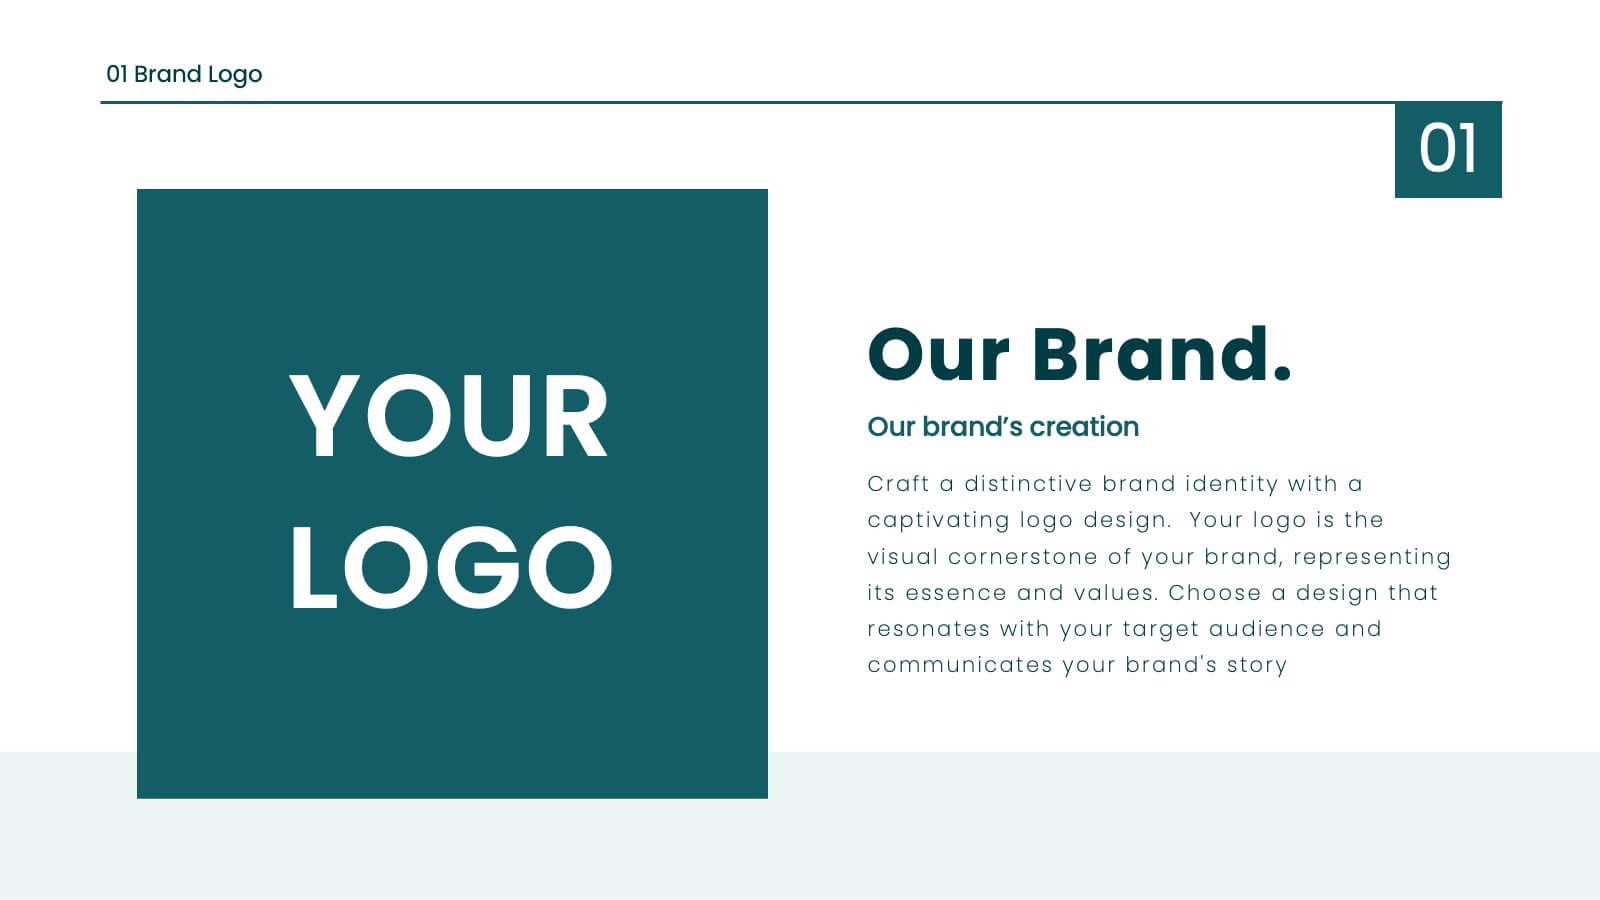
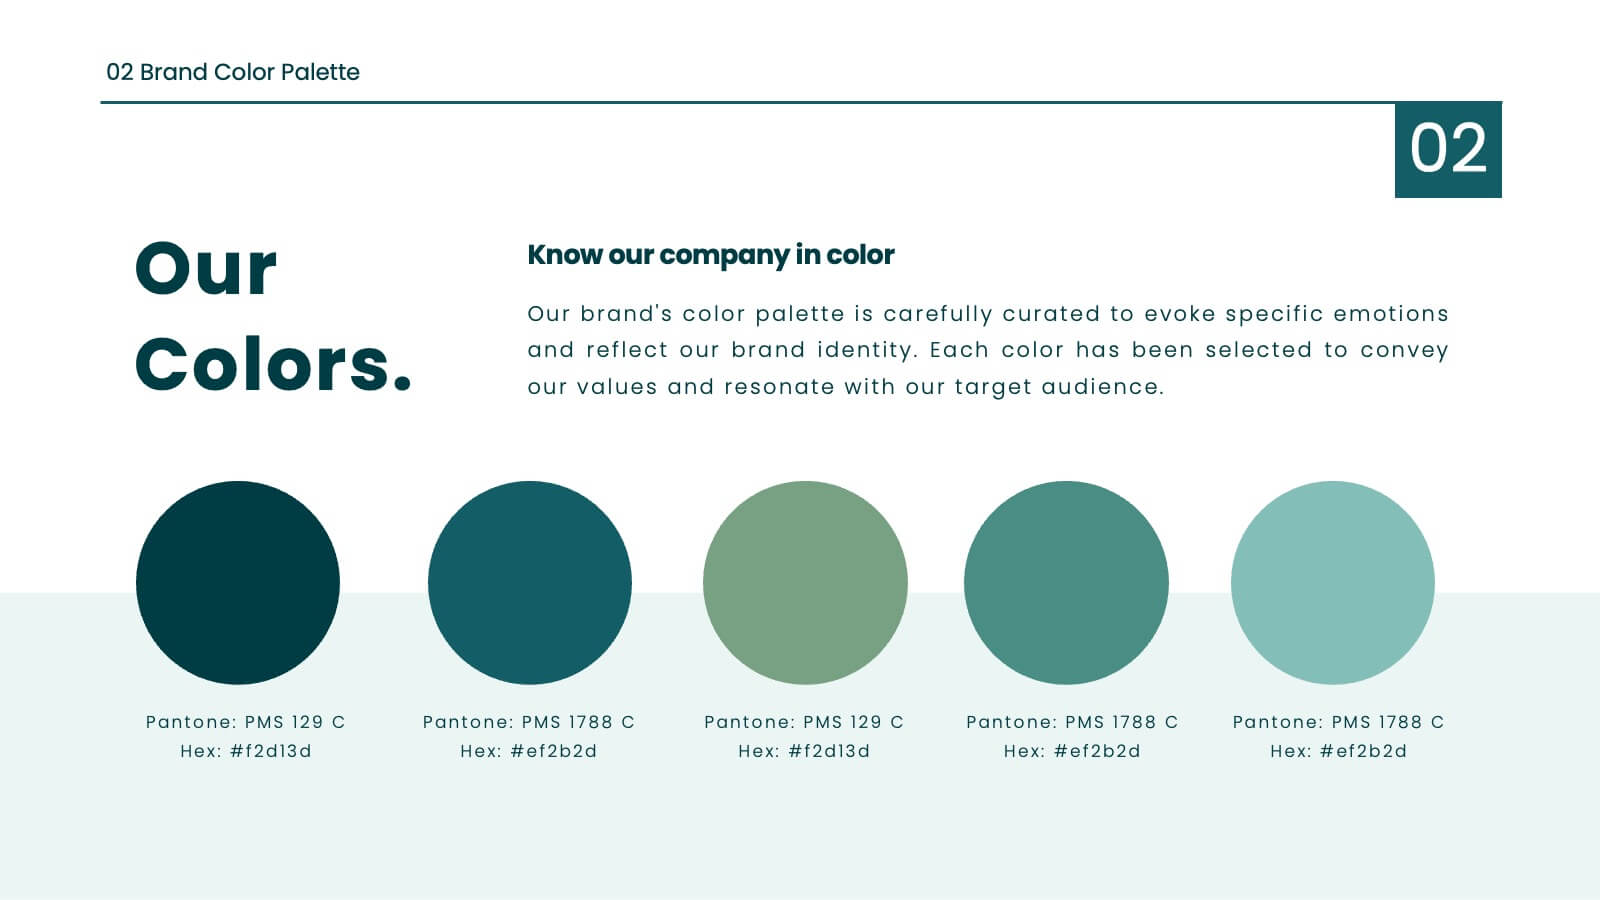
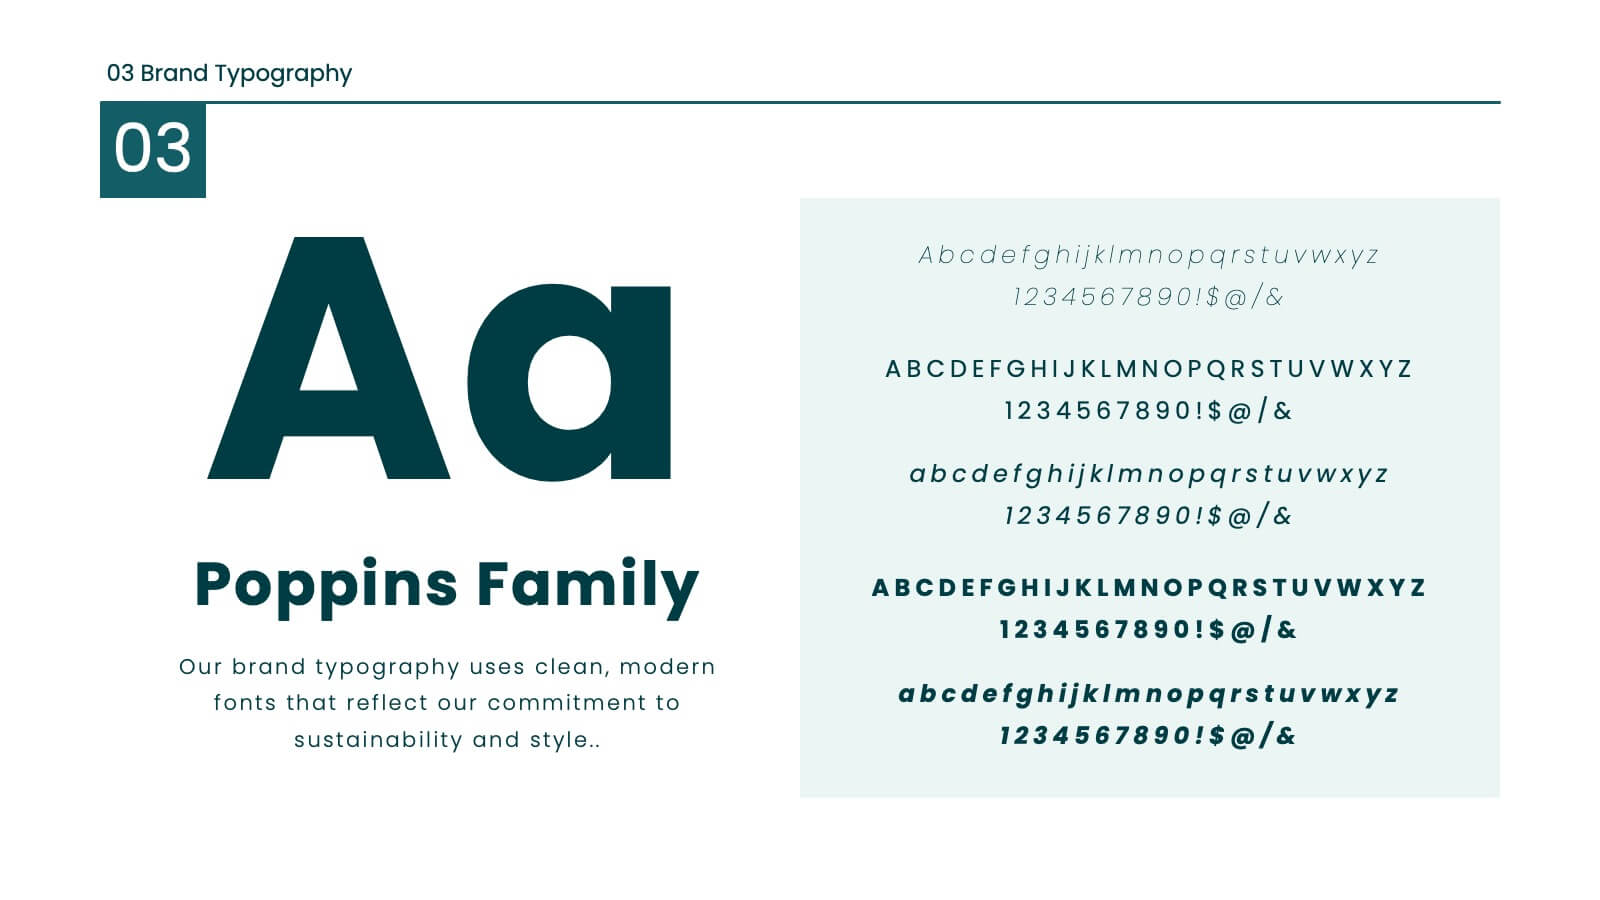
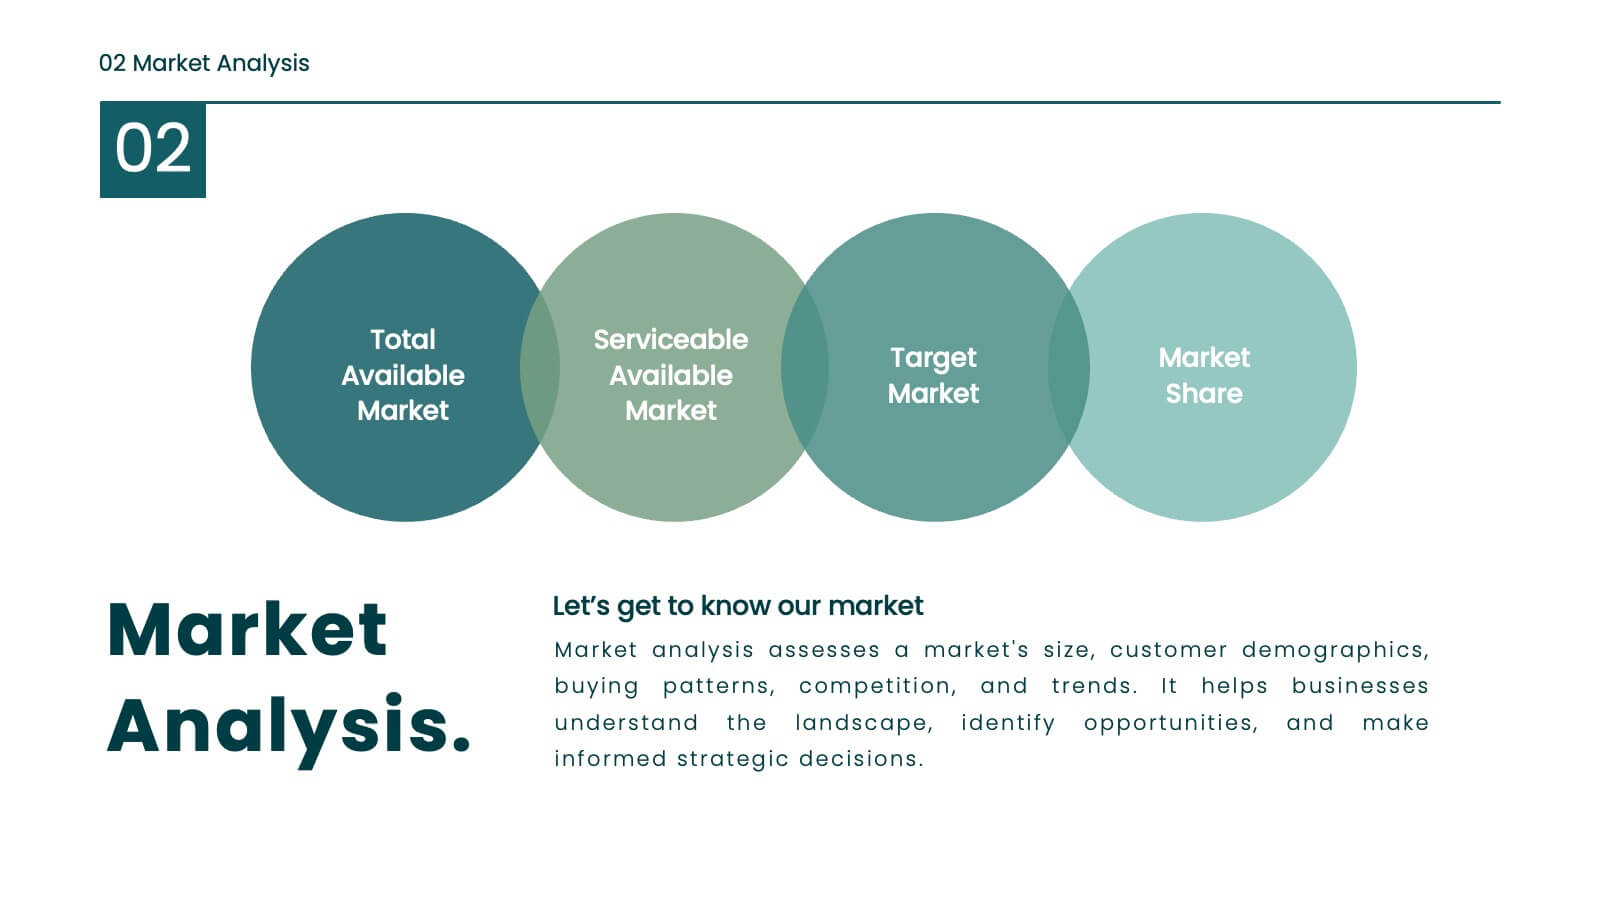
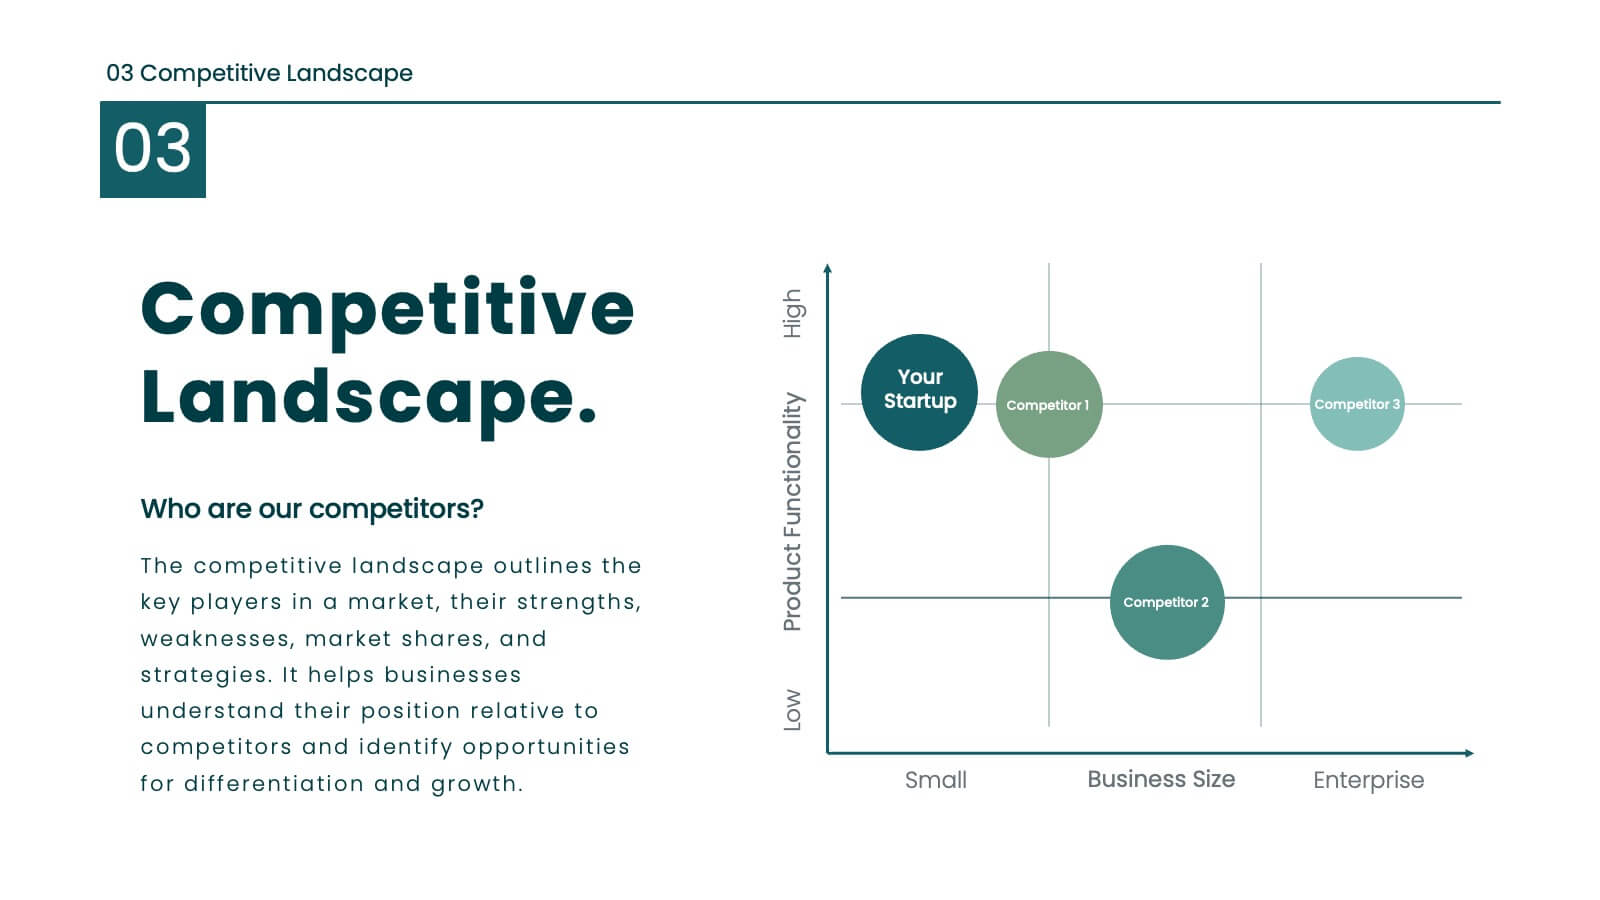
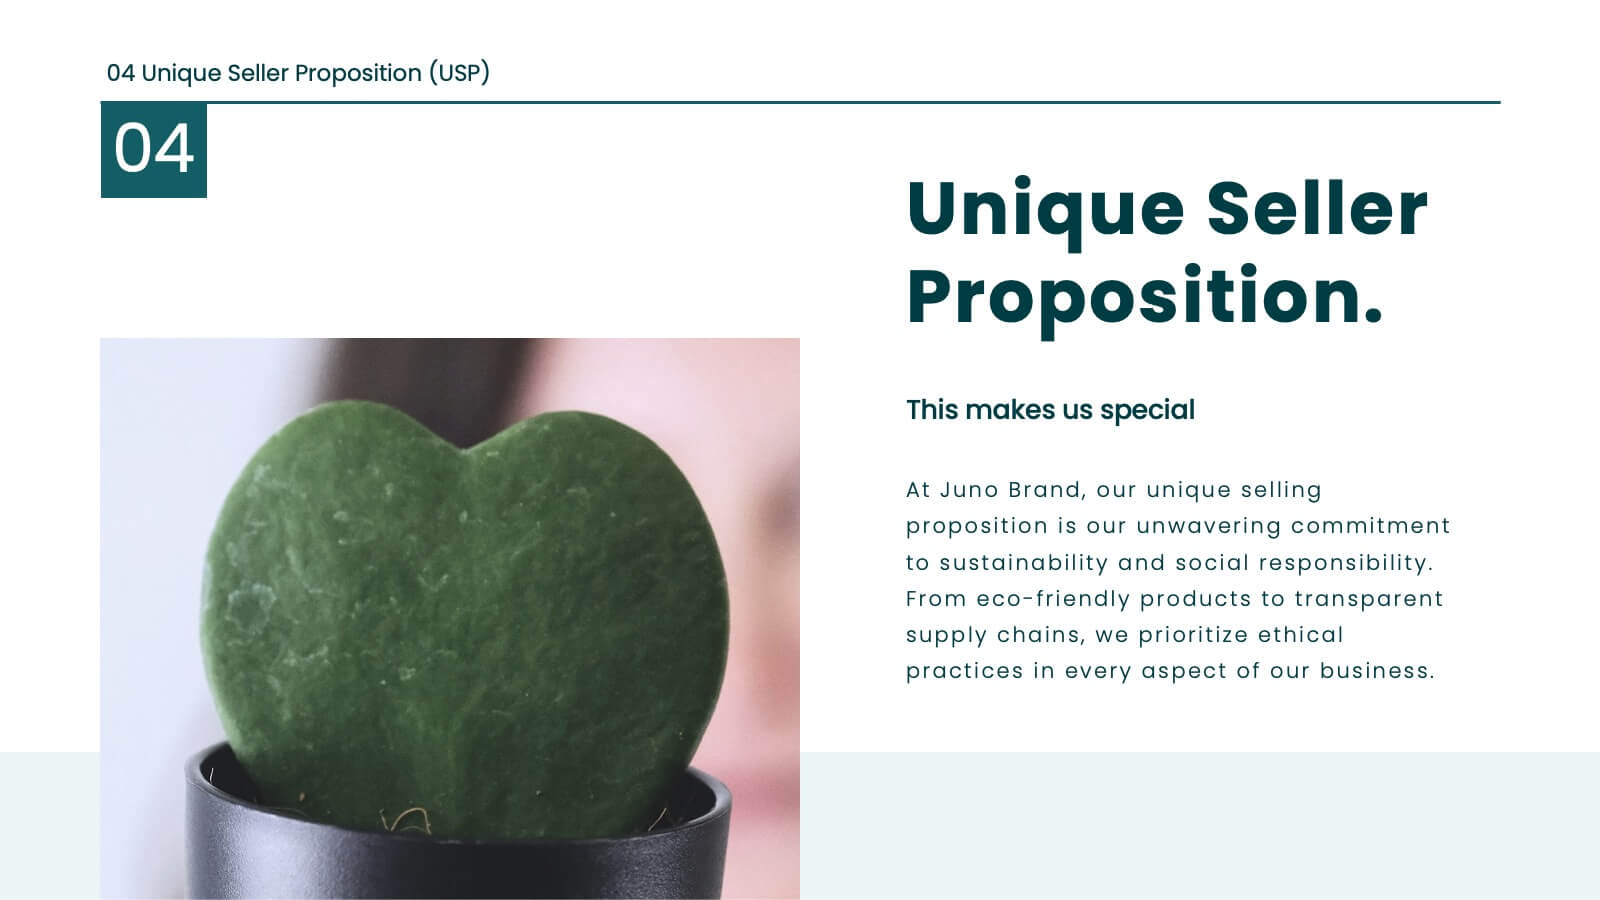
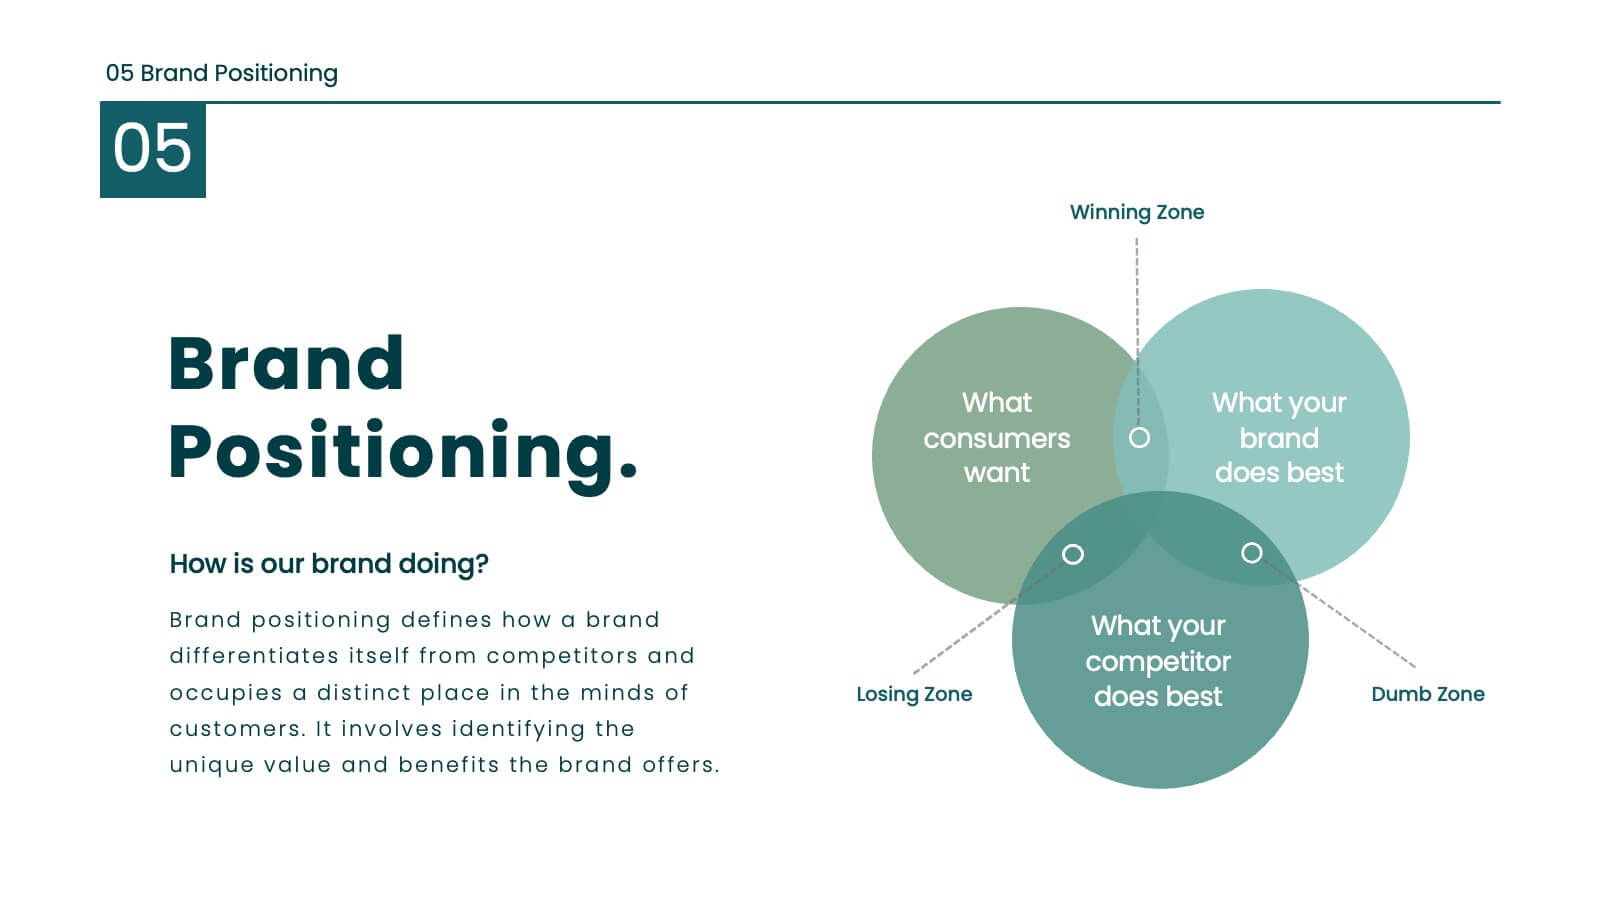
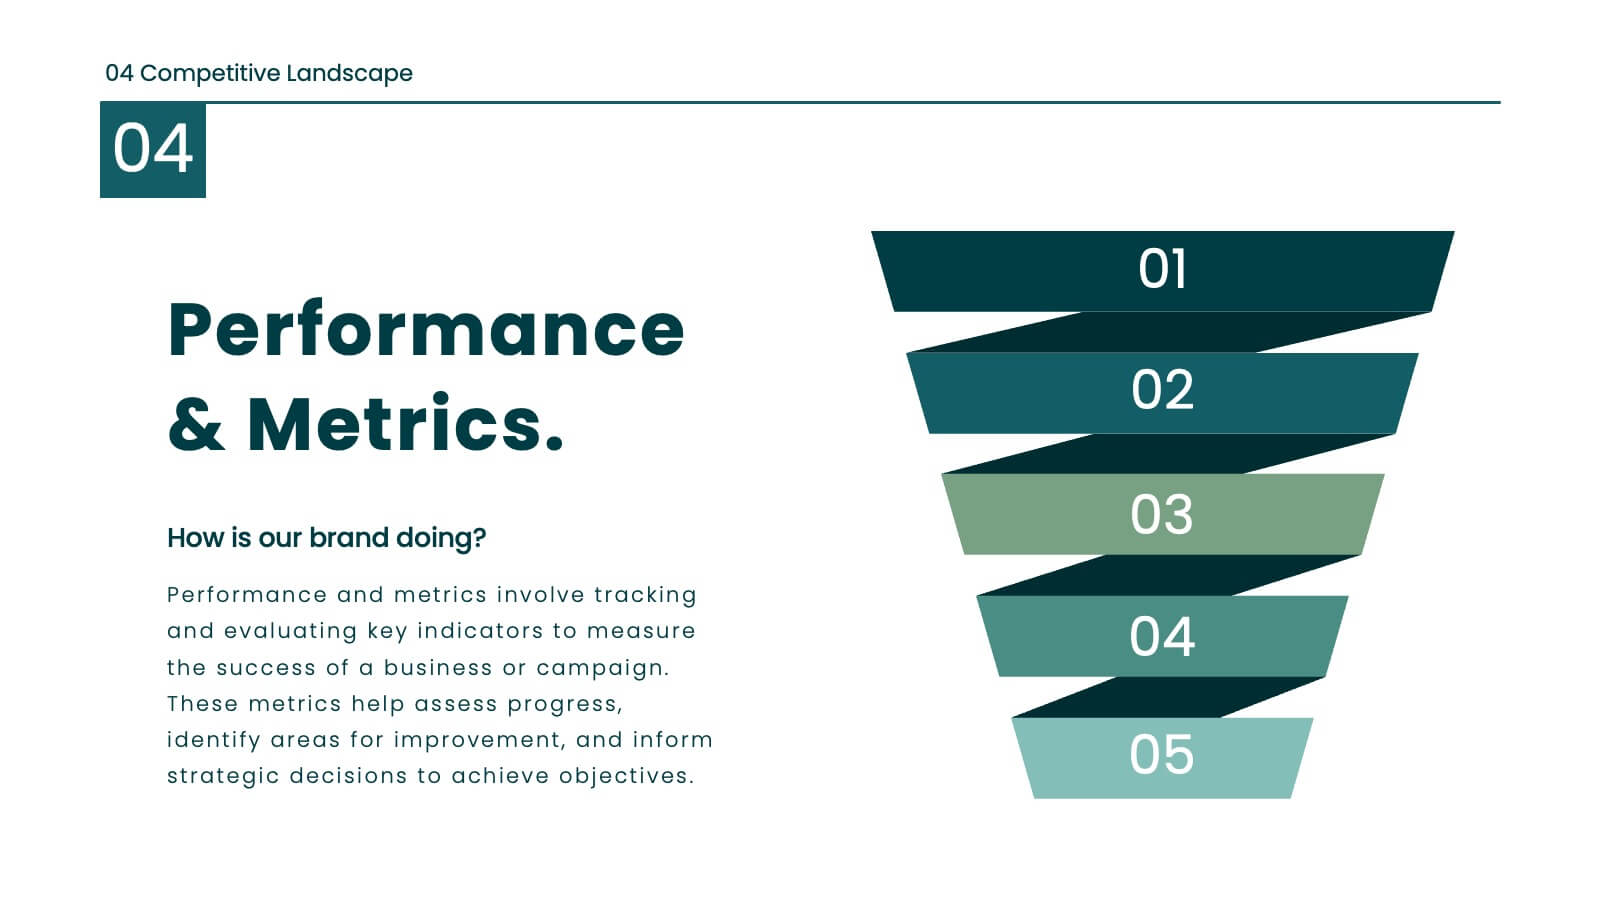
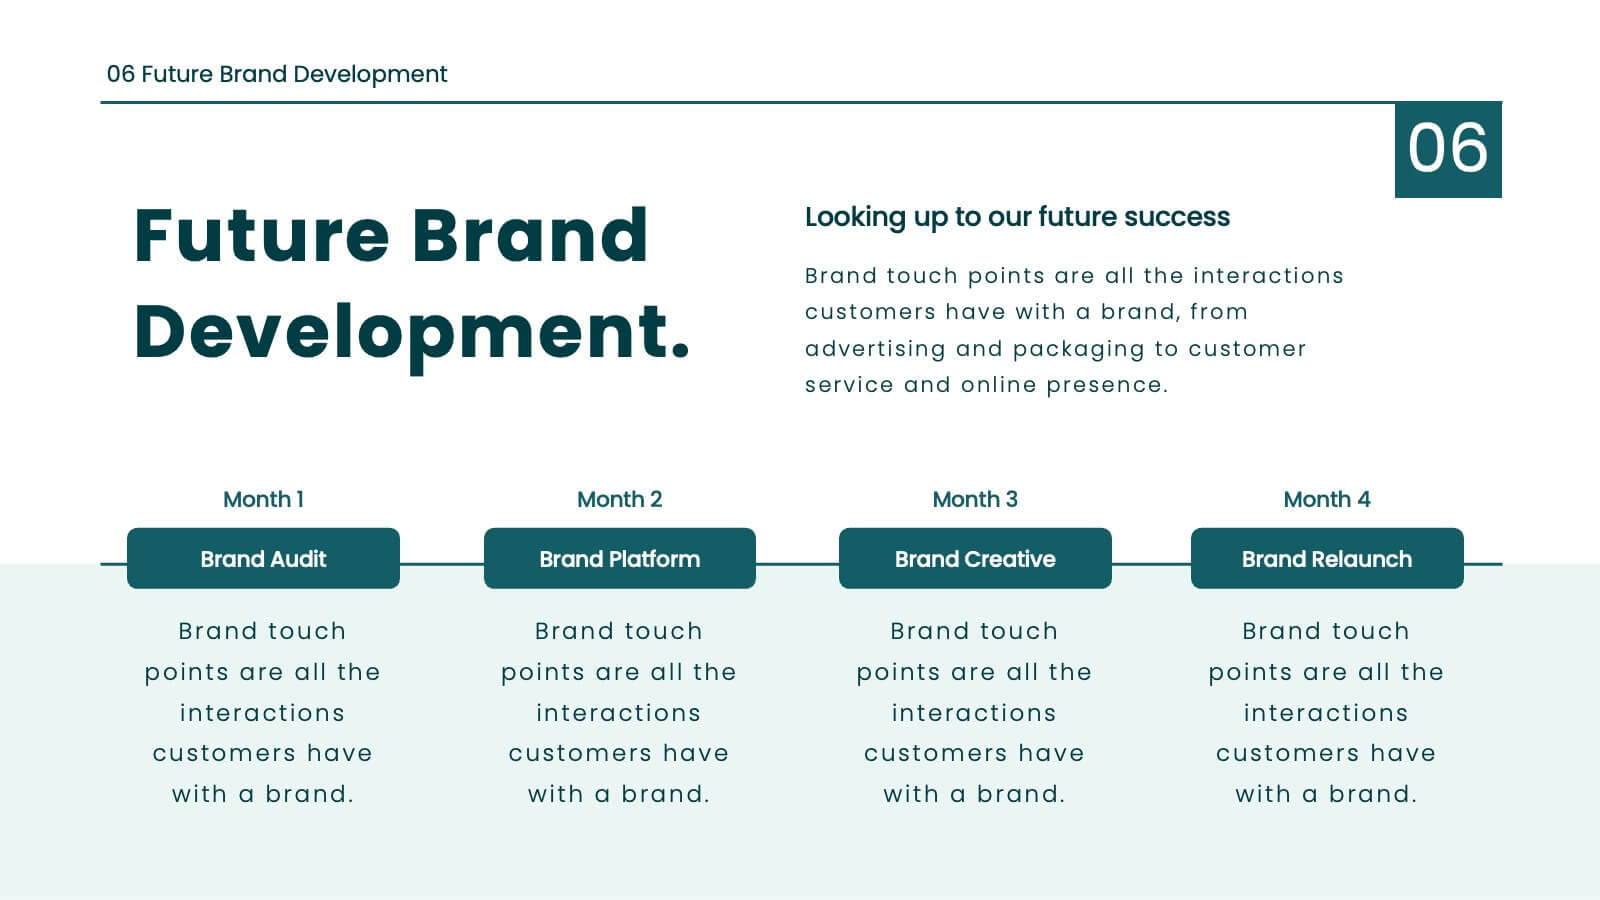
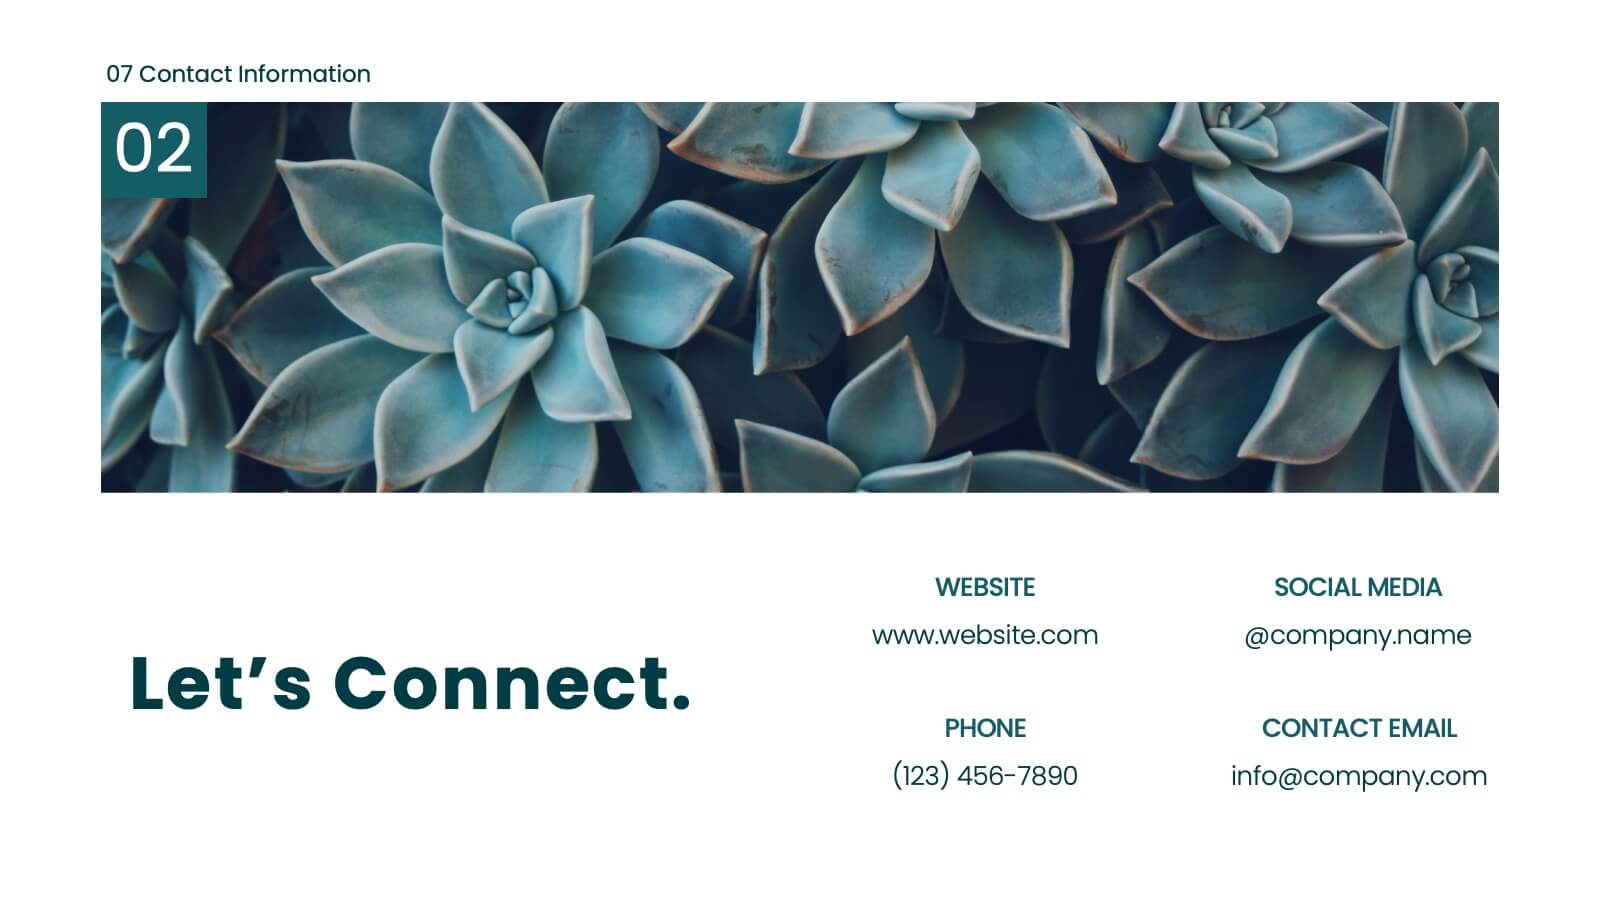
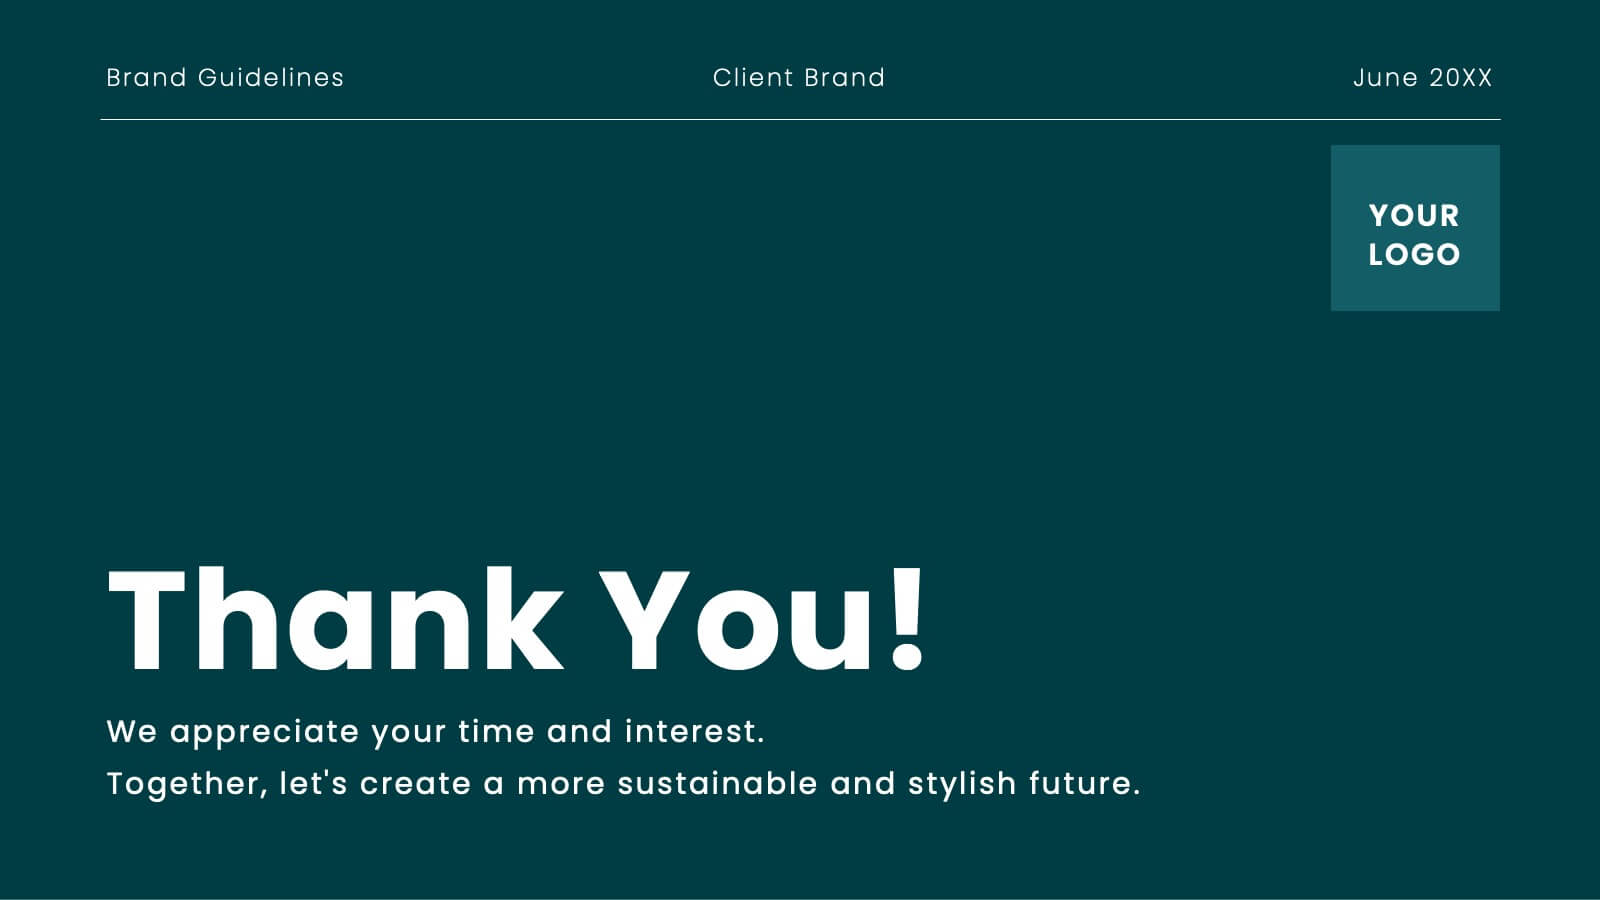
Juno Brand Guidelines Proposal Presentation
Define your brand's identity with this comprehensive, stylish presentation template. Perfect for detailing brand guidelines, vision, mission, and market analysis, it features a clean design with a professional layout. Highlight key elements like color palettes, typography, and unique selling propositions to ensure consistency and clarity. Compatible with PowerPoint, Keynote, and Google Slides, it’s ideal for any platform.


7 slides
Relationship Connectivity Infographic
The Relationship Connectivity Infographic provides a structured visualization to represent the interconnectedness of various elements within a system or project. This graphic organizes components into a cohesive layout that highlights how each part is related to and impacts the others. Ideal for demonstrating the complex synergy between different departments, phases of a project, or any scenario requiring a clear display of relationships, this infographic serves as an essential tool for planners, educators, and managers. It is designed to be user-friendly and is compatible with a range of platforms, including PowerPoint, Google Slides, and Keynote, making it easily customizable.


7 slides
Editable List Slide Presentation
Organize your ideas with style and simplicity using this clean, structured layout designed for clarity and impact. Ideal for summarizing key points, checklists, or action plans, it keeps your content professional and easy to follow. Fully customizable and compatible with PowerPoint, Keynote, and Google Slides for seamless presentation design.