


Features
- 6 Unique slides
- Fully editable and easy to edit in Microsoft Powerpoint, Keynote and Google Slides
- 16:9 widescreen layout
- Clean and professional designs
- Export to JPG, PDF or send by email


Do you have any questions?
Recommend


22 slides
Gold Research Proposal Presentation
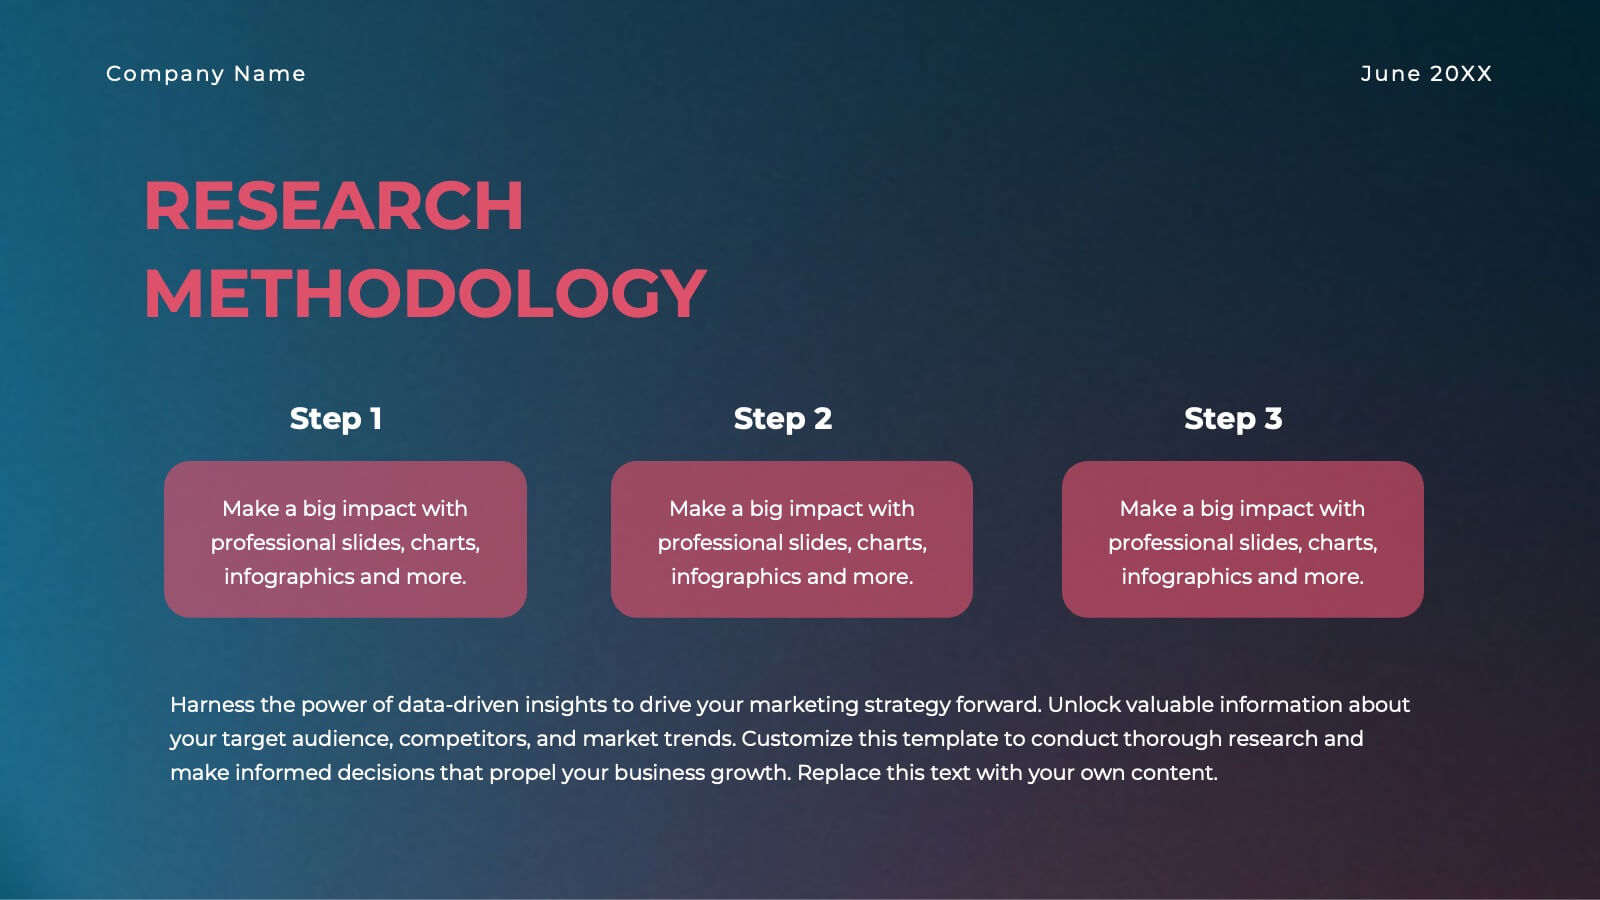
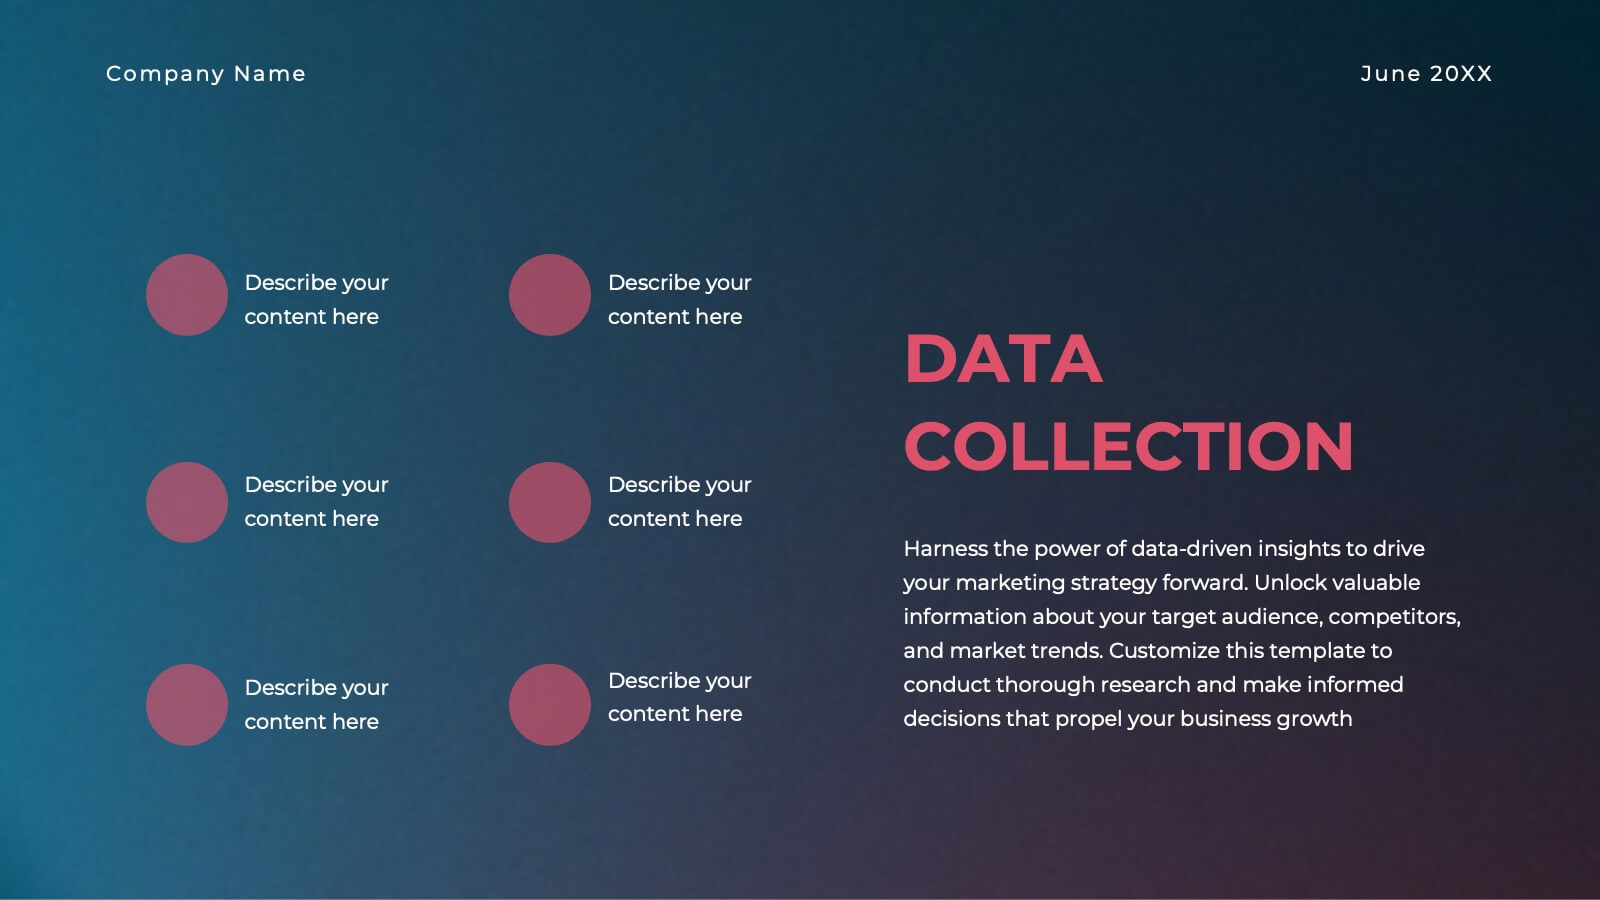
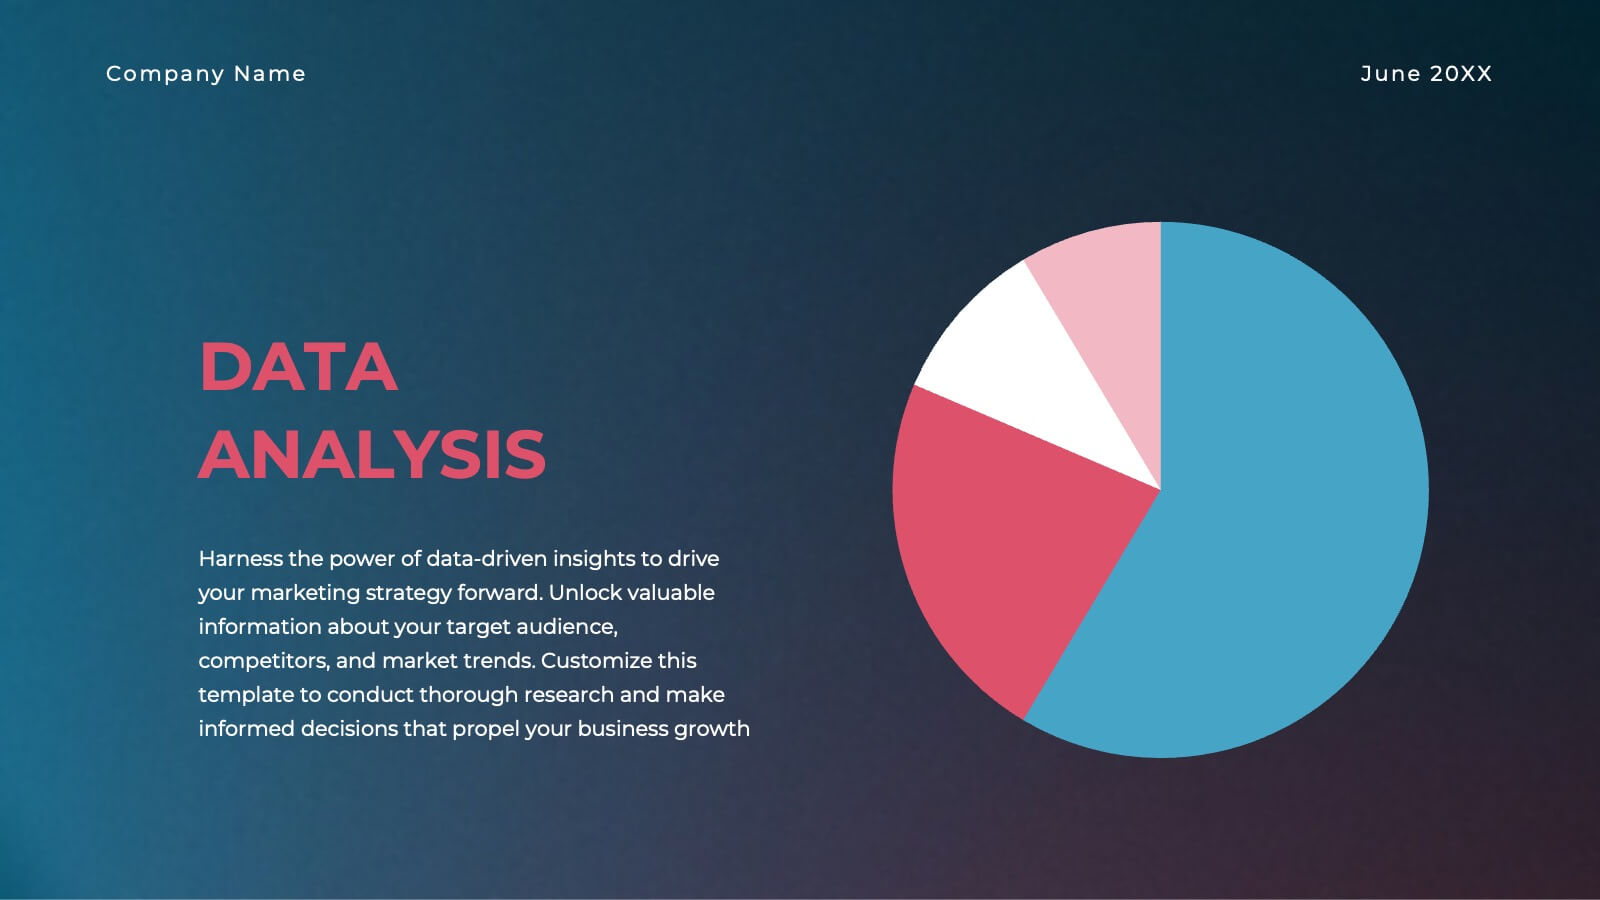
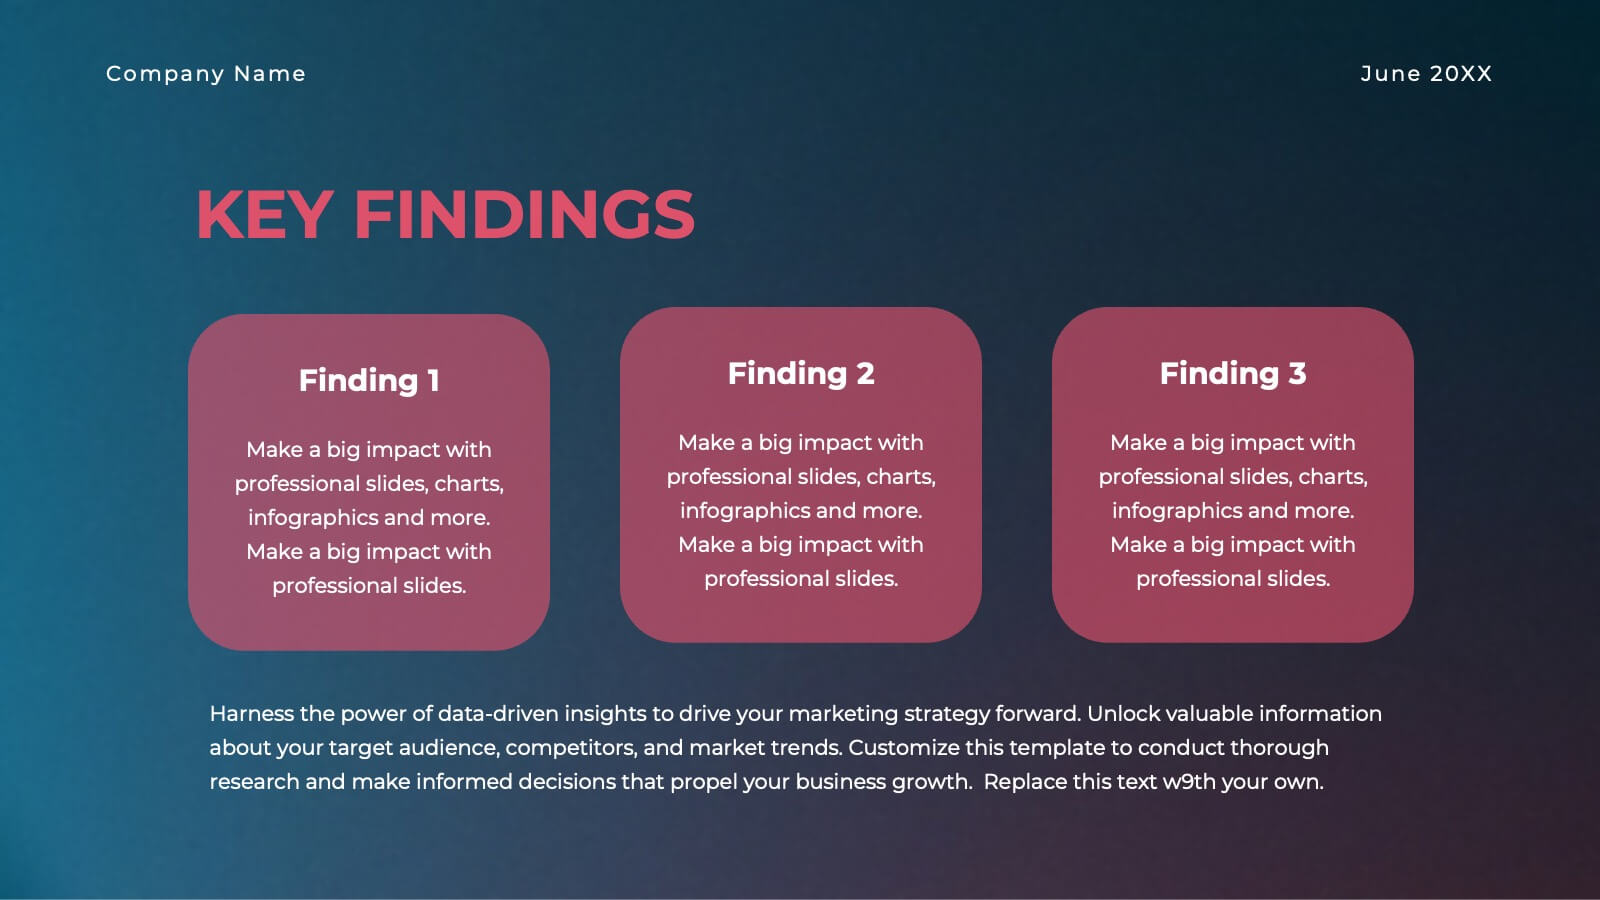
Present your research with impact using this sleek and modern research proposal template! Featuring sections for objectives, data collection, analysis, key findings, and recommendations, this template helps organize your research clearly and professionally. Fully customizable and compatible with PowerPoint, Keynote, and Google Slides, it's ideal for any research presentation.
22 slides
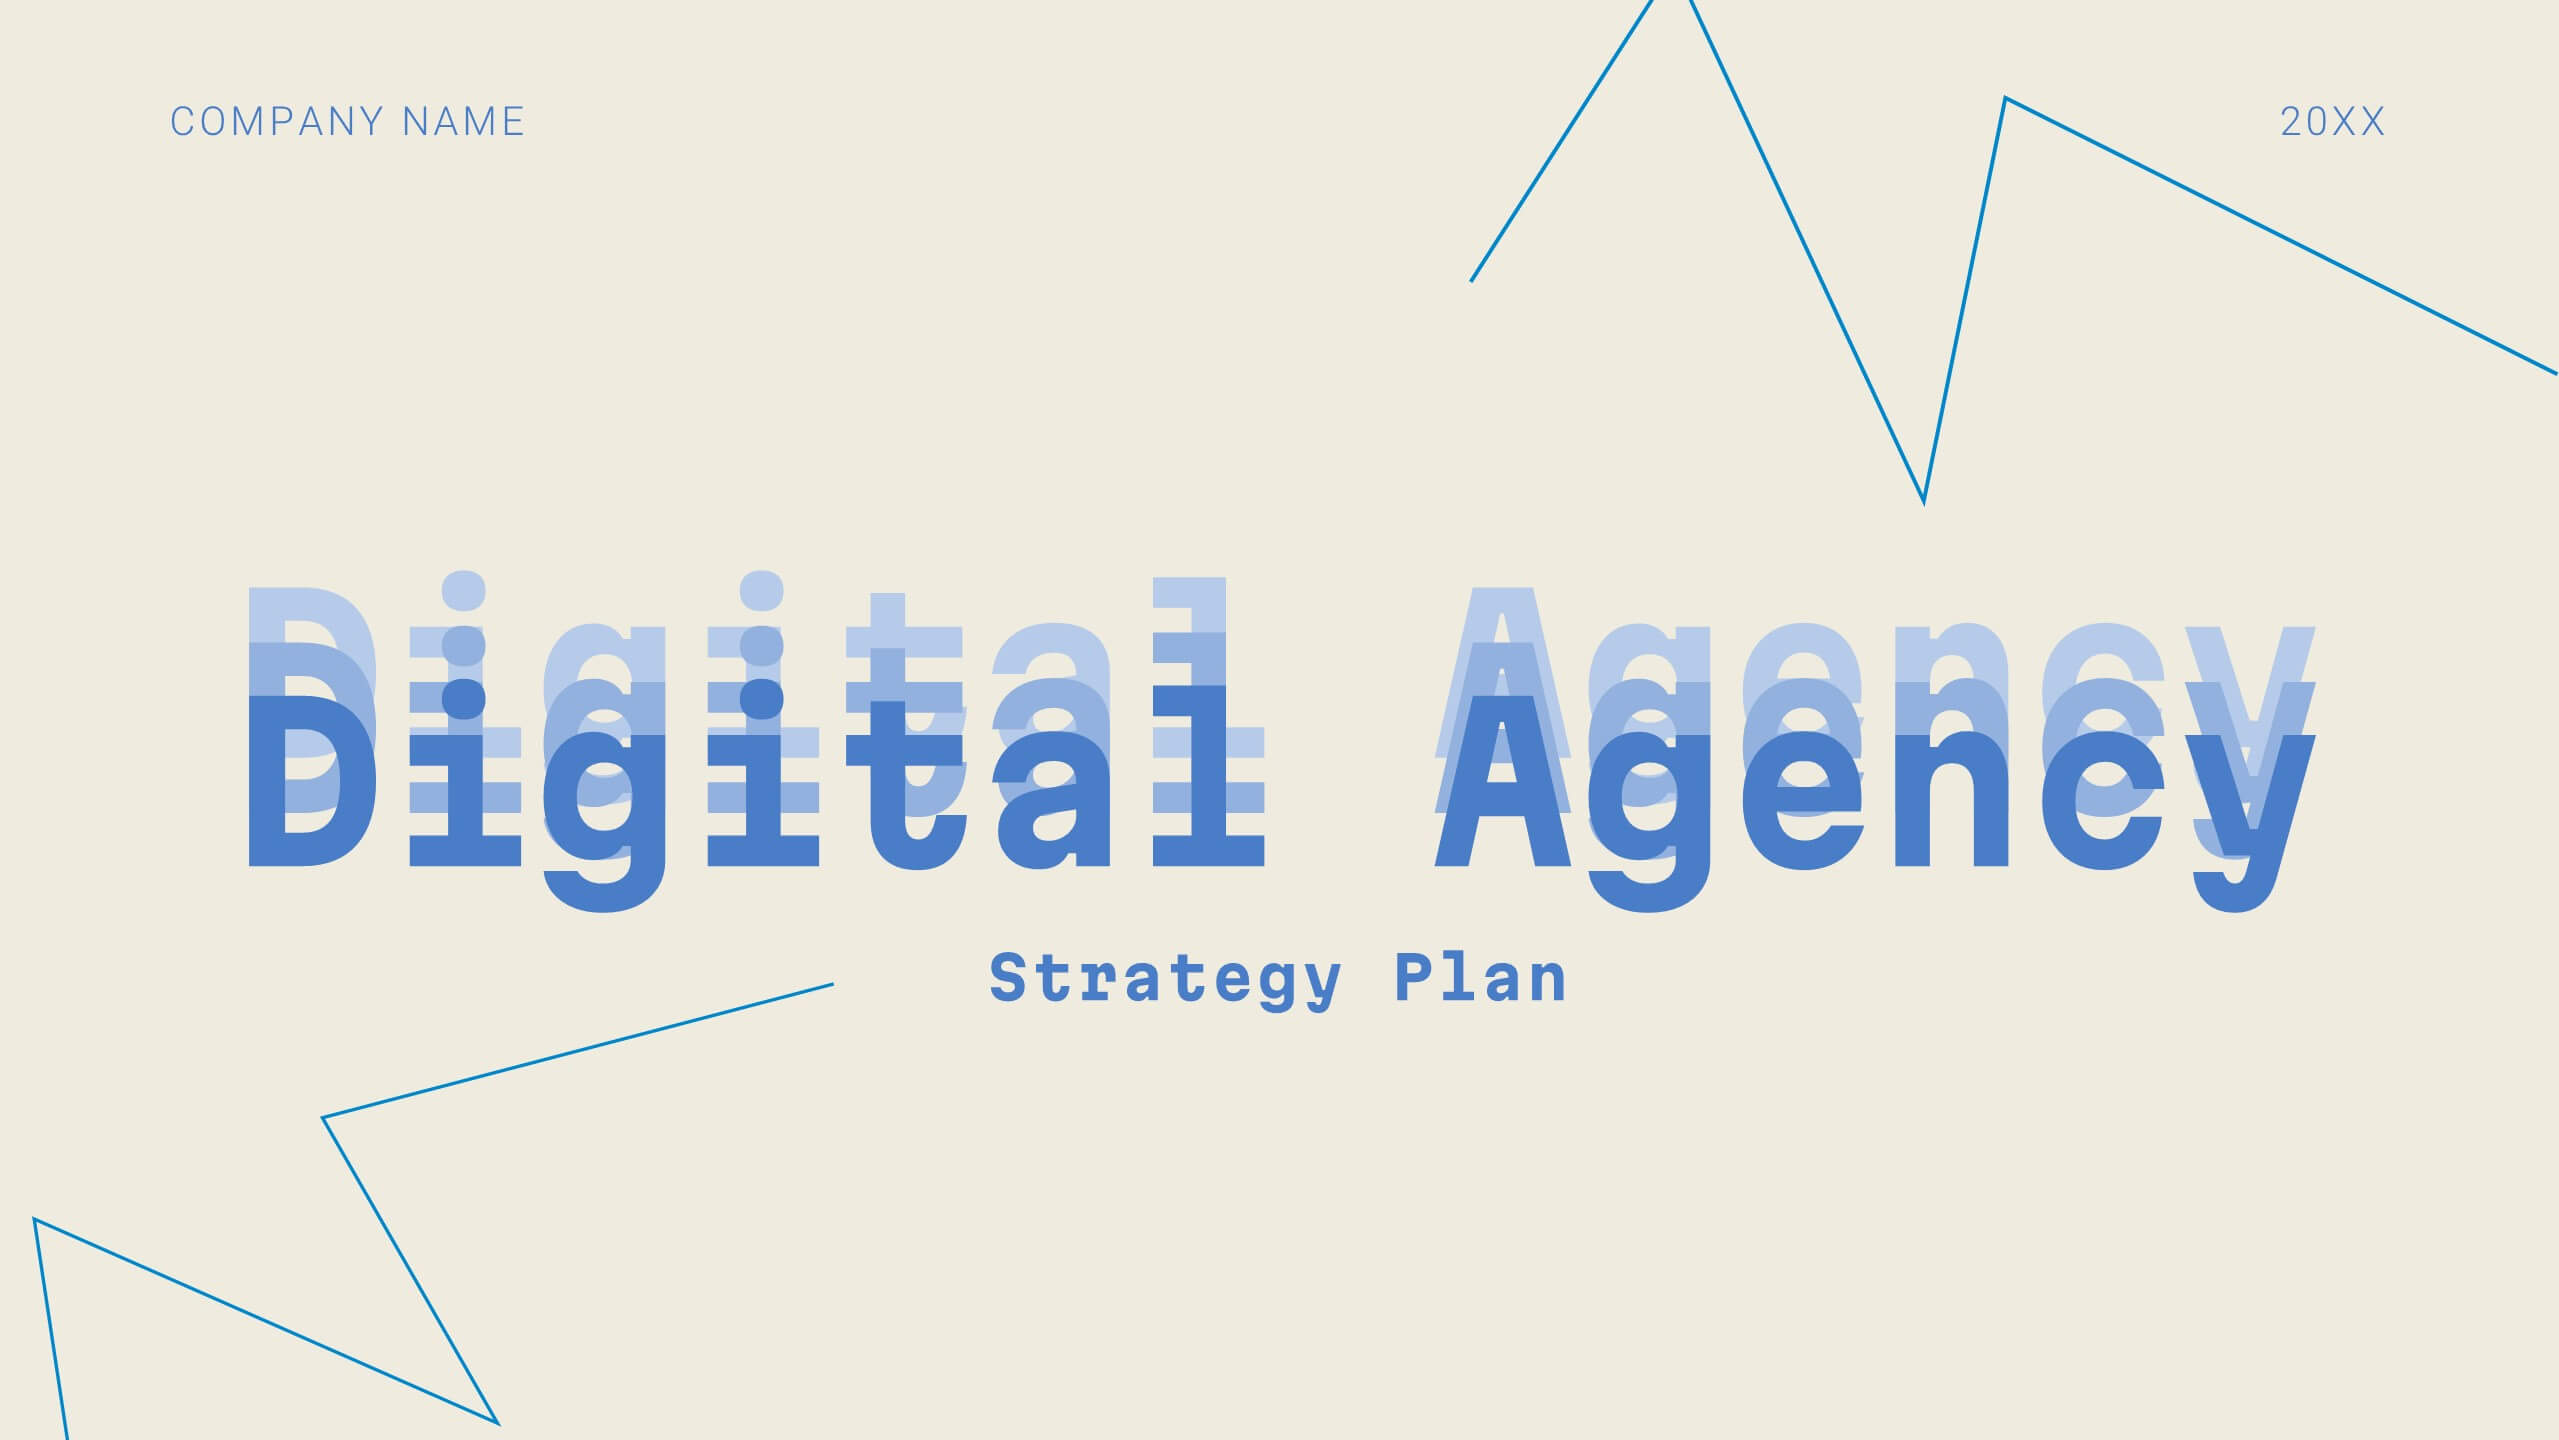
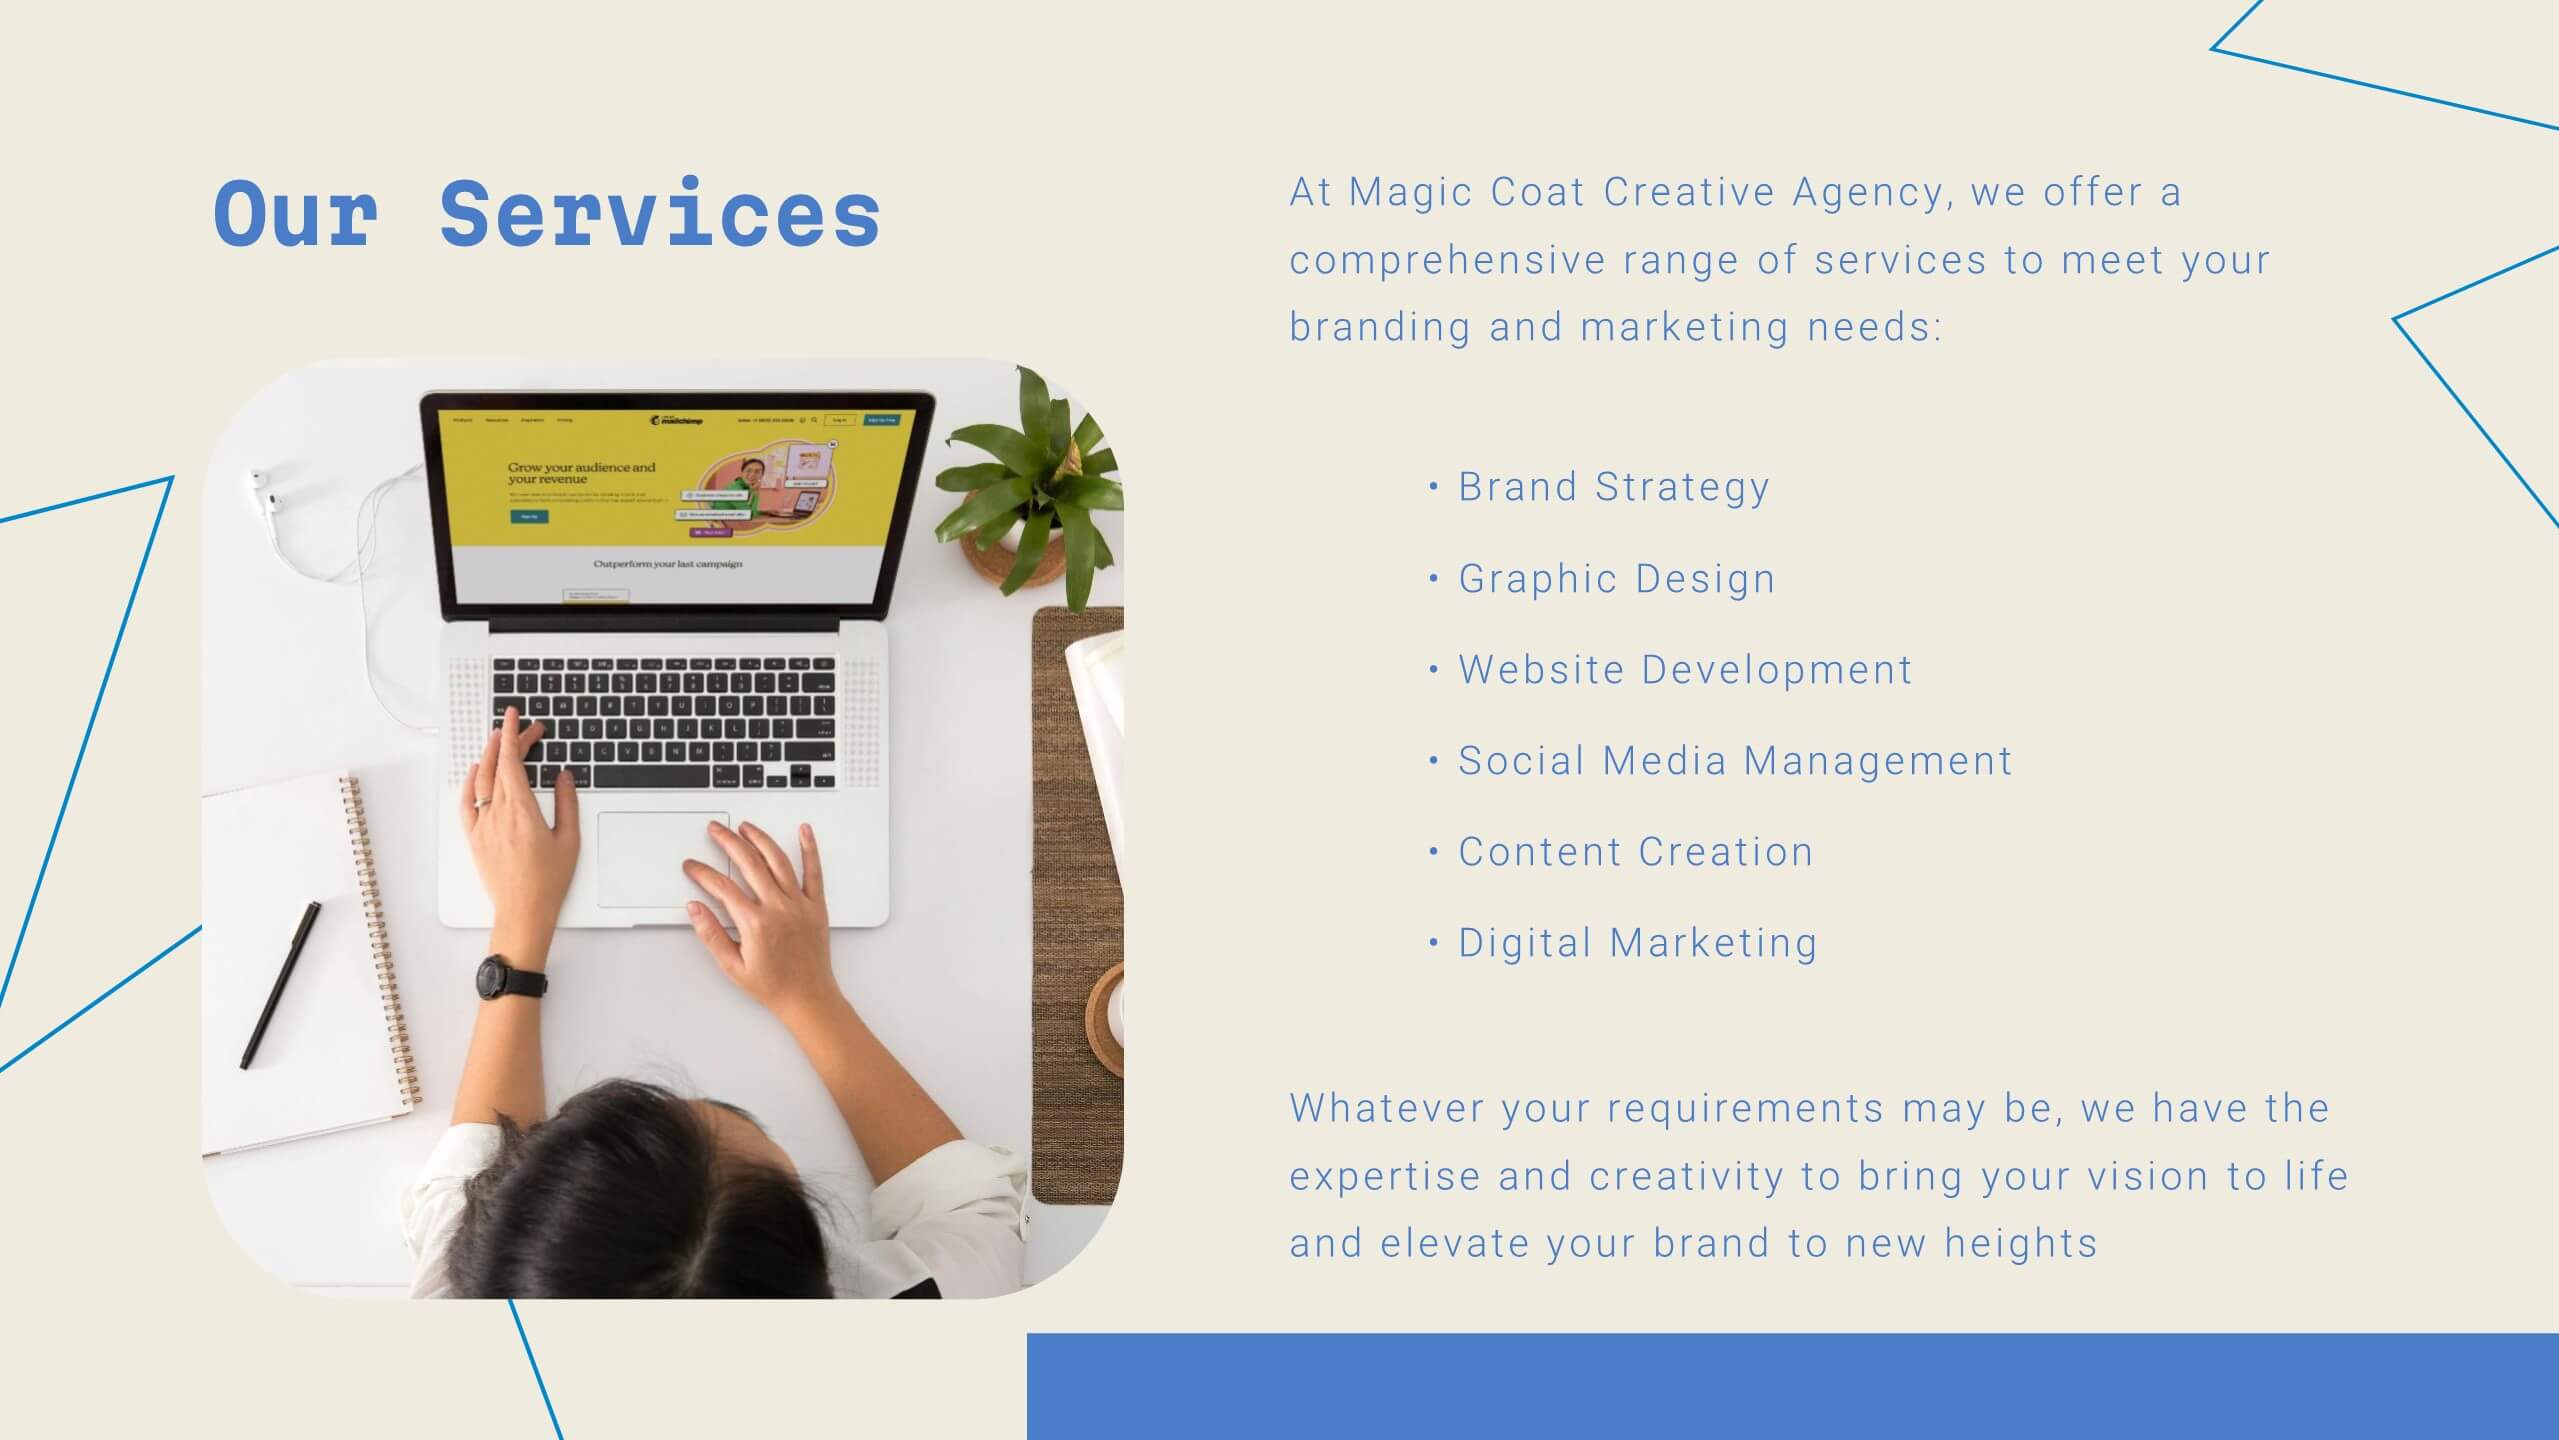
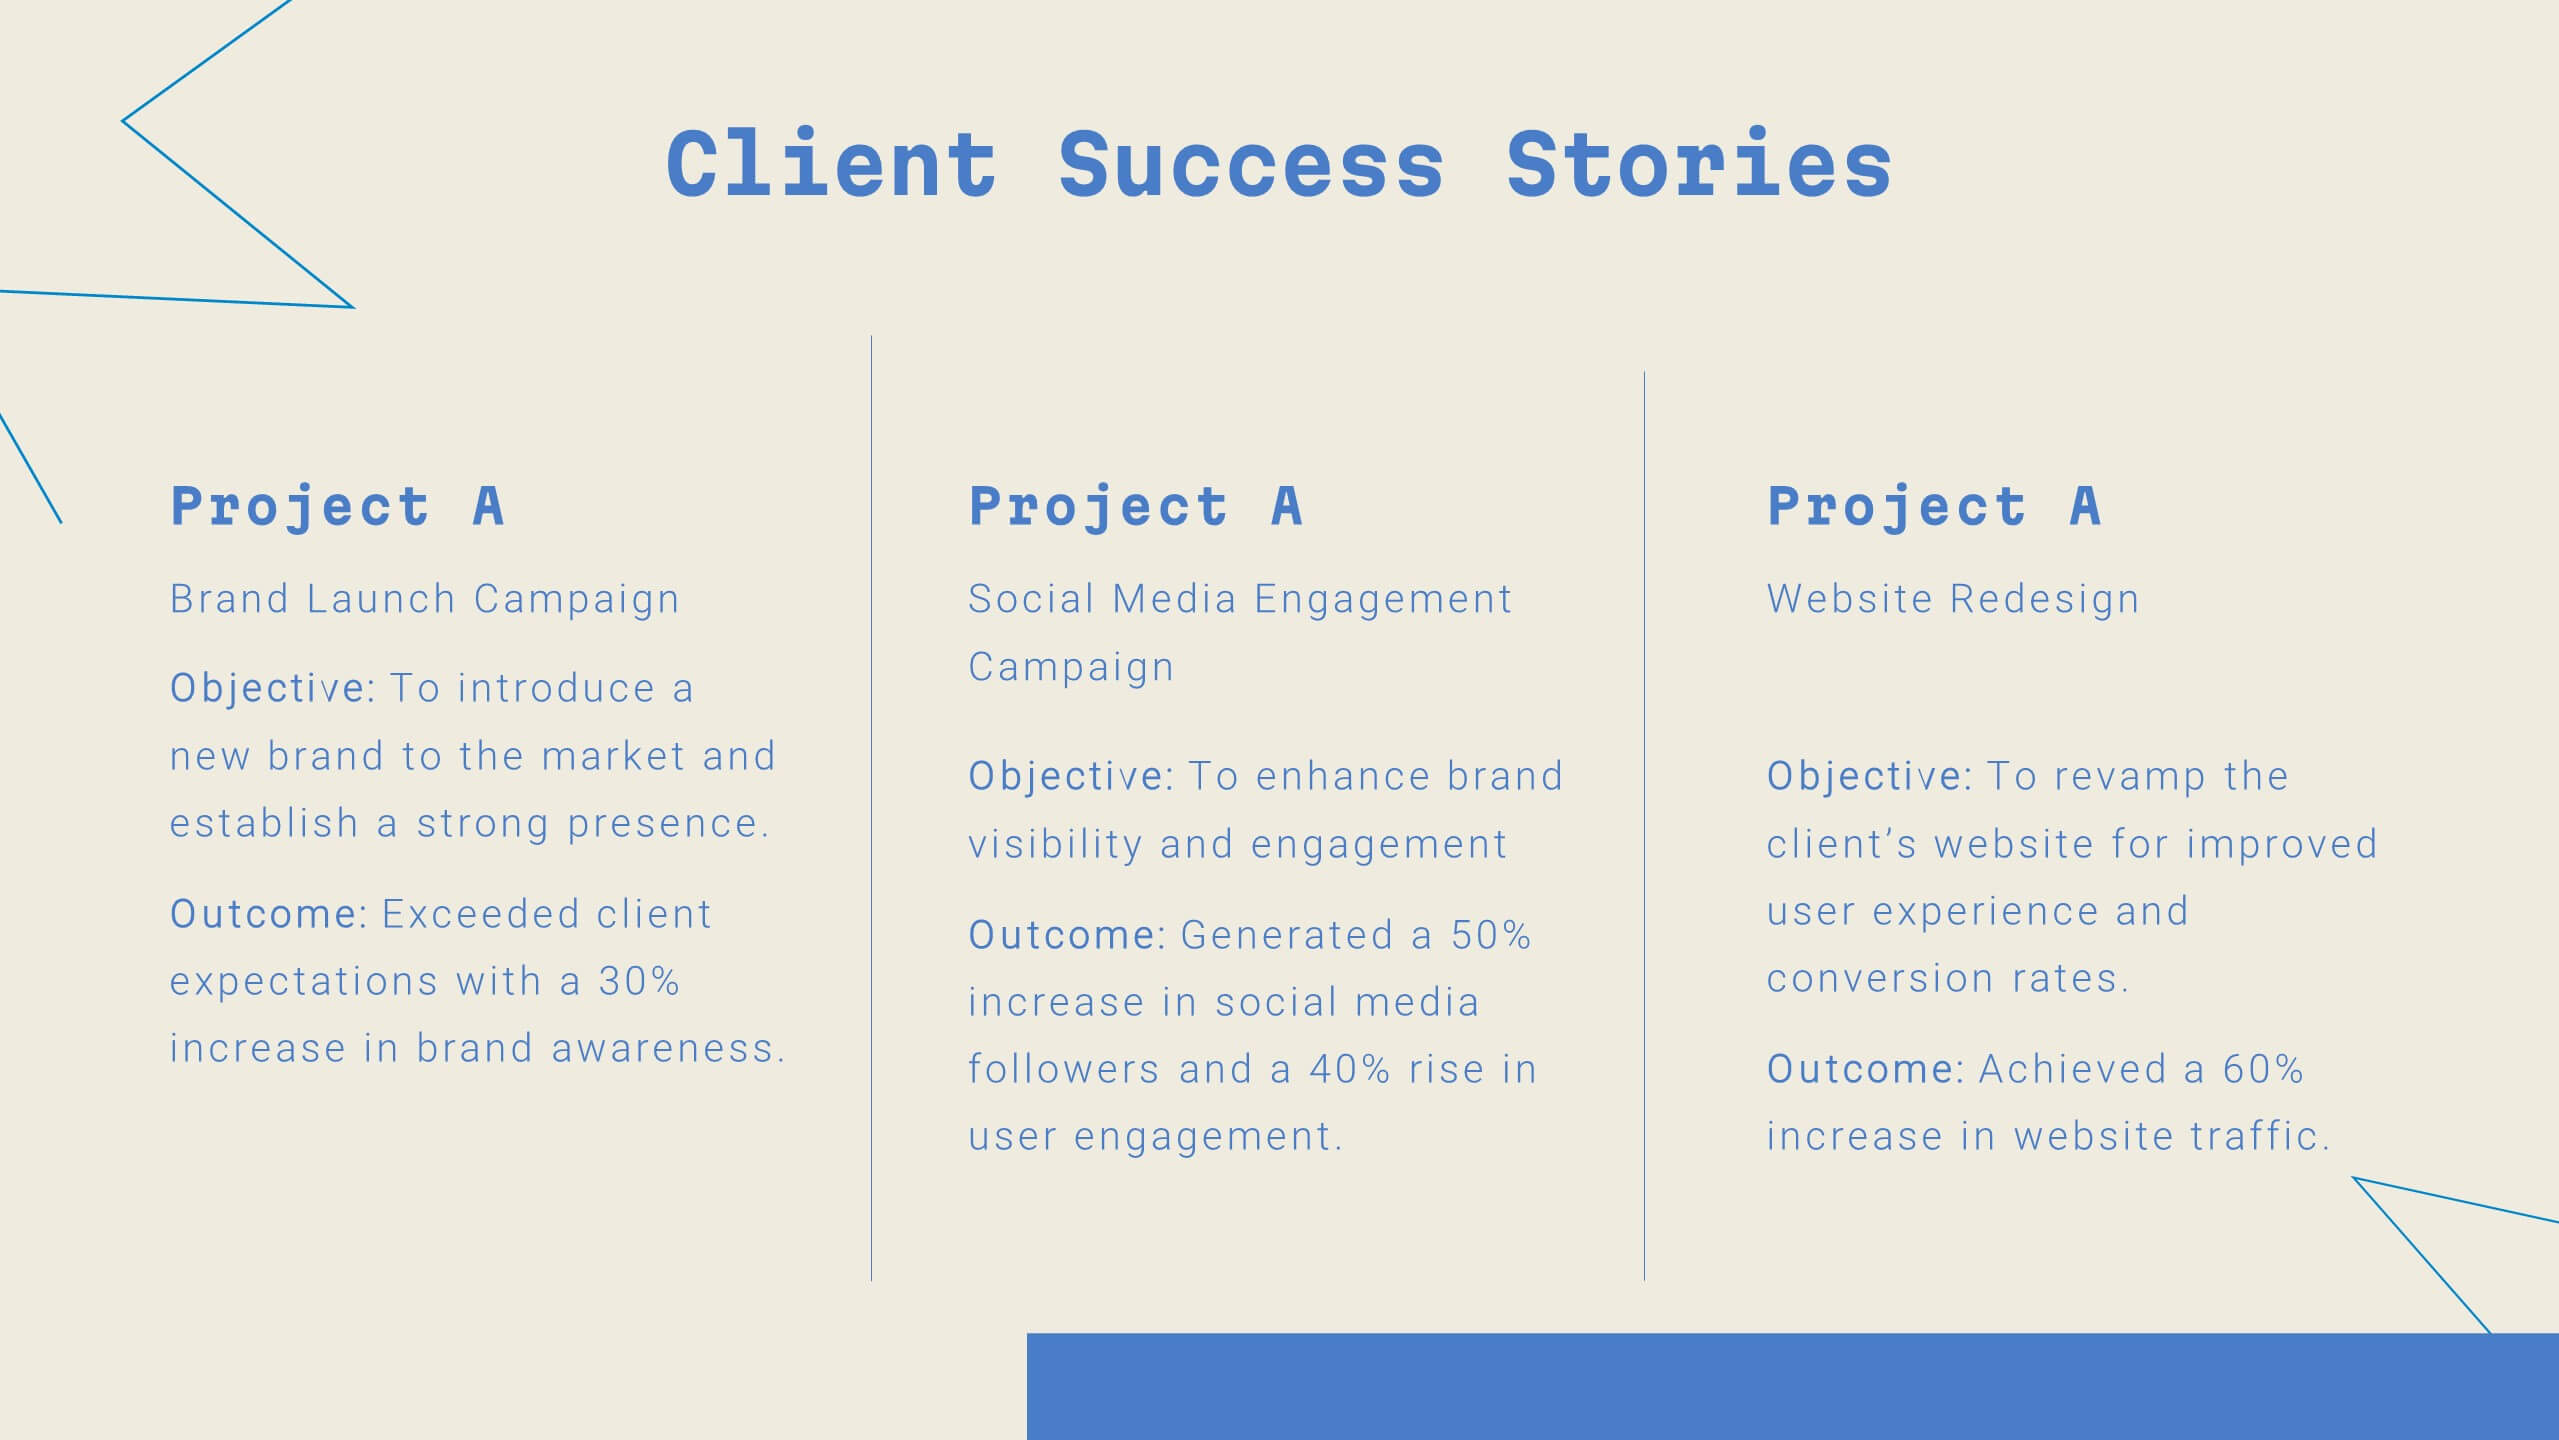
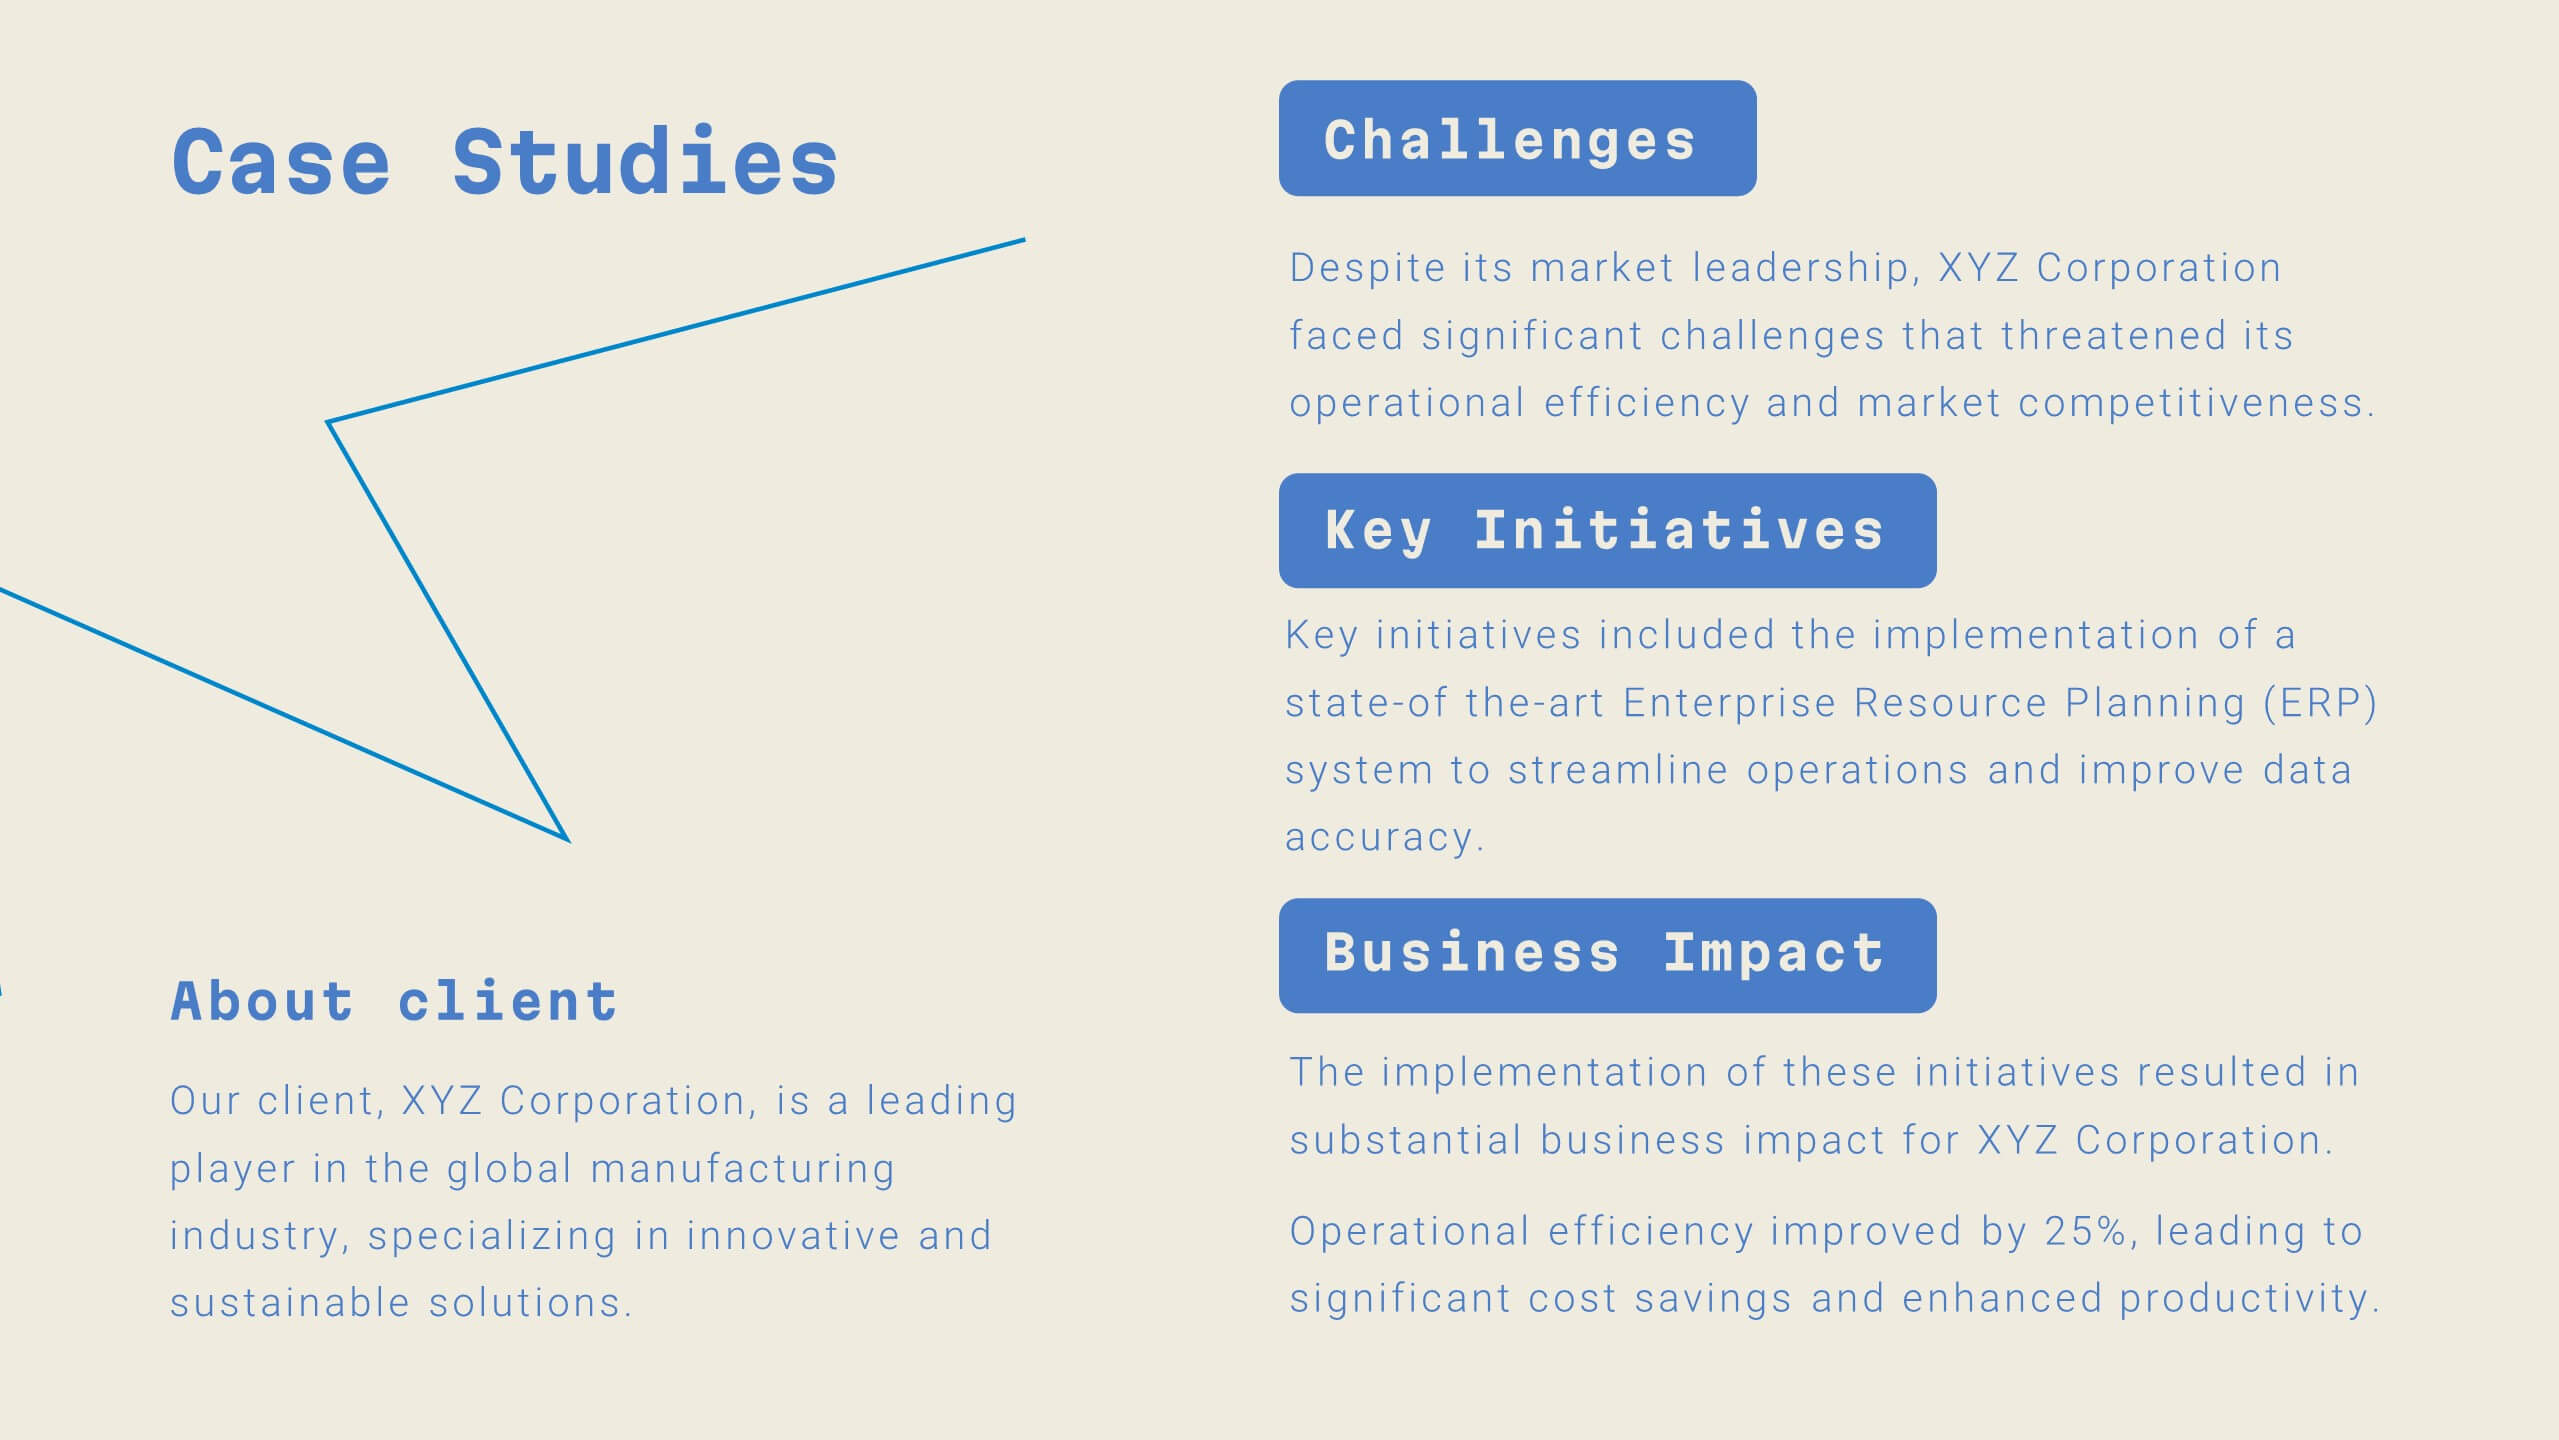
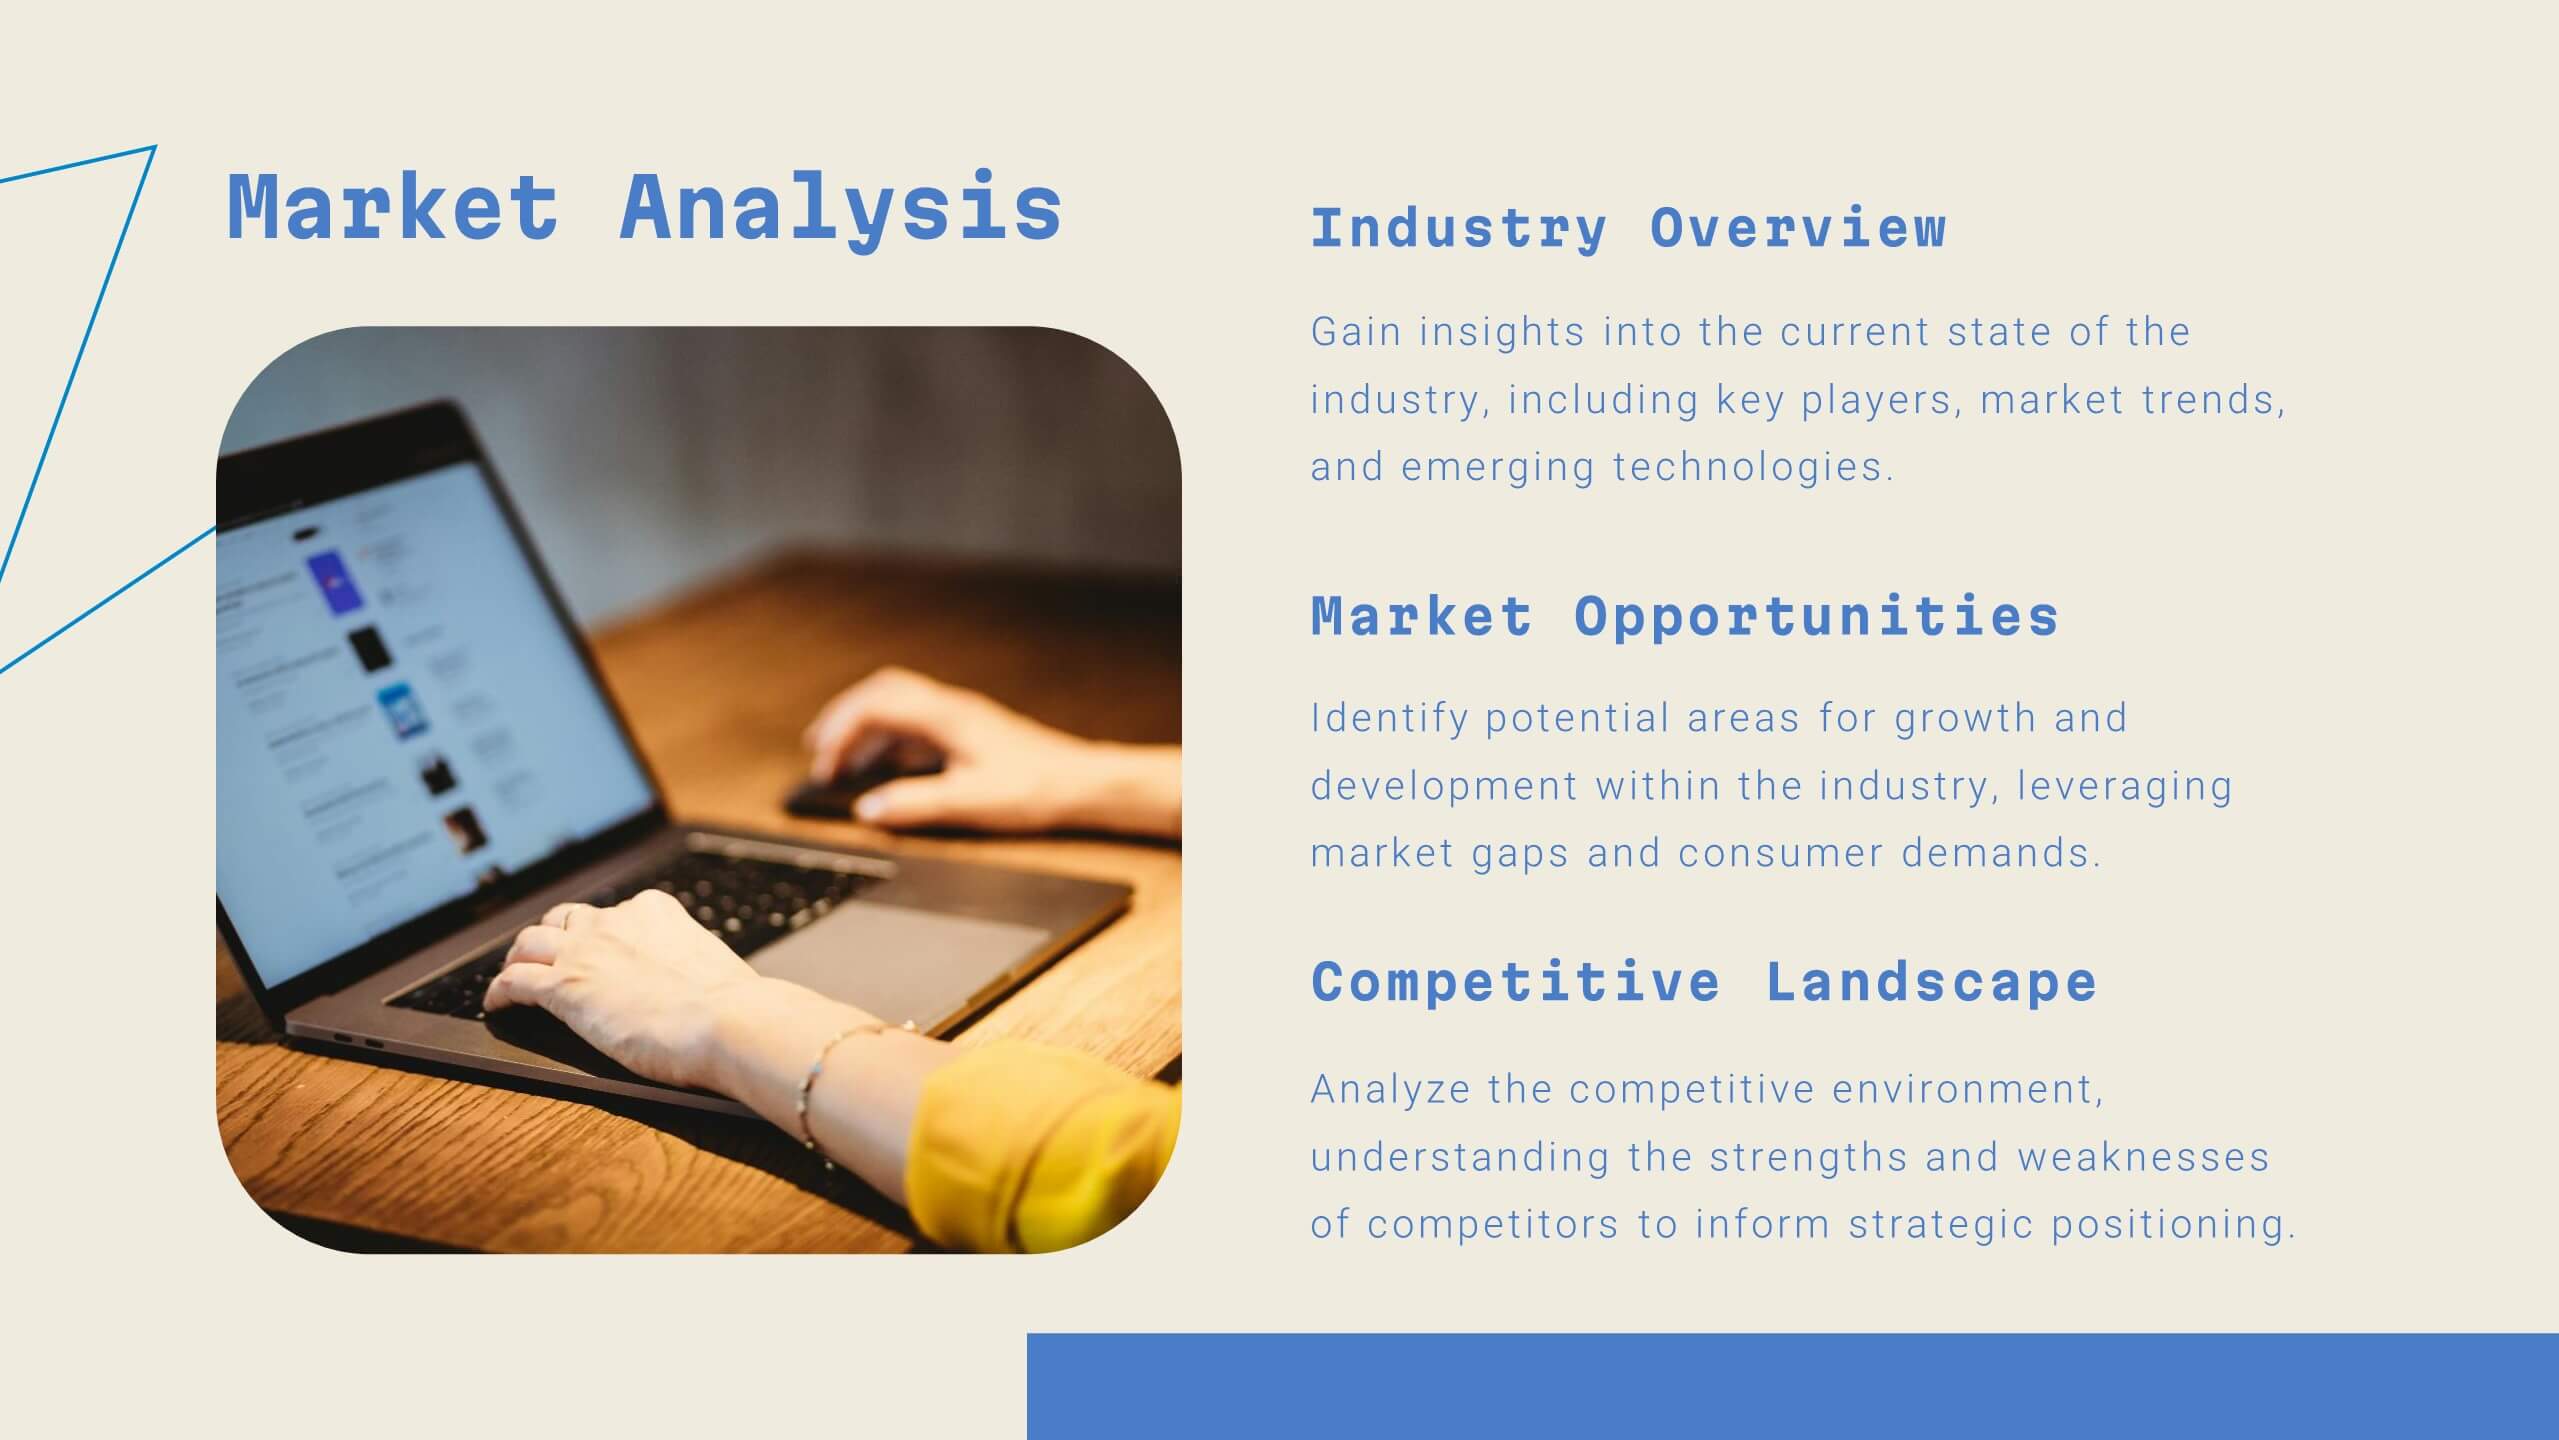
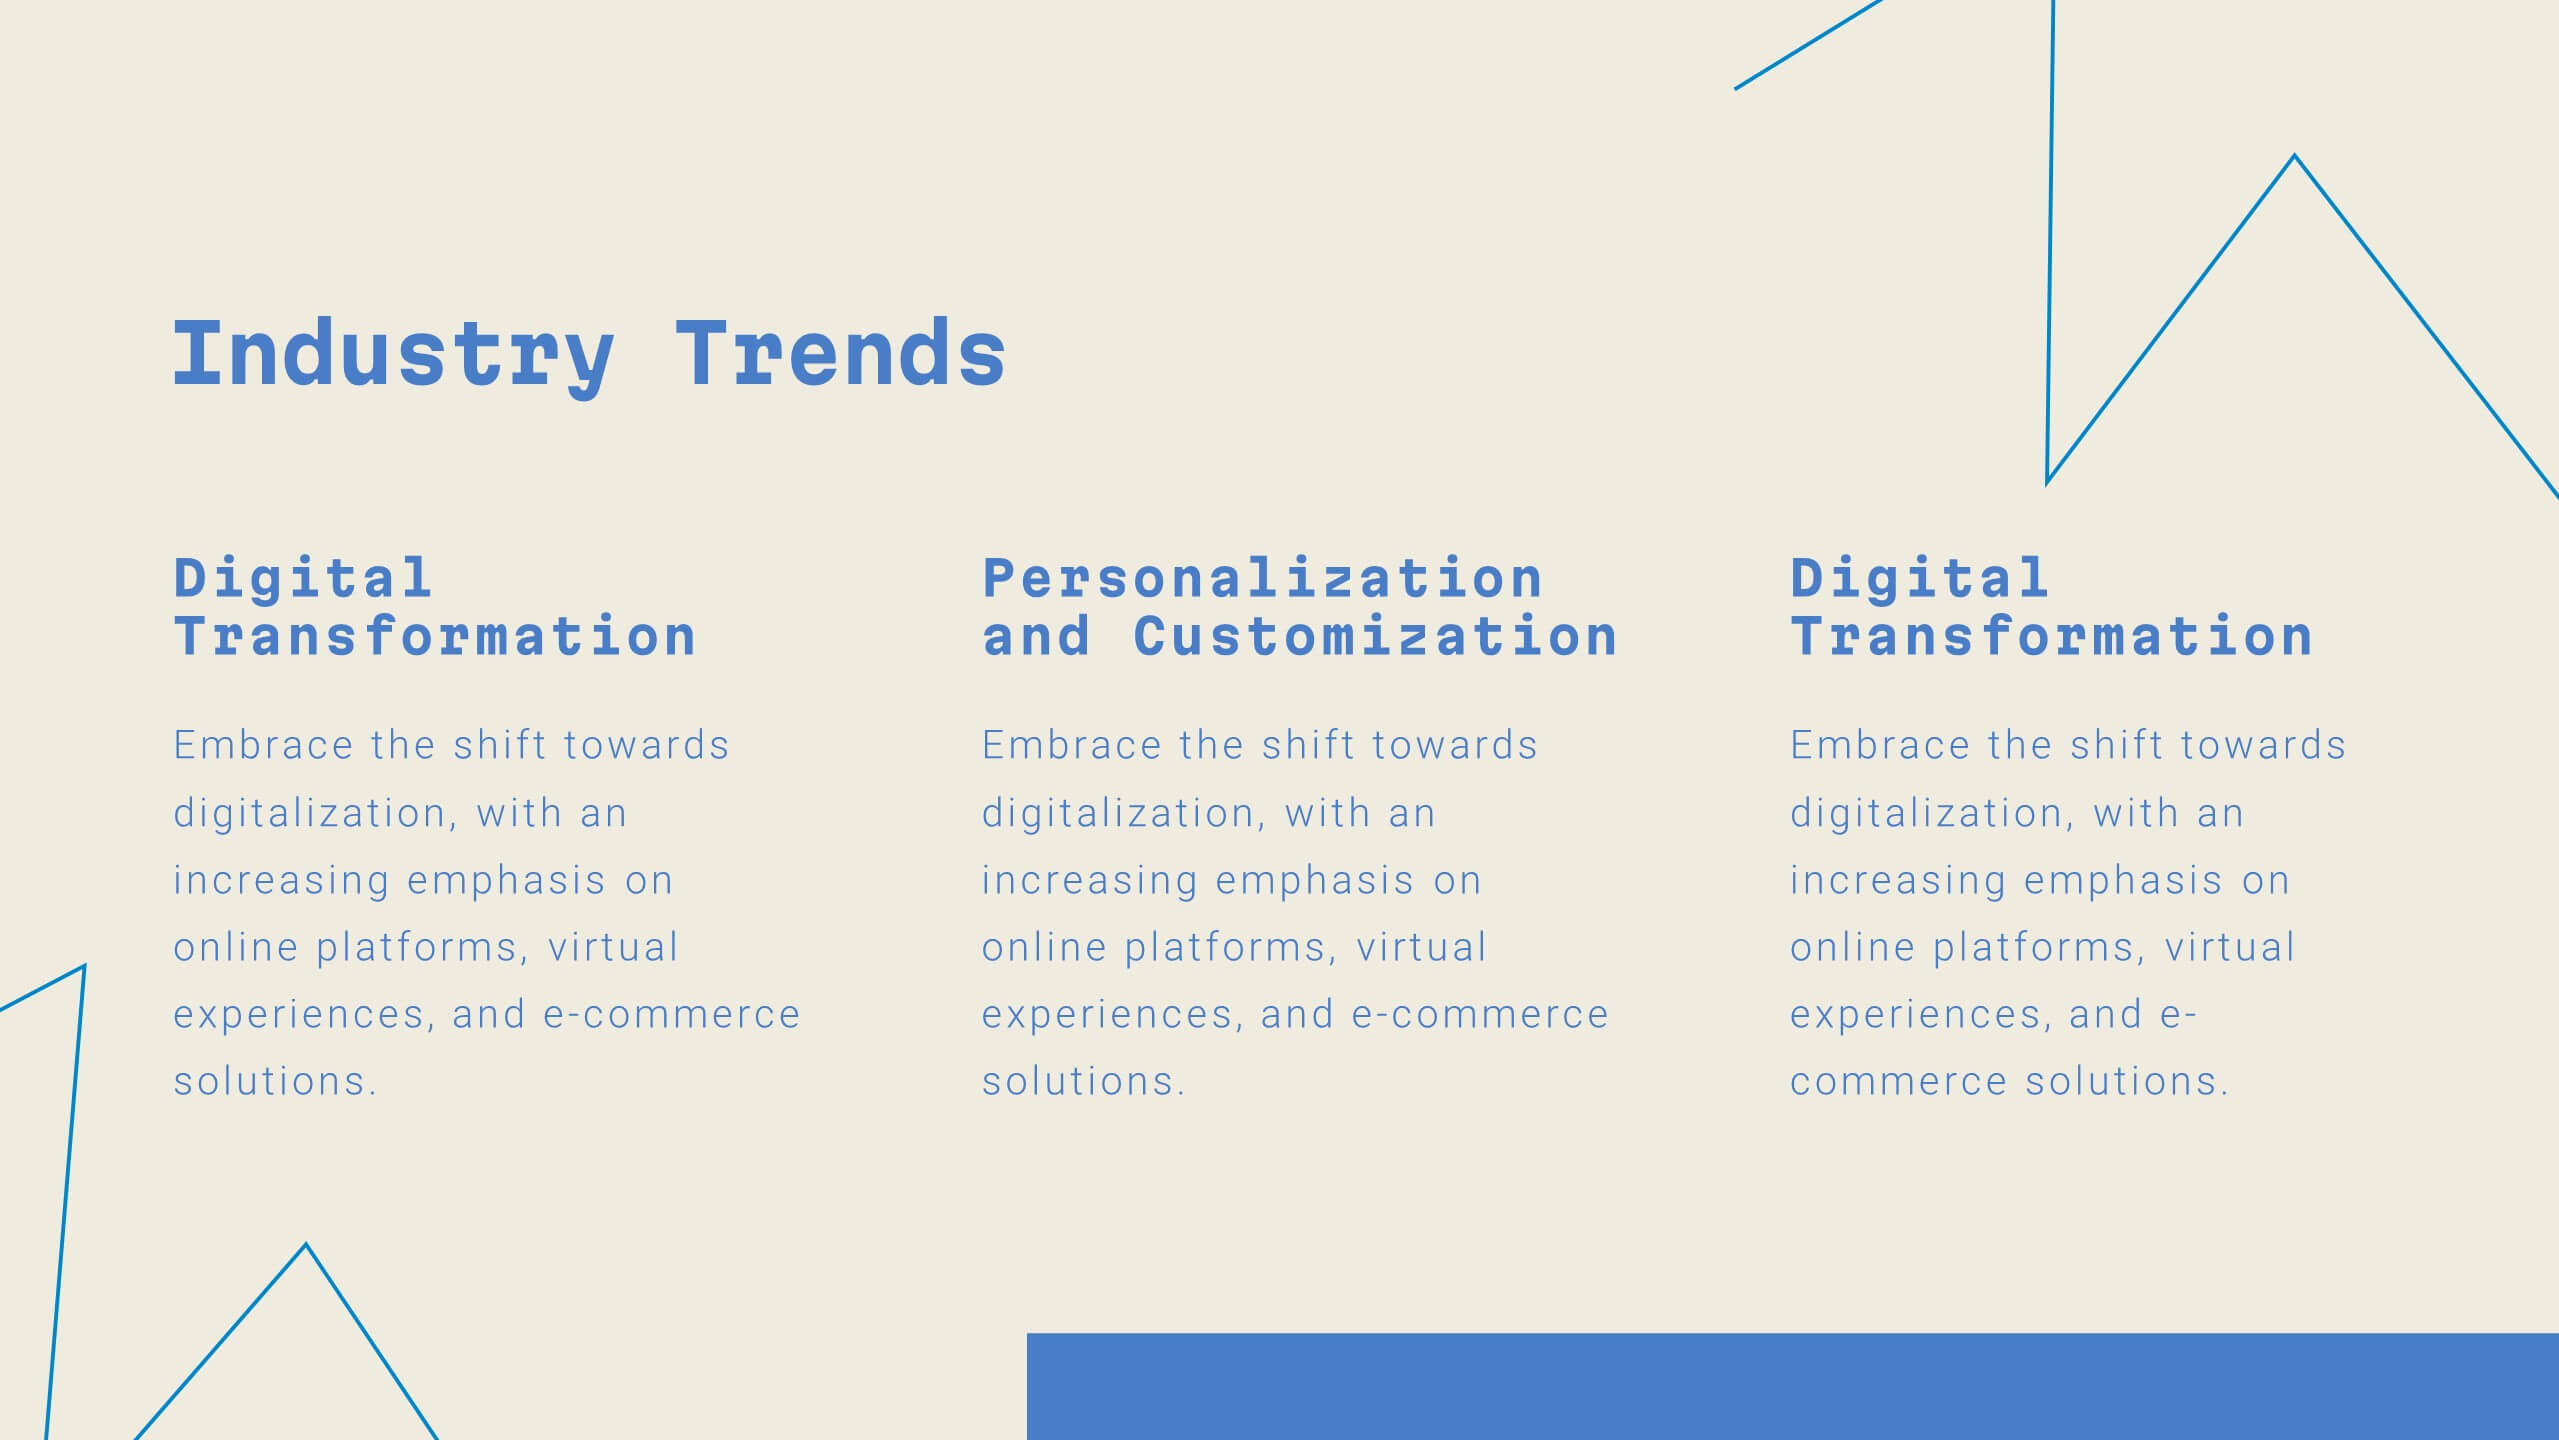
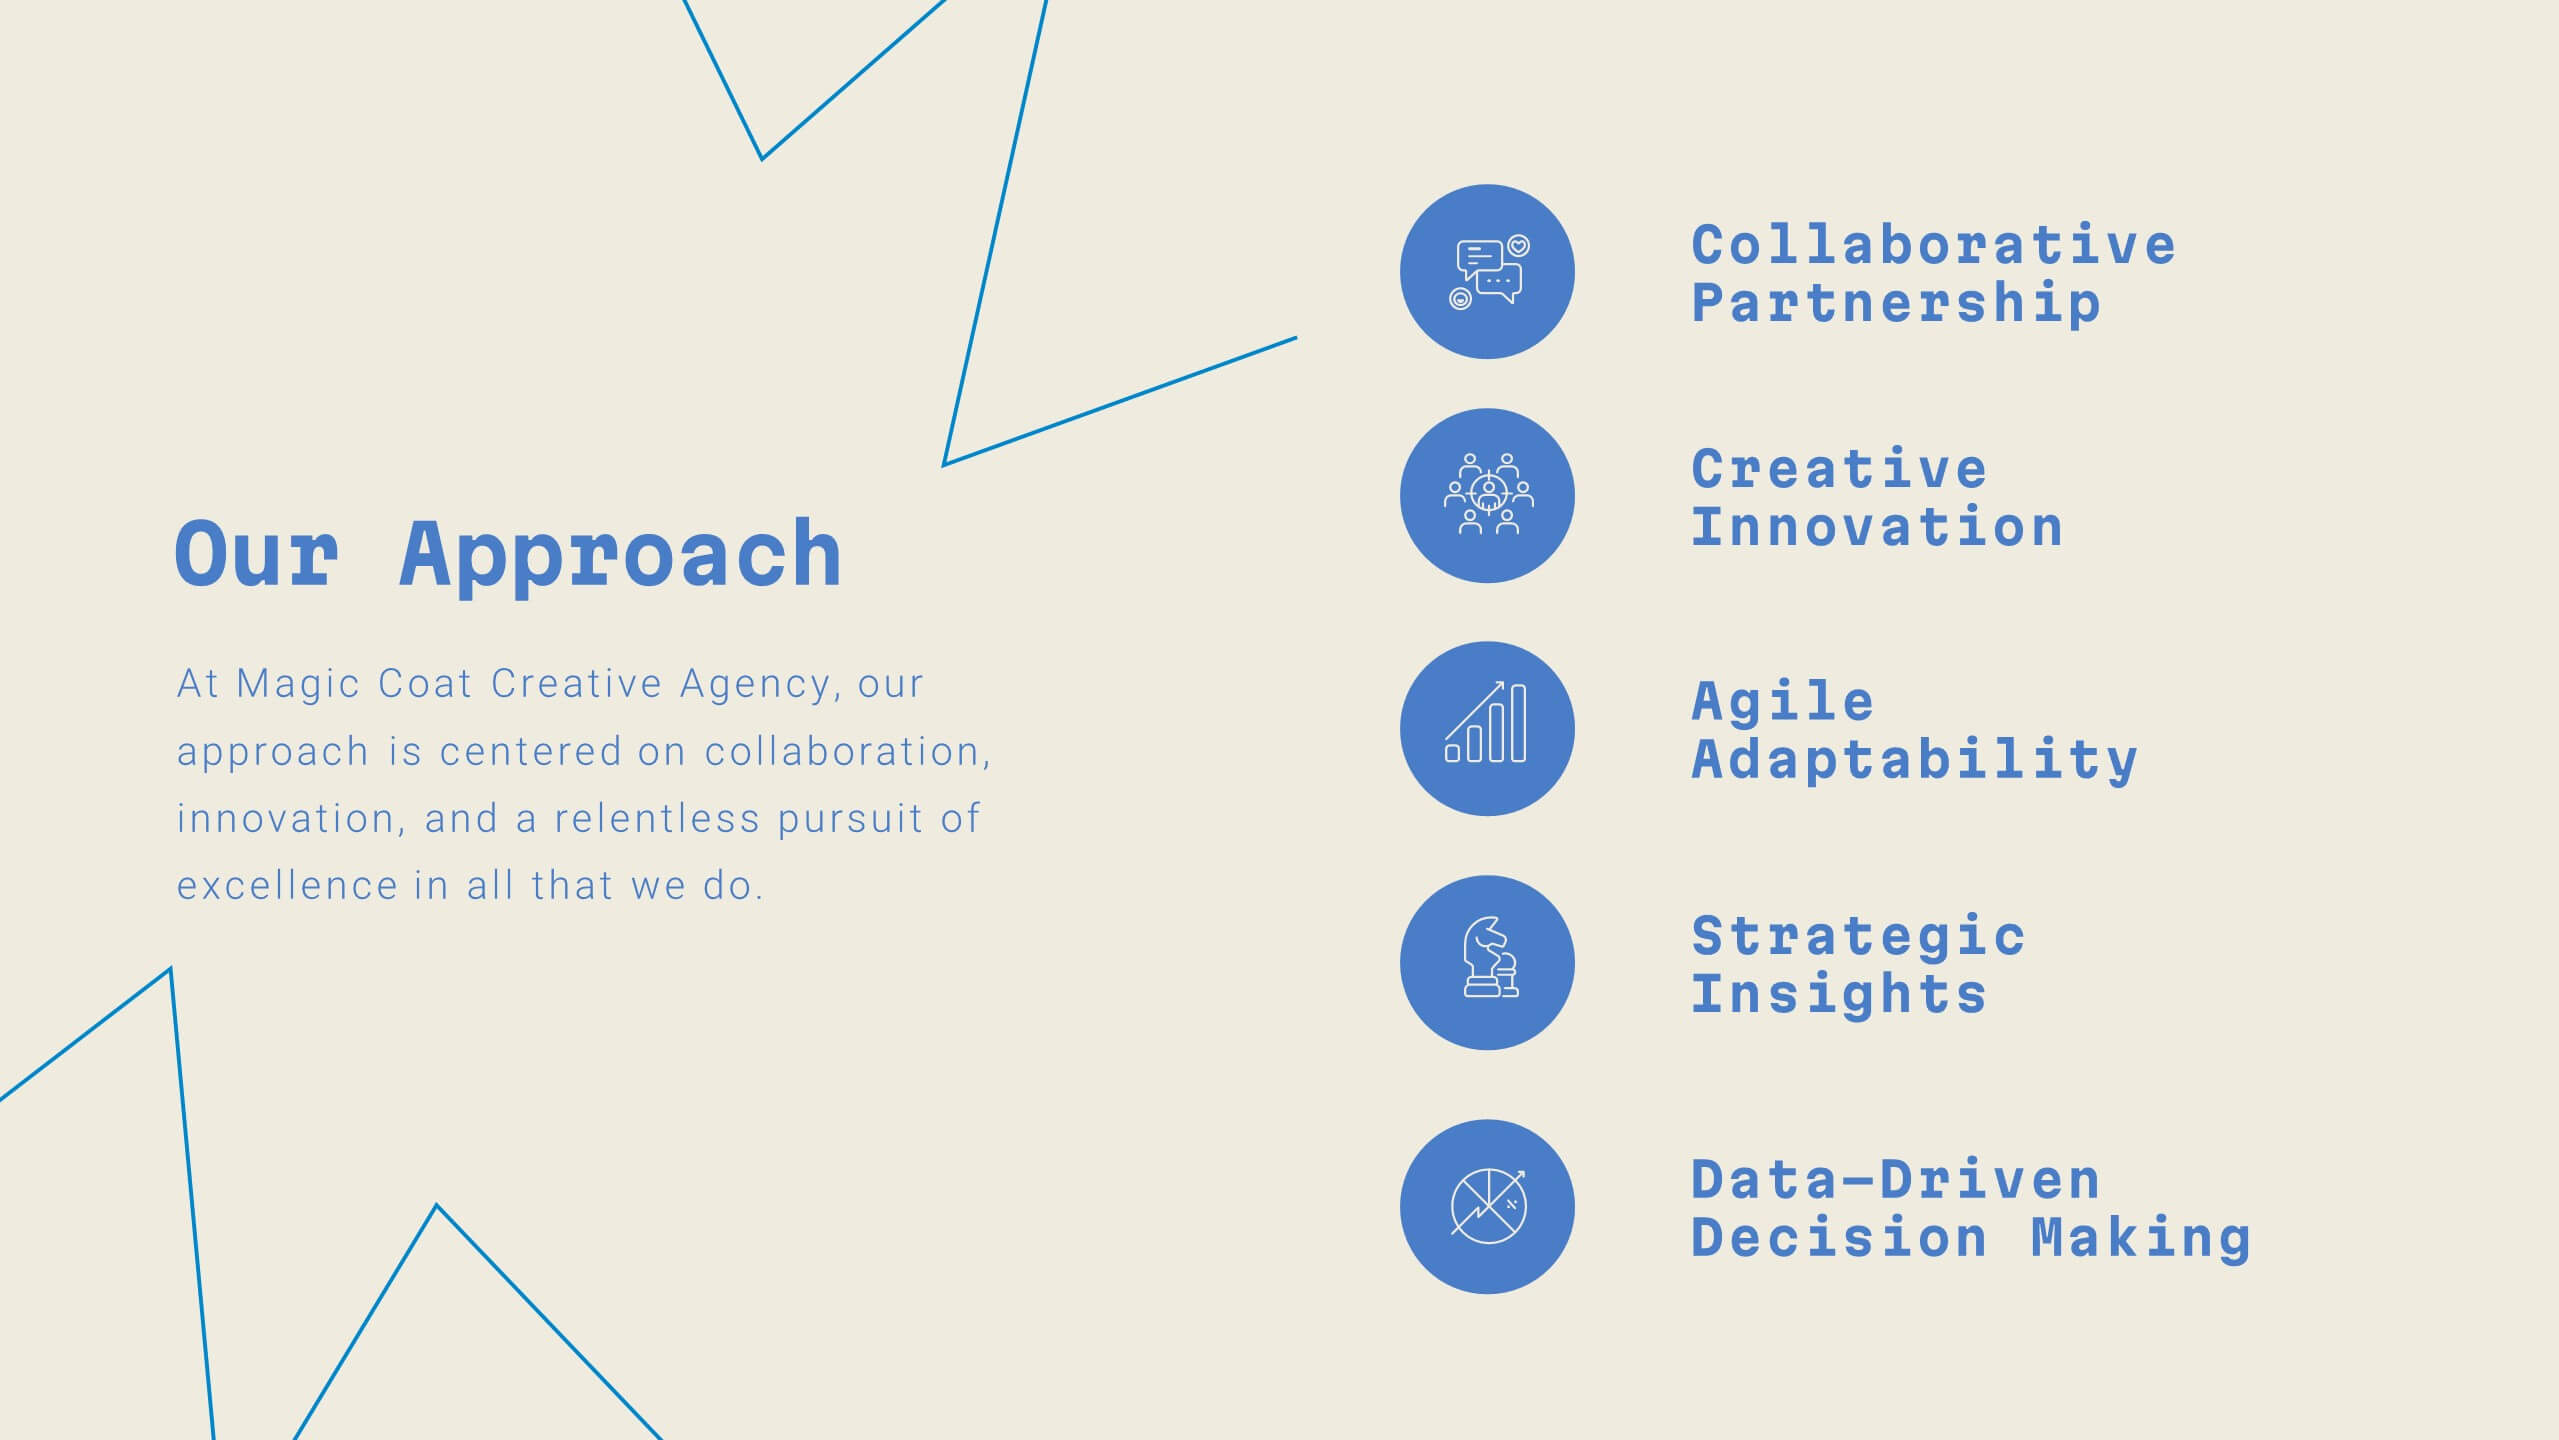
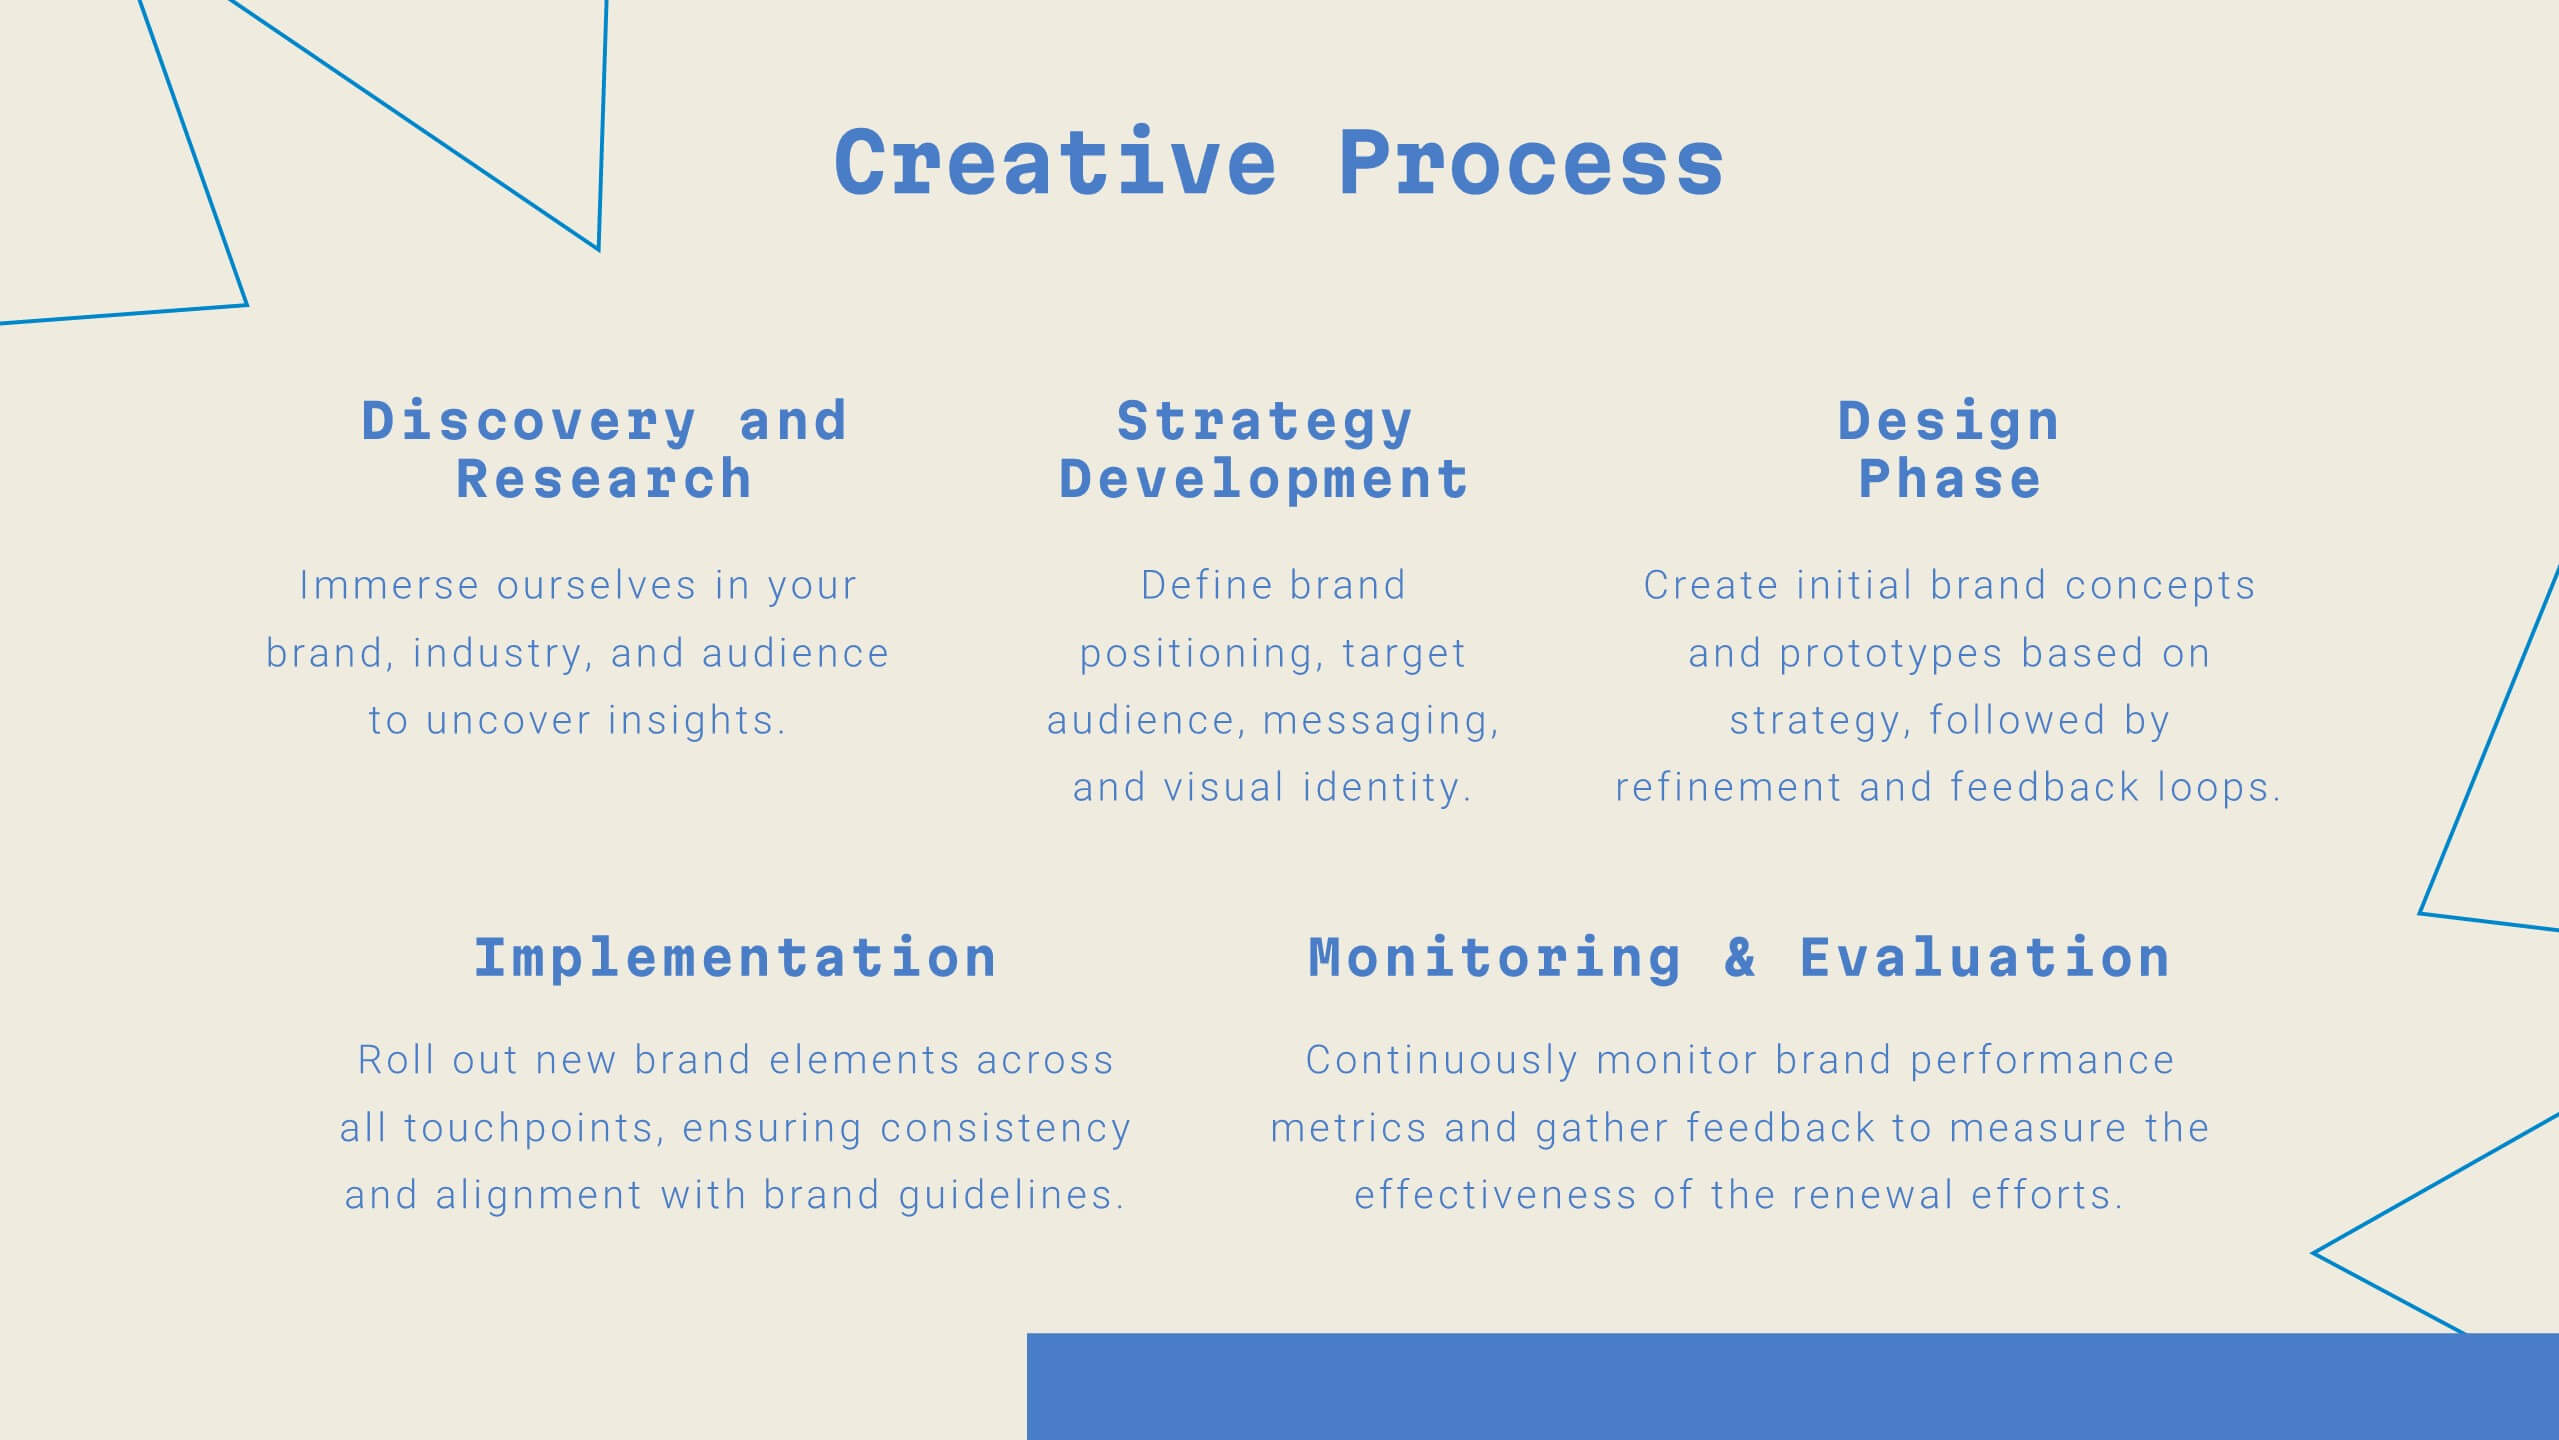
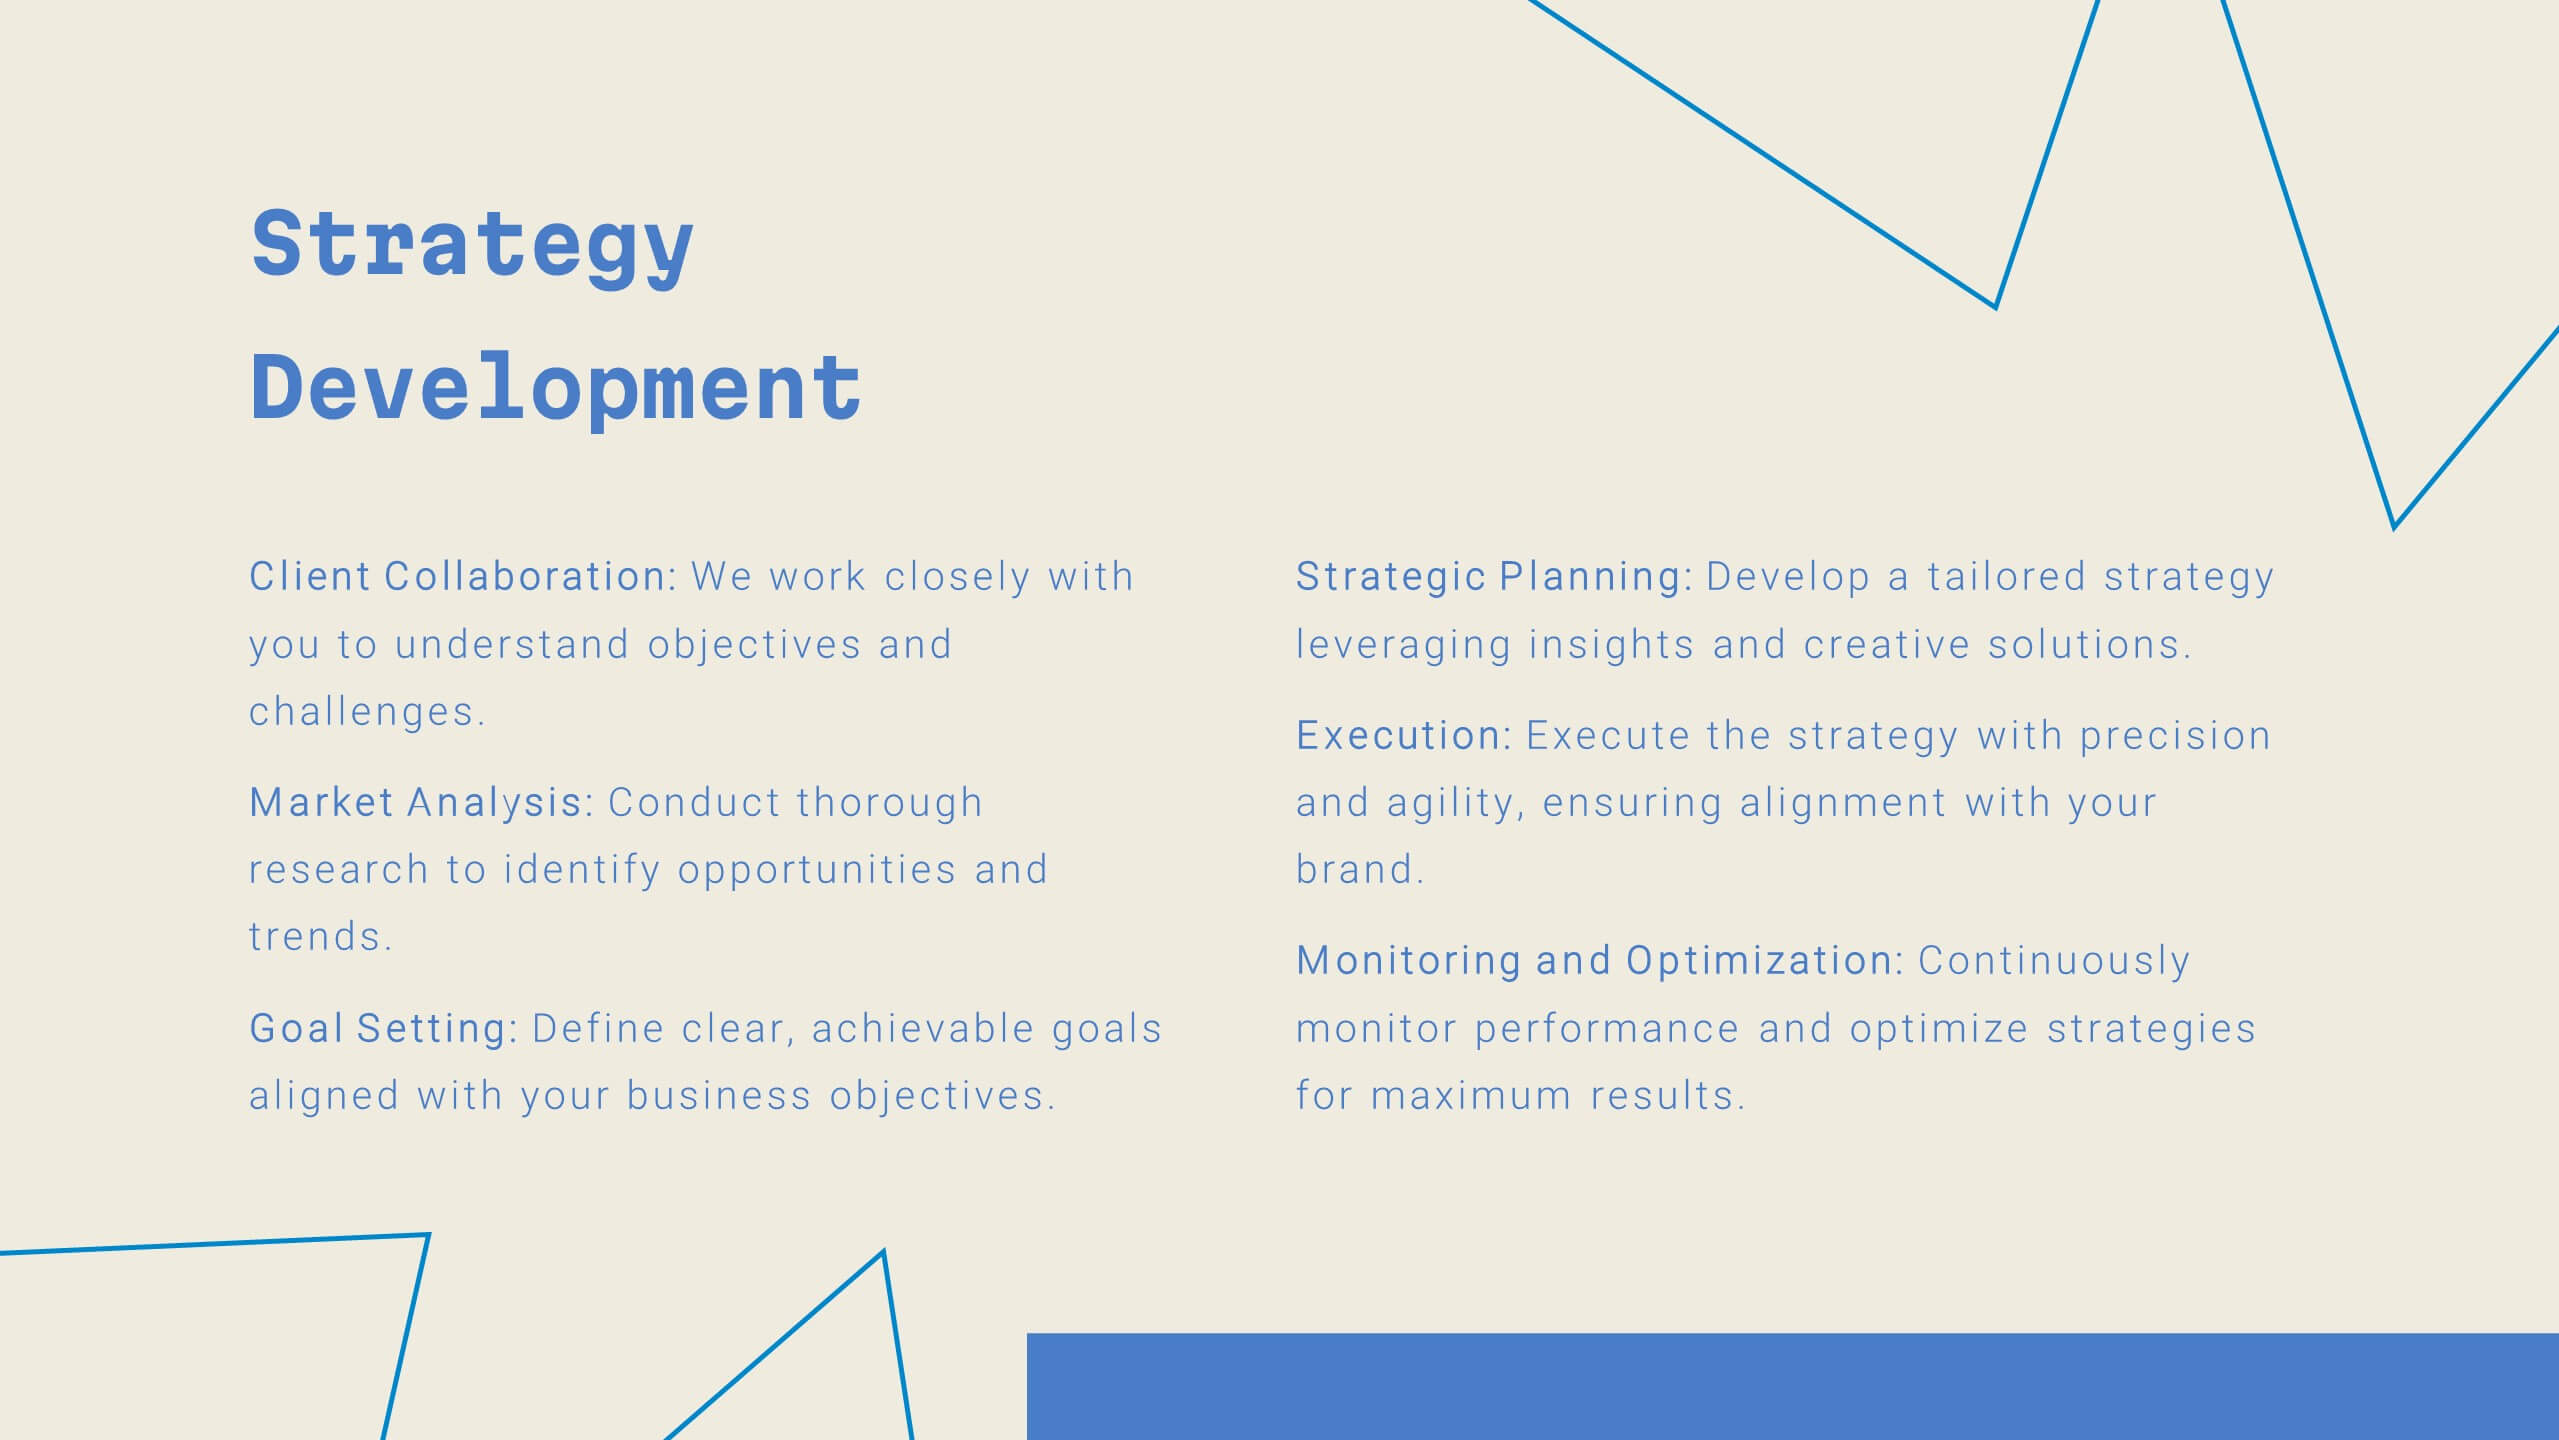
Unity Digital Agency Strategy Plan Presentation
Step into the future of digital marketing with this sleek template! From case studies to strategy development, it offers a comprehensive guide for creating impactful presentations. Highlight client success stories, industry trends, and creative processes with ease. Perfect for showcasing your agency's expertise. Compatible with PowerPoint, Keynote, and Google Slides.


8 slides
Social Media Engagement Metrics
Track engagement with clarity using the Social Media Engagement Metrics Presentation. This layout features a smartphone mockup at the center, with four vertically stacked icons representing key engagement indicators. Surrounding the device, space is allocated for concise data insights or definitions labeled A through D. Perfect for presenting analytics like likes, shares, comments, and reach. Fully editable in PowerPoint, Keynote, and Google Slides.


8 slides
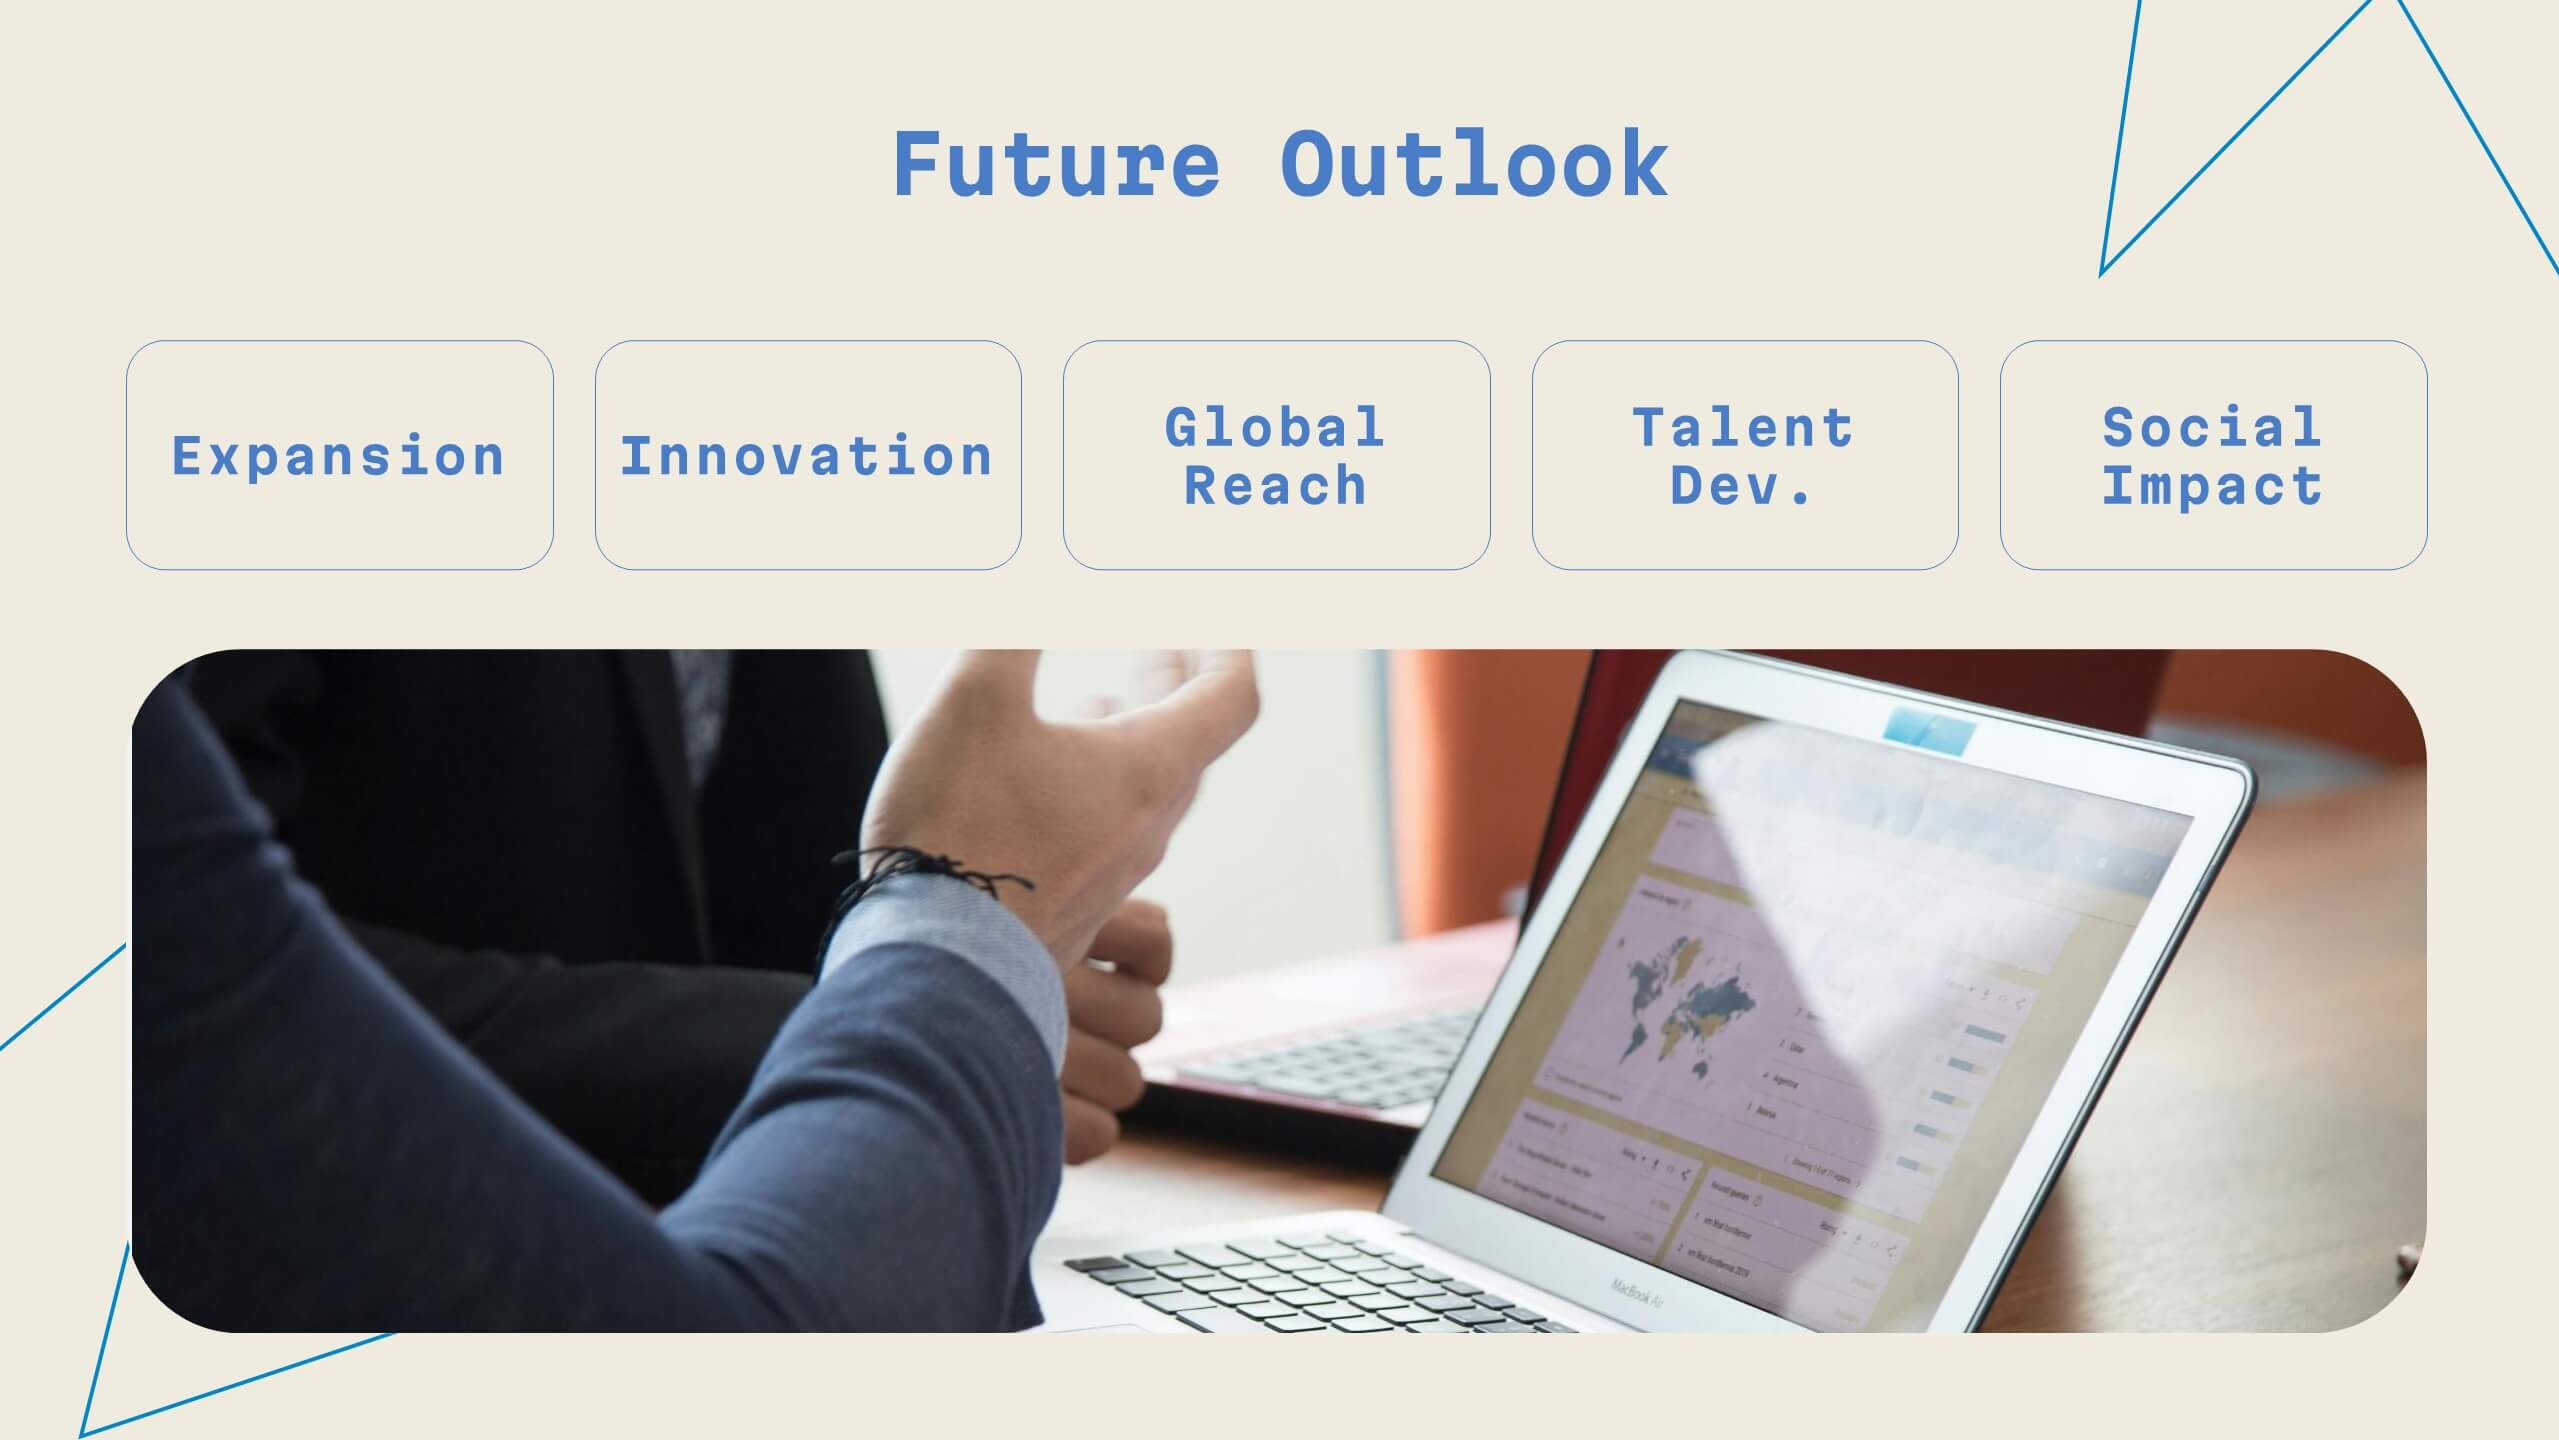
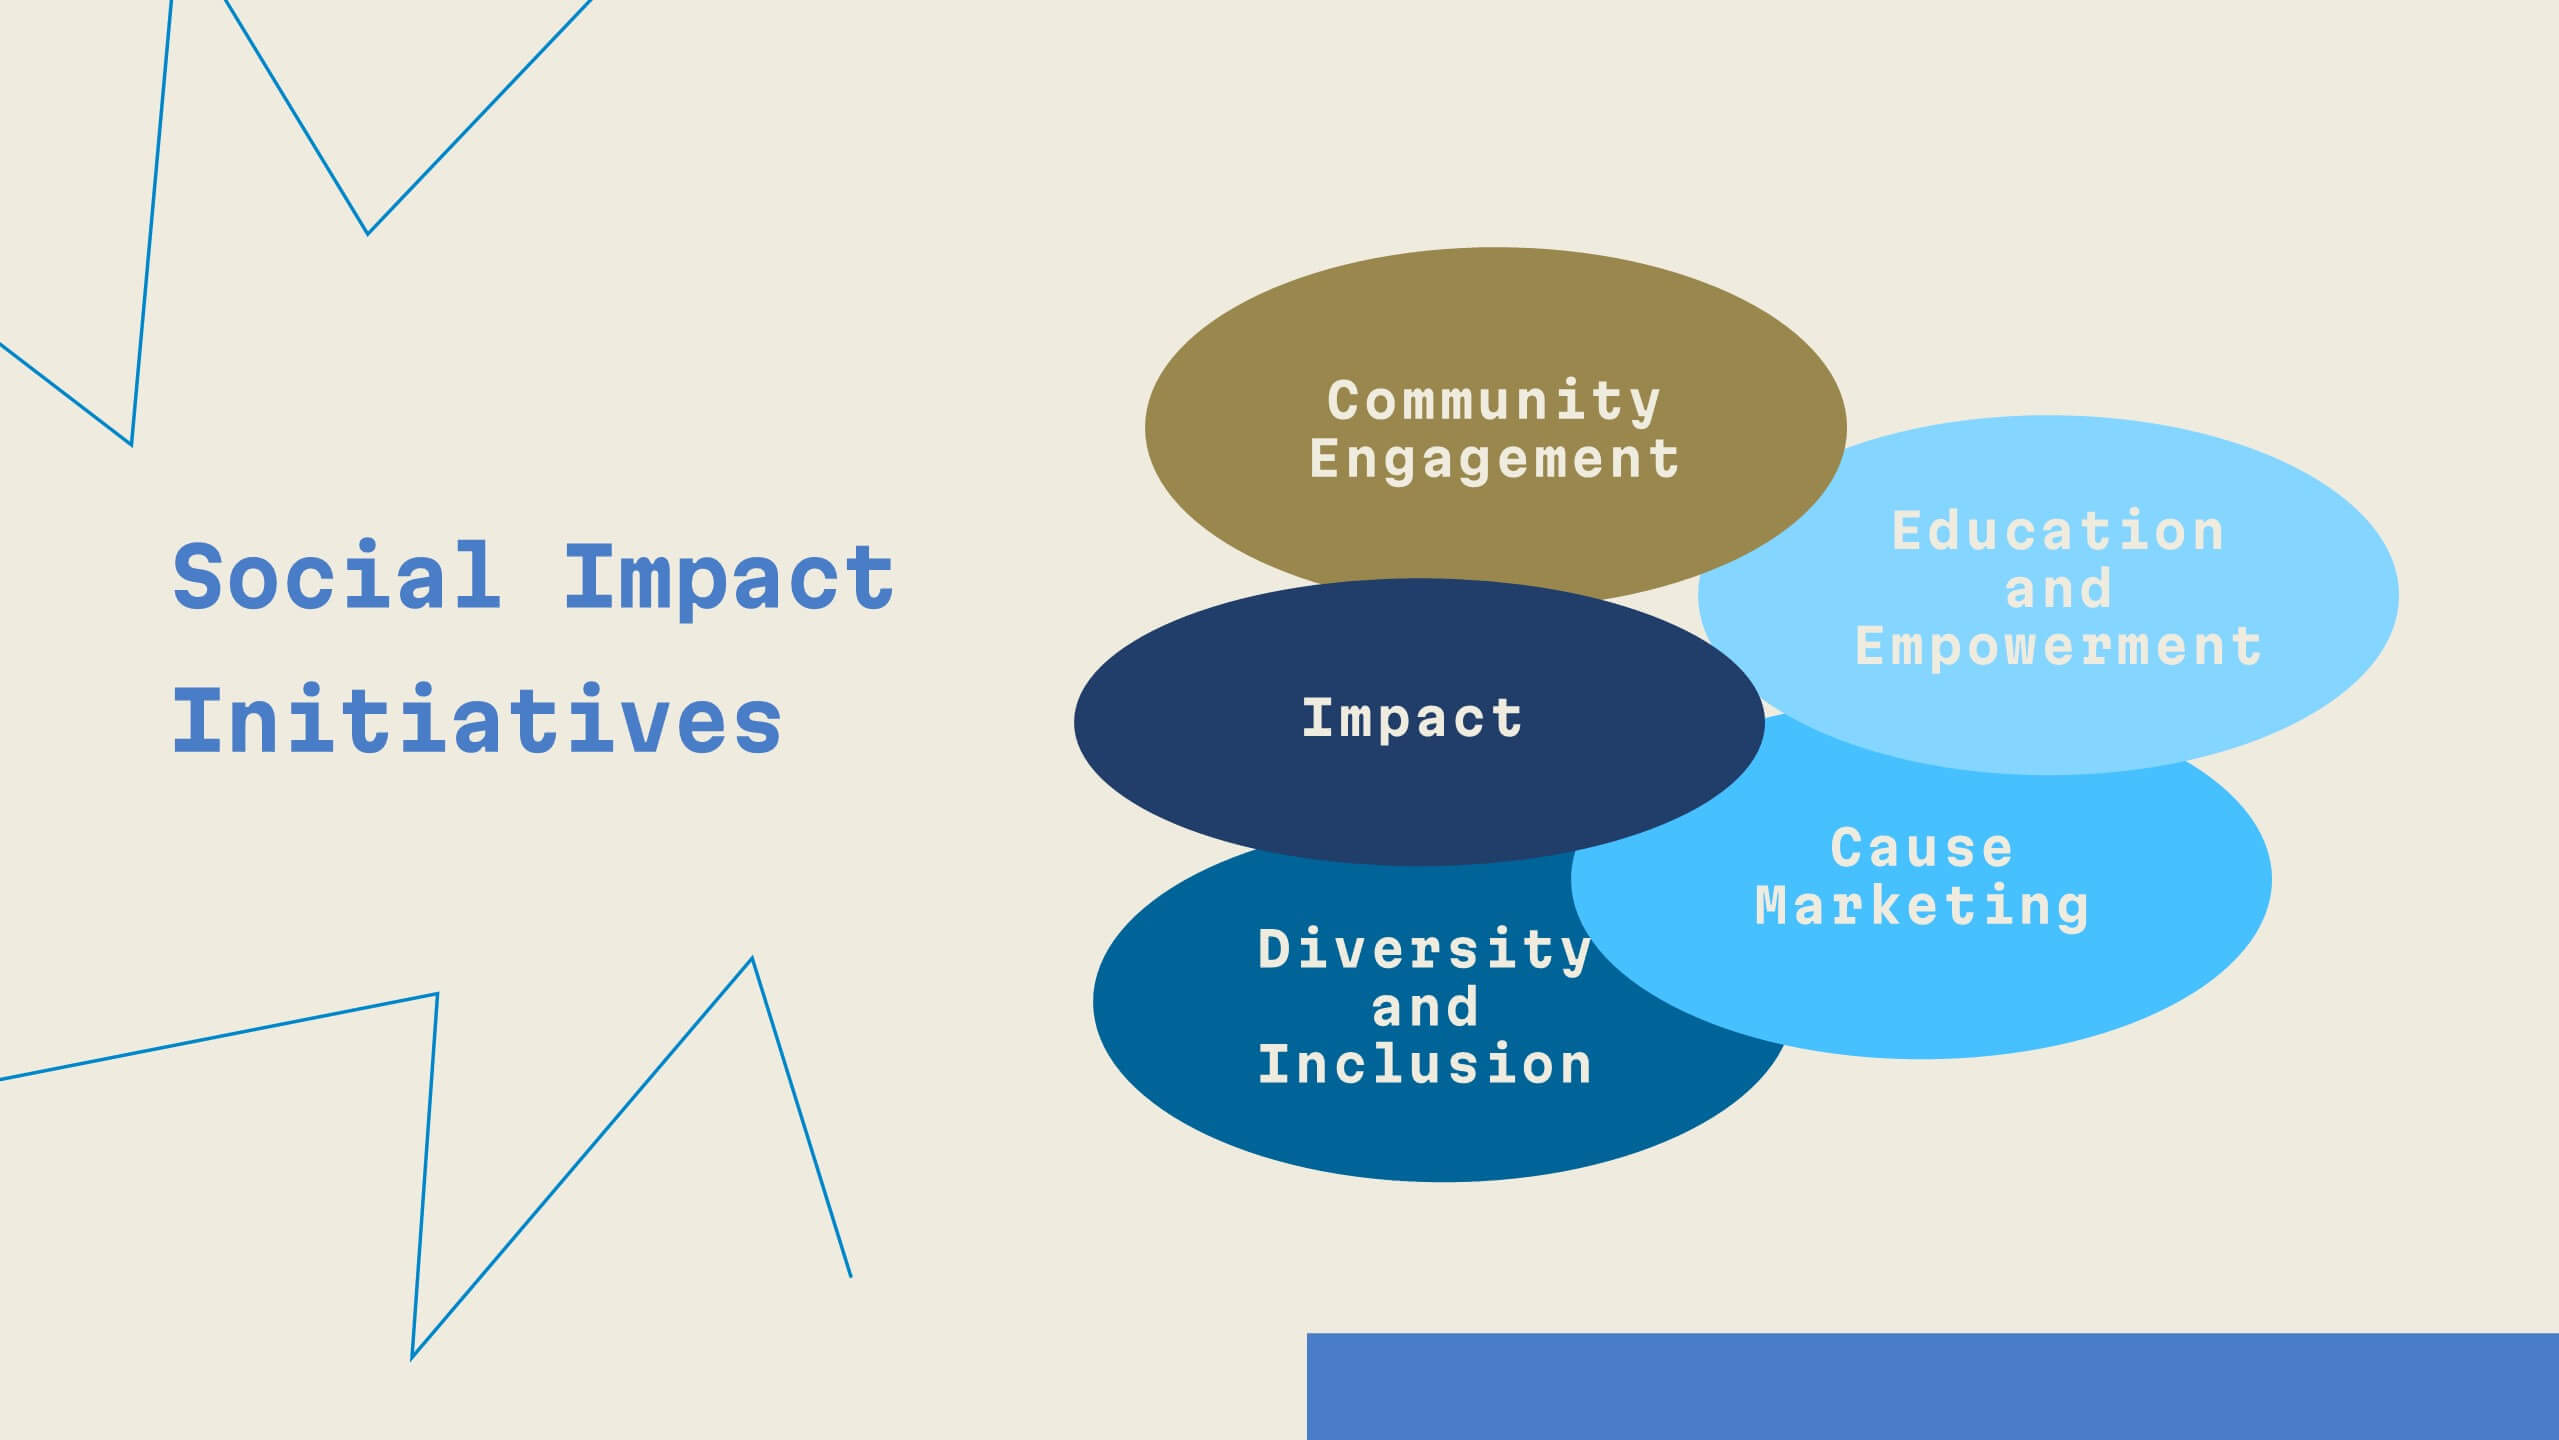
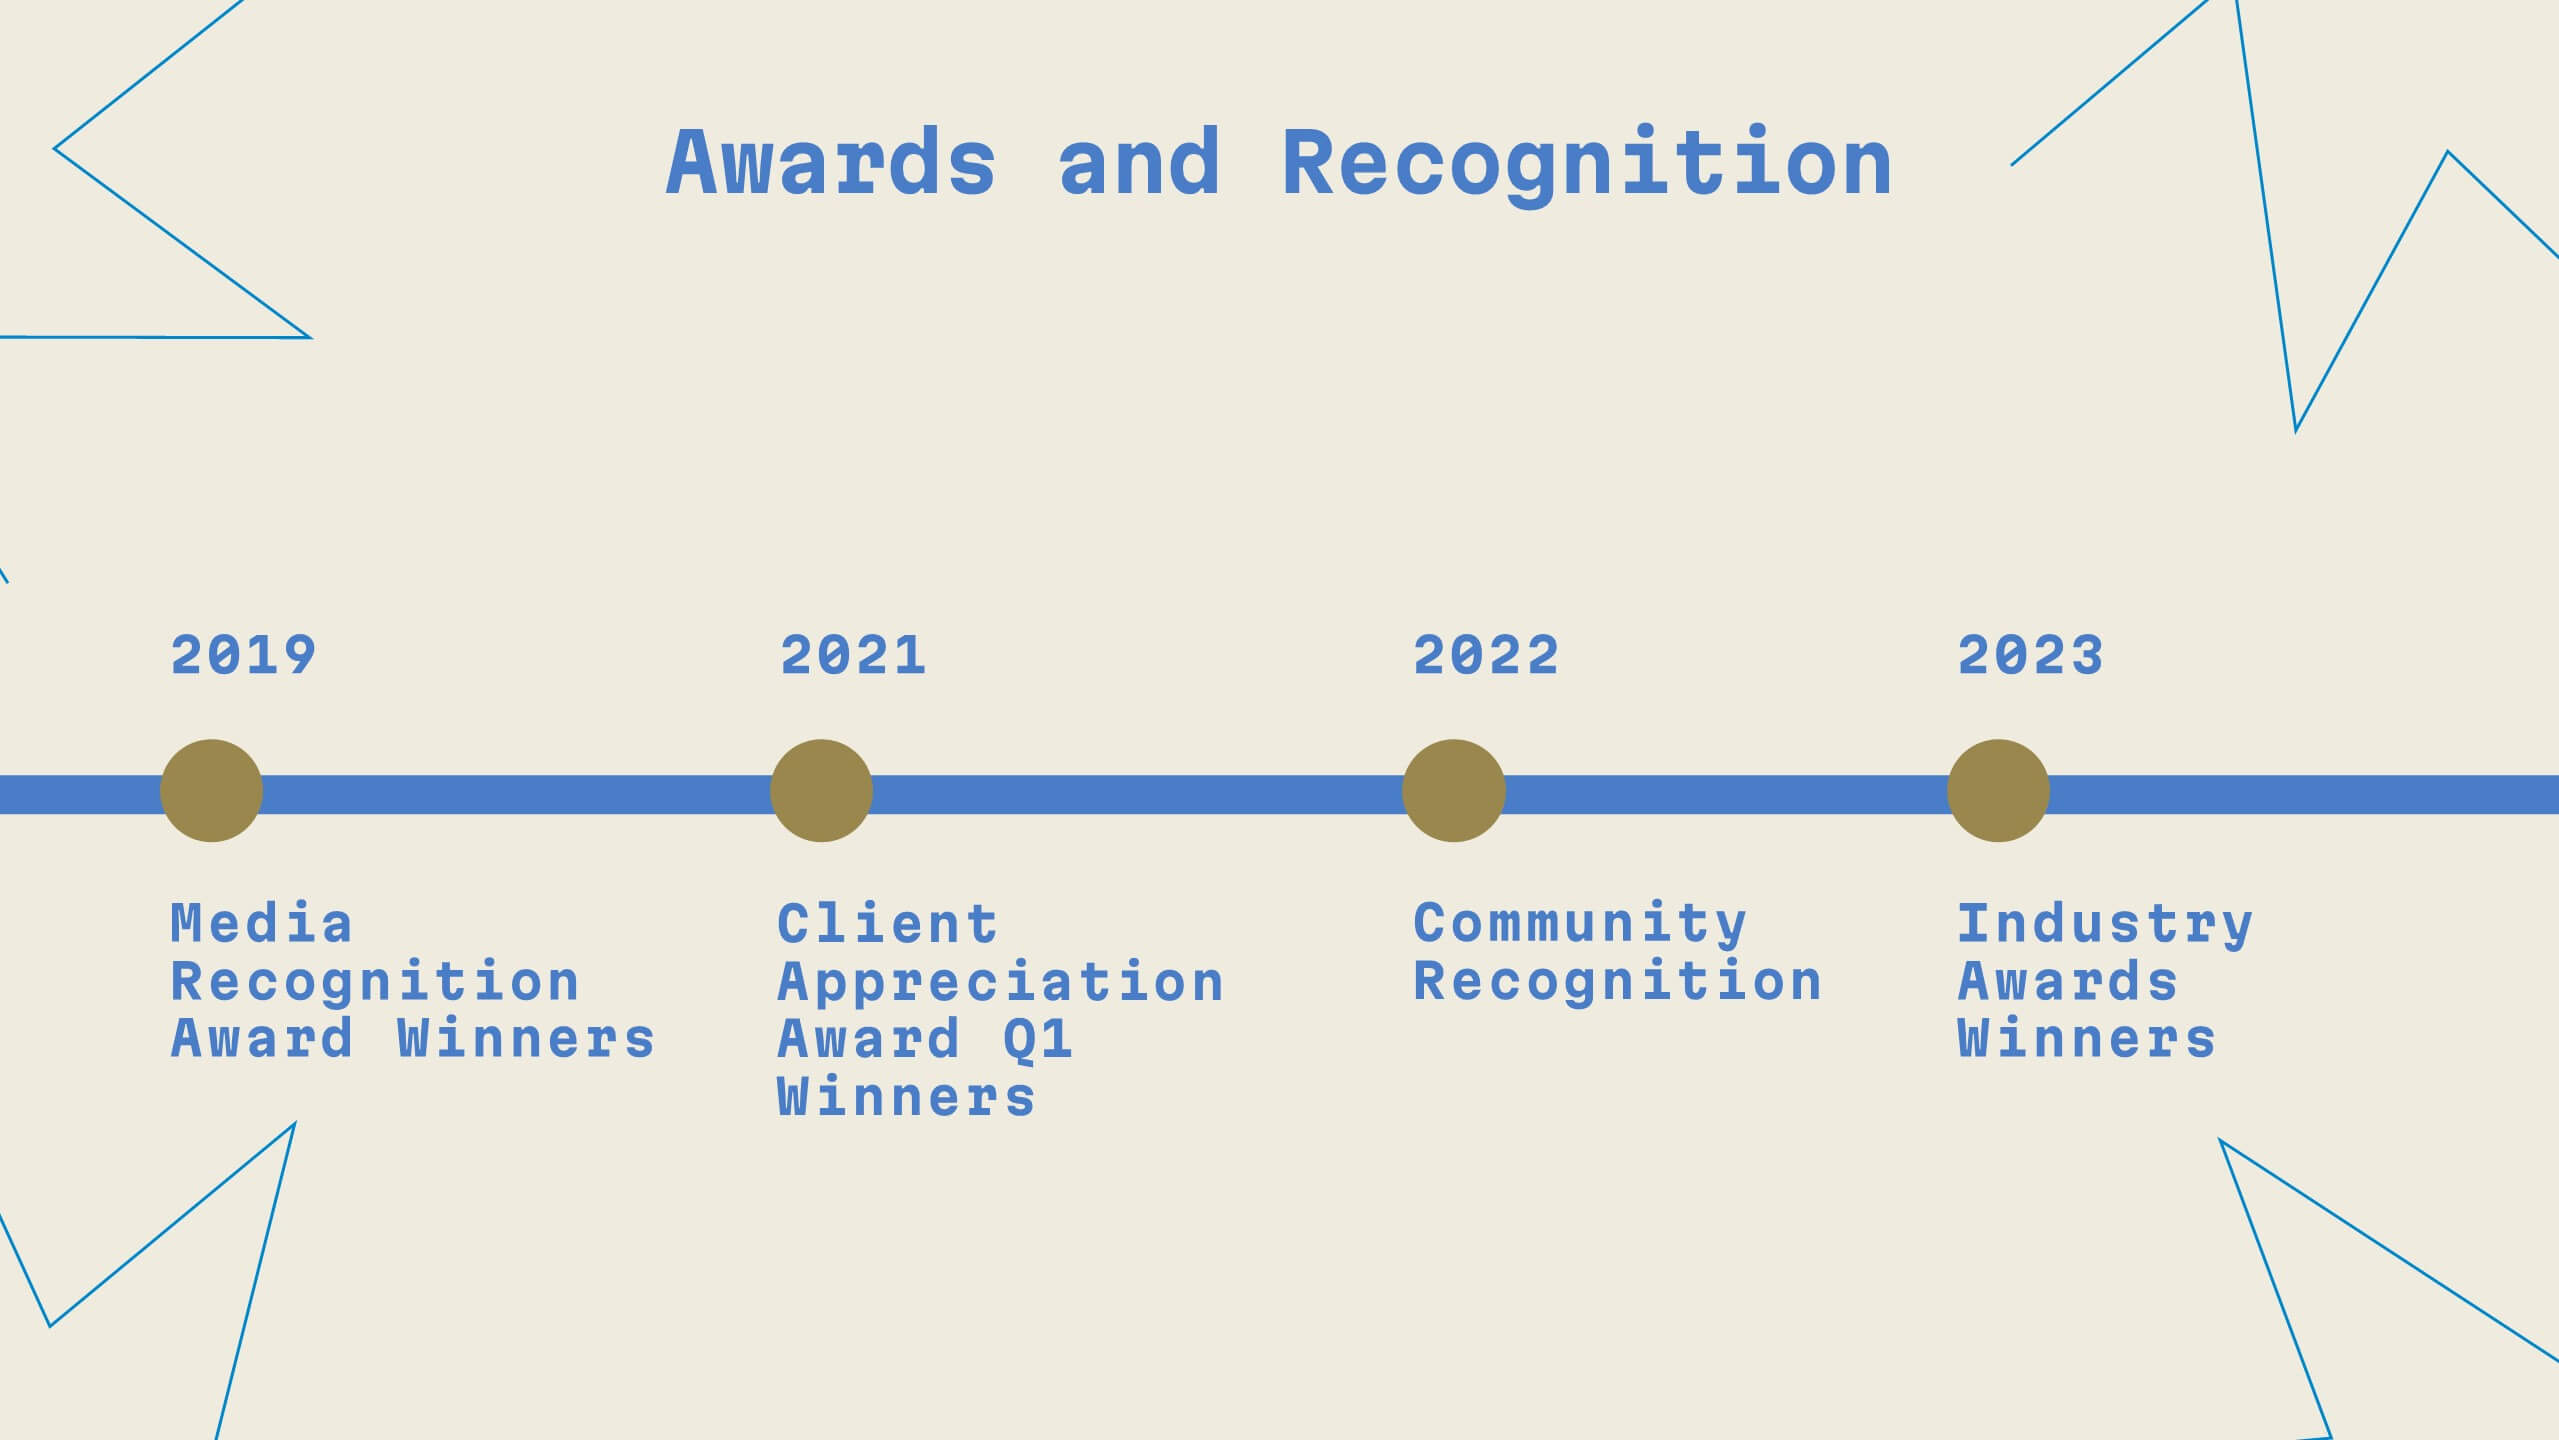
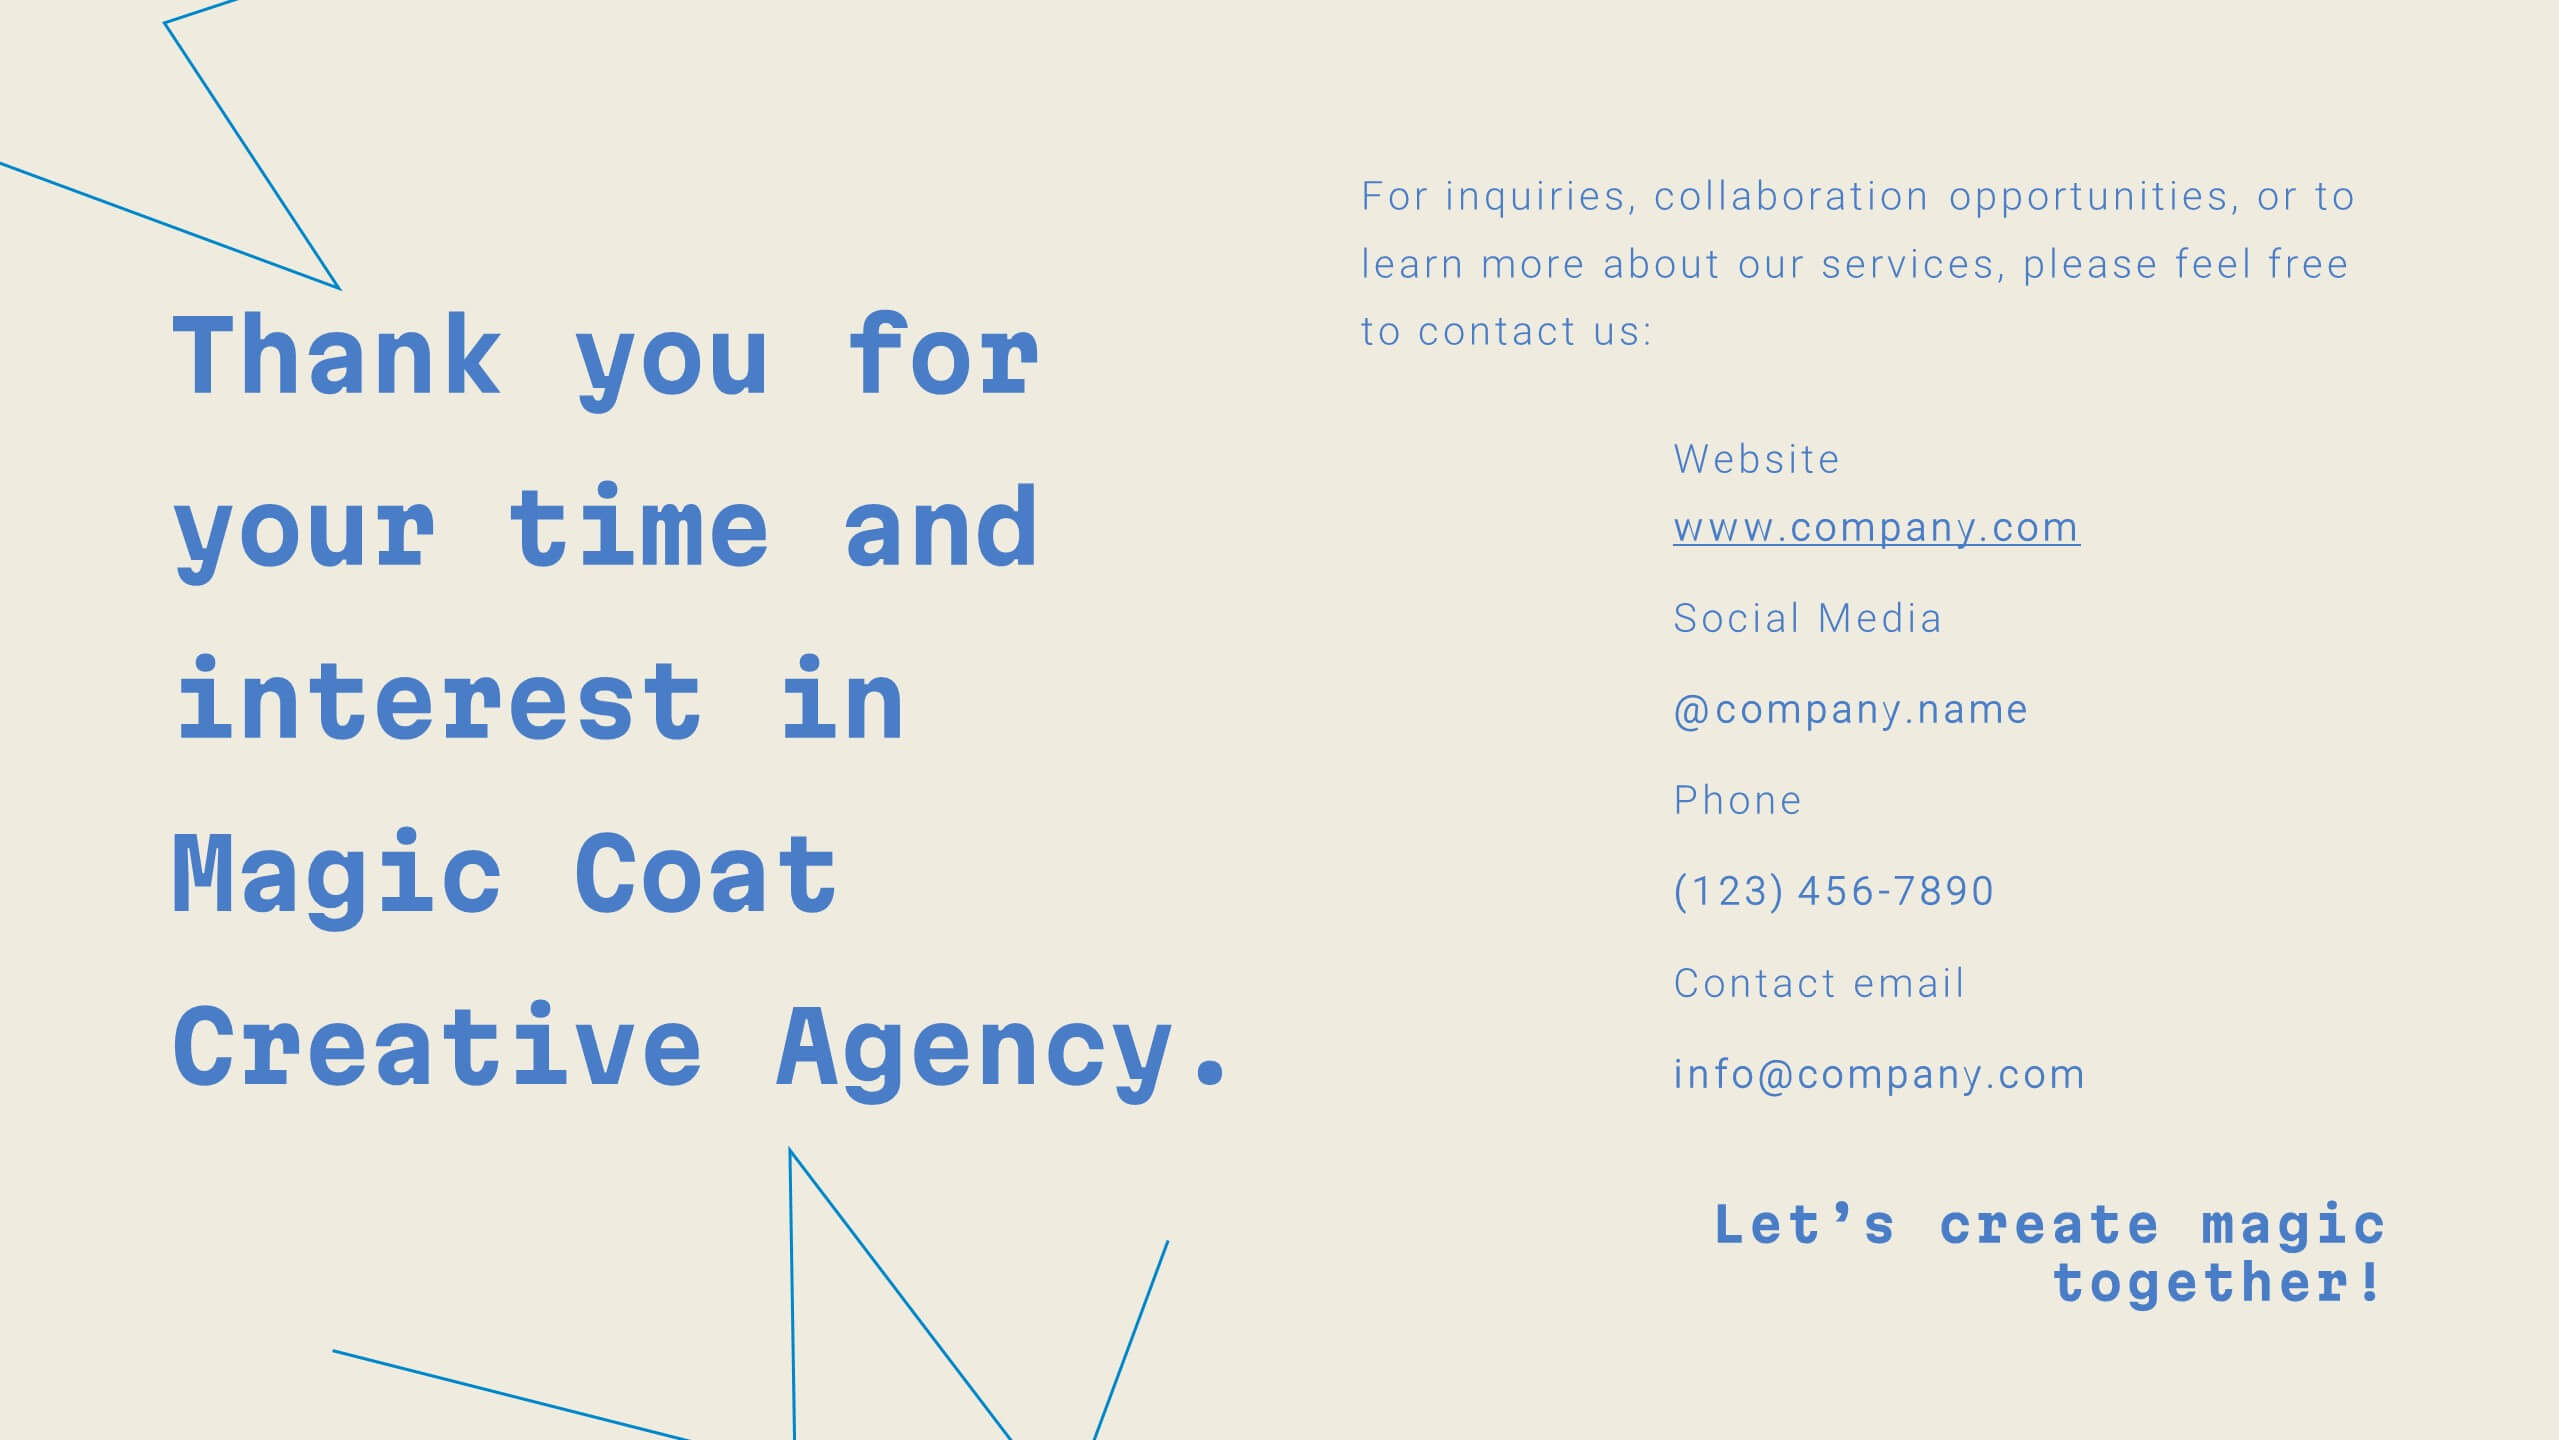
Business Growth Strategies Presentation
Take your vision from concept to expansion with a sleek, modern presentation designed to highlight progress and future potential. Ideal for showcasing goals, performance metrics, and market strategies, it keeps your ideas structured and engaging. Fully compatible with PowerPoint, Keynote, and Google Slides for effortless customization and presentation delivery.


5 slides
Traveling Needs Infographics
Travel Infographics play an important role in providing valuable and engaging information to travelers. These infographics are visual representation of the essential items and considerations for travelers. This template is designed to provide travelers with an overview of what they need to pack, plan, and prioritize before a trip. This consists of customizable elements such as icons and illustrations that visually depict different categories of traveling needs. These categories can include clothing and accessories, travel documents, health, and more. This template will help you convey the essential items and tips for a successful and enjoyable trip.


10 slides
Cause and Effect Fishbone Presentation
Visualize root causes and streamline analysis with this Cause and Effect Fishbone infographic. Ideal for identifying issues across categories, it helps present logical flows clearly. Fully editable and perfect for business, strategy, or process improvement discussions. Compatible with PowerPoint, Keynote, and Google Slides for effortless customization.


6 slides
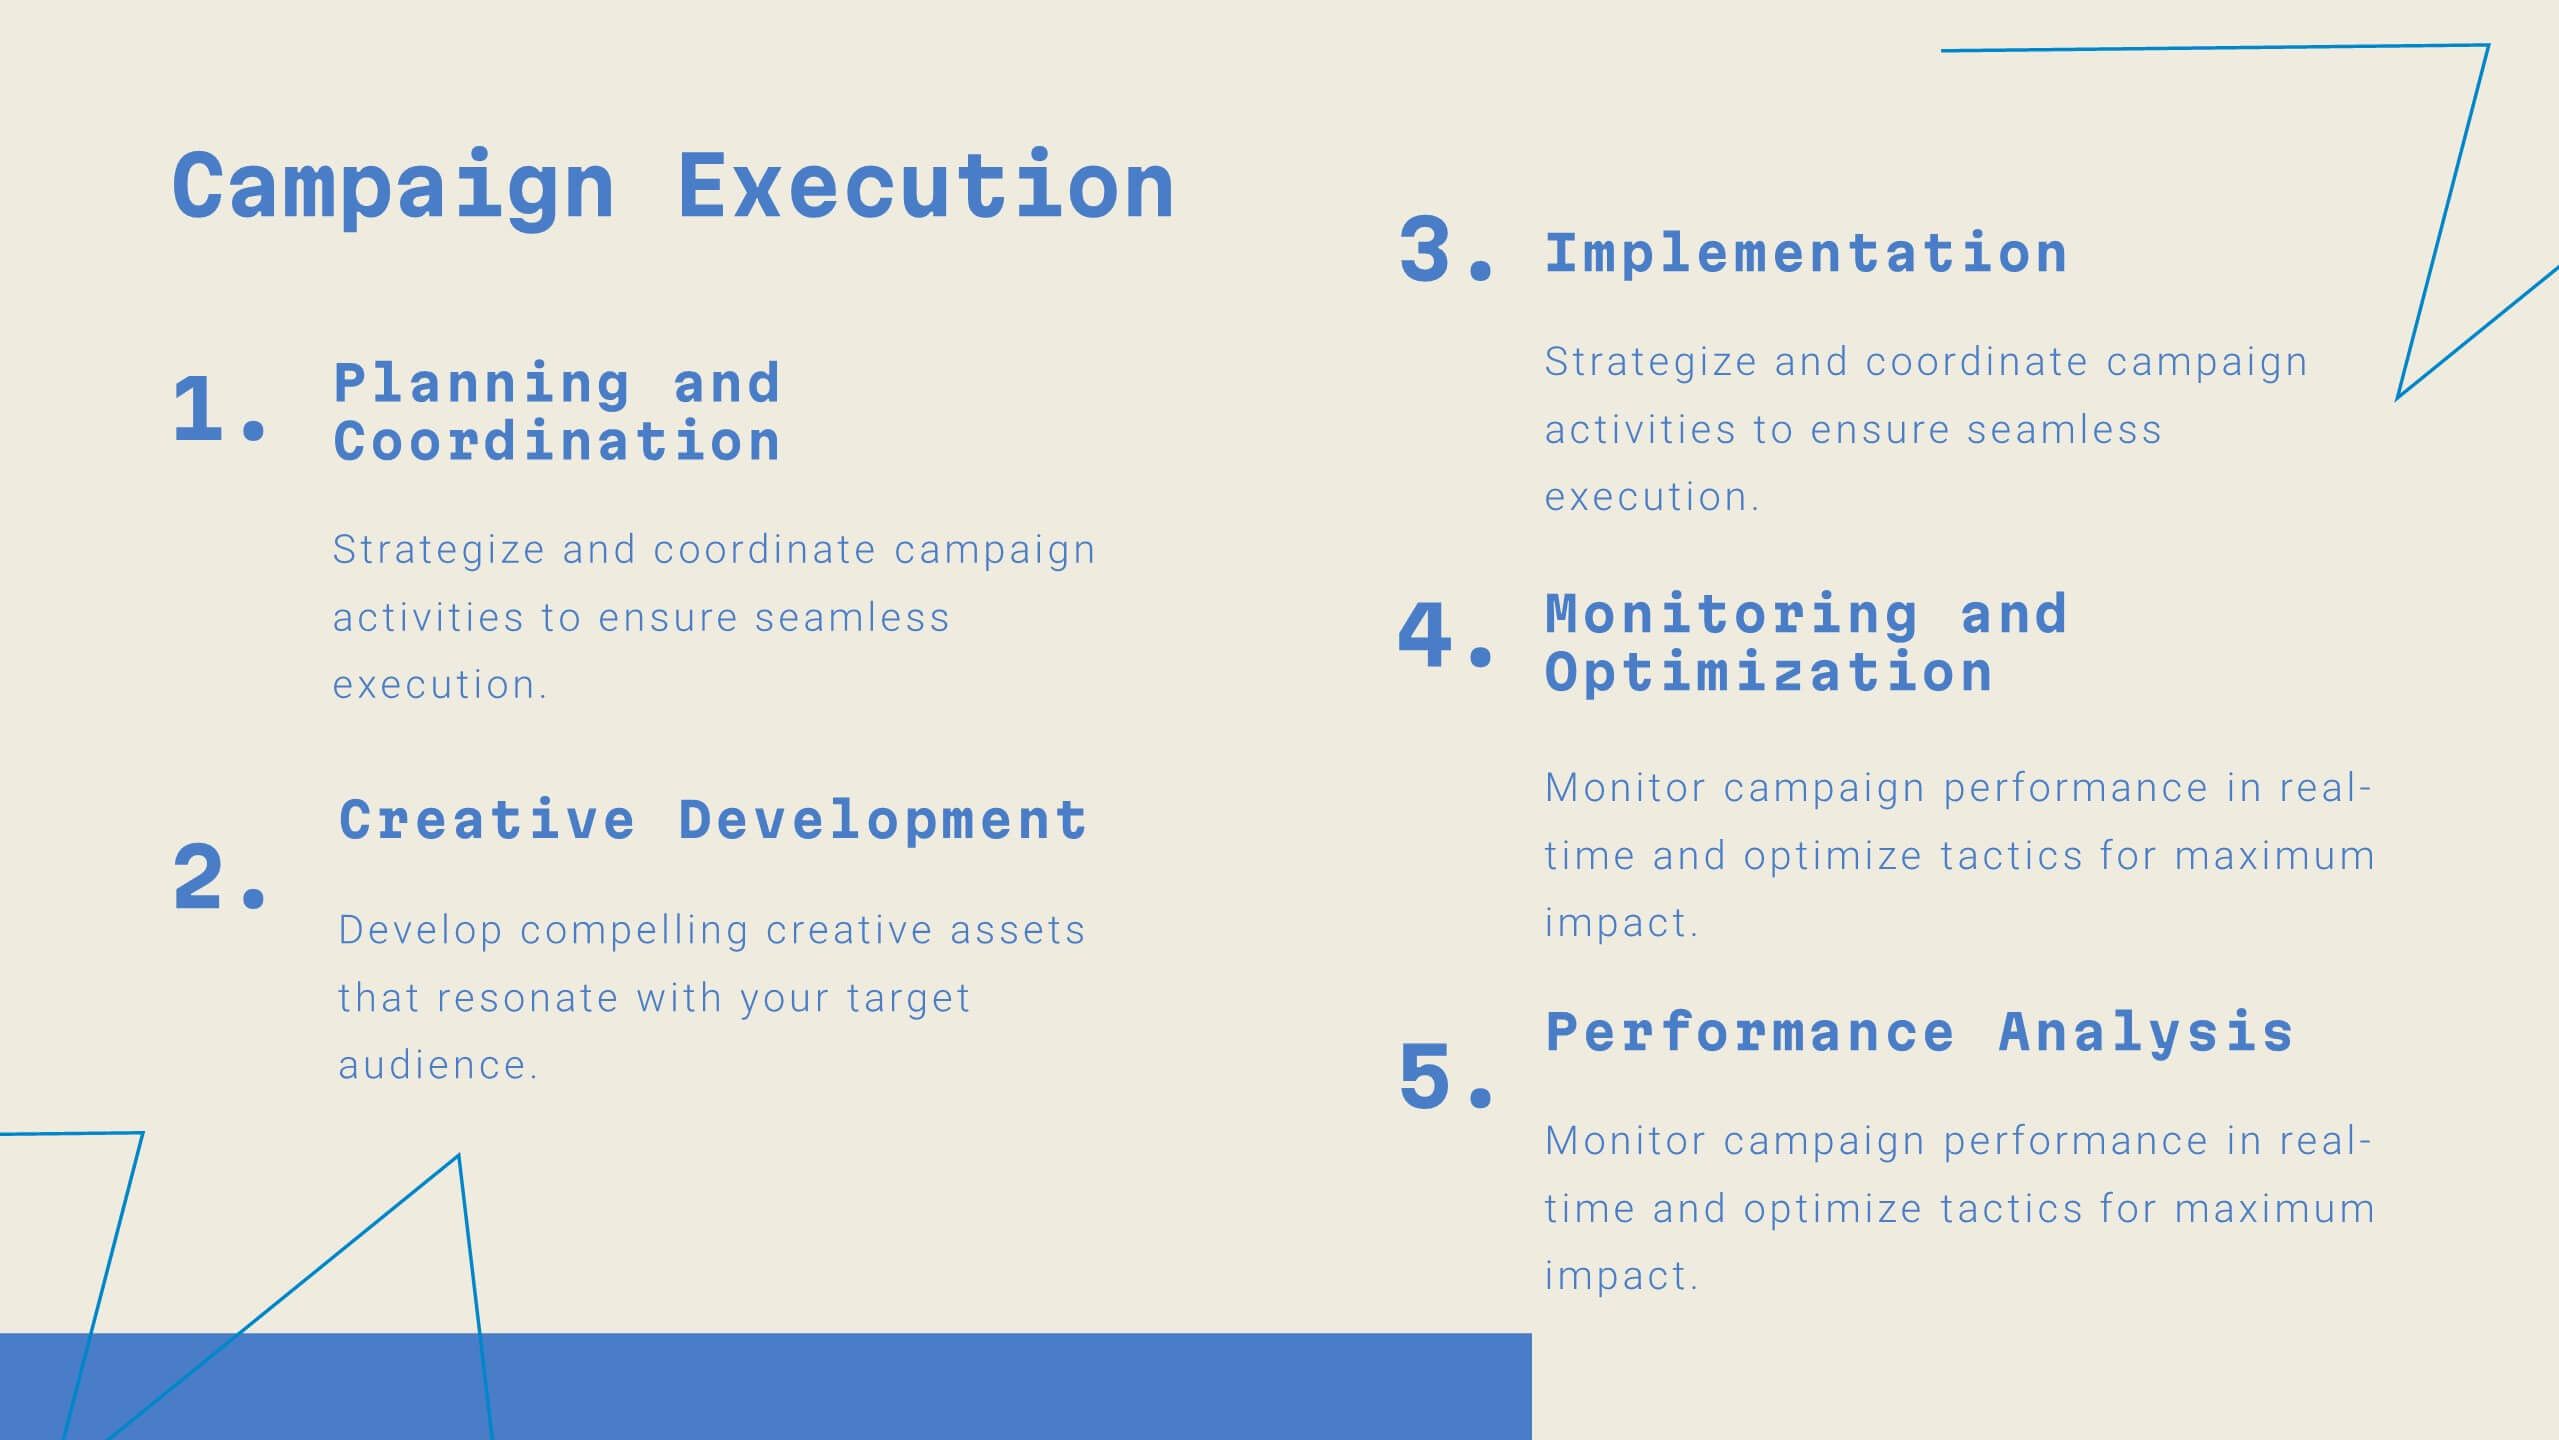
5-Stage Workflow Presentation
Turn complex processes into clear, visual stories with this structured step-by-step layout. Ideal for showcasing project stages, workflows, or development phases, it guides your audience through each milestone with precision and flow. Fully editable and compatible with PowerPoint, Keynote, and Google Slides for easy customization and professional results.


26 slides
Navigating the Creative Industry Presentation
Unlock the secrets to success in the creative industry with this dynamic and visually engaging presentation. Covering essential topics like career pathways, industry trends, collaboration strategies, and personal branding, this template helps you present insights with clarity and impact. Fully customizable and compatible with PowerPoint, Keynote, and Google Slides for a seamless experience.


5 slides
Global Warming Impacts Infographics
Global Warming refers to the long-term increase in Earth's average surface temperature due to human activities, primarily the emission of greenhouse gases. This is a visually engaging infographic template that highlights the impacts of global warming on the environment, ecosystems, and human societies. This template is made to create an understanding of the consequences of climate change and raise awareness about the urgent need for action. The eye-catching visuals and impactful messaging, make these infographics ideal for presentations, educational material, or awareness campaigns related to global warming and environmental sustainability.


6 slides
Execution Phase and Follow-up Steps Presentation
Make your process crystal clear with the Execution Phase and Follow-up Steps Presentation. Featuring a dynamic six-step linked chain design, this template is ideal for showcasing sequential workflows, project lifecycles, or task dependencies. Each step is color-coded with icons to enhance clarity and engagement. Fully customizable in PowerPoint, Keynote, and Google Slides.


5 slides
Business KPI Performance Presentation
Bring your business results to life with a clear, modern layout designed to showcase key metrics and performance goals. Perfect for tracking growth, progress, and success indicators, this visual design helps make data easy to understand and engaging. Fully editable in PowerPoint, Keynote, and Google Slides.


6 slides
Venn Diagram
A Venn diagram is a visual representation of the relationships between different sets or groups. This infographic template consists of overlapping circles, each representing a specific set, and the overlapping parts indicates the elements that belong to multiple sets. Use this infographic to illustrate the relationships between different sets of data or concepts. The main components of the infographic are the circles or ellipses that represent the sets being compared. The size and position of the circles can be adjusted to reflect the data accurately. This infographic is fully customizable and compatible with Powerpoint, Keynote, and Google Slides.


7 slides
Venn Diagram Infographic Presentation Template
A Venn diagram is a type of chart that uses circles to show the similarities and differences between two or more sets of items. The circles overlap in the areas where the items have something in common, and the non-overlapping areas show the items that are unique to each set. This template is perfect for showing how different things are alike and different. This template includes lots of diagrams with circles that you can customize to show all the similarities between your different information. You can also add pictures and charts to make it look more appealing with your personal data.


6 slides
Hospital Management System Presentation
Bring structure and efficiency to your healthcare operations with this professional presentation. Designed to simplify complex hospital workflows, it helps visualize patient management, service coordination, and system processes with clarity. Ideal for administrators and consultants, it’s fully editable and compatible with PowerPoint, Keynote, and Google Slides for seamless customization.


6 slides
Insurance Comparison Infographic
Insurance comparison is the process of evaluating and comparing different insurance policies offered by various insurance companies to find the one that best meets your needs and requirements. This infographic template is a visual representation of different types of insurance policies and their key features, designed to help consumers compare and make informed decisions about their insurance needs. This infographic aims to simplify complex insurance information. This can be used on insurance websites, marketing materials, and educational resources to assist consumers in making well-informed insurance choices based on their unique needs and preferences.


7 slides
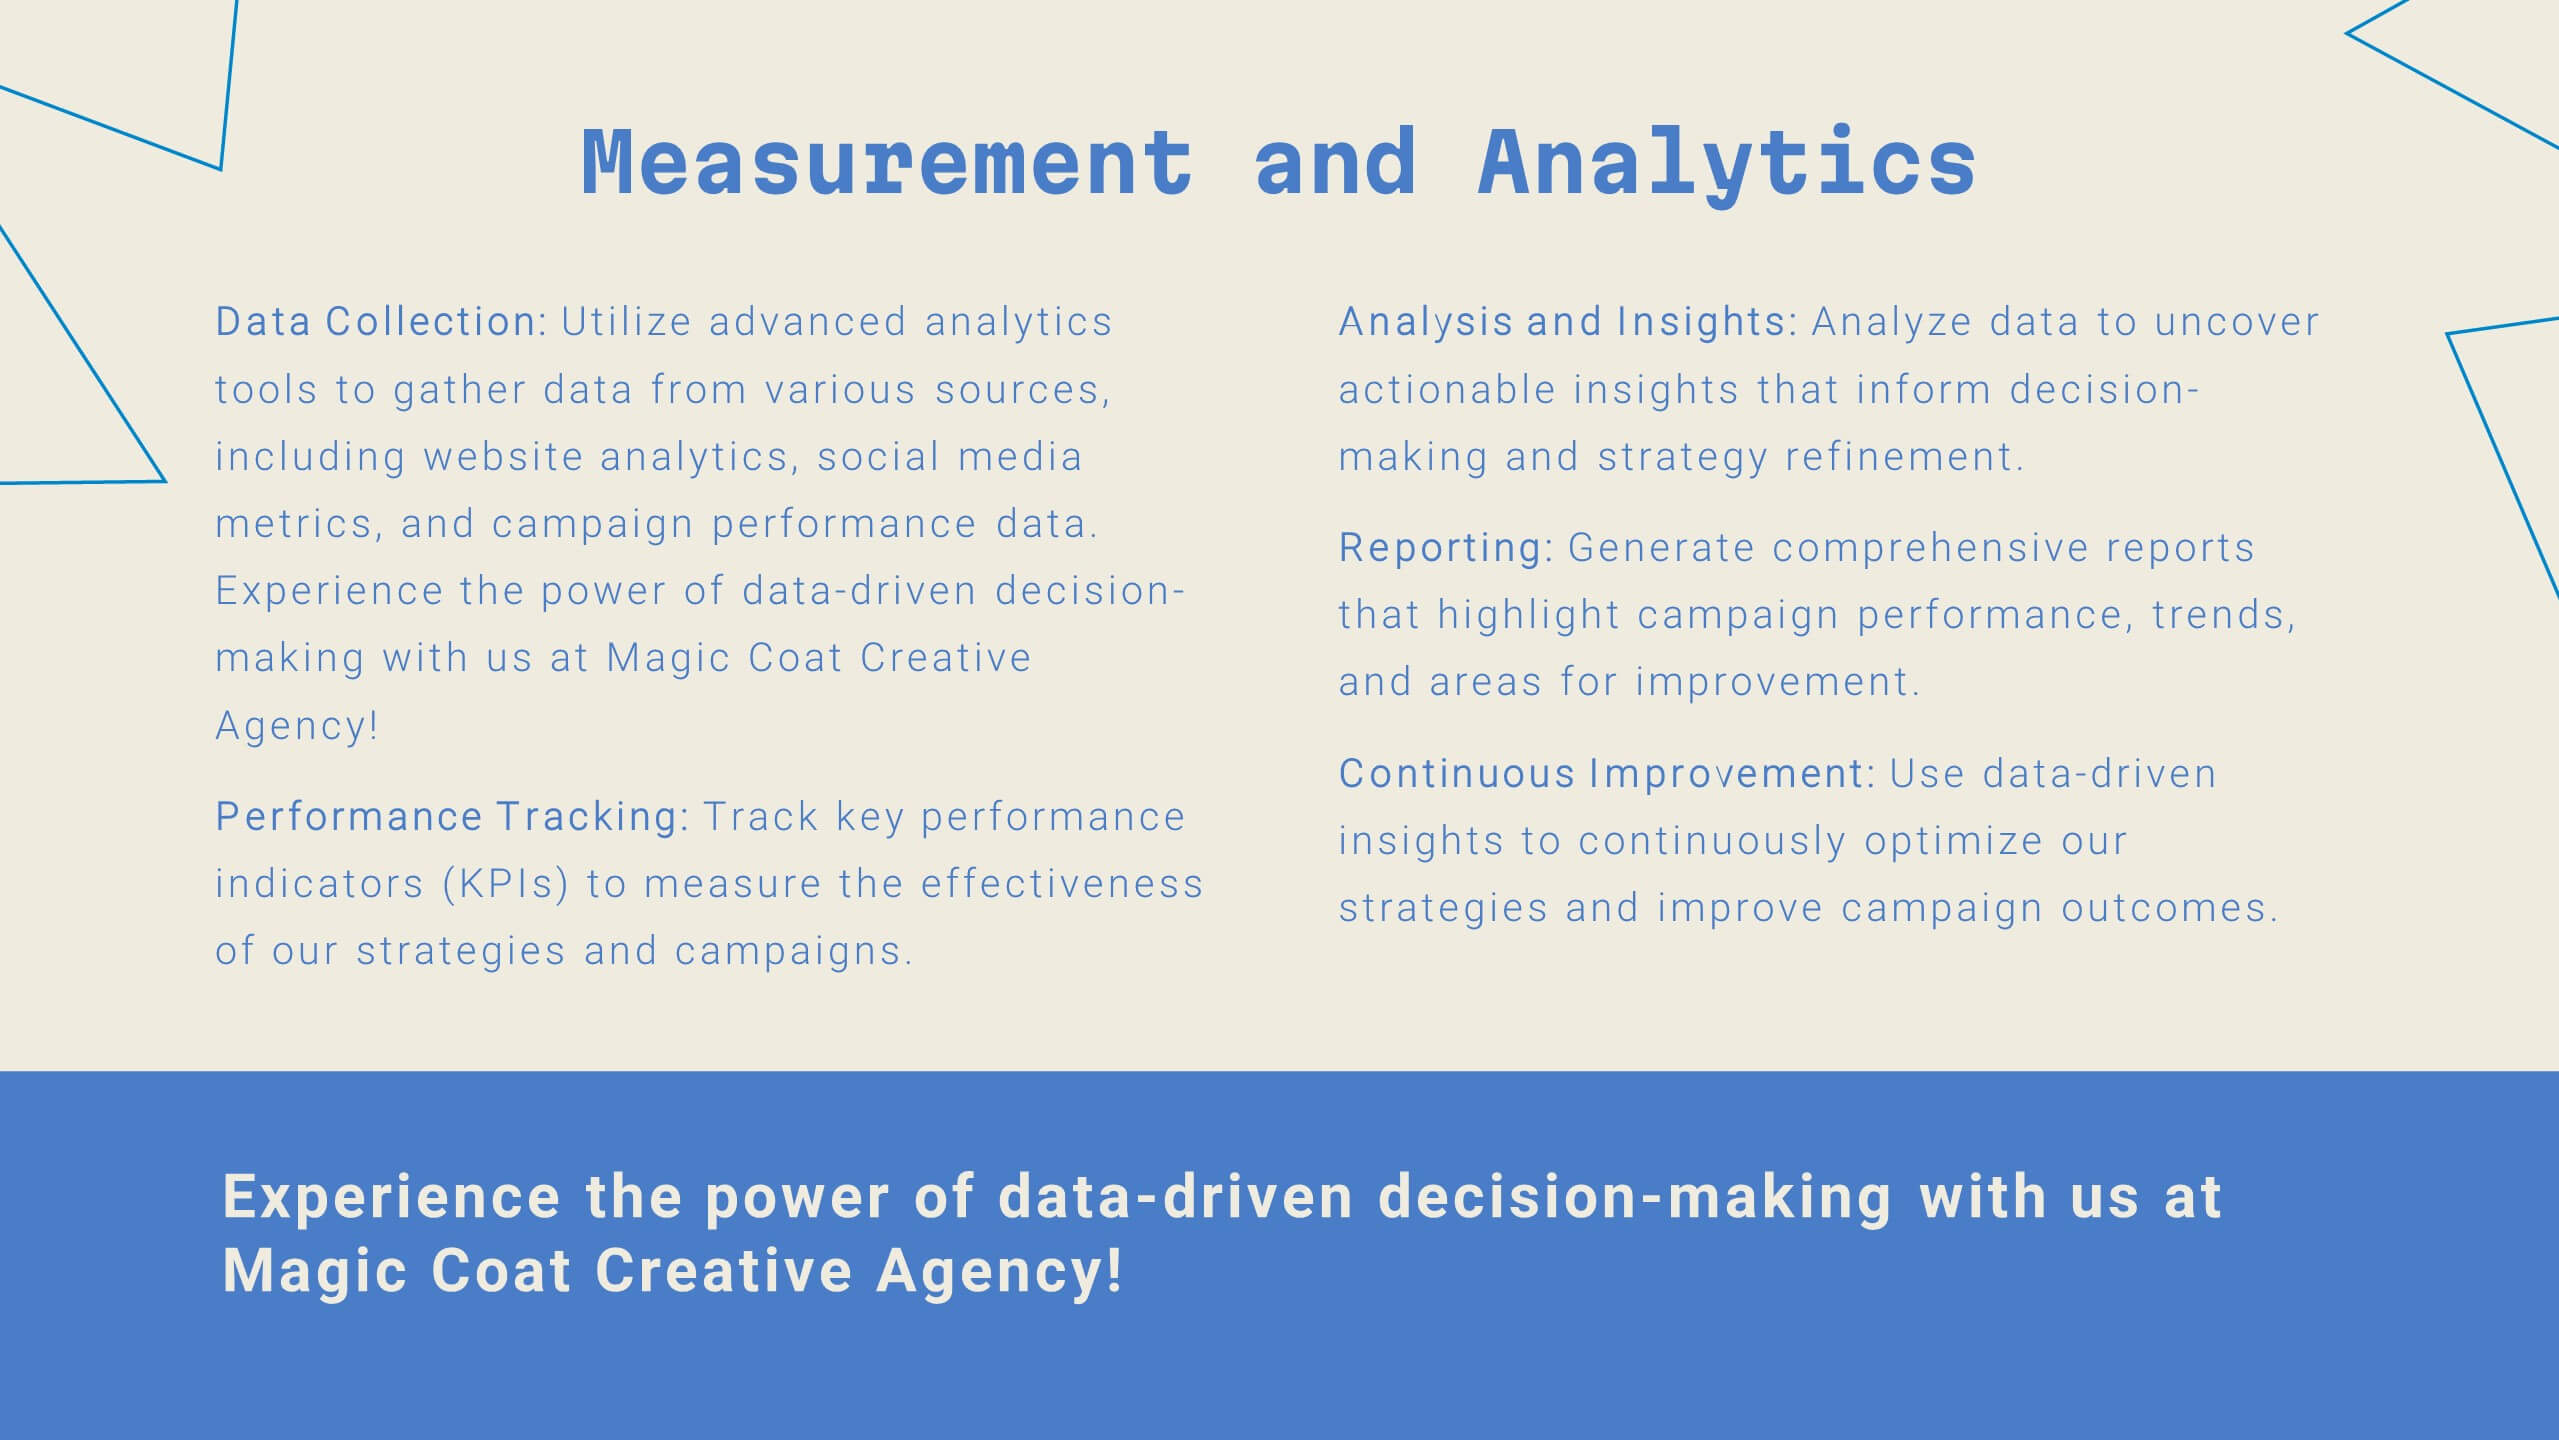
Data Analysis Tools Infographic
The Data Analysis Tools Infographic provides a dynamic and intuitive way to represent data analytics and performance metrics visually. This template offers various graph styles, such as bar graphs, line charts, and human figures, to illustrate statistical data effectively. Whether it's market research, financial analysis, website analytics, or any other form of quantitative data, this infographic is designed to make data easily understandable at a glance. Compatible with popular presentation software like PowerPoint, Google Slides, and Keynote, it's an excellent tool for professionals who aim to communicate complex data in a simplified, engaging manner.


26 slides
Wok Presentation Template
Want to learn about popular Chinese dishes? Wok is a fun and colorful template made for you. It includes all the essential elements of a food related template: fresh ingredients and vibrant colors. Wok was developed to meet the needs of those who want to promote their business with a clean and organized design. It has easy editing features making it simple to customize by adding company logos and other relevant details. The template is responsive, which means that it will adapt its layout based on how the user wants it displayed. This makes it easy to access the site from wherever you may be.