


Features
- 7 Unique slides
- Fully editable and easy to edit in Microsoft Powerpoint, Keynote and Google Slides
- 16:9 widescreen layout
- Clean and professional designs
- Export to JPG, PDF or send by email


Do you have any questions?
Recommend


21 slides
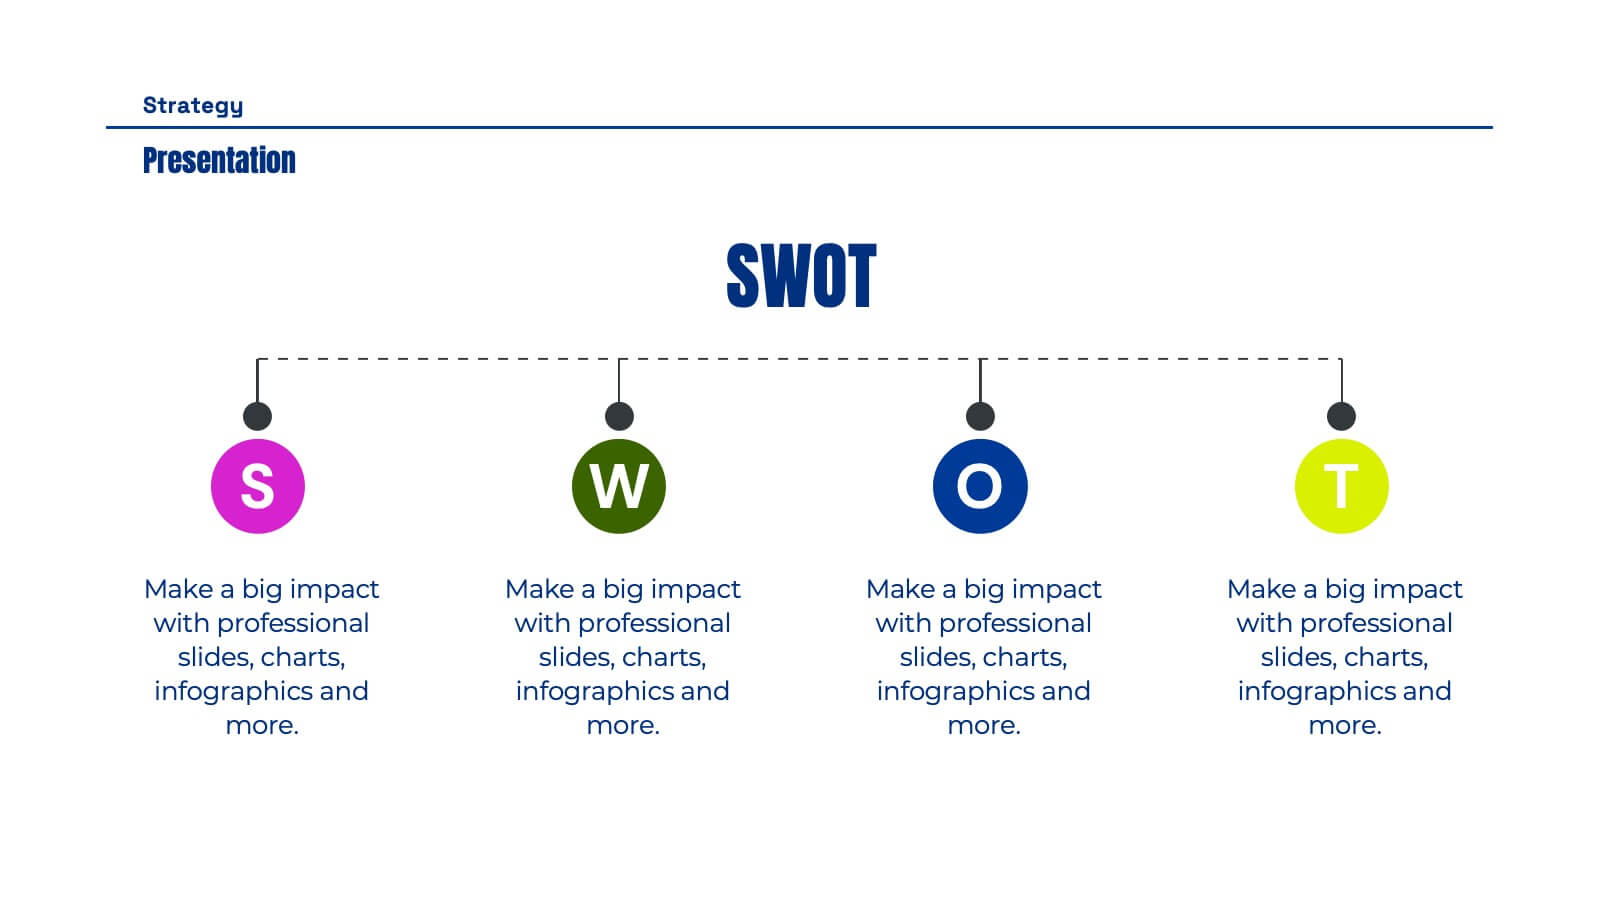
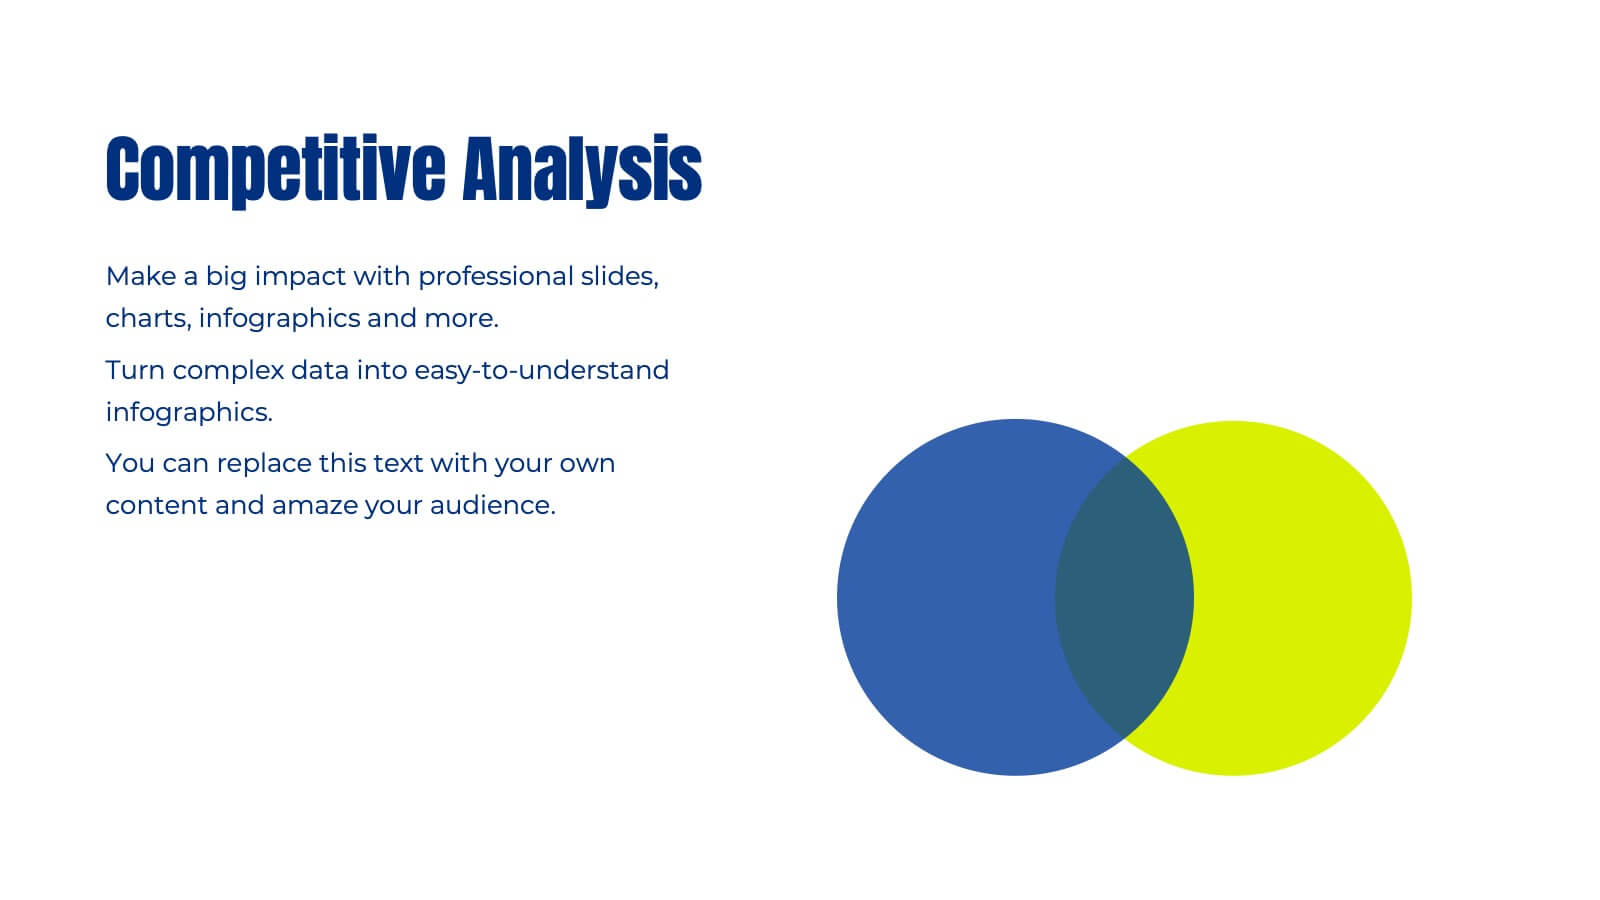
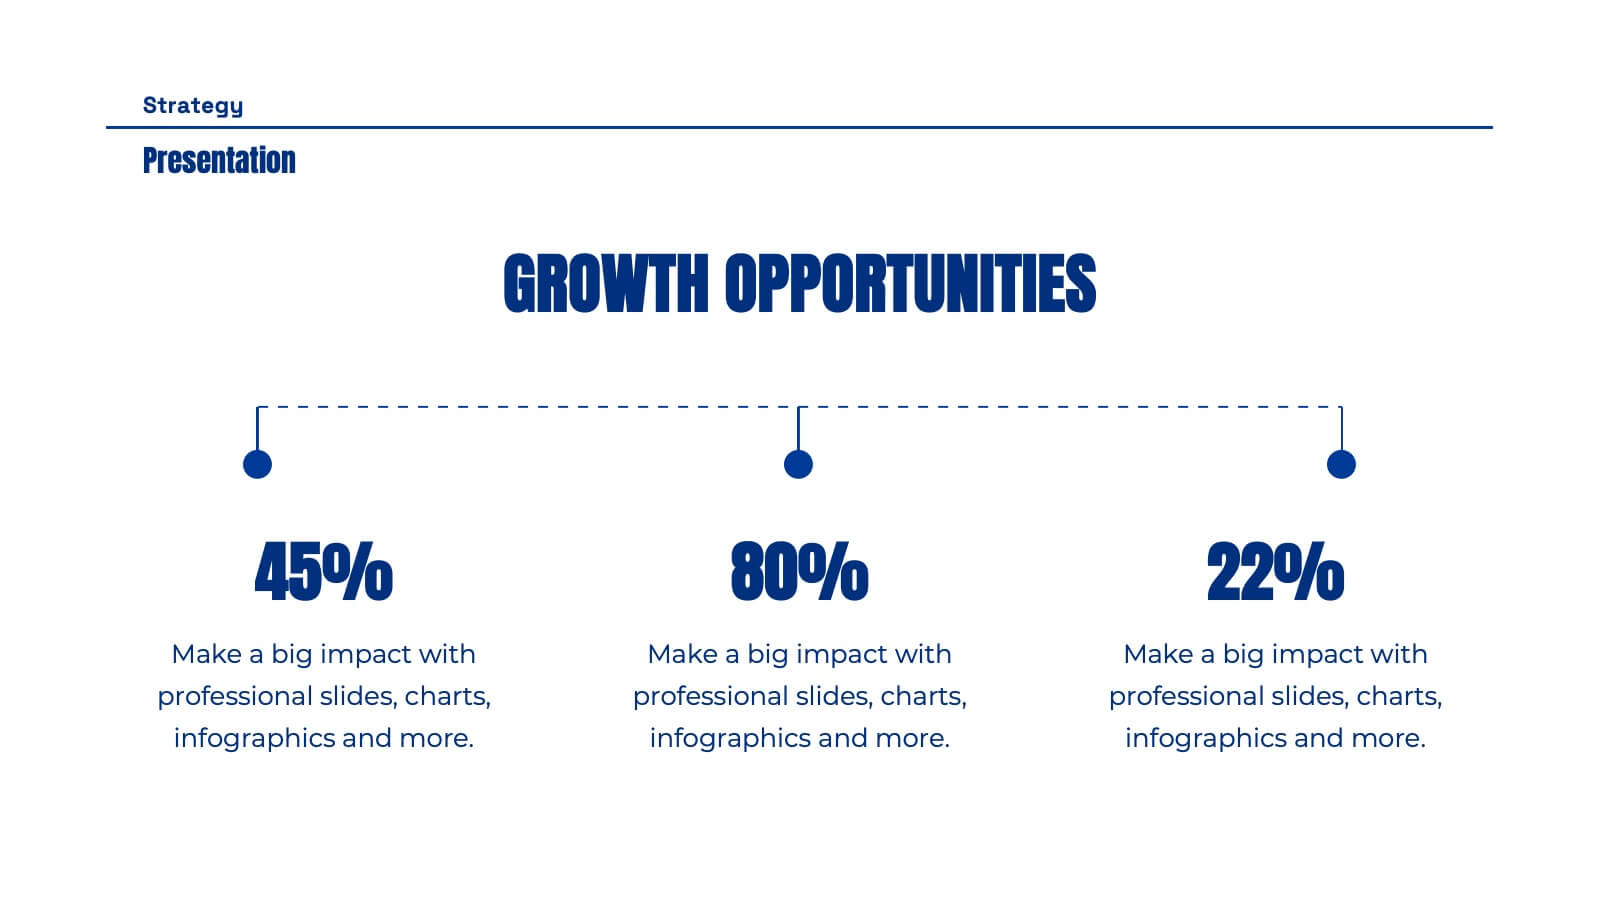
Ops Business Strategy Presentation
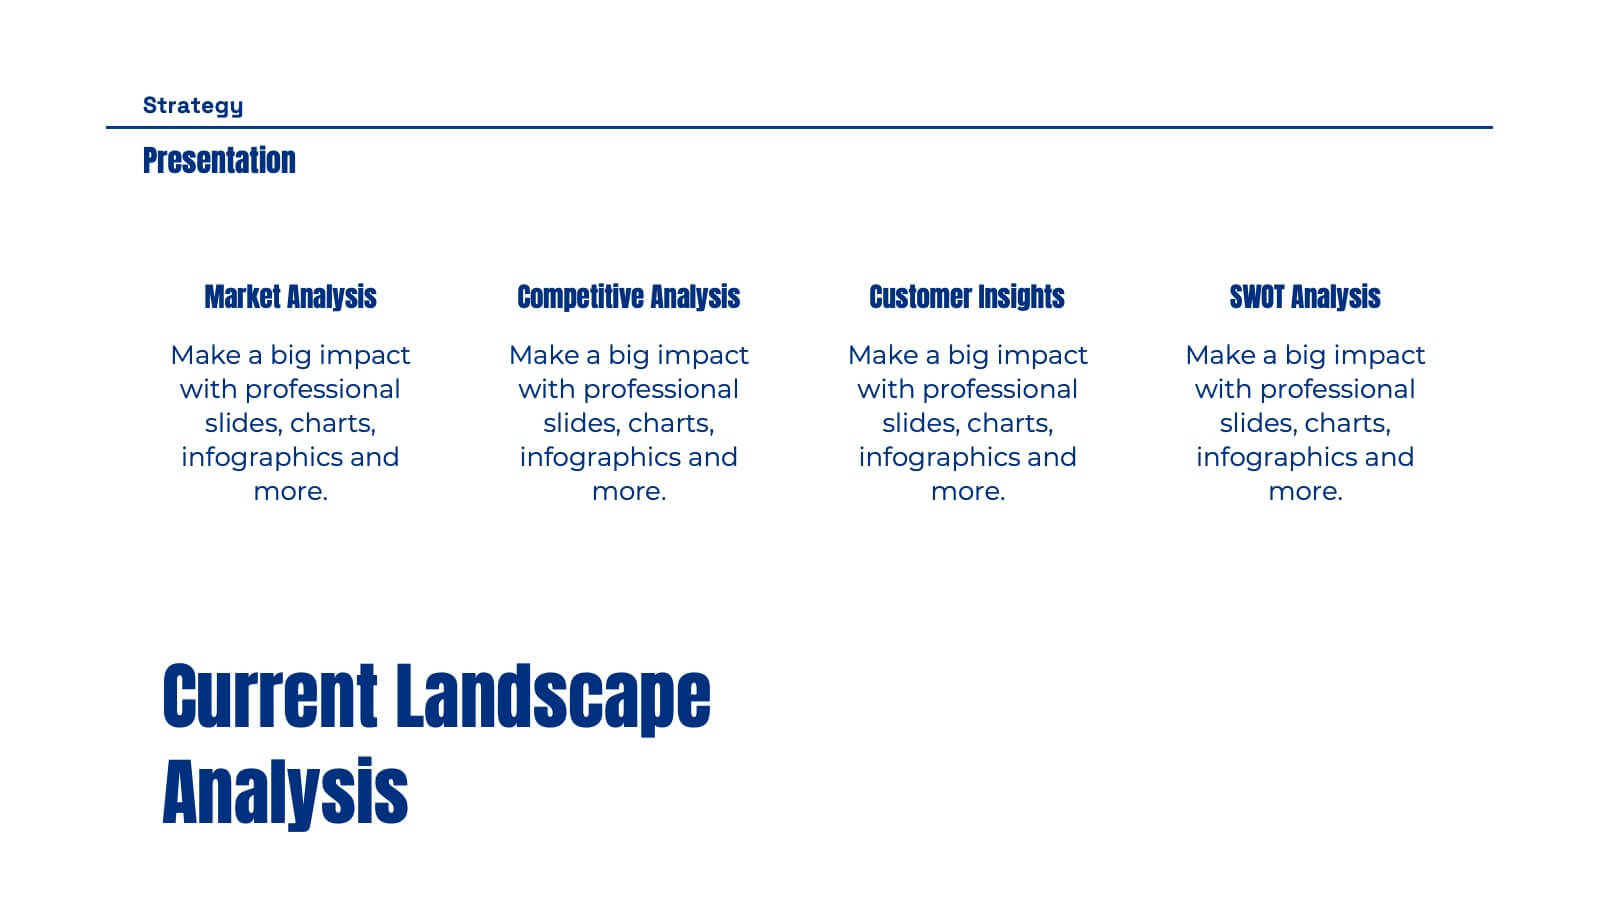
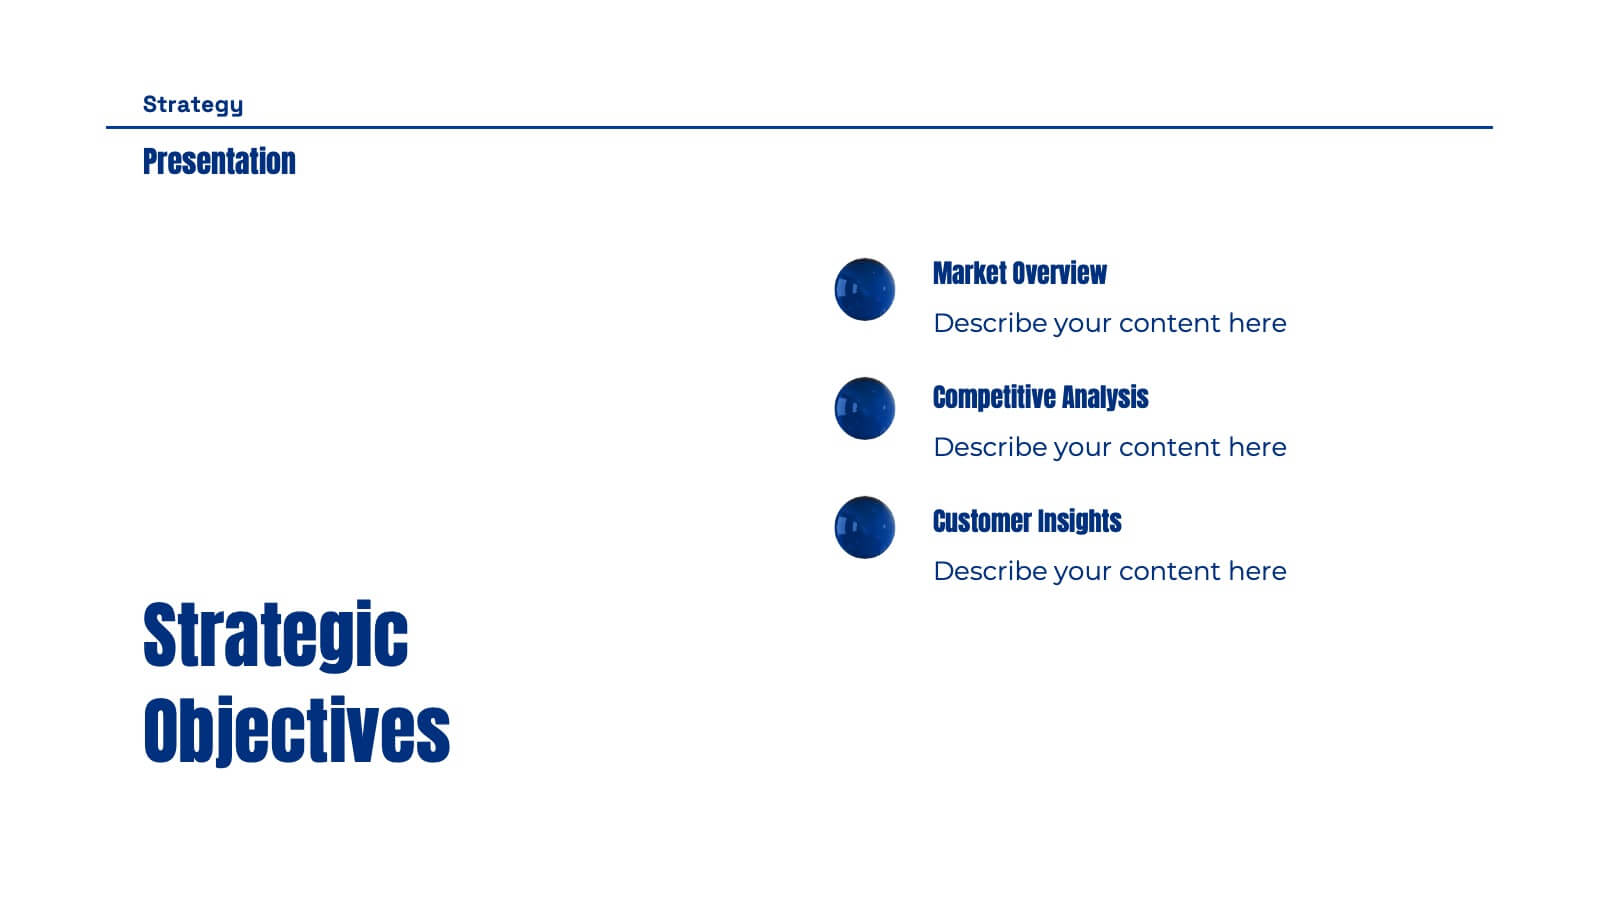
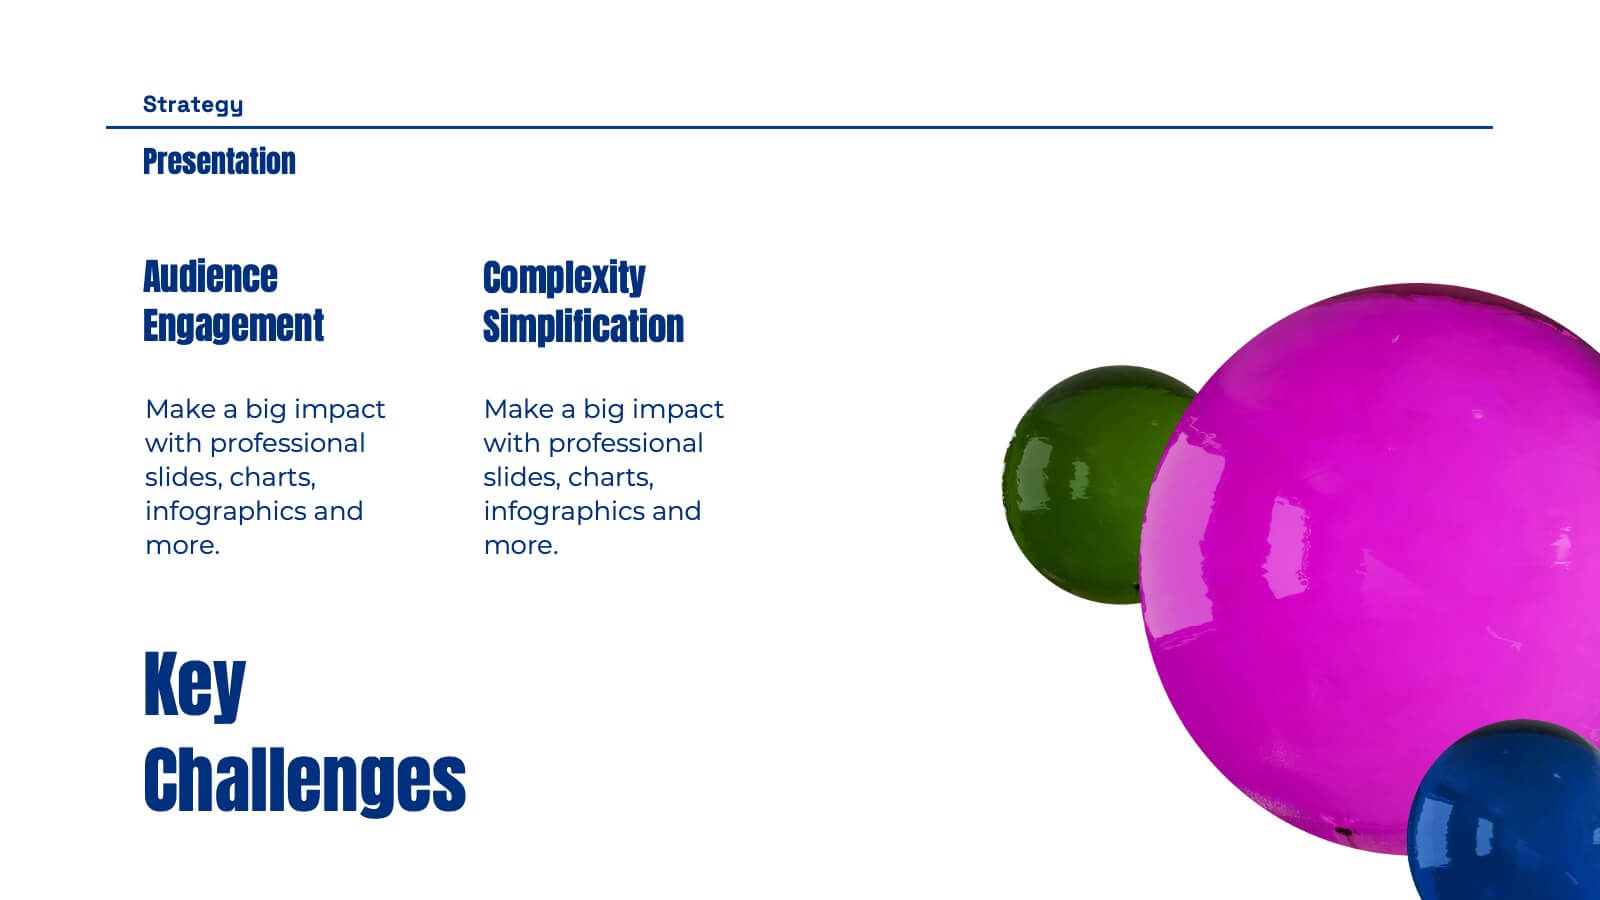
Set your strategy in motion with this dynamic, visually striking presentation template! Perfect for conveying key business insights like competitive analysis, market trends, and strategic objectives, it helps organize your plan for success. Each slide focuses on clarity and effectiveness, making it ideal for impactful presentations. Compatible with PowerPoint, Keynote, and Google Slides for effortless use across platforms.


8 slides
Professional Business Executive Summary Presentation
Make your insights stand tall with a bold, clean layout that feels like a data-driven story in motion. This executive summary slide is perfect for breaking down complex ideas into three clear steps, using sleek vertical bars to add visual rhythm. Compatible with PowerPoint, Keynote, and Google Slides for easy editing.


7 slides
One-Page Business Model Overview Presentation
Simplify your business strategy with this One-Page Business Model slide. Perfect for pitches or internal reviews, it maps out key elements like partners, activities, customers, and revenue on a single page. Clean, customizable blocks help communicate your vision clearly—ideal for startups, entrepreneurs, and teams needing quick business clarity.


7 slides
Pillar Points Infographic Presentation
A Pillar Infographic presents information on a specific topic or subject in a clear and organized manner. It consists of several sections or "pillars" that are interconnected and support the overall message of the infographic. In this template each pillar can be used to represent different aspects of the topic being discussed. Each section contains relevant data, statistics, and other information that illustrates the aspect. This can be used in marketing and advertising to promote products or services, as well as in education and journalism to explain complex ideas in a visually appealing way.


4 slides
Economic Growth in South America Map Presentation
Gain insights into regional development with the Economic Growth in South America Map template, designed to visualize financial data and economic trends across different areas of the continent. It features a clear map highlighting specific countries, accompanied by customizable bars representing economic indicators in dollar values. This template is excellent for presentations analyzing economic performance and growth opportunities within the continent.


22 slides
Verseon Full-Service Agency Project Plan Presentation
Deliver your agency’s strategy with this modern and professional presentation template. Covering key sections such as services, case studies, market analysis, strategy development, and future outlook, it’s designed for seamless customization. Fully editable and compatible with PowerPoint, Keynote, and Google Slides.


3 slides
Hierarchy of Needs Pyramid Visual Presentation
Simplify complex priorities with this Hierarchy of Needs Pyramid Visual presentation. Designed to illustrate layered structures or business priorities, this editable 3D-style pyramid highlights three distinct tiers with customizable text and bold letter labels. Perfect for strategy slides or organizational models in Canva, PowerPoint, or Google Slides.


6 slides
High-Performance Team Building Presentation
Boost team efficiency with the High-Performance Team Building presentation template. Designed to visualize team development stages, leadership strategies, and collaboration efforts, this template is perfect for managers, HR teams, and trainers. The pyramid and rocket-themed design illustrates goal progression, making it easy to track growth. Fully customizable and compatible with PowerPoint, Keynote, and Google Slides.


26 slides
Financial Planning Essentials Presentation
Take control of your financial destiny with our Financial Planning Essentials presentation template, suitable for PowerPoint, Keynote, and Google Slides. This template is meticulously designed for financial advisors, planners, and anyone seeking to educate on the principles of sound financial management. Our Financial Planning Essentials template is a rich resource that provides an extensive range of slides to explain the basics of financial planning, investment strategies, and wealth management. It allows you to break down financial concepts into easy-to-understand elements, making it perfect for client presentations, financial workshops, and educational seminars. Featuring customizable diagrams, charts, and financial models, the template enables a personalized approach to presenting financial data and strategies. Whether you're outlining budgeting techniques, investment plans, or retirement strategies, this template helps you communicate complex information in a clear and professional manner. Optimize your financial planning presentations with our SEO-friendly template to become a trusted resource in financial education and planning. Lead your audience toward financial freedom with a comprehensive and engaging presentation that simplifies the path to financial success.


7 slides
Leadership Qualities Infographic
Strengthen your leadership presentations with our Leadership Qualities infographic, fully compatible with Powerpoint, Keynote, and Google Slides. This infographic is meticulously designed for trainers, coaches, and management professionals keen on illustrating the core attributes that define effective leadership. Our Leadership Qualities infographic provides a vivid portrayal of essential leadership traits, from communication and decision-making to empathy and resilience. It's an excellent resource for workshops, seminars, and courses focused on leadership development. The visual elements are crafted to highlight the contrasts between various leadership styles and the impacts of different leadership behaviors on team dynamics. By using this infographic, you'll be able to foster a deeper understanding of what makes a great leader in the eyes of their team and organization. It's a powerful visual aid that can help initiate discussions on personal development and team-building strategies. Incorporate it into your educational materials to underscore the value of strong leadership in achieving organizational success.


7 slides
Title Infographic
These presentation slides showcase a variety of title designs, each uniquely styled to suit different thematic contexts, using vibrant colors and dynamic typography to captivate and engage audiences. The designs are exceptionally versatile, making them suitable for a wide range of professional settings, including marketing, design, business strategy, and corporate overviews. Each slide is thoughtfully crafted to introduce sections, highlight key concepts, or set the stage for in-depth discussions, ensuring that every part of the presentation connects with the audience effectively. The strategic use of elements such as color blocks, minimalist layouts, and bold text helps in emphasizing the core message, making these slides an ideal choice for presenters looking to make an impactful introduction or to clearly delineate sections within their presentations.


4 slides
Human Resources Strategy and Talent Plan Presentation
Enhance workforce planning and recruitment efforts with the Human Resources Strategy and Talent Plan template. Featuring a circular infographic layout, this design is ideal for showcasing hiring stages, talent development, and HR strategies. Fully customizable in Canva, PowerPoint, and Google Slides to align with organizational goals and brand identity.


5 slides
Venn Diagram Comparison Slide Presentation
Bring clarity to your ideas with a layered visual that makes comparing multiple concepts feel effortless and engaging. This presentation helps you highlight differences, similarities, and key insights using clean shapes and simple labels. Fully customizable and compatible with PowerPoint, Keynote, and Google Slides.


5 slides
Market Growth Strategies in North America Map Presentation
Unveil regional growth opportunities with the Market Growth Strategies in North America Map template, which provides a strategic layout for presenting business growth metrics across various regions.This template includes data-driven graphs to visualize performance and strategy deployment effectively. It's designed to aid professionals in making informed decisions and is compatible with PowerPoint, Keynote, and Google Slides.


7 slides
One-Page Startup Model Canvas
Launch and refine your business idea with clarity using the One-Page Startup Model Canvas Presentation. This slide presents all key startup elements—Partners, Activities, Value Propositions, Customer Segments, Revenue Streams, and more—in a smart puzzle-piece layout that simplifies complex planning. Perfect for founders and pitch decks. Fully customizable in PowerPoint, Keynote, and Google Slides.


6 slides
Agenda on Education Infographic
Our Agenda Slide Templates are thoughtfully designed to facilitate clear and structured presentations for any educational context. Each template features a clean, professional design, making them ideal for delivering complex information in a digestible format. The collection includes various layouts from simple and focused to more detailed and infographic-rich, ensuring that every meeting's purpose is supported visually and functionally. These slides are customizable, allowing users to easily adapt them by changing colors, text, and graphics to suit specific branding needs. They are perfect for enhancing communication in settings that demand clarity and precision, providing all the necessary tools to organize content effectively and engage audiences. They are perfect for enhancing communication in settings that demand clarity and precision, providing all the necessary tools to organize content effectively and engage audiences.


5 slides
South America Location Map Slide Presentation
Highlight your business reach or project data across South America with a clean, professional map layout. This design is perfect for showcasing key locations, regional metrics, or market insights in a visually engaging way. Fully compatible with PowerPoint, Keynote, and Google Slides for effortless customization and presentation.