


Features
- 5 Unique slides
- Fully editable and easy to edit in Microsoft Powerpoint, Keynote and Google Slides
- 16:9 widescreen layout
- Clean and professional designs
- Export to JPG, PDF or send by email


Do you have any questions?
Recommend


5 slides
Coffee Tasting Infographics
Coffee Tasting, also known as coffee cupping, is the process of evaluating and appreciating the flavors, aromas, and characteristics of different coffee beans. These infographic templates are designed to educate participants about the art of coffee tasting. The captivating visuals will empower your audience to appreciate the flavors and nuances of different coffee varieties. Whether you're hosting a coffee tasting event or sharing information with coffee enthusiasts, this template will help you deliver an engaging and visually appealing presentation that celebrates the joy of coffee tasting. Compatible with Powerpoint, Keynote, and Google Slides.


23 slides
Quest Corporate Strategy Proposal Presentation
Unlock success with this powerful corporate strategy template! Detail strategic objectives, market trends, and growth opportunities. Ideal for business leaders aiming to drive growth. Compatible with PowerPoint, Keynote, and Google Slides, this template ensures your strategy is clear, professional, and compelling. Make your vision a reality with impactful presentations.


4 slides
Pharmaceutical Industry Overview Presentation
Get a comprehensive view of the pharmaceutical sector with the Pharmaceutical Industry Overview Presentation template. This well-structured layout is designed to present key insights, industry trends, and regulatory frameworks in a visually compelling format. Perfect for industry analysts, healthcare professionals, and business executives, this template is fully editable and compatible with PowerPoint, Keynote, and Google Slides.


5 slides
Hospital Operations and Services Overview Presentation
Deliver a clear, structured view of healthcare operations with this stethoscope-themed presentation slide. Ideal for medical service breakdowns, hospital department overviews, or care process explanations. Fully customizable in PowerPoint, Keynote, and Google Slides, this layout supports healthcare professionals, administrators, and educators aiming to present medical services with precision and professionalism.


7 slides
30 60 90 Nutritional Plan Infographic
Chart a path to healthful living with the 30 60 90 Nutritional Plan Infographic. In a vibrant mix of yellow, purple, blue, and white, this template presents a visually delightful guide to nutrition enthusiasts and health-conscious audiences. The tailored design encourages a gradual approach to dietary transitions, making it easier to understand and adhere to. Health coaches, dietitians, or fitness trainers will find this as an indispensable tool for workshops, webinars, or consultations. Its seamless integration with PowerPoint, Keynote, and Google Slides enhances the user experience during presentations.


4 slides
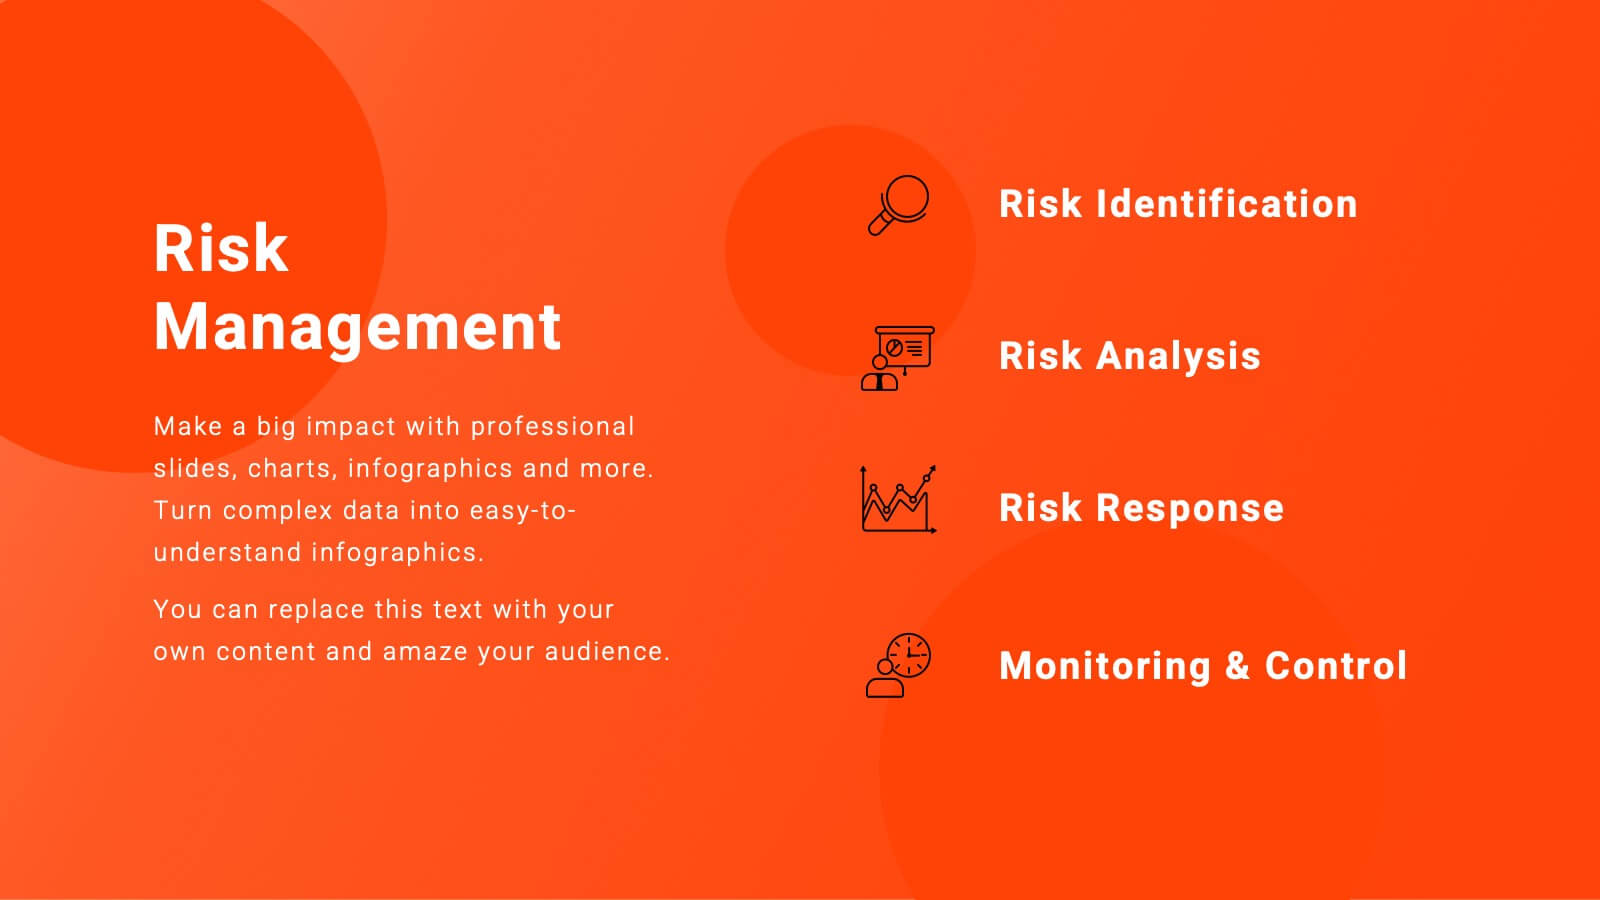
Risk vs Impact Matrix Layout Presentation
Visualize risk levels clearly with the Risk vs Impact Matrix Layout Presentation. This customizable template helps you assess and categorize potential risks based on their likelihood and impact, using a clear 3x3 color-coded grid. Ideal for project managers, risk analysts, and strategy teams. Compatible with PowerPoint, Keynote, Google Slides, and Canva.


6 slides
IT Infrastructure and Services Management Presentation
Visualize key operations clearly with the IT Infrastructure and Services Management Presentation. This slide features a circular diagram paired with five editable content blocks—perfect for mapping infrastructure elements like networks, servers, and tools. The icon-ring design adds clarity and structure to complex workflows. Fully compatible with PowerPoint, Keynote, and Google Slides.


22 slides
Simple Pitch Deck Presentation
Streamline your pitch process with this no-frills Pitch Deck template, designed for clear communication and powerful impact. From the get-go, the cover slide clearly announces your purpose, inviting audiences into your business narrative. The template smoothly transitions from one slide to the next, each one a stepping stone in building your case — from problem to solution. It includes a neatly organized table of contents, thought-provoking mission and vision statements, and data-rich slides for a deep dive into your business metrics. Each section, marked with bold, numbered headers, keeps your presentation on track and your audience engaged. A final 'Thank You' slide adds a touch of professionalism, and the credits section ensures that your sources are transparently acknowledged. This pitch deck is ideal for startups and businesses looking to capture attention and convey their story succinctly.


6 slides
DMAIC Six Sigma Framework Presentation
Dive into process perfection with our DMAIC Six Sigma Framework template! This visually appealing guide breaks down each phase—Define, Measure, Analyze, Improve, and Control—making it easier to streamline operations and enhance quality. Fully compatible with PowerPoint, Keynote, and Google Slides, it's designed for professionals dedicated to operational excellence and continuous improvement.


6 slides
Strategic Blocks in Business Canvas
Visualize and communicate your business model effectively with the Strategic Blocks in Business Canvas Presentation. This slide breaks down all critical segments—Partners, Activities, Resources, Value Propositions, Channels, Revenue Streams, and more—into a clean and colorful layout for strategic planning and stakeholder alignment. Fully editable in PowerPoint, Keynote, and Google Slides.


6 slides
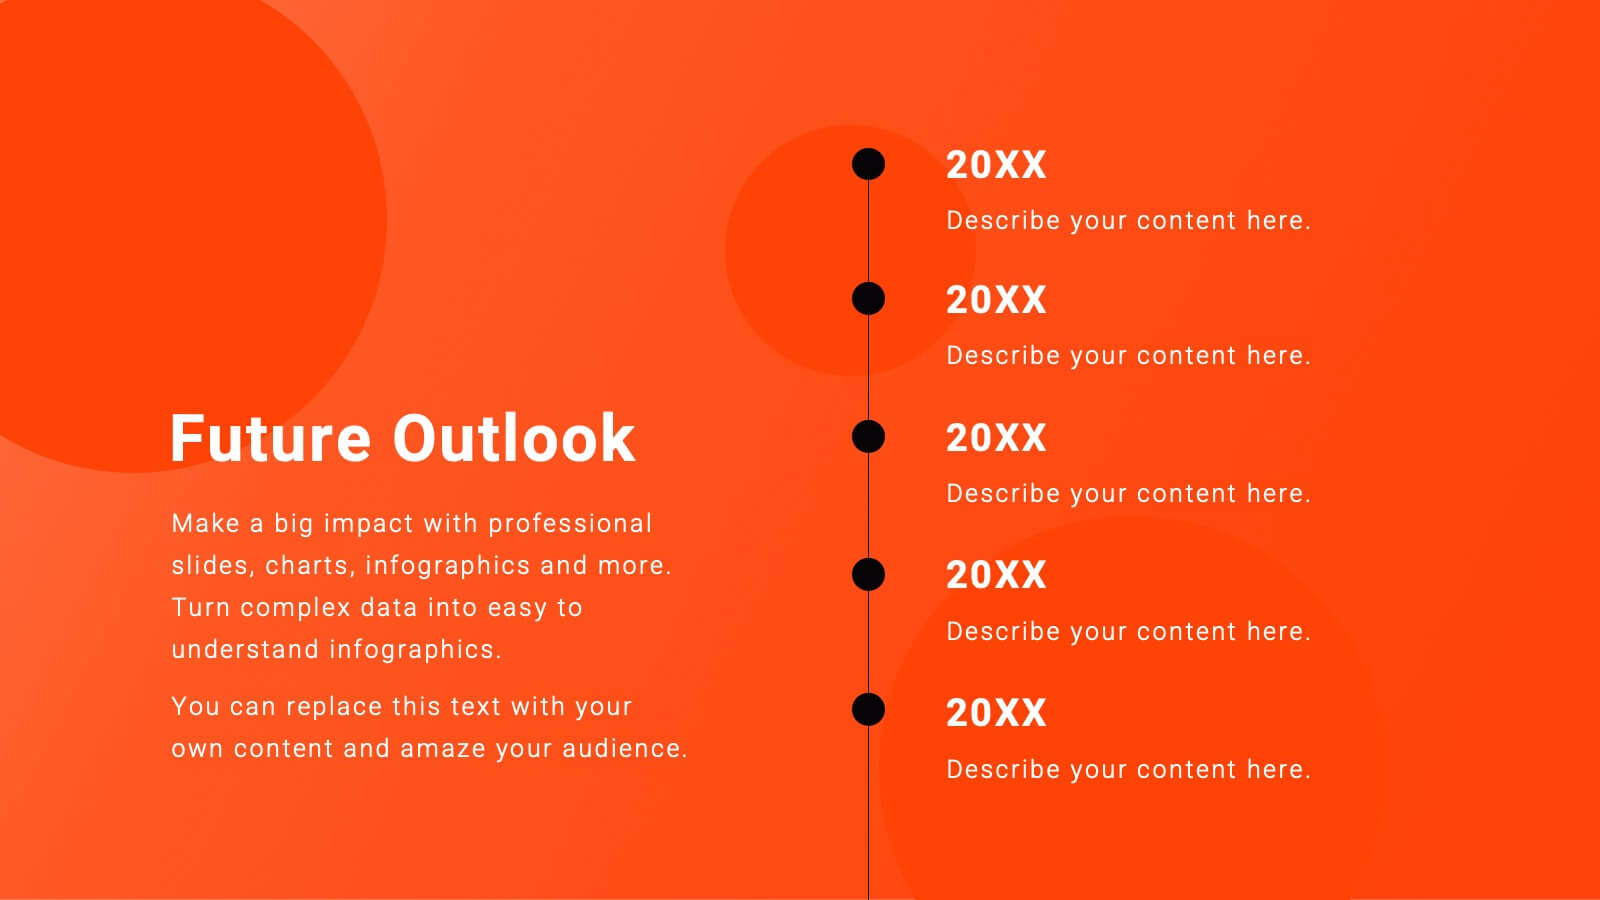
Project Schedule Timeline Presentation
Plan, track, and showcase progress with this sleek timeline layout designed to visualize every milestone with clarity. Ideal for organizing project phases, deadlines, or deliverables, it helps communicate workflows efficiently and professionally. Fully editable and compatible with PowerPoint, Keynote, and Google Slides for easy customization and seamless presentation design.


4 slides
Business Cycle Diagram Overview Presentation
Illustrate your business processes with this modern cycle diagram template. Designed to showcase four interconnected stages, it’s ideal for visualizing workflows, project phases, or continuous improvement models. Fully editable in Canva, PowerPoint, and Google Slides, this template helps you present complex cycles with clarity and visual impact.


4 slides
Differentiation through Blue Ocean Framework Presentation
Make waves with this bold, eye-catching layout built to show what sets your strategy apart. This presentation template explores how to stand out in untapped markets using a simple comparison framework, perfect for teams shifting from competition to innovation. Easily editable and ready for PowerPoint, Keynote, and Google Slides.


7 slides
Africa Colonization Map Infographic
Embark on a historical exploration with our meticulously designed Africa colonization map infographic. Colored with the earthy green, the profound blue, the intense red, and the radiant yellow, our template serves as a vivid chronicle of Africa's colonial past. Detailed with sharp infographics, emblematic icons, and region-specific image placeholders, it provides a comprehensive overview of colonial footprints across the continent. Expertly adapted for Powerpoint, Keynote, or Google Slides. An invaluable tool for historians, educators, or anyone delving into the complex colonial history of Africa. Traverse with understanding; let each slide unveil a chapter of Africa's storied past.


23 slides
Equinox Business Operations Plan Presentation
Elevate your business operations with this dynamic plan template! Perfect for detailing company background, market opportunities, and strategic objectives. Ideal for business leaders and managers aiming to streamline operations and drive growth. Compatible with PowerPoint, Keynote, and Google Slides, this template ensures your business plan is clear, professional, and impactful. Drive success today!


6 slides
5-Stage Circular Cycle Presentation
Energize your workflow with a clean, circular layout that turns five interconnected steps into a clear, engaging story. This presentation helps you explain any repeating process or continuous cycle with simplicity and flow, making complex ideas easier to follow. Compatible with PowerPoint, Keynote, and Google Slides.


7 slides
Responsibility Assignment Matrix Diagram Presentation
A Responsibility Assignment Matrix is a tool used to define and communicate project roles and responsibilities. This template can be used as a valuable tool for any project team. By representing the various assignments and roles, the (RAM) helps to ensure that projects are completed on time, within budget, and to the expected quality standards. Use the tips provided to create a clear and effective matrix for your next project. This template includes helpful illustrations and allows you to add tips and additional details related with the roles and responsibilities in context with the task.