


Features
- 5 Unique slides
- Fully editable and easy to edit in Microsoft Powerpoint, Keynote and Google Slides
- 16:9 widescreen layout
- Clean and professional designs
- Export to JPG, PDF or send by email


Do you have any questions?
Recommend


10 slides
Digital Transformation Strategy Presentation
The "Digital Transformation Strategy Presentation" template is designed to clearly showcase the stages of digital transformation initiatives. It features a visually appealing layout with concentric circles or varying targets that focus on key elements of transformation strategy. This format is ideal for emphasizing the progression from planning to execution and monitoring of digital strategies. Each section is distinctly colored and provides a space for succinctly labeled titles and detailed descriptions, making it perfect for presenting strategic initiatives, technology implementation, or progress metrics in corporate settings. The template ensures that complex strategies are communicated in an understandable and visually engaging manner.


4 slides
Business Executive Summary Report
Get straight to the point with a clean, colorful slide designed to capture big-picture business insights at a glance. Perfect for summarizing key metrics, strategies, and results, this executive summary template keeps your presentation sharp, structured, and impactful. Fully compatible with PowerPoint, Keynote, and Google Slides for maximum flexibility.


22 slides
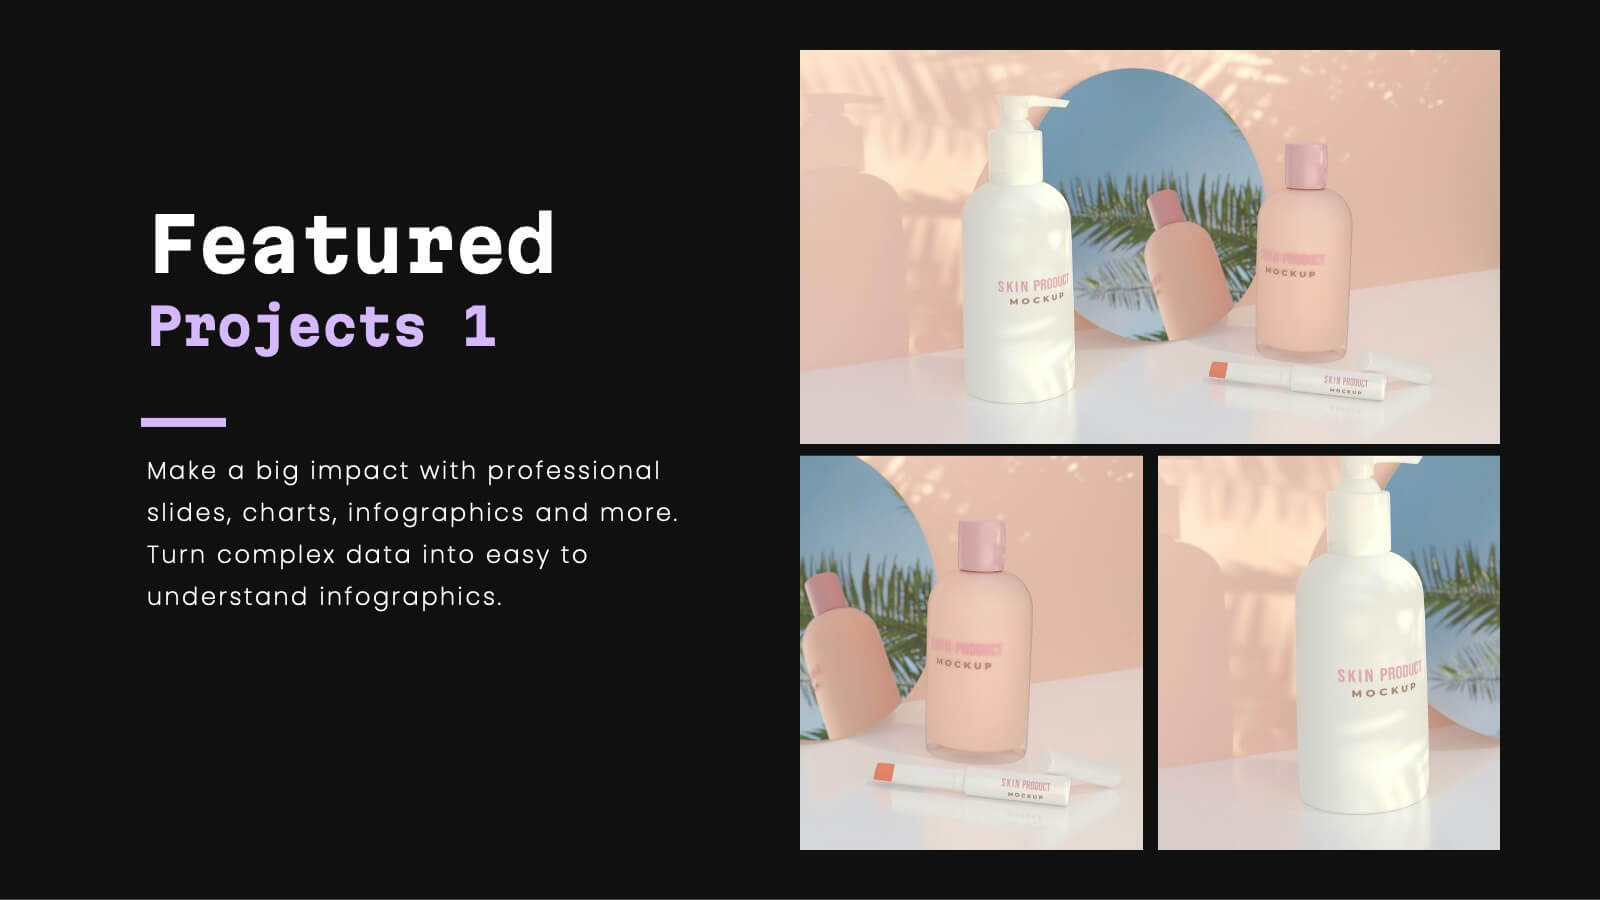
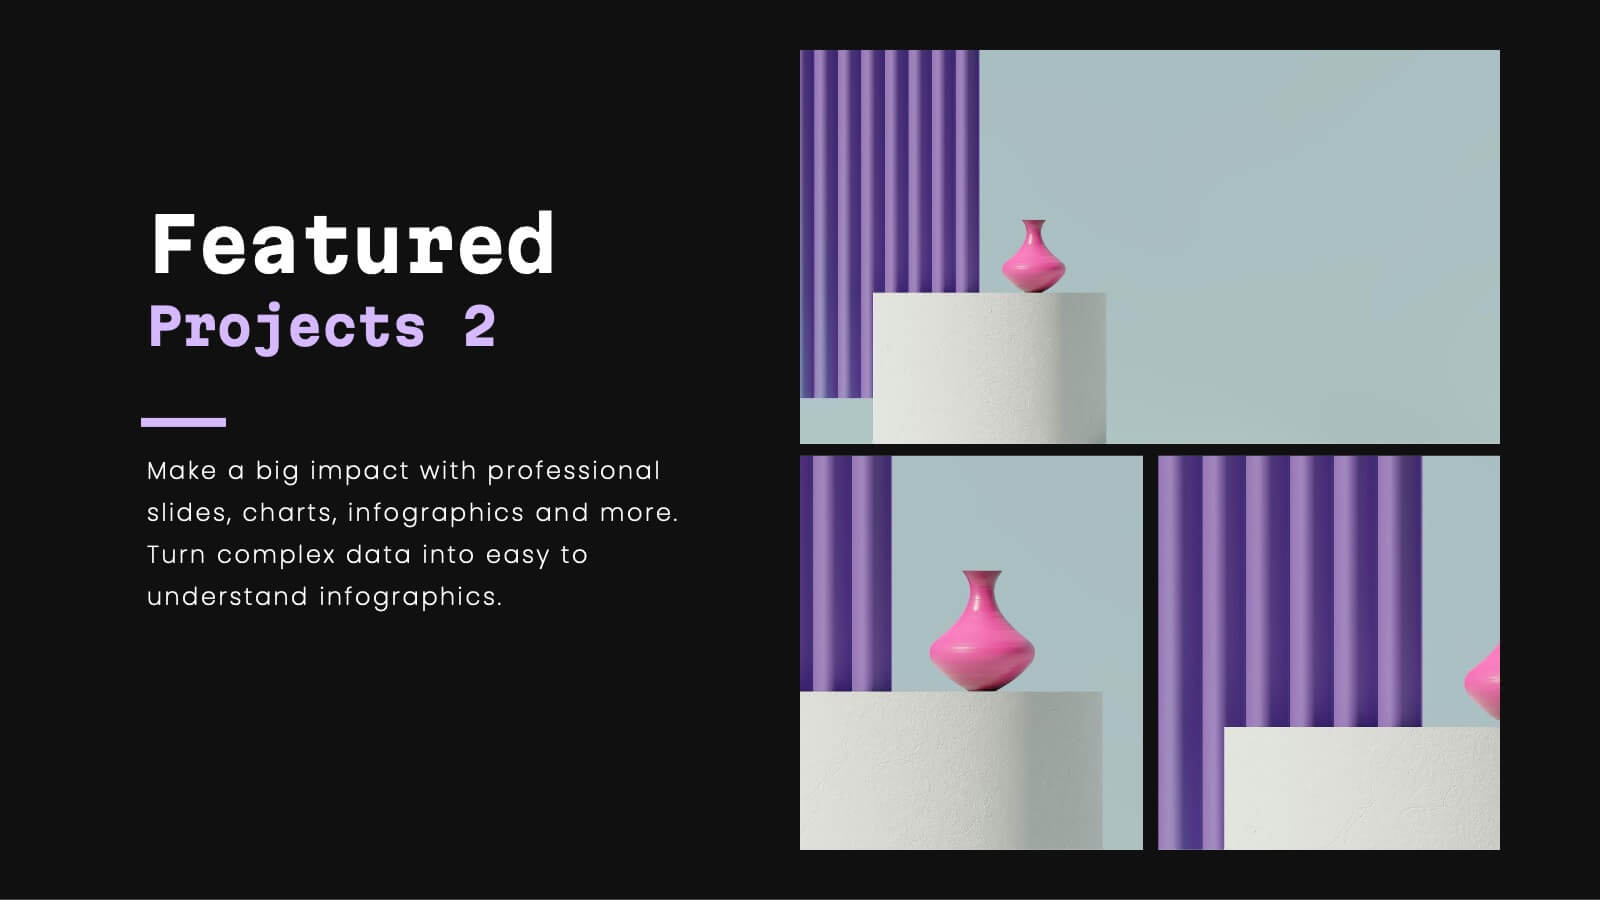
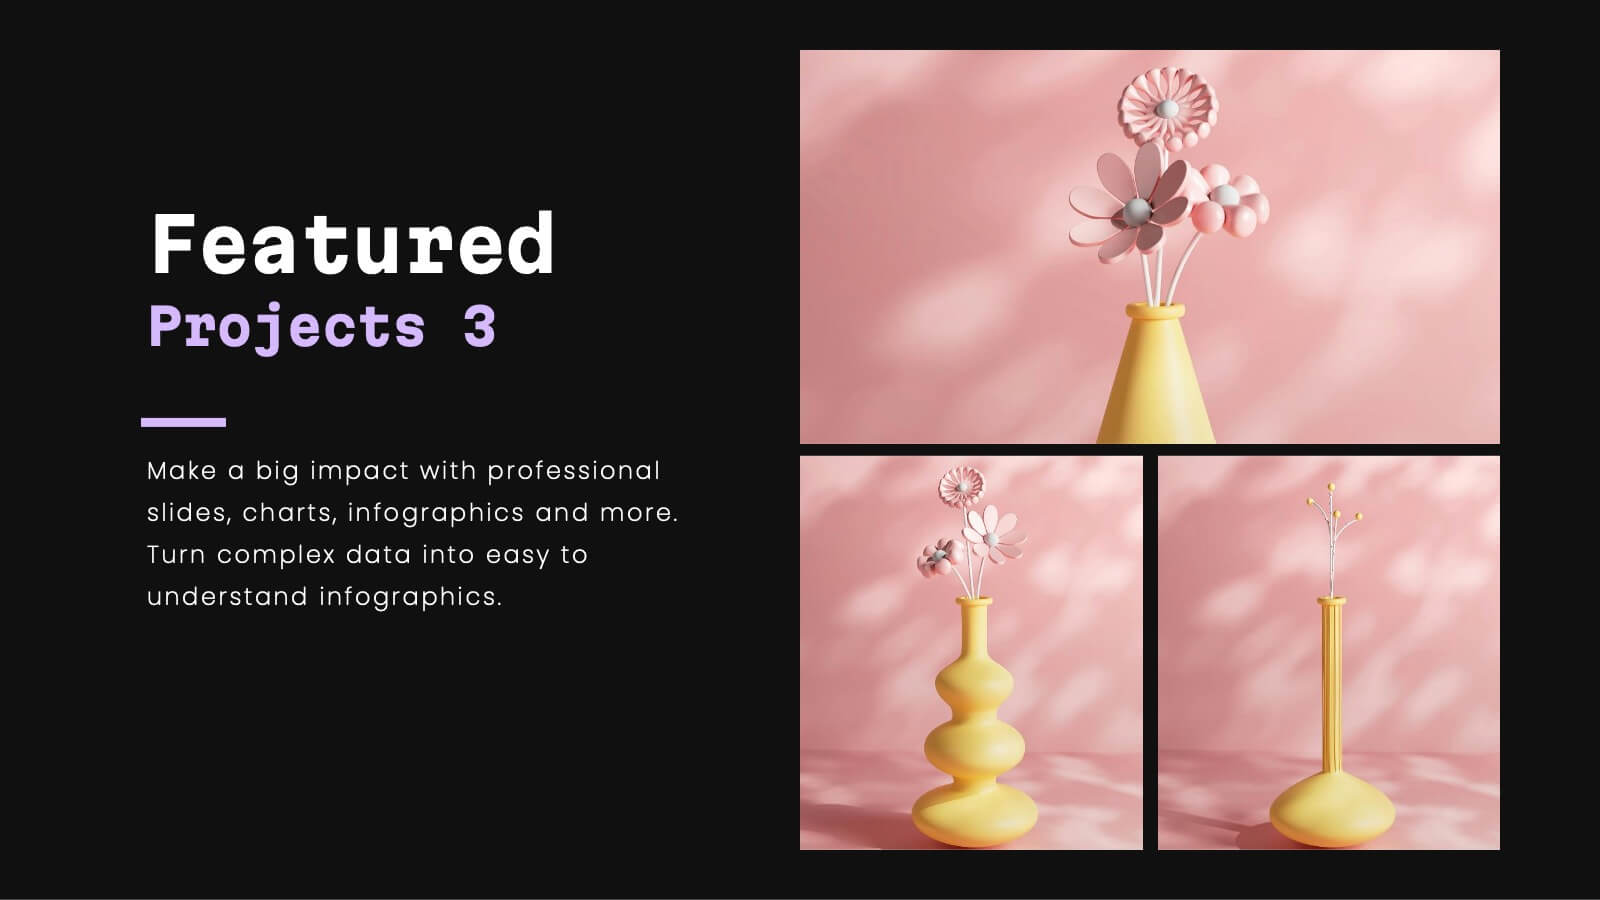
Celeste Professional Portfolio Showcase Presentation
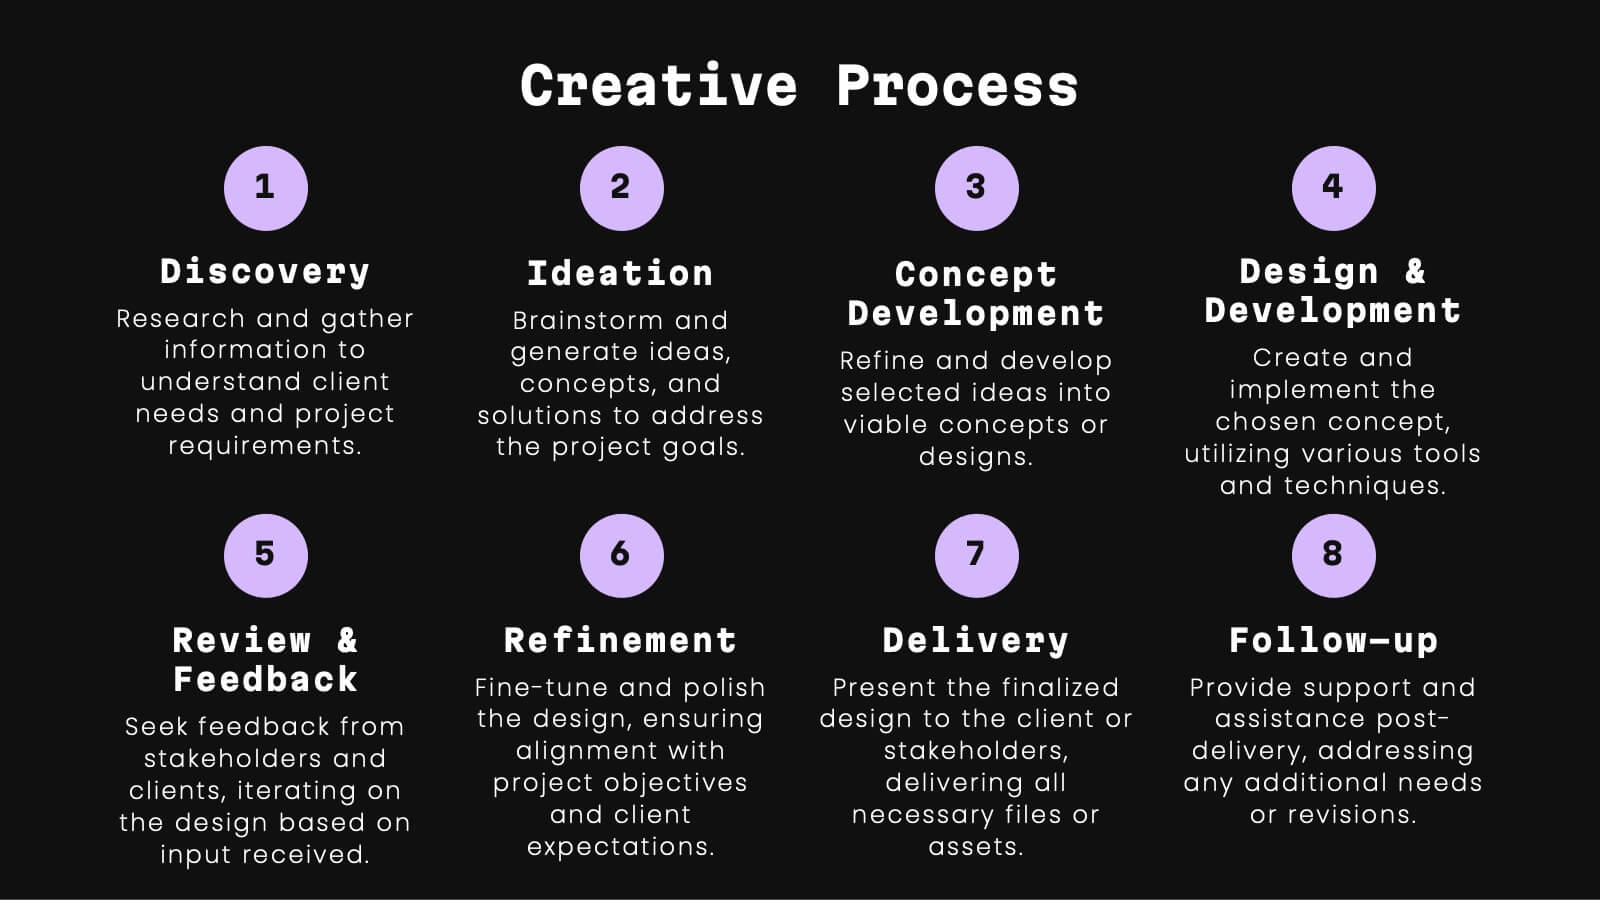
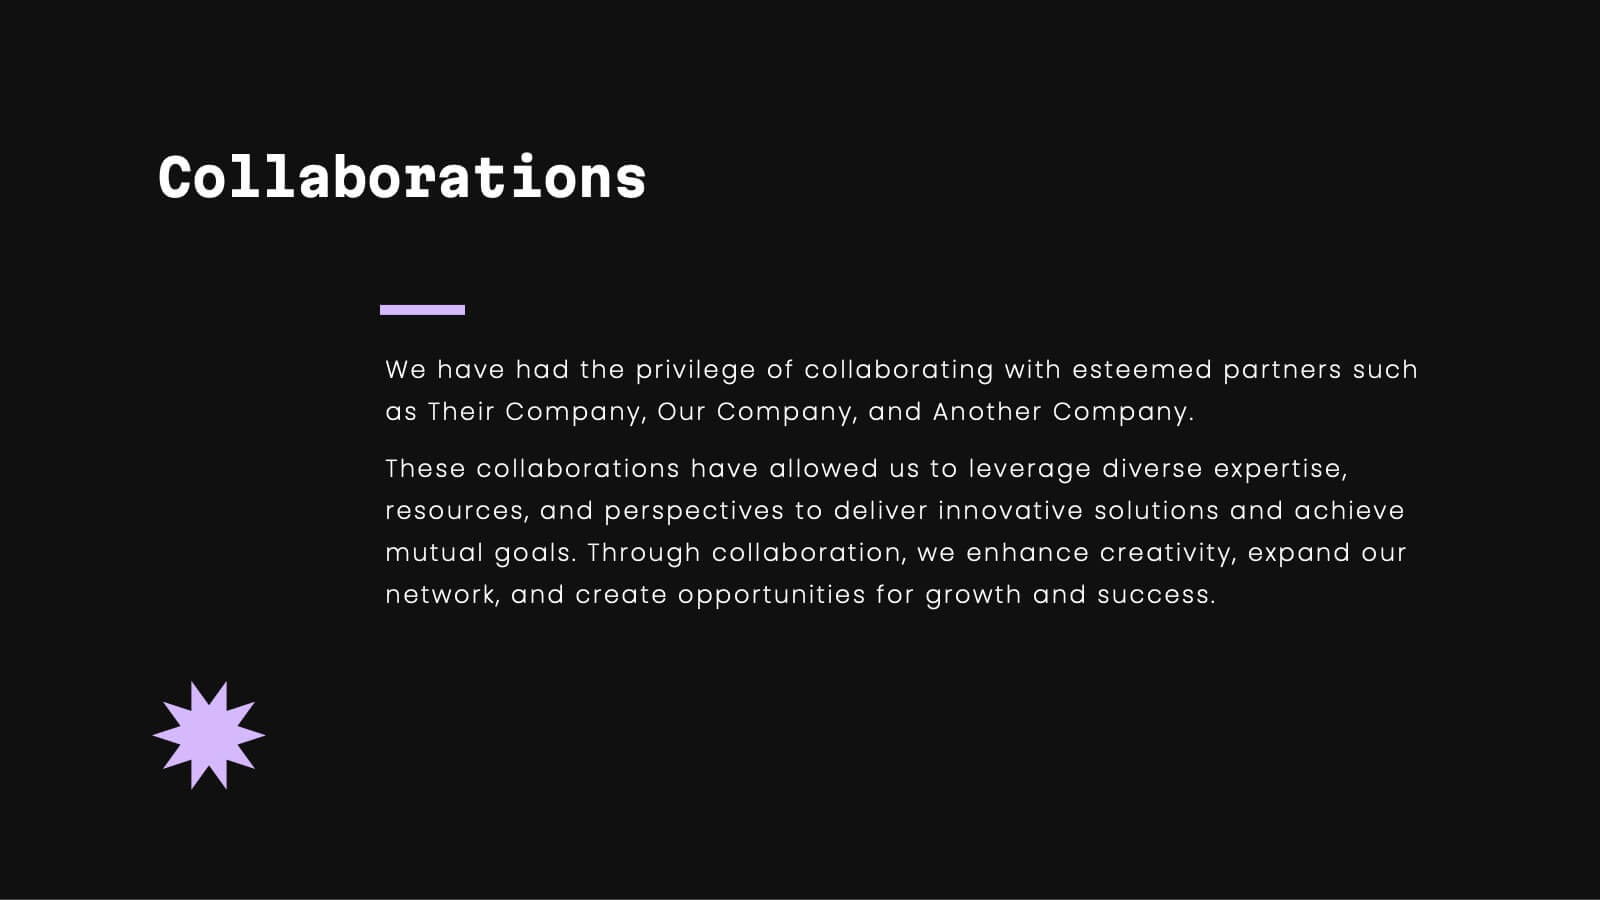
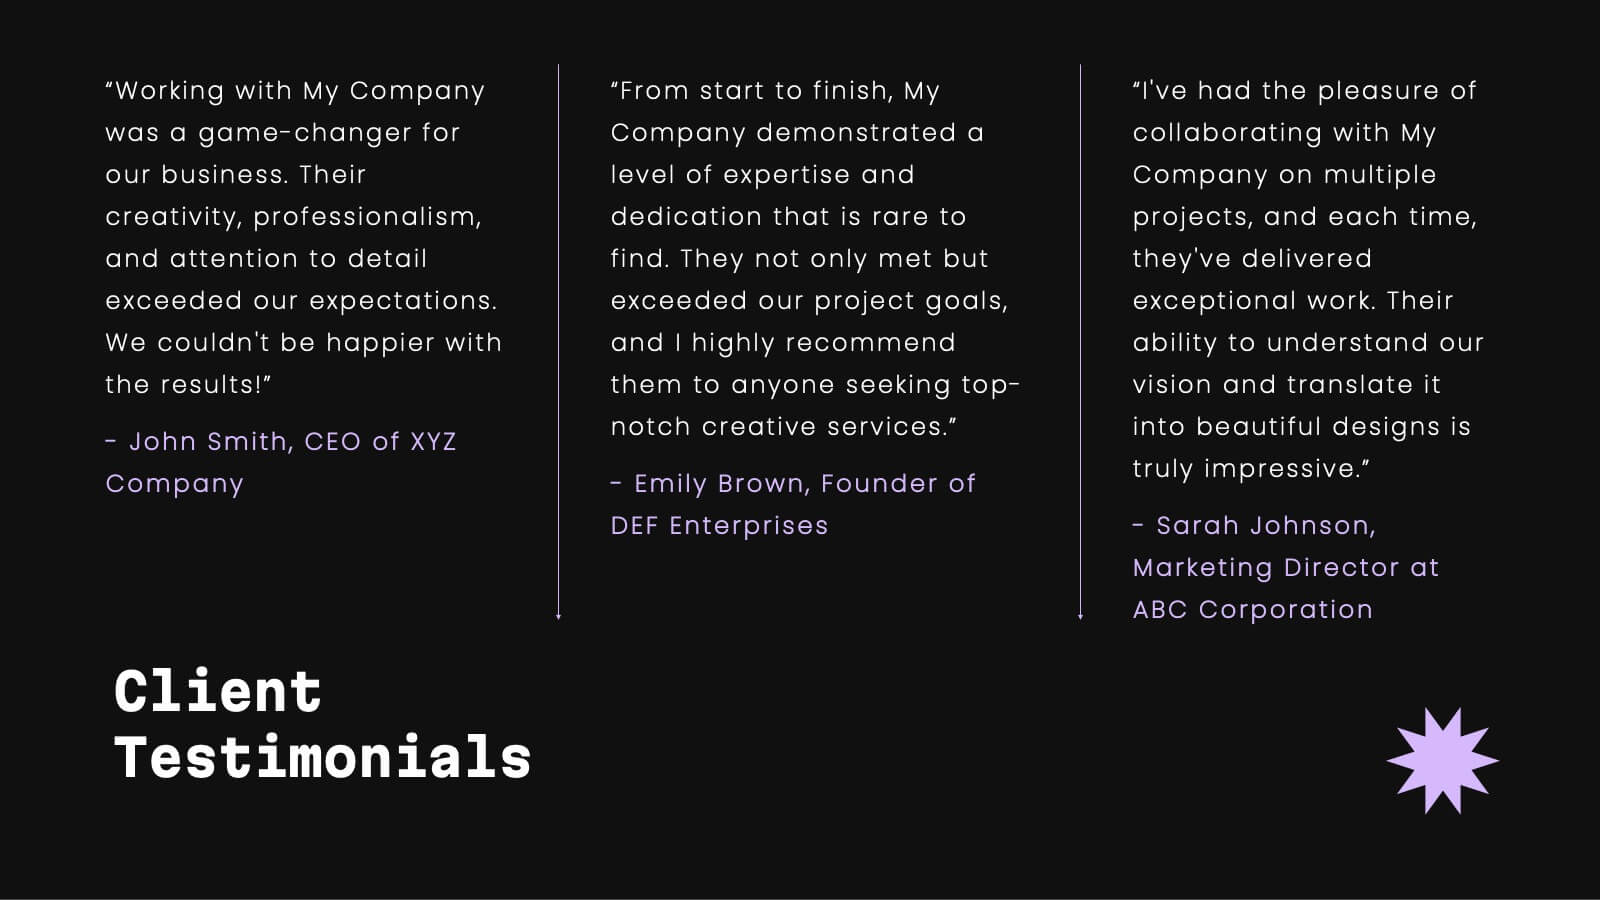
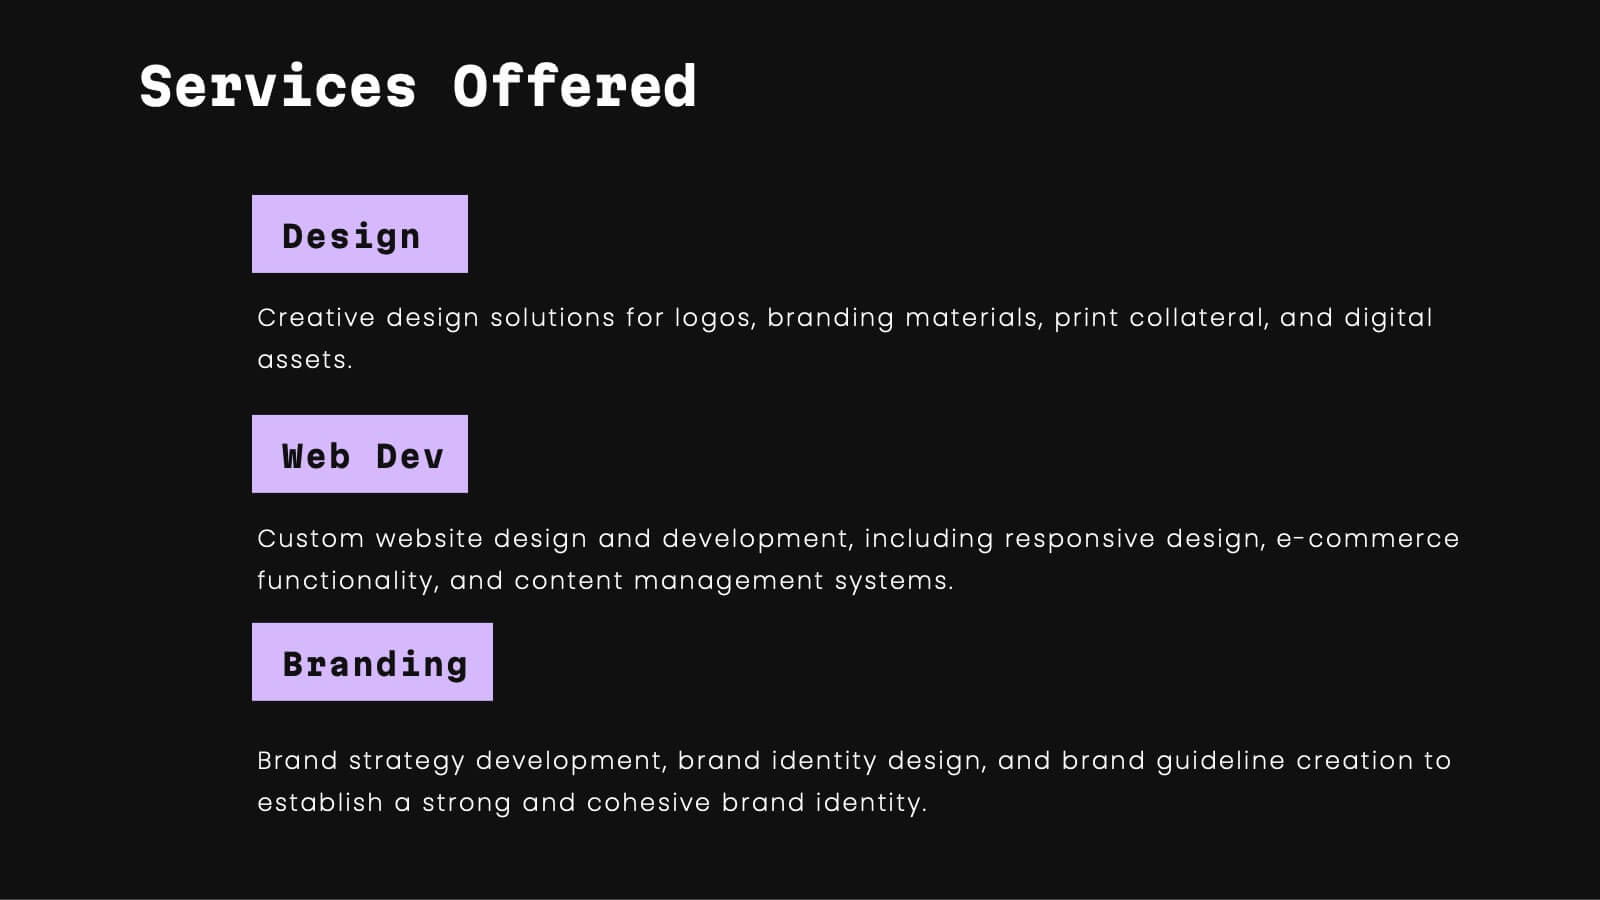
Impress with style using this sophisticated portfolio presentation template. Perfect for showcasing featured projects, creative processes, and client testimonials, this template enhances the visual appeal of your work. Its modern, dark-themed design ensures your content stands out, making a lasting impression. Compatible with PowerPoint, Keynote, and Google Slides, it's versatile for any platform.


5 slides
Buyer Journey Infographic Presentation
Understanding how buyers move from awareness to action becomes effortless with this clean, visual presentation. It guides you through each stage, helping you explain behaviors, insights, and touchpoints with clarity. Easy to customize and fully compatible with PowerPoint, Keynote, and Google Slides.


21 slides
Chimera Marketing Campaign Presentation
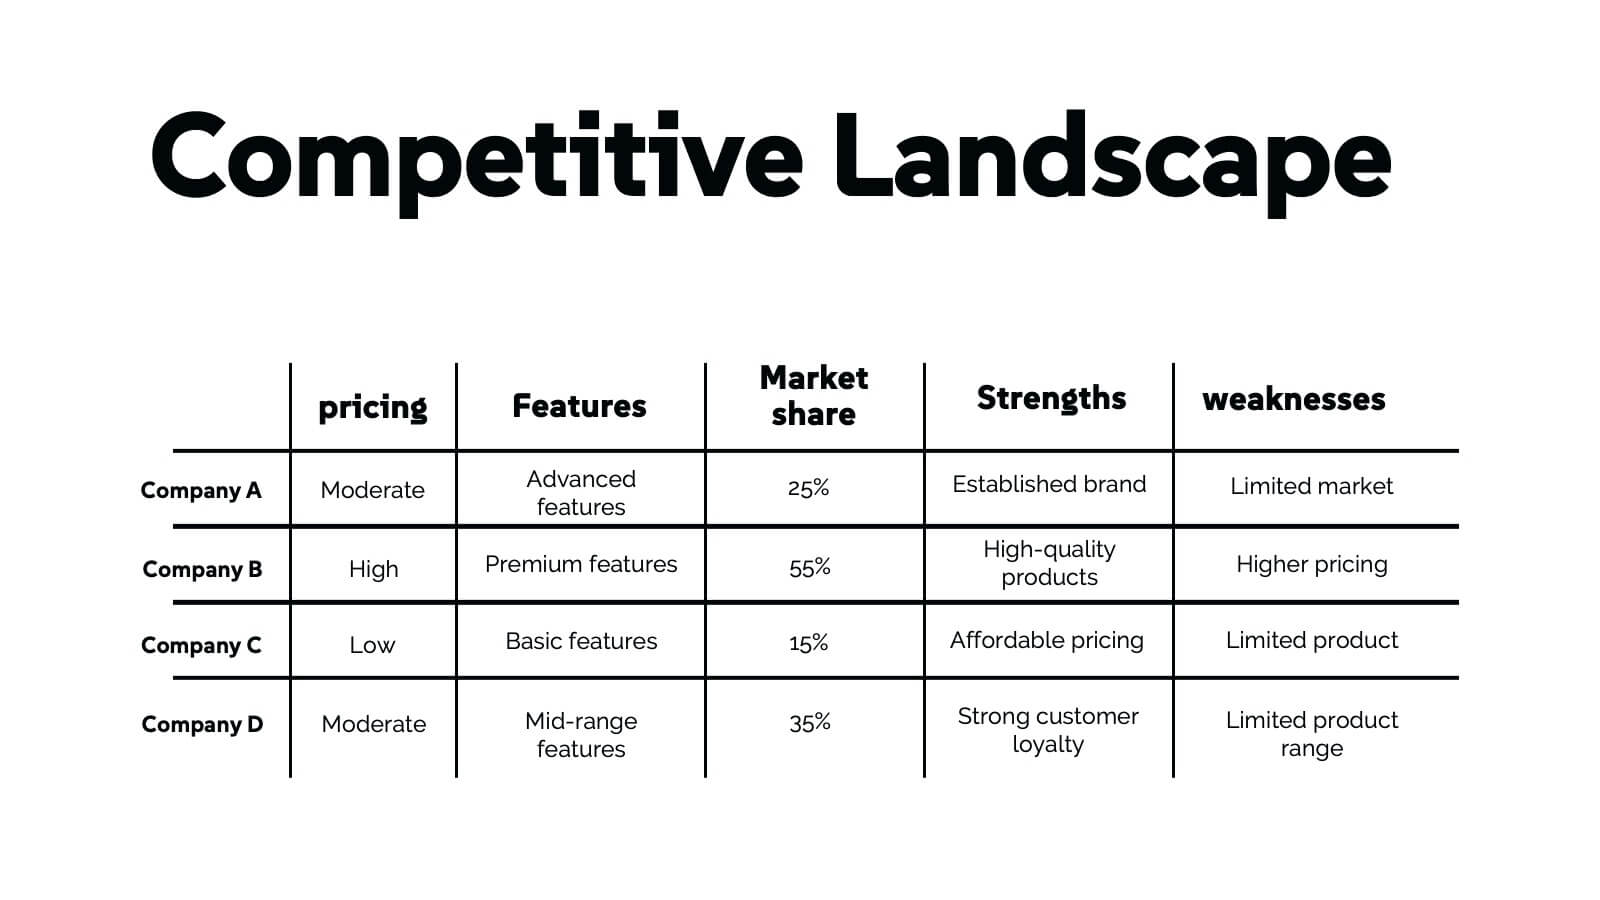
Create a visually engaging digital marketing presentation with this modern template! Covering essential topics like company history, market presence, target audience, and competitive landscape, this template helps you showcase your marketing strategies effectively. Fully customizable, it works seamlessly with PowerPoint, Keynote, and Google Slides for professional presentations every time.


26 slides
Competitive Market Analysis Professional Presentation
Navigate the complex landscape of market competition with this comprehensive presentation template, designed to illustrate competitive market analysis with clarity and impact. The sleek slides are steeped in a modern color palette, artfully combining cool purples and warm corals to capture attention and highlight key insights. Strategic use of infographics brings data to life, from SWOT analyses to market segmentation, ensuring the delivery of information is both visually appealing and easily digestible. It's a template that offers professionals and students alike the ability to dissect and present competitive dynamics with precision, whether it’s for a business plan, academic project, or strategic meeting. Each slide is a blueprint for understanding market forces, customer segmentation, and competitive positioning. This template is fully compatible with PowerPoint, Keynote, and Google Slides, making it a versatile and indispensable tool for those seeking to make informed decisions and craft compelling market narratives.


10 slides
4-Step Business Process Presentation
Present your ideas with clarity and impact using this clean, structured layout made for professionals who value organization and design. Perfect for outlining strategies, steps, or lists, it keeps your message focused and engaging. Easily customizable and fully compatible with PowerPoint, Keynote, and Google Slides for polished results.


5 slides
Closing Talent Gaps with Skills Data Presentation
Showcase a clear talent strategy with the Closing Talent Gaps with Skills Data Presentation. This infographic-style layout visualizes key workforce stages, helping teams align talent capabilities with organizational needs. Ideal for HR, L&D, and talent management discussions. Fully customizable in Canva, PowerPoint, Google Slides, and Keynote.


6 slides
Sales Process Infographic
The sales process refers to the step-by-step approach or series of activities that a salesperson or sales team follows to close a sale. This infographic template provides an informative overview of the sales process, guiding professionals through each stage and highlighting best practices for success. This template is designed to help you outlines the key stages involved in the sales process. This is a valuable resource for professionals seeking to enhance their understanding of the sales process and improve their performance. Compatible with Powerpoint, Keynote, and Google Slides.


10 slides
Startup Pitch Deck Presentation
Make your big idea impossible to ignore with a sleek, investor-ready design that tells your startup’s story with clarity and confidence. This presentation helps you outline your vision, market potential, and business strategy in a compelling way. Fully compatible with PowerPoint, Keynote, and Google Slides for effortless customization.


5 slides
Hierarchical Pyramid Chart Presentation
Bring structure to your ideas with a clean, layered visual that makes complexity feel easy to navigate. This presentation helps you explain levels, priorities, and organizational breakdowns with clarity and flow. Ideal for planning, strategy, and reporting. Fully compatible with PowerPoint, Keynote, and Google Slides.


26 slides
Abstract Technology Presentation
Artificial intelligence is helping to drive the future and make it better, it has the potential to transform how we live and work. This is a detailed presentation template for artificial intelligence technology, with an abstract design and chart slides that can be used to demonstrate how this technology works. This template will help you inform your audience about what artificial intelligence is. Easy to edit and customize, this template will allow you to create your own story around the concept of artificial intelligence, while still presenting your information in an organized format.


7 slides
Target Market Identification Strategy
Spot your ideal customers with precision using this lightbulb-centered layout designed to highlight key market segments and decision-making factors. Whether you're building buyer personas or refining your strategy, this slide presents your insights in a smart, structured way. Fully compatible with PowerPoint, Keynote, and Google Slides.


6 slides
Numeric Data Slide Layout Presentation
Bring your numbers to life with a clean, flowing visual that turns data into an easy-to-follow story. This presentation guides viewers through each step of your process, helping them understand key insights without overwhelm. Ideal for analytics, reporting, and planning. Fully compatible with PowerPoint, Keynote, and Google Slides.


8 slides
Customer Market Segmentation Analysis
Visualize your audience insights with precision using the Customer Market Segmentation Analysis Presentation. This slide features a sleek, layered funnel design with percentage bars and arrow pointers—ideal for illustrating demographic splits, buyer behavior, or psychographic segments. With space for four data-driven categories and custom labels, this template is perfect for marketers, analysts, and product teams looking to present actionable customer data. Fully editable in PowerPoint, Keynote, and Google Slides, and easy to adapt to any color scheme or branding.


4 slides
Lead Nurturing Funnel Breakdown Presentation
Guide leads through every stage with the Lead Nurturing Funnel Breakdown Presentation. This slide visualizes the customer journey from awareness to conversion, helping you present marketing automation, CRM strategies, or content funnels. Fully customizable in PowerPoint, Google Slides, and Canva for seamless integration.


6 slides
Constructive Feedback Infographics
Improve your feedback processes with our Constructive Feedback infographic template. This template is fully compatible with popular presentation software like PowerPoint, Keynote, and Google Slides, allowing you to easily customize it to illustrate and communicate the principles of providing effective constructive feedback. The Constructive Feedback infographic template offers a visually engaging platform to outline the key elements of delivering feedback that promotes growth and improvement. Whether you're a manager, team leader, educator, or simply interested in enhancing your feedback skills, this template provides a user-friendly canvas to create informative presentations and educational materials. Optimize your feedback delivery with this SEO-optimized Constructive Feedback infographic template, thoughtfully designed for clarity and ease of use. Customize it to showcase the importance of specific, actionable, and balanced feedback, helping you enhance communication and drive positive change within your team or organization. Start crafting your personalized infographic today to become more proficient in providing constructive feedback.