


Features
- 6 Unique slides
- Fully editable and easy to edit in Microsoft Powerpoint, Keynote and Google Slides
- 16:9 widescreen layout
- Clean and professional designs
- Export to JPG, PDF or send by email


Do you have any questions?
Recommend


5 slides
Agile Project Roadmap Presentation
Visualize your quarterly project plans with clarity using this Agile roadmap slide. Designed with a horizontal layout for Q1 to Q4, this infographic includes three workstreams and color-coded bars to represent initiatives or sprints. Icons provide quick visual cues for different teams or objectives. Ideal for agile teams, product managers, or project leads who need a clean, editable layout. Compatible with PowerPoint, Keynote, and Google Slides.


6 slides
Next Steps Outline for Project Teams Presentation
Keep your team aligned and motivated with a clear visual roadmap that outlines every upcoming milestone. Perfect for presenting project phases, workflow updates, or strategic goals, this slide ensures everyone knows what’s next. Fully compatible with PowerPoint, Keynote, and Google Slides for seamless editing and presentation versatility.


5 slides
Real-Time Data Dashboard Presentation
Bring your data to life with a dynamic layout that tracks key metrics as they shift by the moment. This presentation helps you present trends, performance indicators, and live insights with clarity and impact, ideal for fast-moving teams. Fully compatible with PowerPoint, Keynote, and Google Slides.


6 slides
Informational Data Table Overview Presentation
Present your tasks with clarity using this Informational Data Table Overview presentation. Perfect for team planning, status updates, or project management, this slide helps you organize tasks by name, due date, priority, and assignment. Visual indicators make it easy to track progress at a glance. Fully editable in PowerPoint, Canva, and Google Slides.


21 slides
Starchime UX Case Study Presentation
Showcase your UX design process with this case study template, covering research, user journey mapping, wireframes, and usability testing. Ideal for presenting design insights and outcomes. Compatible with PowerPoint, Keynote, and Google Slides, it’s perfect for a clear, professional, and impactful UX design presentation.


7 slides
Decision Tree Diagram Infographics
A Decision Tree Diagram is a visual representation of a decision-making process that uses a tree-like structure to map out various possible outcomes and their associated probabilities. This template can be used in fields such as business, economics, and data science to model complex decision-making scenarios. This infographic starts with a single node, representing the initial decision that needs to be taken. From this node, paths extend to other nodes representing possible outcomes that could occur as a result of the initial decision. The final nodes of the diagram represent the end results.


6 slides
Business Growth Metrics Butterfly Chart
Highlight performance patterns and opportunities with the Business Growth Metrics Butterfly Chart Presentation. This engaging layout uses mirrored radial segments to present six growth indicators—ideal for tracking progress across two categories, departments, or timeframes. The butterfly-shaped curves draw the viewer’s attention to the center, making comparisons intuitive and visually balanced. Fully customizable in PowerPoint, Keynote, and Google Slides, this template is perfect for showcasing KPI trends, sales metrics, or marketing performance.


6 slides
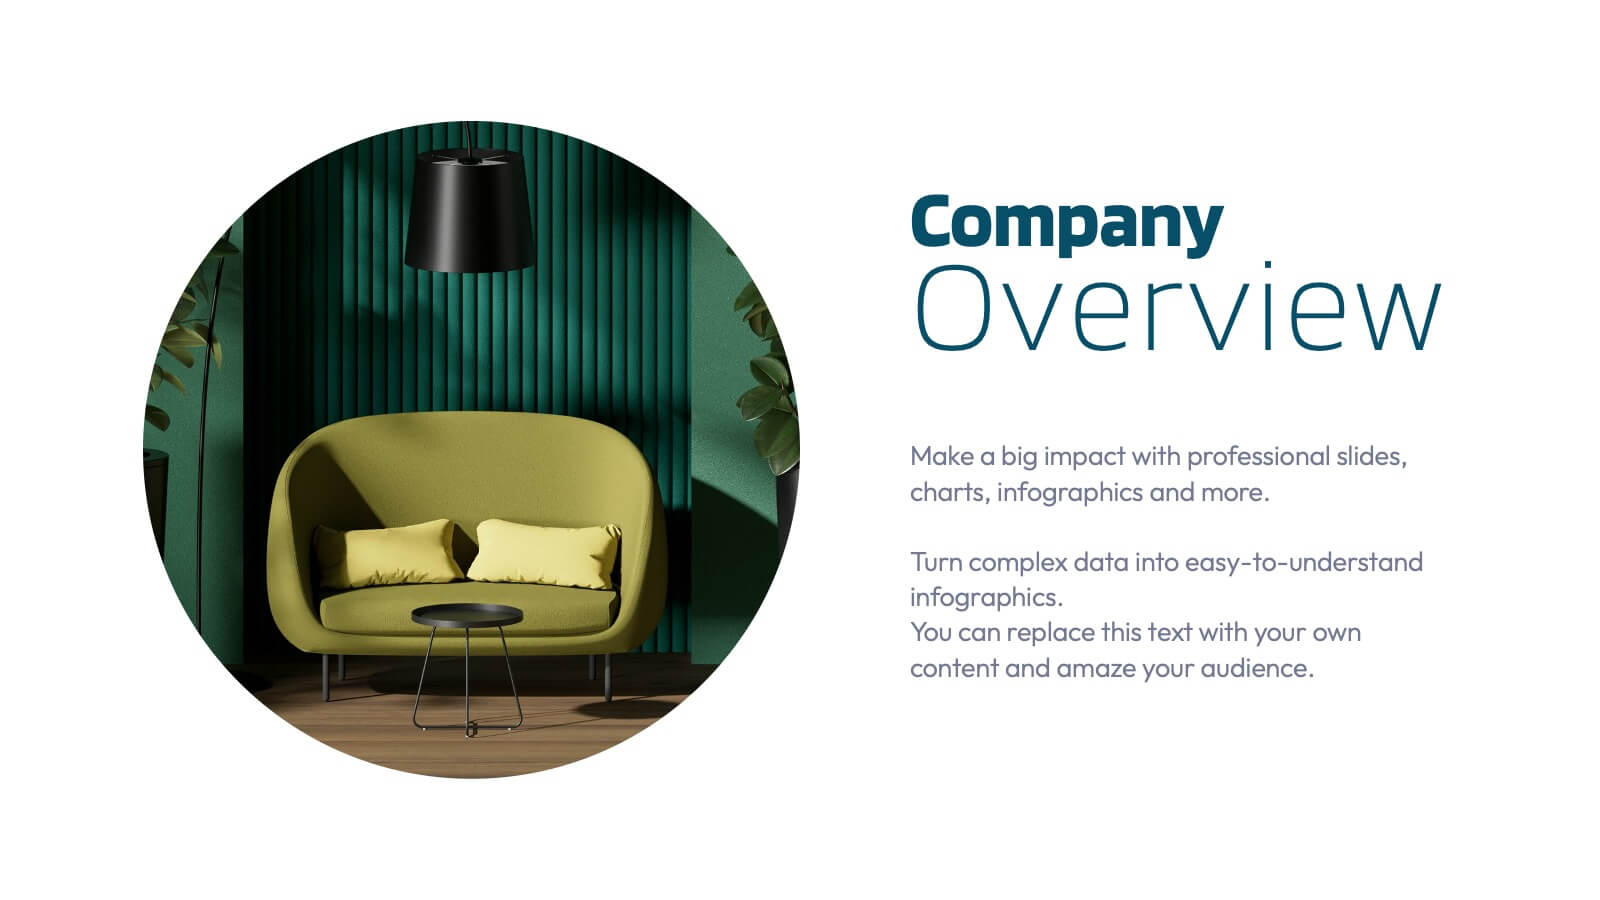
Engaging Opening Introduction
Start strong with this visually engaging slide layout, perfect for setting the tone in professional meetings or pitches. Highlight key themes or concepts alongside image placeholders that bring your message to life. Fully customizable in PowerPoint, Keynote, and Google Slides.


7 slides
Anatomy Infographic Presentation Template
Anatomy infographics are visual representations of the different systems and structures of the human body. They are designed to convey complex information in an easily manner and visually appealing way. Our anatomy template include images, diagrams, and text to provide an overview of the different systems of the human body, such as the skeletal, muscular, and cardiovascular systems. Our template can be used for a variety of purposes, including education, medical training, and patient education. The text, colors and images can be easily modified to suit your needs and preferences!


22 slides
Hellenic Small Business Pitch Deck Presentation
Unleash the spirit of entrepreneurship with this captivating Hellenic-themed presentation! Designed specifically for small business pitches, this template allows you to showcase your business concept, market analysis, and financial plans with elegance and clarity. Its vibrant visuals will engage your audience and leave a lasting impression. Compatible with PowerPoint, Keynote, and Google Slides.


6 slides
Innovation Ideas Infographics
Energize your presentations with our Innovation Ideas infographic, designed for full compatibility with Powerpoint, Keynote, and Google Slides. This vibrant and insightful infographic is the perfect addition for innovators, entrepreneurs, and educators looking to foster a culture of creativity and ideation. The infographic provides a visual exploration of the innovation process, from ideation to execution. It highlights key concepts and strategies that stimulate creative thinking and drive innovation within teams and organizations. With a focus on collaborative brainstorming and the incubation of ideas, it serves as a guide to developing groundbreaking concepts. Incorporating this infographic into your slides will help you effectively communicate the dynamics of successful innovation strategies. It’s ideal for workshops, team meetings, and academic courses that cover topics such as design thinking, innovation management, and product development. Use it to inspire your audience and to illustrate a roadmap for transforming ideas into tangible innovations.


5 slides
Africa Country Borders Presentation
Bring geography to life with a clean, modern map design that highlights country boundaries and key regions across Africa. Perfect for showcasing regional data, market analysis, or project coverage, this layout ensures clarity and precision. Fully compatible with PowerPoint, Keynote, and Google Slides for easy customization and use.


5 slides
Dynamic Pricing Strategies
Make pricing strategy look smart and data-driven with this bold, modern infographic template. Designed to explain how pricing evolves with demand, value, and profit margins, this slide visually guides viewers through key steps in your dynamic pricing model. Fully editable and compatible with PowerPoint, Keynote, and Google Slides for seamless use.


5 slides
Public Health Data Presentation
Bright visuals and clean data blocks make this slide an energizing way to present key insights, instantly pulling viewers into the story behind your metrics. It helps simplify complex information while keeping everything clear, structured, and easy to follow. Fully compatible with PowerPoint, Keynote, and Google Slides.


5 slides
Cloud Technology Architecture Presentation
Visualize the power of modern connectivity with this clean and professional template designed to explain digital systems, cloud layers, and data flow. Ideal for tech teams and IT presentations, it simplifies complex information into clear visuals. Fully editable and compatible with PowerPoint, Keynote, and Google Slides for effortless customization.


5 slides
Buyer Persona Strategy Presentation
Enhance Customer Understanding! The Buyer Persona Strategy Presentation template helps analyze customer behaviors, goals, and frustrations to create targeted marketing strategies. Fully editable and compatible with PowerPoint, Keynote, and Google Slides, it’s perfect for marketers and strategists looking to optimize engagement with a modern, professional, and visually compelling layout.


6 slides
Big Data Analytics Presentation
The "Big Data Analytics Presentation" template is expertly designed to visualize global data analytics strategies across different regions. The map highlights key areas in distinct colors, drawing attention to where data initiatives are being implemented or where significant market trends are observed. Each region on the map corresponds to specific titles that can be customized to represent various analytical focuses such as market penetration, user demographics, or revenue growth. Accompanying the map are percentage circles that quantify planning, execution, and success rates, making this template invaluable for analysts, data scientists, and corporate strategists who need to present complex data in an easily digestible format. This visual tool is perfect for enhancing presentations, strategic meetings, and reports with a clear, concise, and visually engaging representation of data-driven insights.