


Features
- 5 Unique slides
- Fully editable and easy to edit in Microsoft Powerpoint, Keynote and Google Slides
- 16:9 widescreen layout
- Clean and professional designs
- Export to JPG, PDF or send by email


Do you have any questions?
Recommend


6 slides
Real Estate Classes Infographic
Real estate classes are educational programs or courses that provide individuals with the knowledge and skills needed to succeed in the real estate industry. This infographic template provides an overview of different types of real estate classes and what real estate is. This is designed to help individuals interested in the real estate industry understand the various educational opportunities available to them. Help your audience make informed decisions about their educational journey in the real estate field. Fully customizable and compatible with Powerpoint, Keynote, and Google Slides.


7 slides
Product Life Cycle Analysis Infographic
Our Product Life Cycle Infographic template is the perfect tool for businesses that want to visually represent the various stages of their products' life cycles, from introduction to decline. Our engaging and easy-to-understand visuals help to illustrate the stages of a product's life cycle in a compelling way, making it easier for businesses to gain a better understanding of their products and how they evolve over time. In short, our Product Life Cycle Infographic template is a valuable tool for businesses that want to stay ahead of the curve and gain a deeper understanding of their products. So why wait? Try our template today and take your product development, marketing, sales, and financial planning to the next level!


5 slides
Cognitive Behavioral Therapy Overview Presentation
Help your audience connect the dots between thoughts, feelings, and behaviors with this clean, illustrated layout. Designed to simplify complex mental health concepts, this CBT infographic template is perfect for educators, coaches, or therapists. Fully editable and compatible with PowerPoint, Keynote, and Google Slides for effortless customization.


5 slides
Business Communication Strategy Presentation
Enhance your Business Communication Strategy with this dynamic infographic template. Designed for corporate presentations, team collaboration, and workflow optimization, it visually organizes key communication pillars for seamless engagement. Fully editable in PowerPoint, Keynote, and Google Slides, ensuring adaptability for diverse business needs.


5 slides
Innovation Framework Presentation
Turn bold ideas into structured success with this engaging presentation design. Perfect for mapping creative processes, innovation systems, and project development stages, it helps present ideas clearly and visually. Fully editable and easy to customize, this presentation is compatible with PowerPoint, Keynote, and Google Slides for effortless use.


7 slides
Supply Chain Process Mapping Presentation
Streamline your logistics and operations presentations with the Supply Chain Process Mapping Presentation. Featuring a linked-chain visual, this editable template is ideal for outlining each step in your supply flow—from sourcing to delivery. Highlight dependencies, bottlenecks, or key stages with customizable color coding. Fully compatible with PowerPoint, Keynote, and Google Slides.

22 slides
Mirage Startup Funding Proposal Presentation
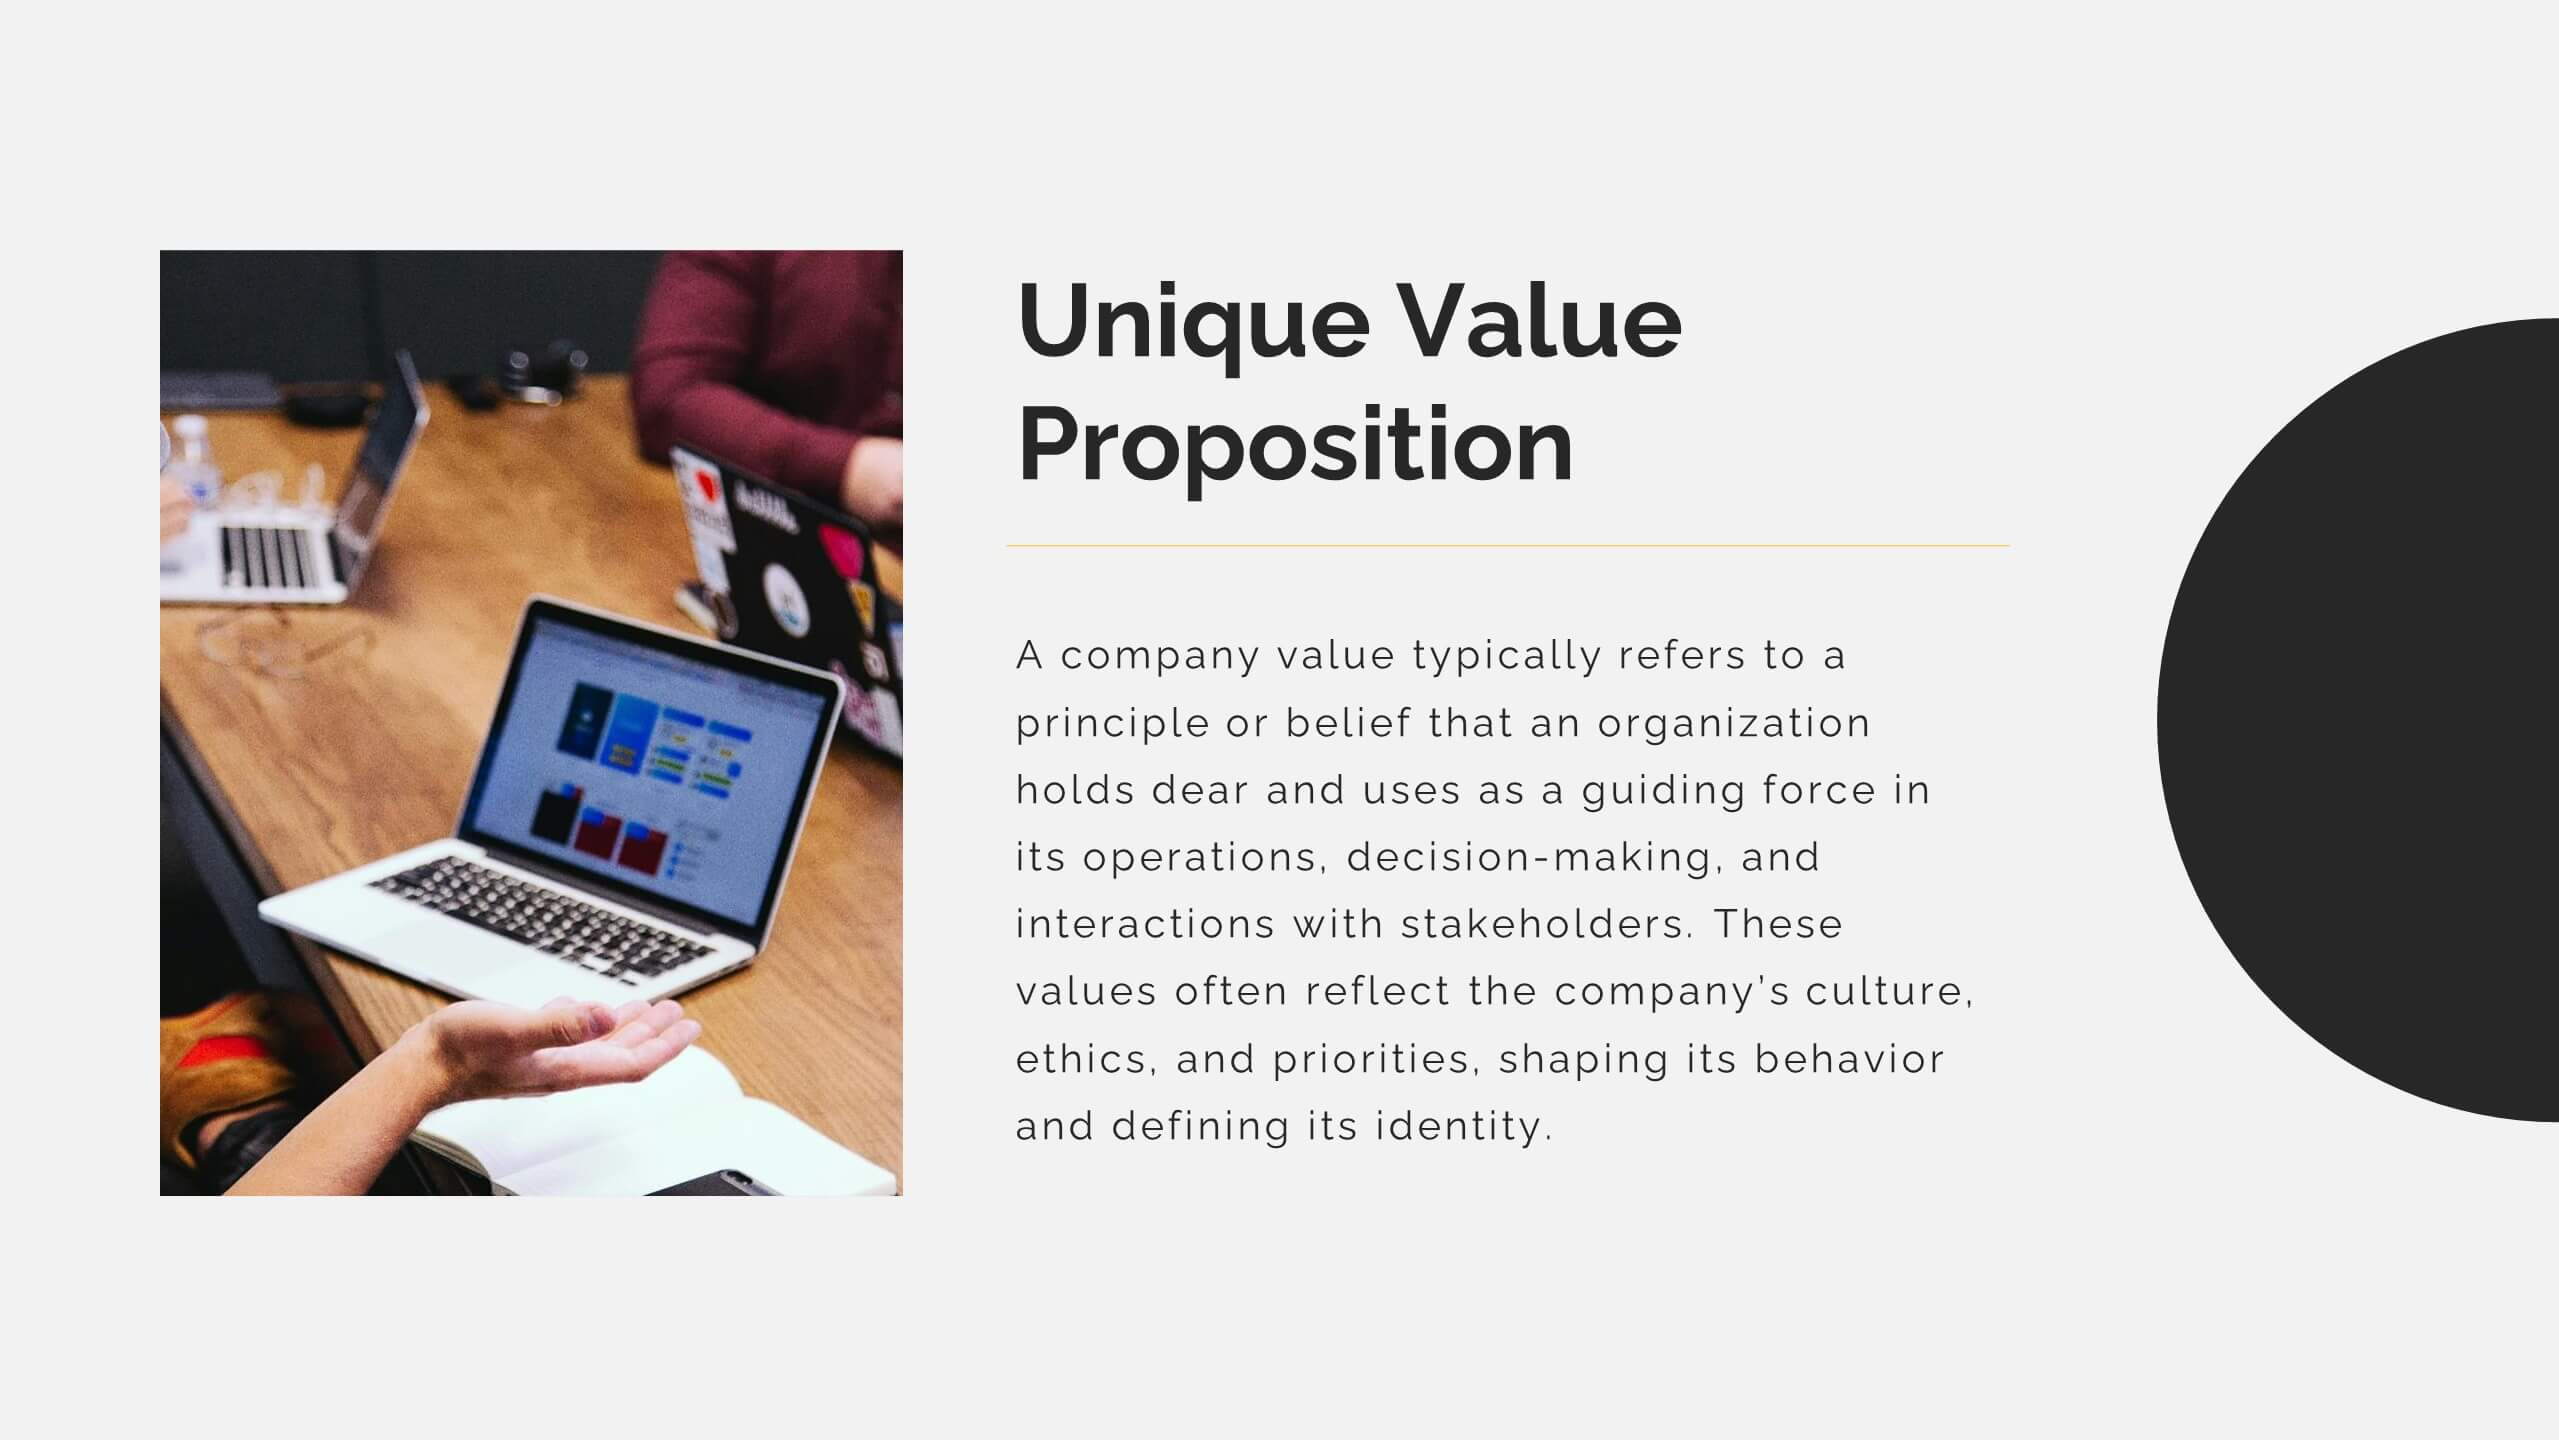
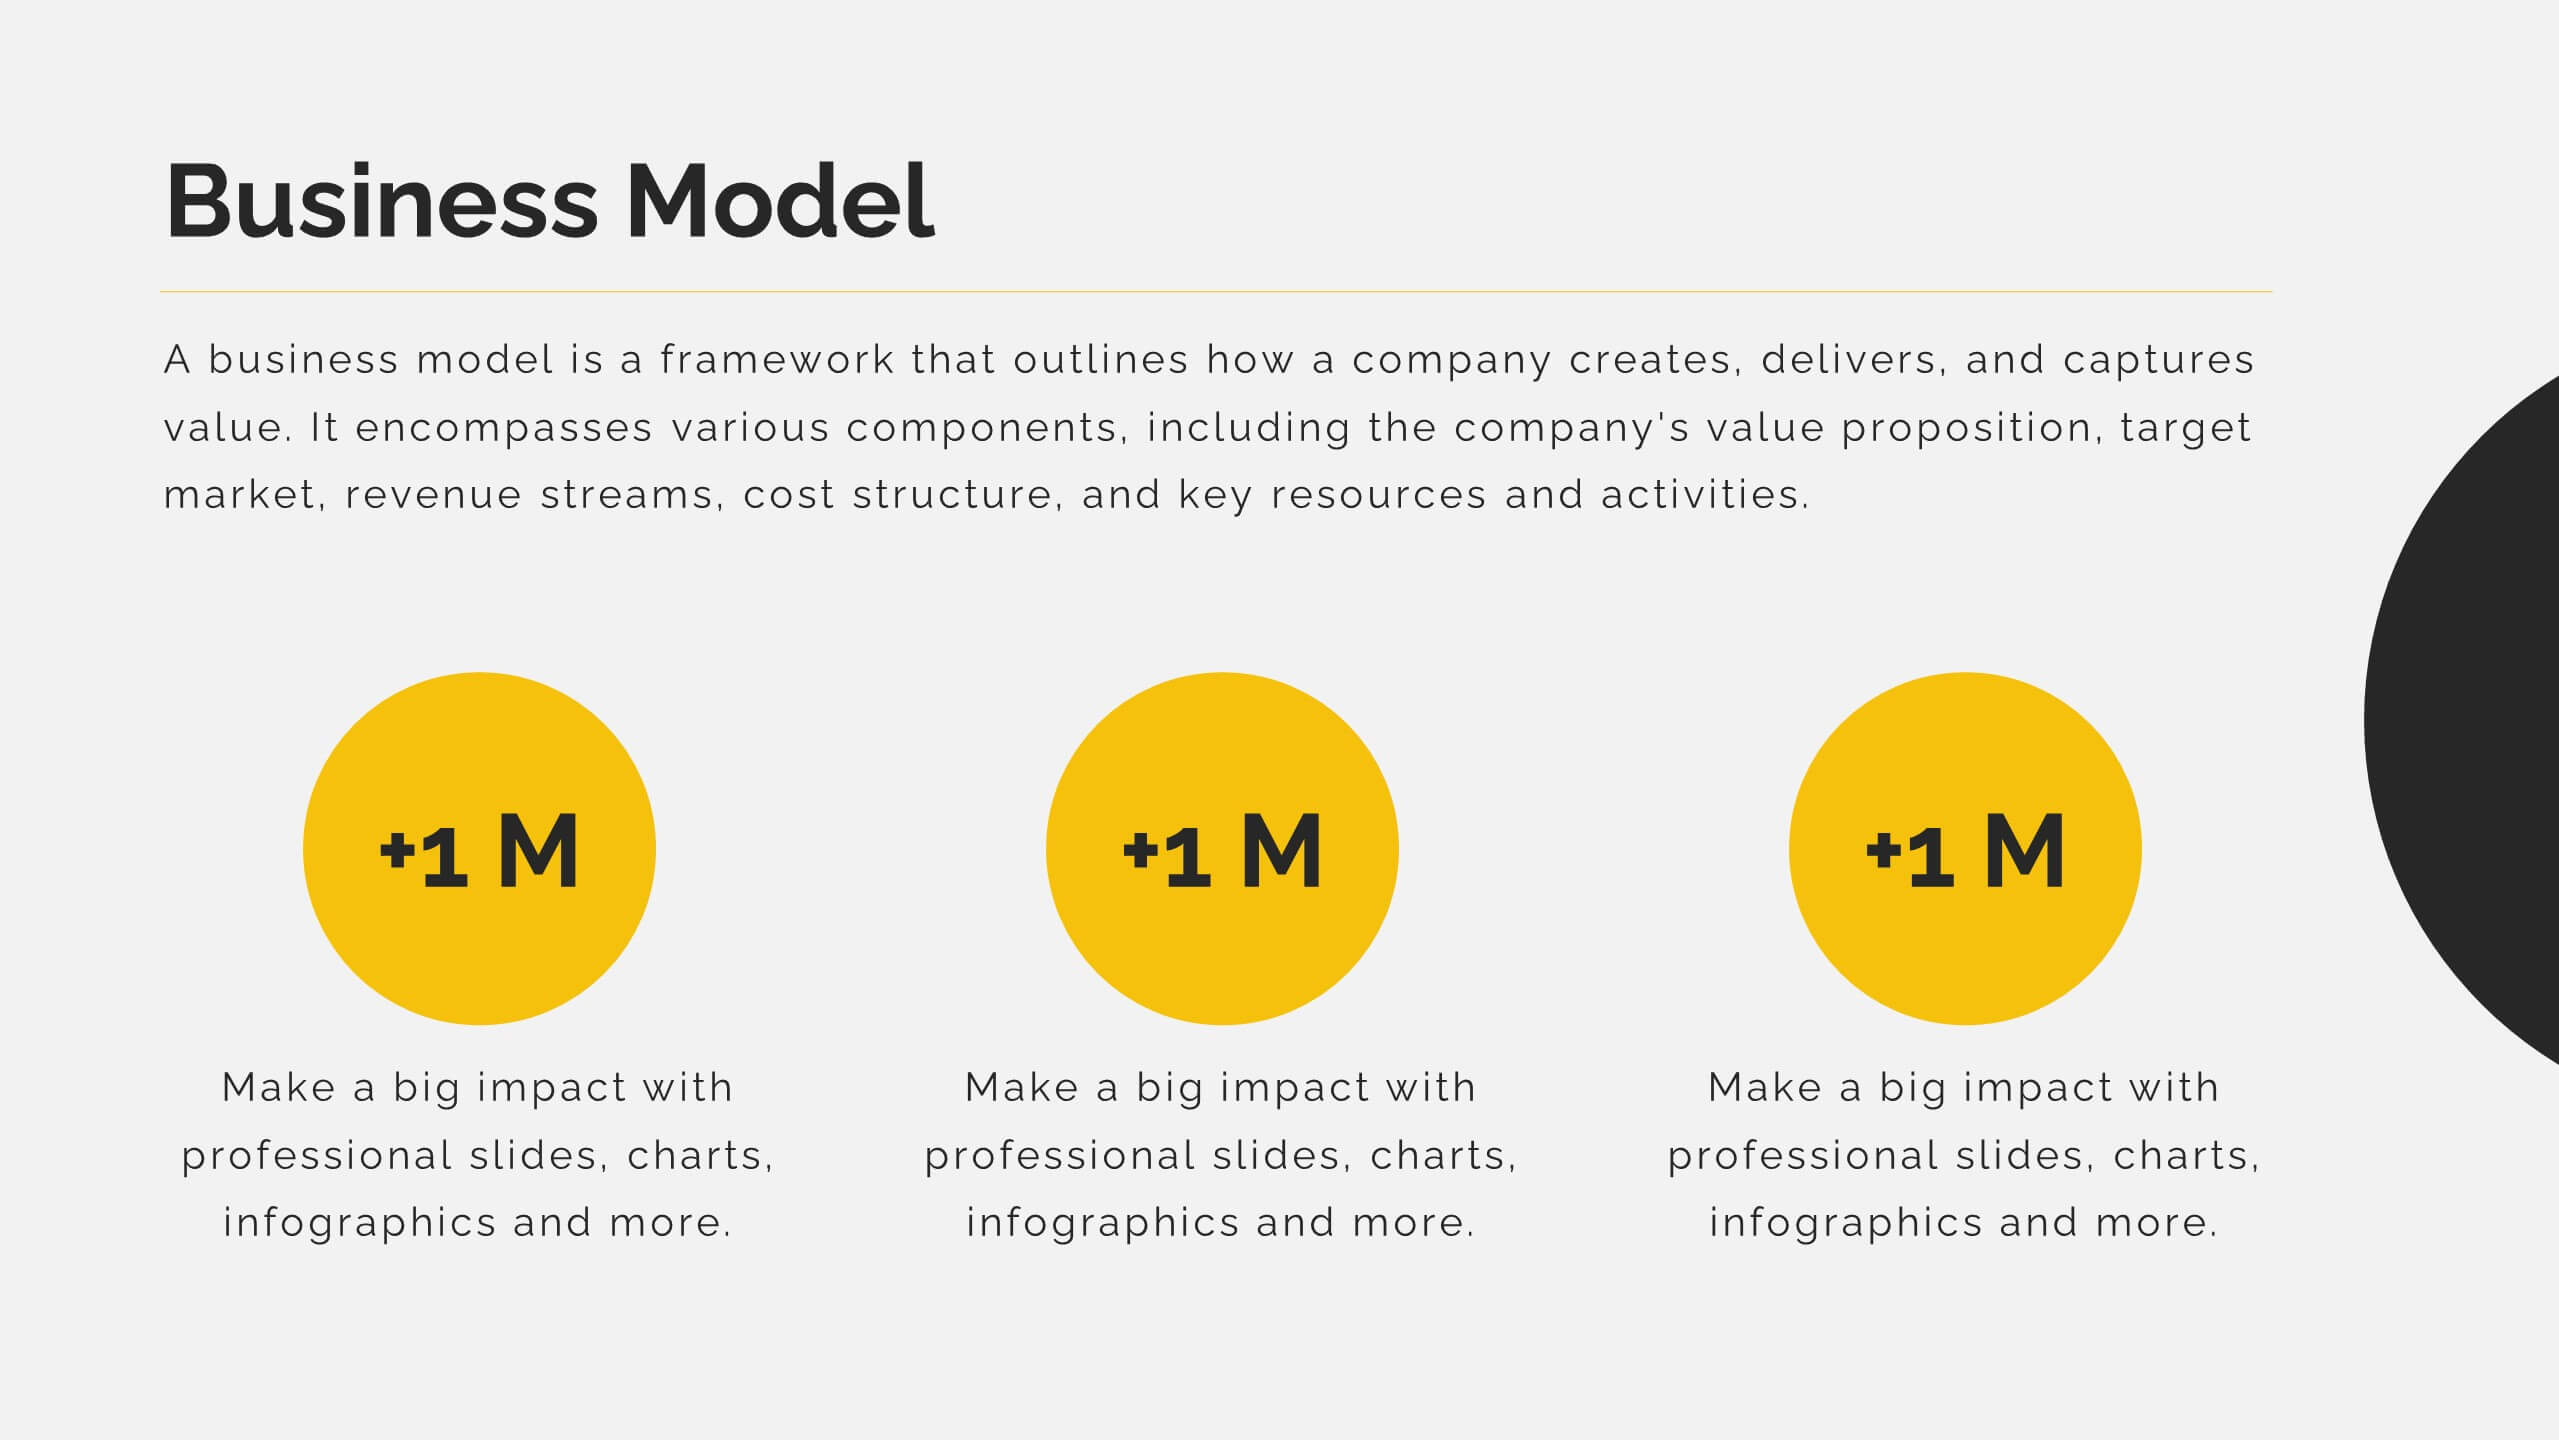
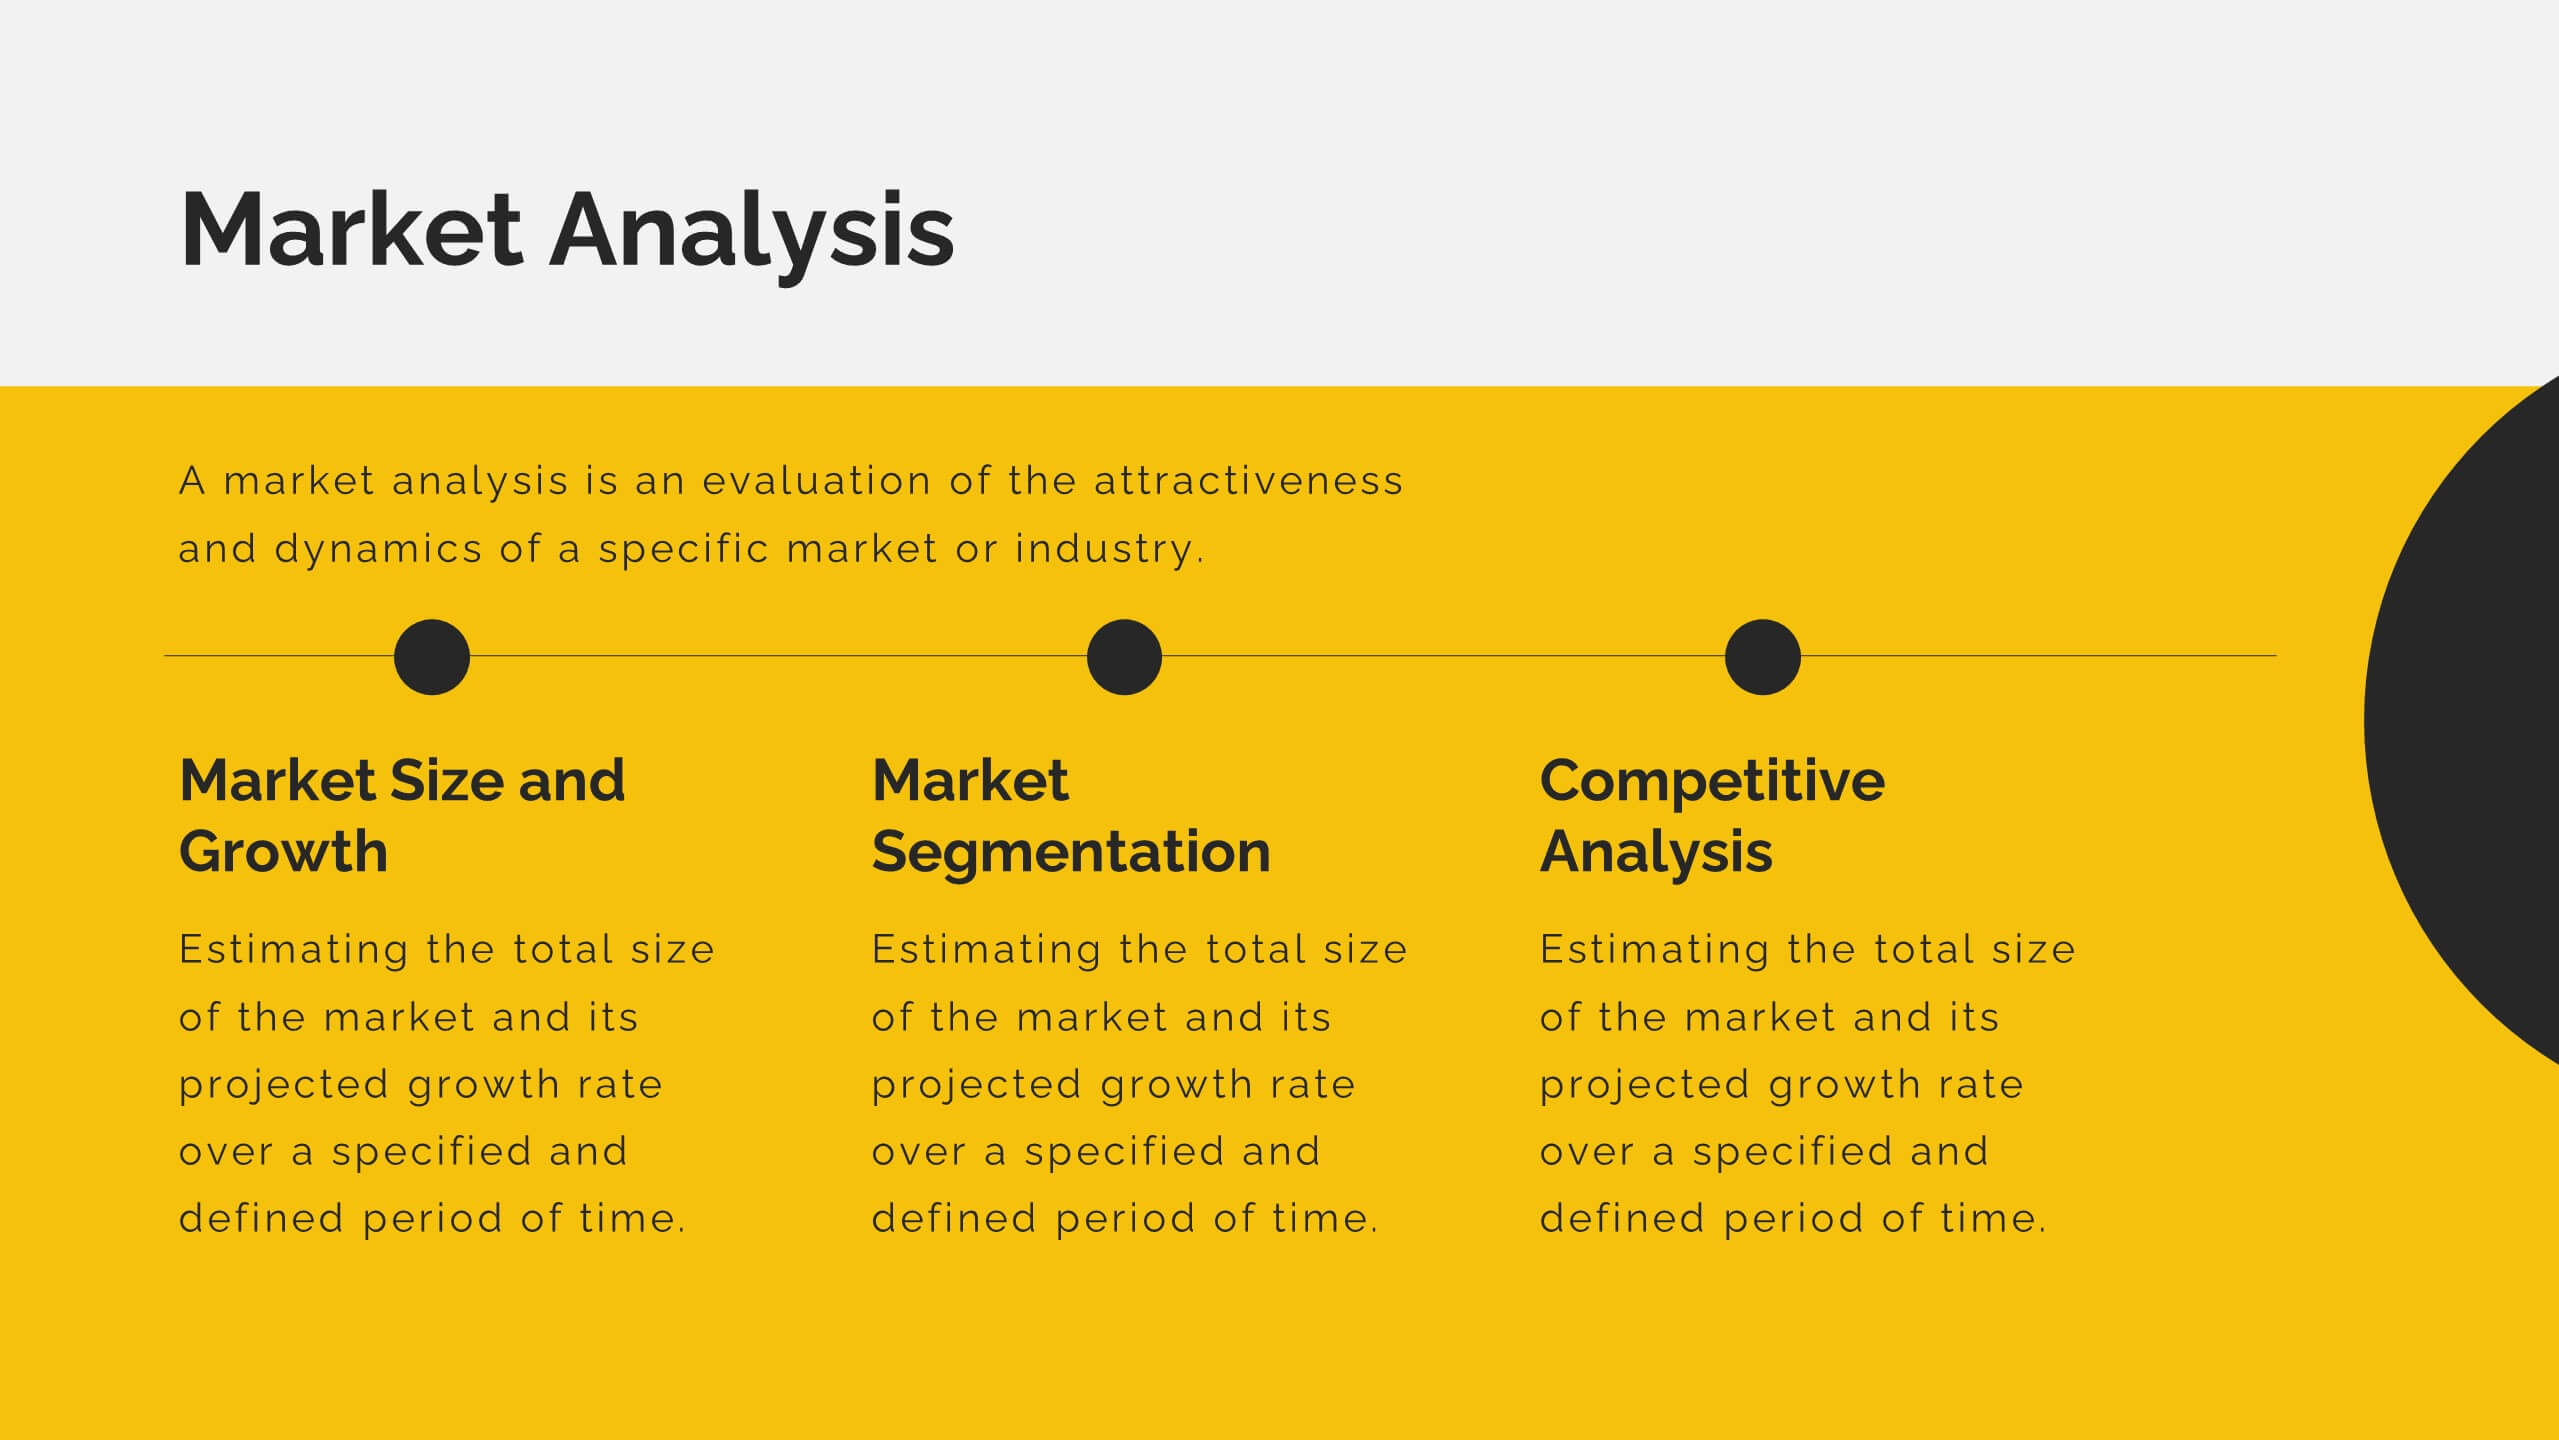
Secure funding with this dynamic startup proposal template! Perfect for presenting your mission, vision, business model, and market analysis. Ideal for entrepreneurs aiming to impress investors and stakeholders. Compatible with PowerPoint, Keynote, and Google Slides, this template ensures your proposal is clear, professional, and compelling. Achieve your startup goals today!


6 slides
6-Factor PESTEL Analysis Slide Deck Presentation
Spark fresh strategic insights with a vibrant hexagon layout that turns complex external factors into a clear, engaging story. This presentation helps teams explore key influences, compare trends, and guide smarter decision-making with confidence. Easy to edit and fully compatible with PowerPoint, Keynote, and Google Slides.


20 slides
Starbound Sales Proposal Presentation
Close deals with confidence using this polished and professional sales proposal presentation! It covers everything from target market analysis and pricing strategies to sales objectives, performance metrics, and future opportunities, ensuring a complete pitch. Perfect for client meetings and business proposals, this template works seamlessly with PowerPoint, Keynote, and Google Slides.


4 slides
Idea Validation and Business Feasibility Presentation
Clarify your strategy with the Idea Validation and Business Feasibility Presentation. This layout uses a sleek, linear flow anchored by a central lightbulb icon to guide your audience through three key checkpoints—validation, feasibility, and readiness. Each step is color-coded and icon-marked to enhance clarity. Fully editable in PowerPoint, Canva, Google Slides, and Keynote.
22 slides
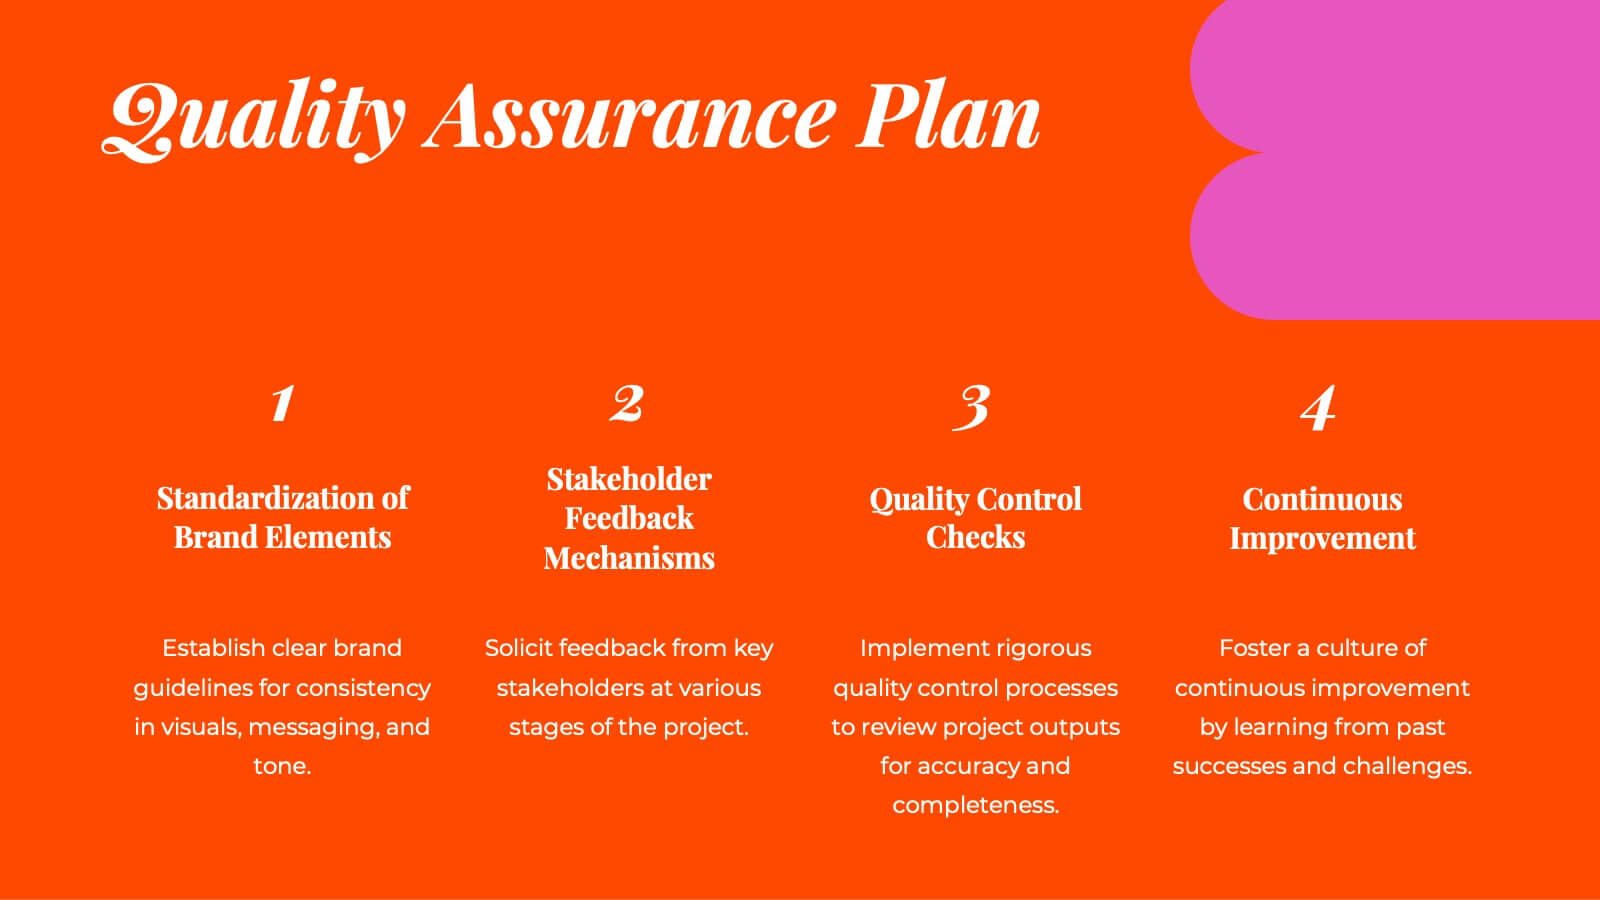
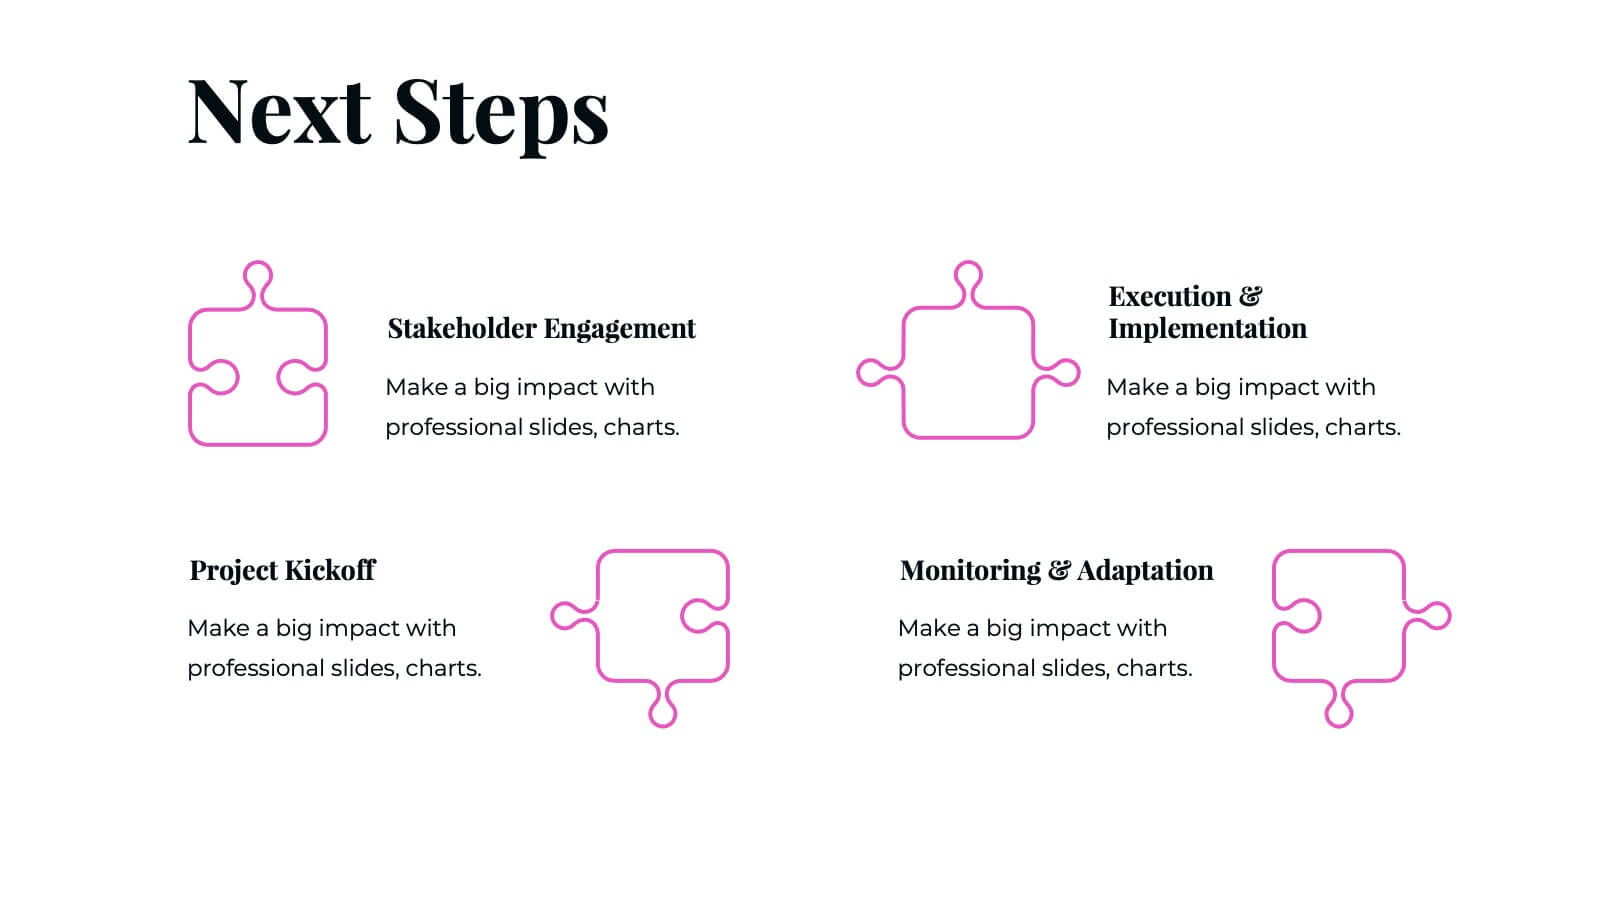
Moonstone Detailed Project Execution Plan Presentation
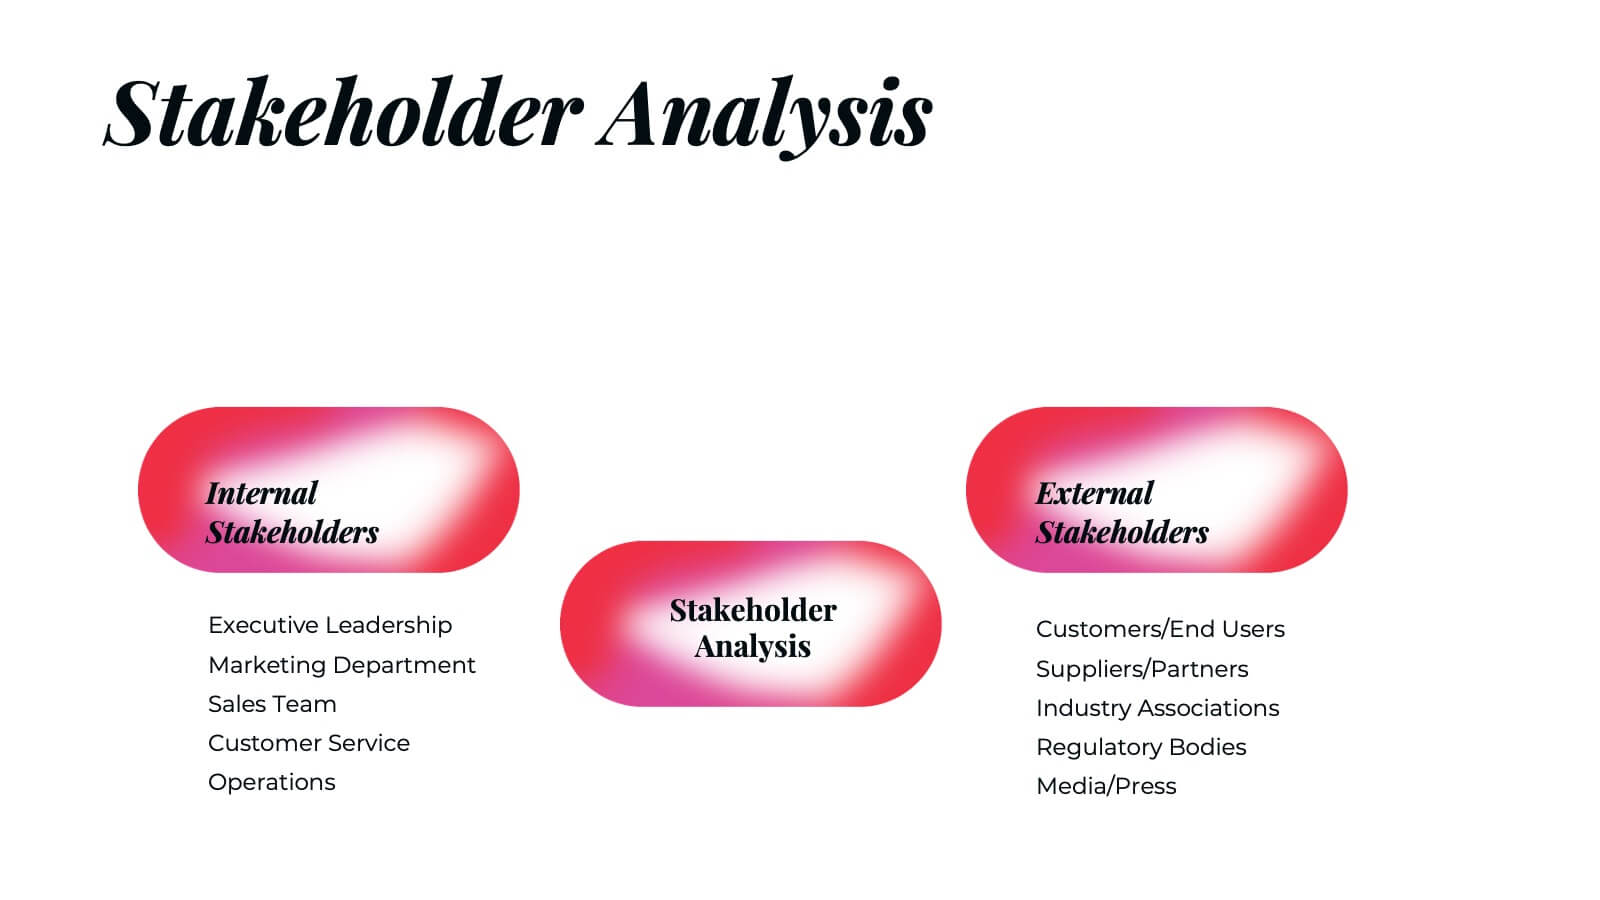
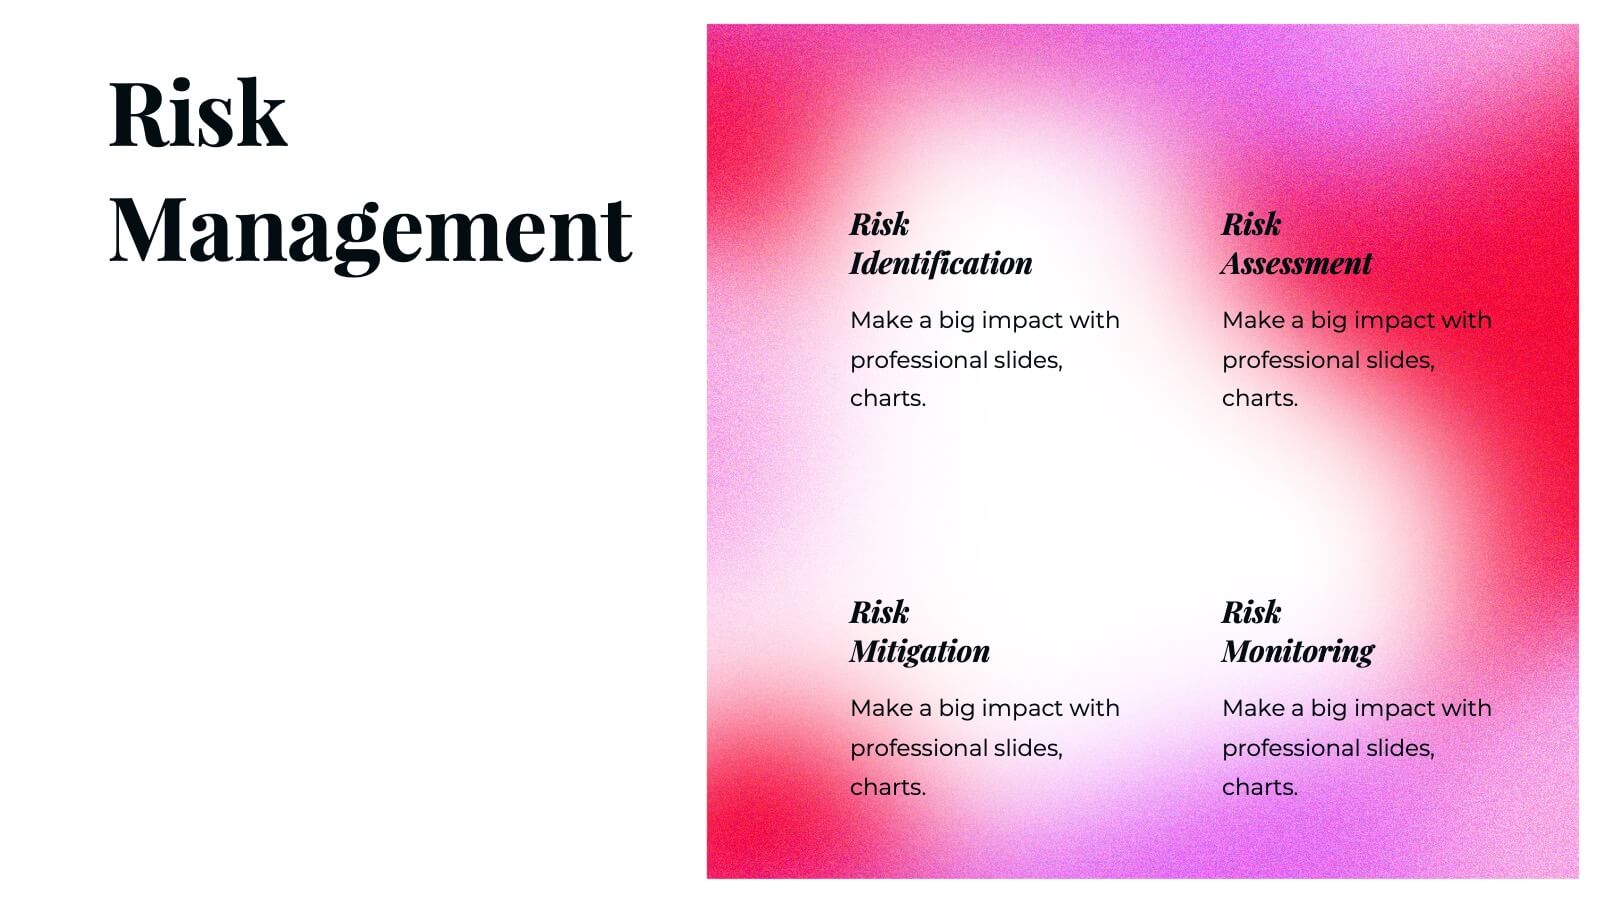
Create a compelling project execution plan with this vibrant and well-structured presentation template! Covering every key aspect from problem statements and objectives to risk management and quality assurance, this template provides a clear roadmap for your project. It’s perfect for organizing timelines, budget breakdowns, and stakeholder analysis. Compatible with PowerPoint, Keynote, and Google Slides for smooth presentations.


5 slides
Movies & Film Market Infographics
Step into the spotlight with our movies & film market infographics, designed to orchestrate your data into a cinematic experience. In the enchanting hues of blue and purple, this template captures the essence of the big screen, offering a vertical layout that resonates with the the film industry. It's a tool for film marketers, and cinema analysts, providing a platform to depict trends, and reviews with a touch of Hollywood style. The set includes captivating graphics, themed icons, and adaptable image placeholders, all curated to help you direct your audience's attention to key insights in the ever-evolving realm of movies and entertainment.


5 slides
Large Scale Data Insights Presentation
A clean, modern slide that makes complex information feel surprisingly easy to explain, this layout helps you break down large-scale data in a way your audience can instantly understand. Use it to outline key insights, visualize processes, or highlight system components. Fully compatible with PowerPoint, Keynote, and Google Slides.


3 slides
Decision-Making Bowtie Framework Presentation
Break down complex decisions with clarity using the Decision-Making Bowtie Framework Presentation. This template lets you visually weigh options, outcomes, and impacts from both sides of a decision point, making it ideal for strategic planning, risk assessment, and executive reporting. Compatible with PowerPoint, Keynote, and Google Slides.


6 slides
Platform-Specific Social Strategy Presentation
Break down your marketing approach by channel using this clear, platform-focused timeline. Highlight strategies for TikTok, Facebook, Instagram, X, and email in a linear, easy-to-read format. Ideal for digital marketers, content teams, and social media managers. Fully editable in PowerPoint, Keynote, and Google Slides to match your brand and strategy.


7 slides
Customer Journey Stages Infographic Presentation
A Customer Journey consists of a series of interactions that occur over time between your company and the customer. Our template uses a colorful color scheme and style to present a customer journey. This communicates how the customer moves through their process. The layout allows you to customize each text box with your own text. The stages are color coded, making it easy for you to identify them. This template is designed to provide the most up-to-date research and analytical data so you can effectively engage and connect with your audience. Capture your customer's journey with this template!


7 slides
Work From Home Online Infographic
Work from home online refers to a work arrangement where individuals can perform their job responsibilities remotely, usually from their homes, using internet-connected devices like computers, laptops, tablets, or smartphones. Unveil the modern realm of remote work with our work from home online infographic. This visually engaging and informative template takes you on a journey through the digital landscape of remote work, showcasing its advantages, best practices, and the tools that enable seamless virtual collaboration. This infographic isn't just a visual guide it's a roadmap to thrive in the evolving world of work.