


Features
- 6 Unique slides
- Fully editable and easy to edit in Microsoft Powerpoint, Keynote and Google Slides
- 16:9 widescreen layout
- Clean and professional designs
- Export to JPG, PDF or send by email


Do you have any questions?
Recommend


6 slides
Business Process Checklist Overview Presentation
Simplify your workflow presentations with the Business Process Checklist Overview Presentation. This circular layout is ideal for outlining five sequential or cyclical steps in a business process, featuring icon-labeled checkpoints and editable titles. Each step is visually marked with subtle checkmarks, making it perfect for status tracking, task progression, or implementation plans. Clean, professional, and fully customizable in PowerPoint, Keynote, and Google Slides.


10 slides
Adapting to Business Transformation Presentation
Guide your audience through change with this dynamic, step-by-step layout tailored for showcasing transformation journeys. The slide features a curved flow design with five customizable stages, perfect for visualizing digital shifts, organizational restructuring, or innovation roadmaps. Best for corporate strategists, consultants, and change managers. Fully editable in PowerPoint, Keynote, and Google Slides.


5 slides
TAM SAM SOM Markets Analysis Presentation
Turn complex market insights into clear, visual storytelling with this dynamic layered presentation. Ideal for demonstrating market potential, target segments, and opportunity scope, it helps you communicate data with structure and impact. Fully compatible with PowerPoint, Keynote, and Google Slides for effortless editing and professional, presentation-ready results.
22 slides
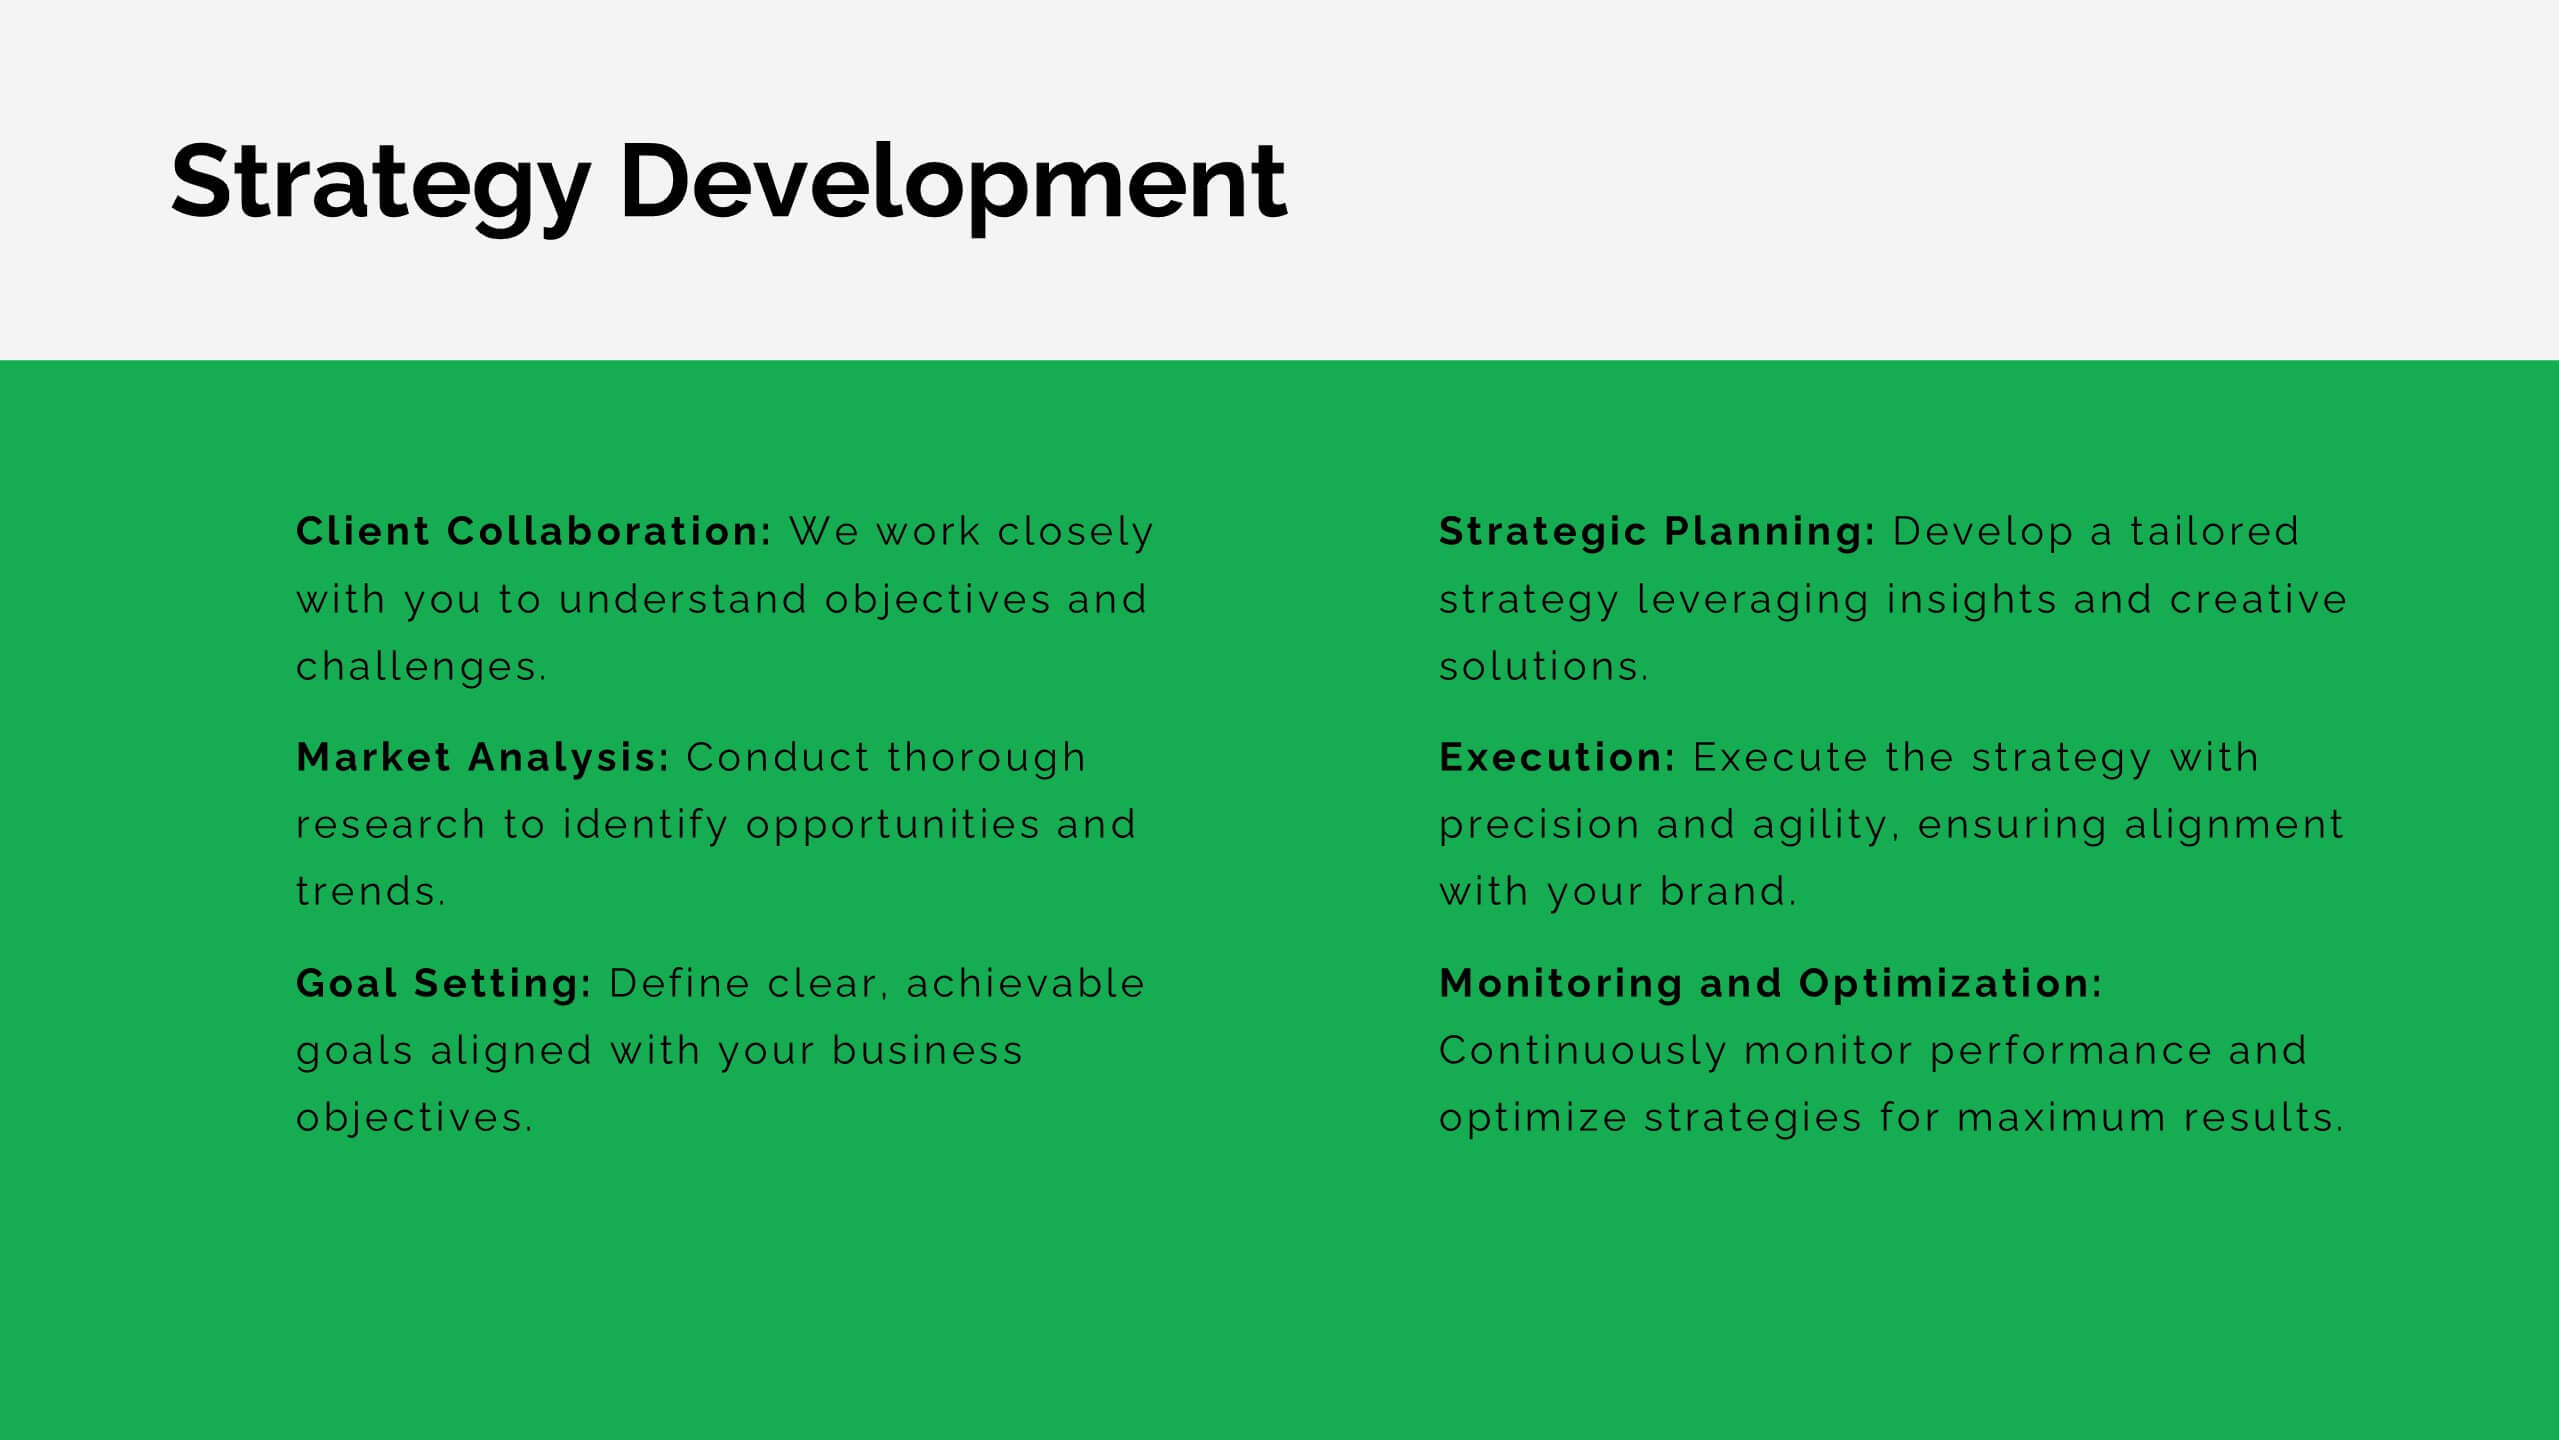
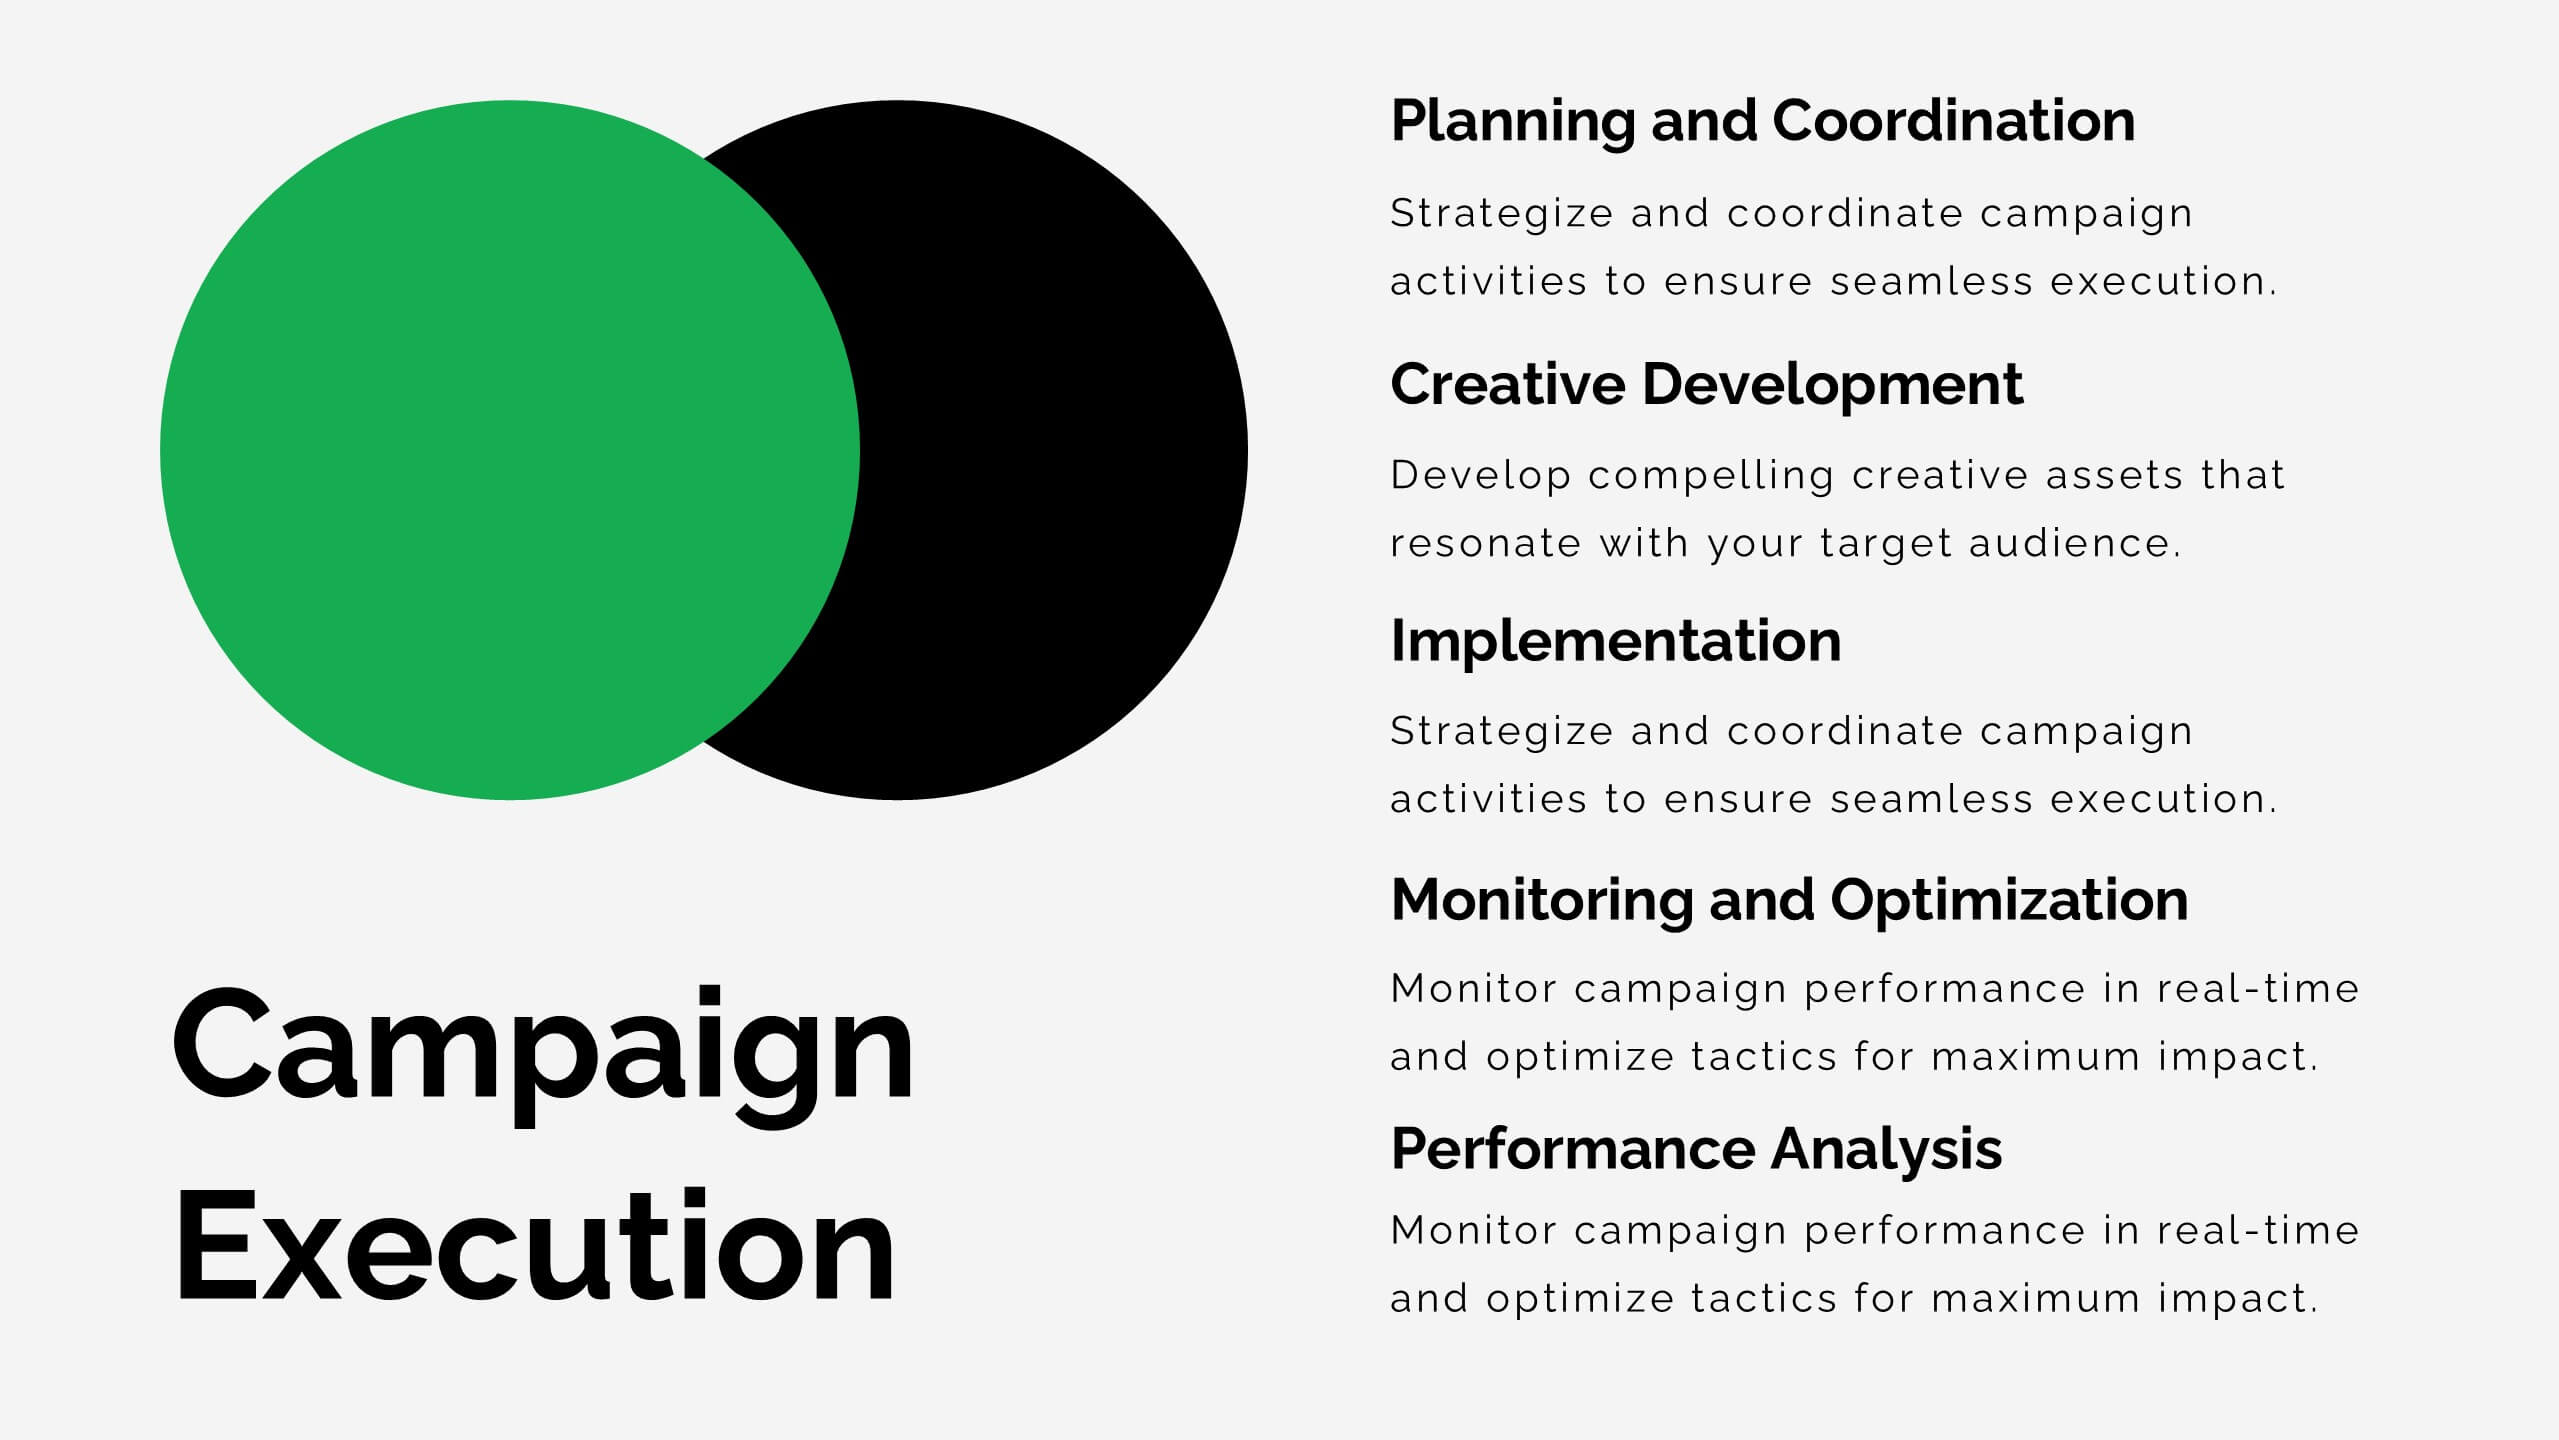
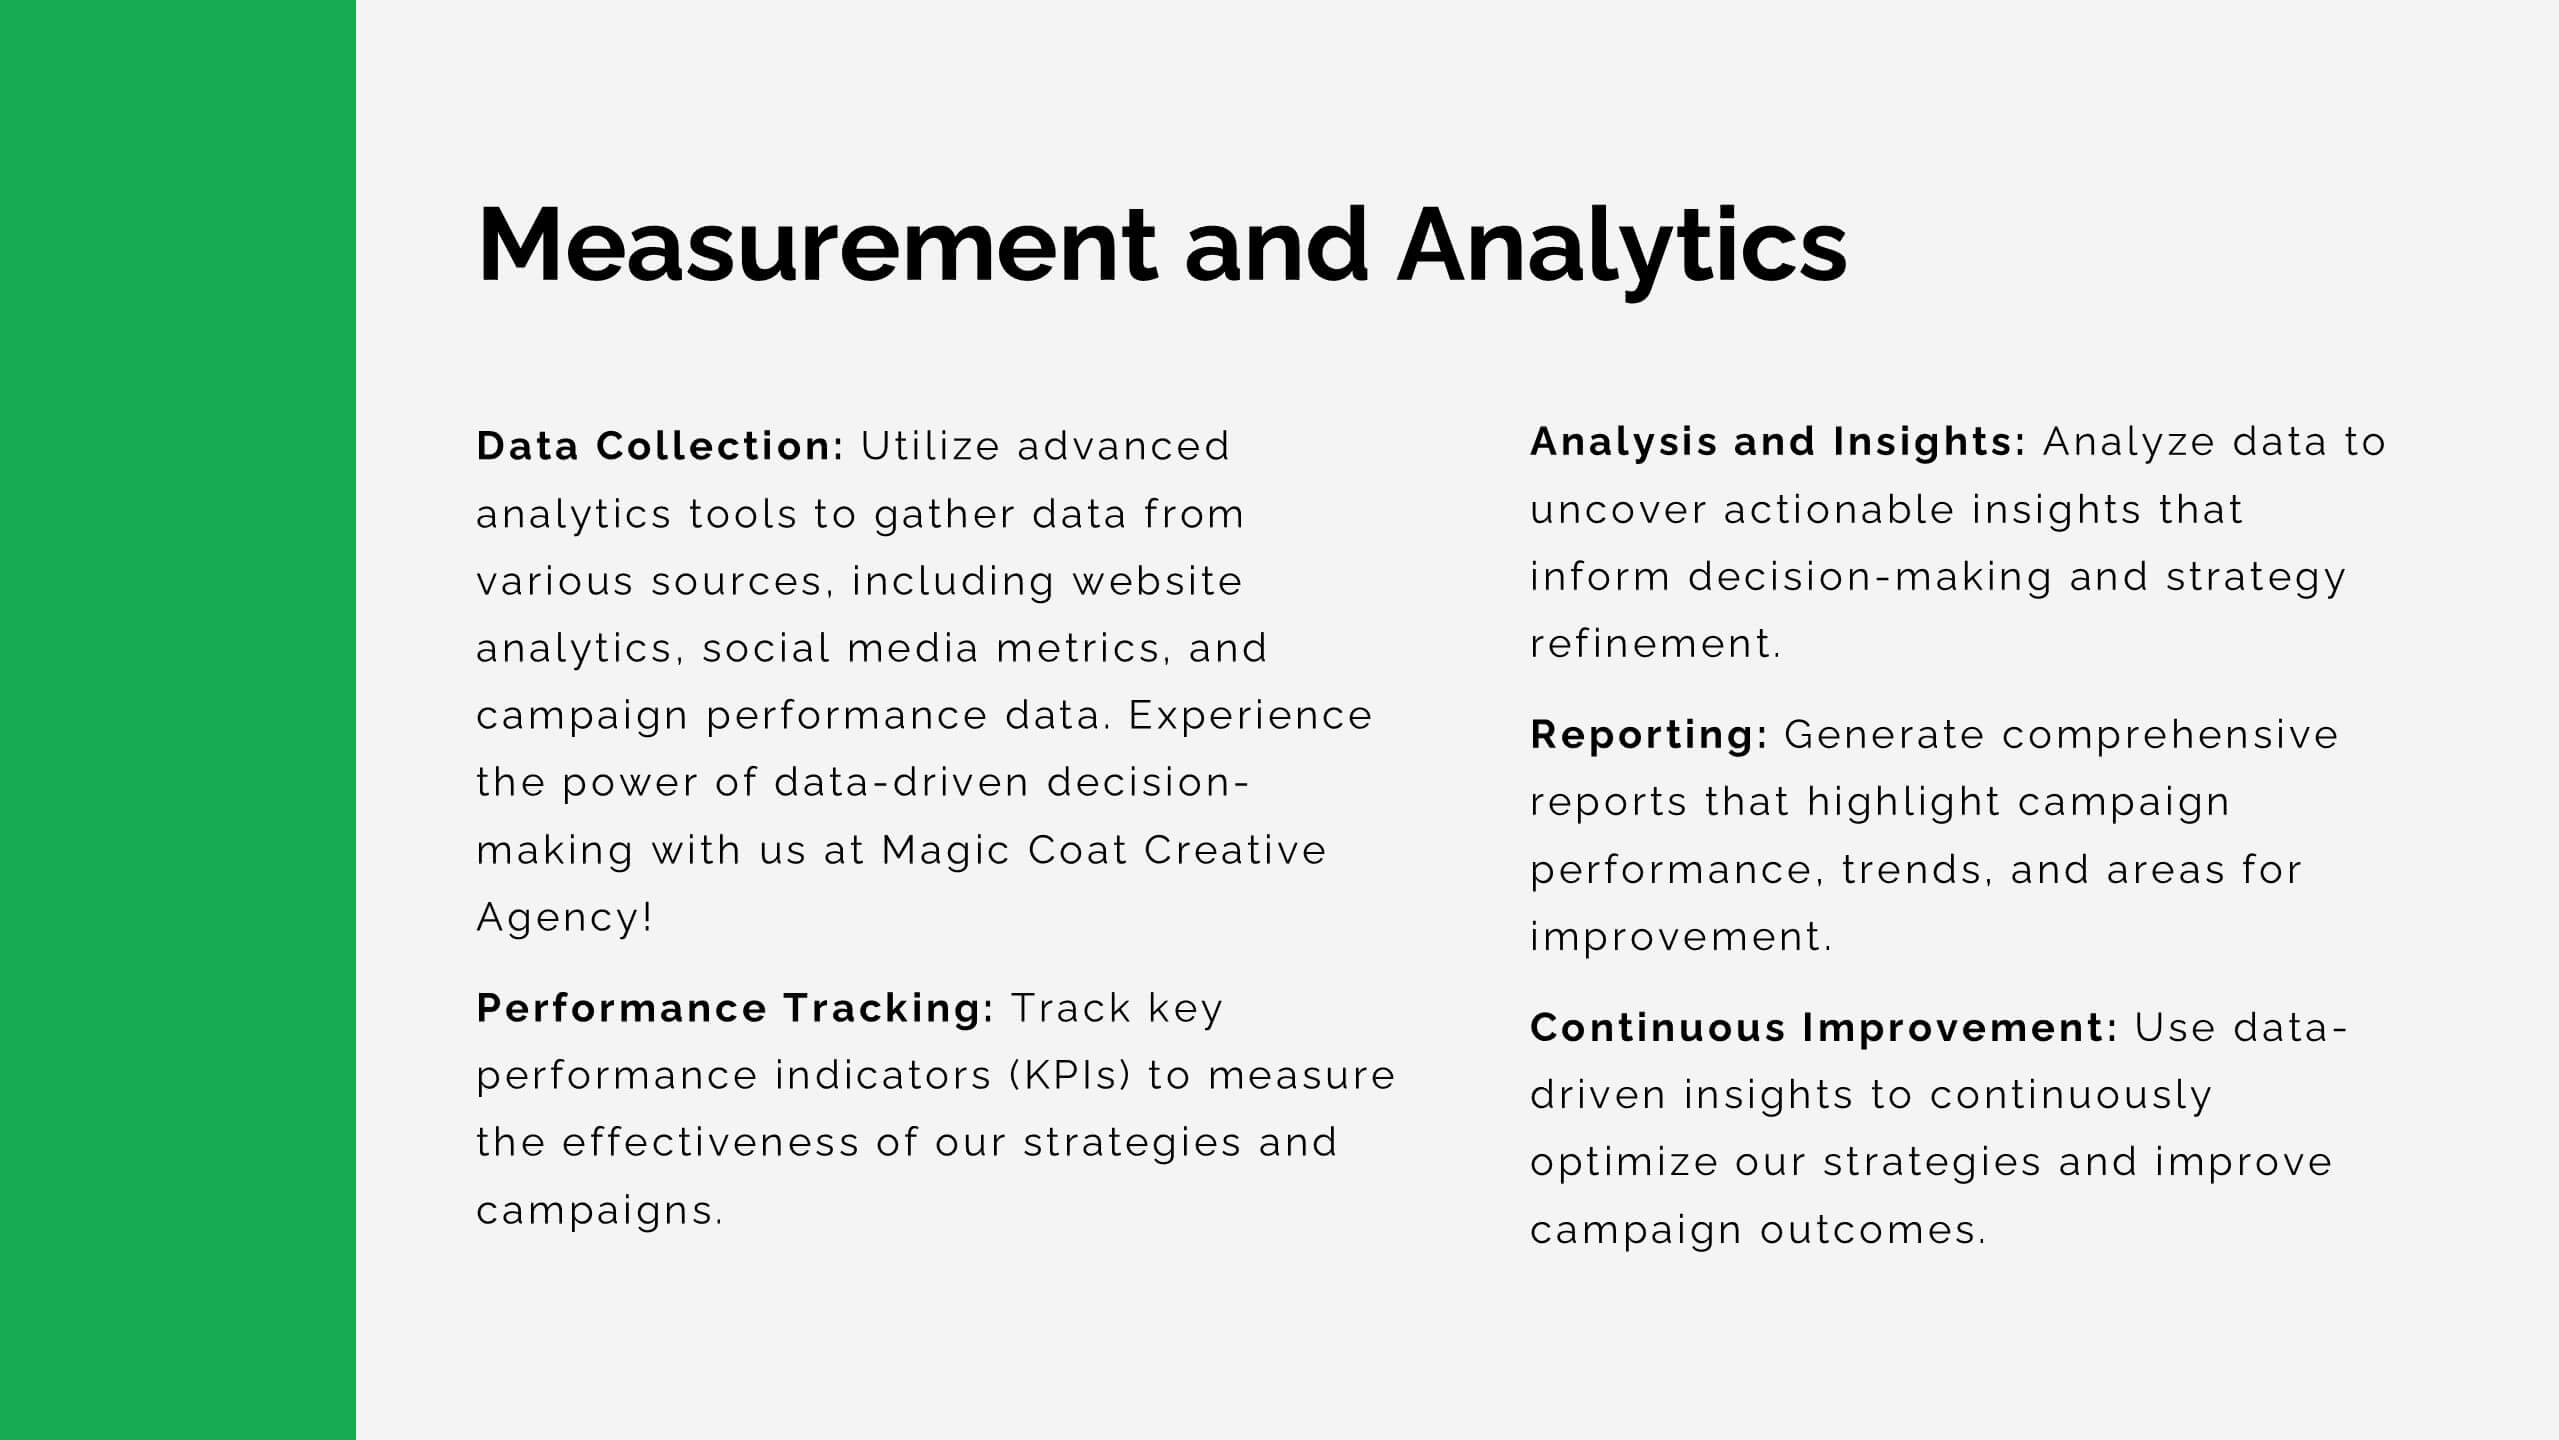
Lithium Advertising Agency Proposal Presentation
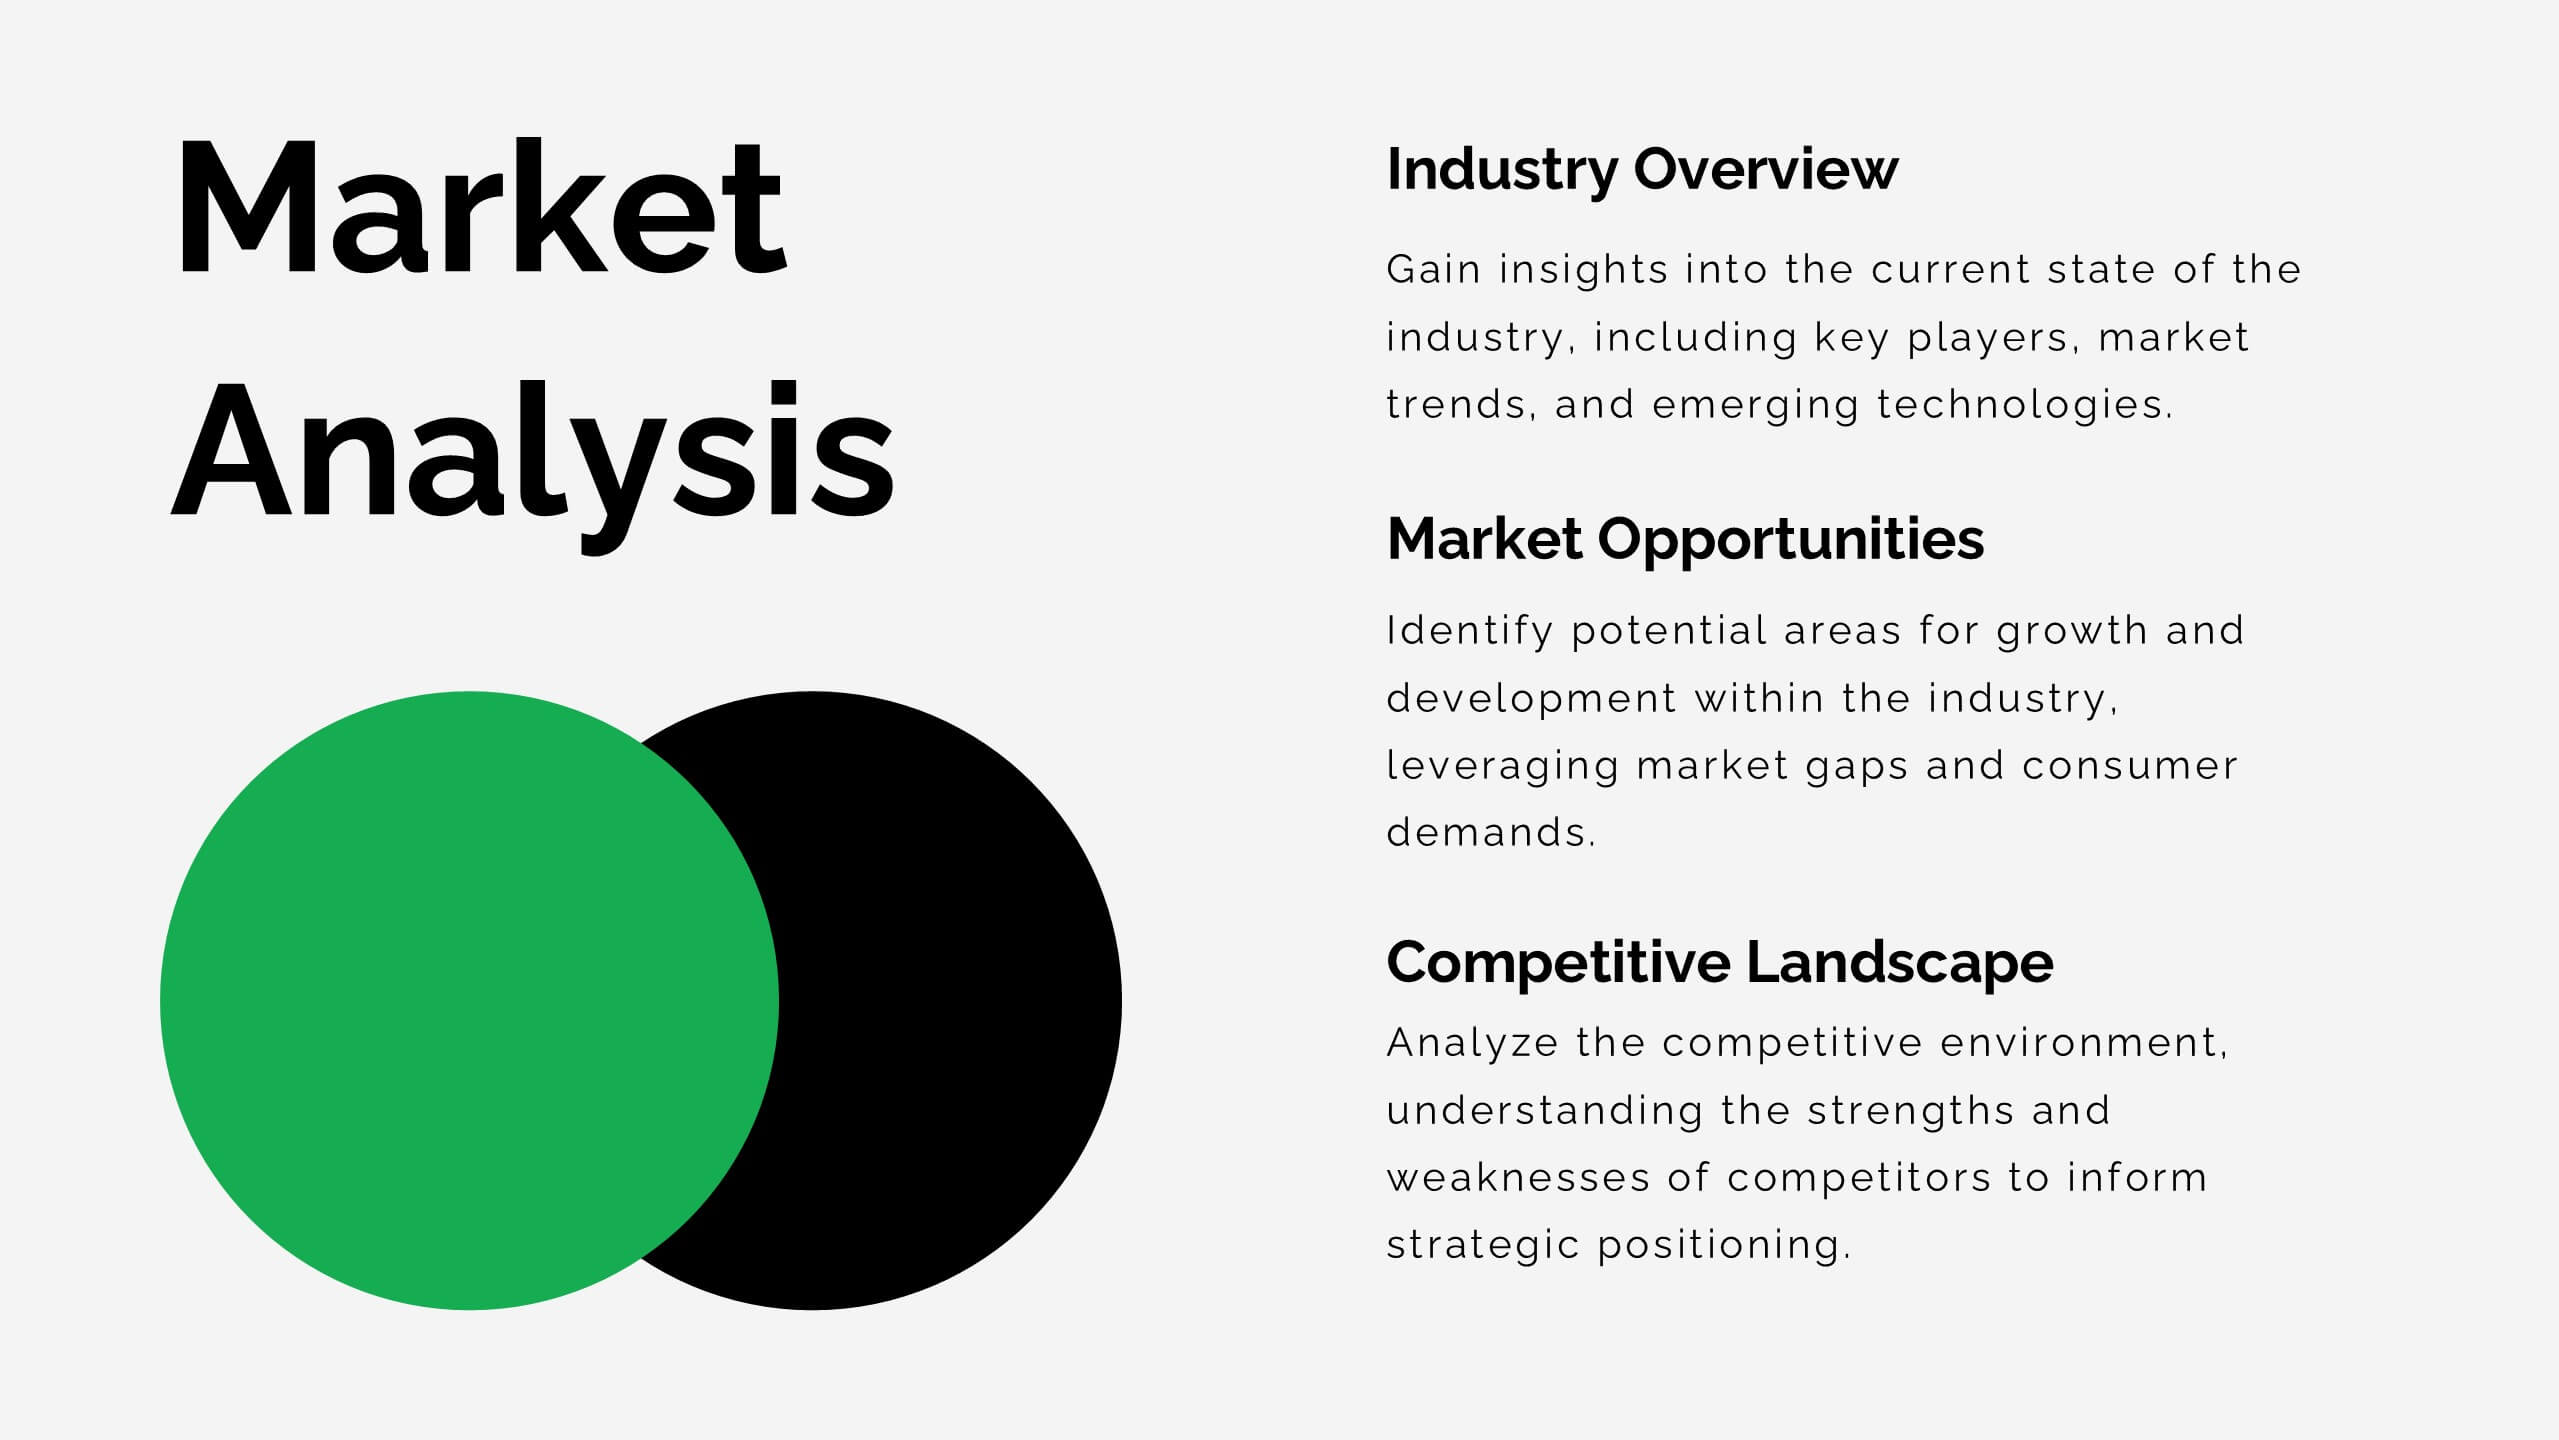
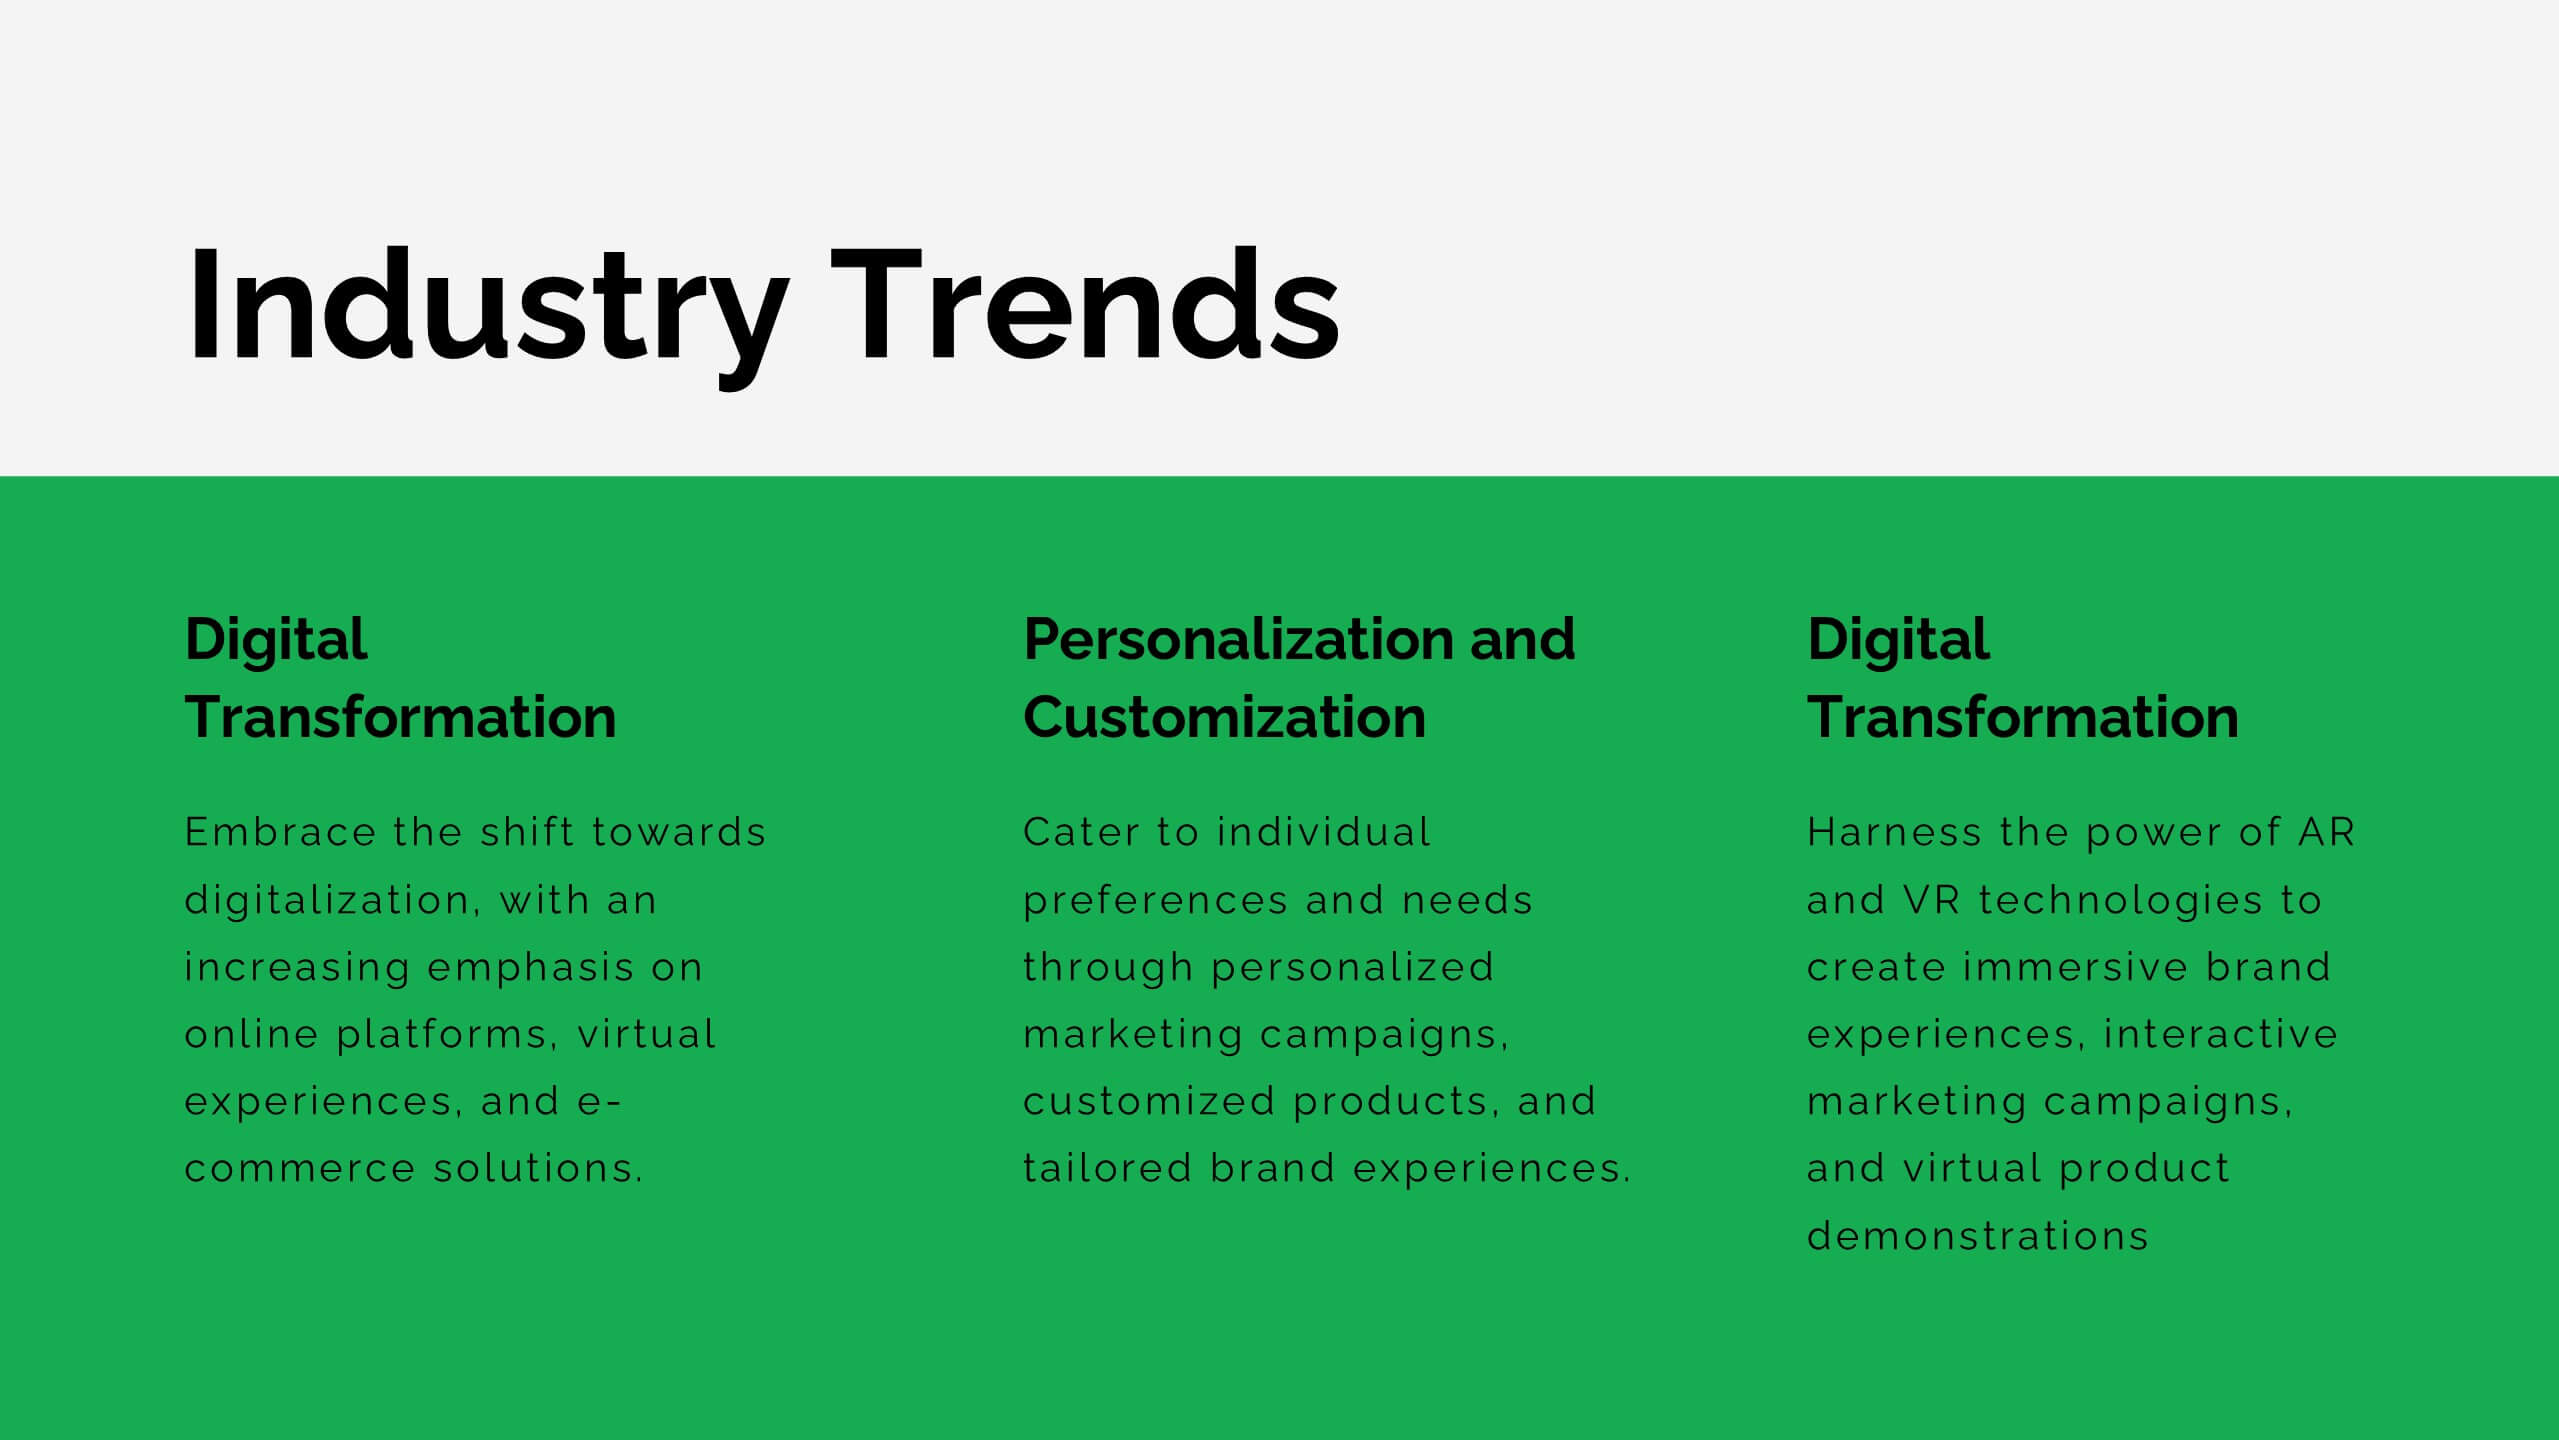
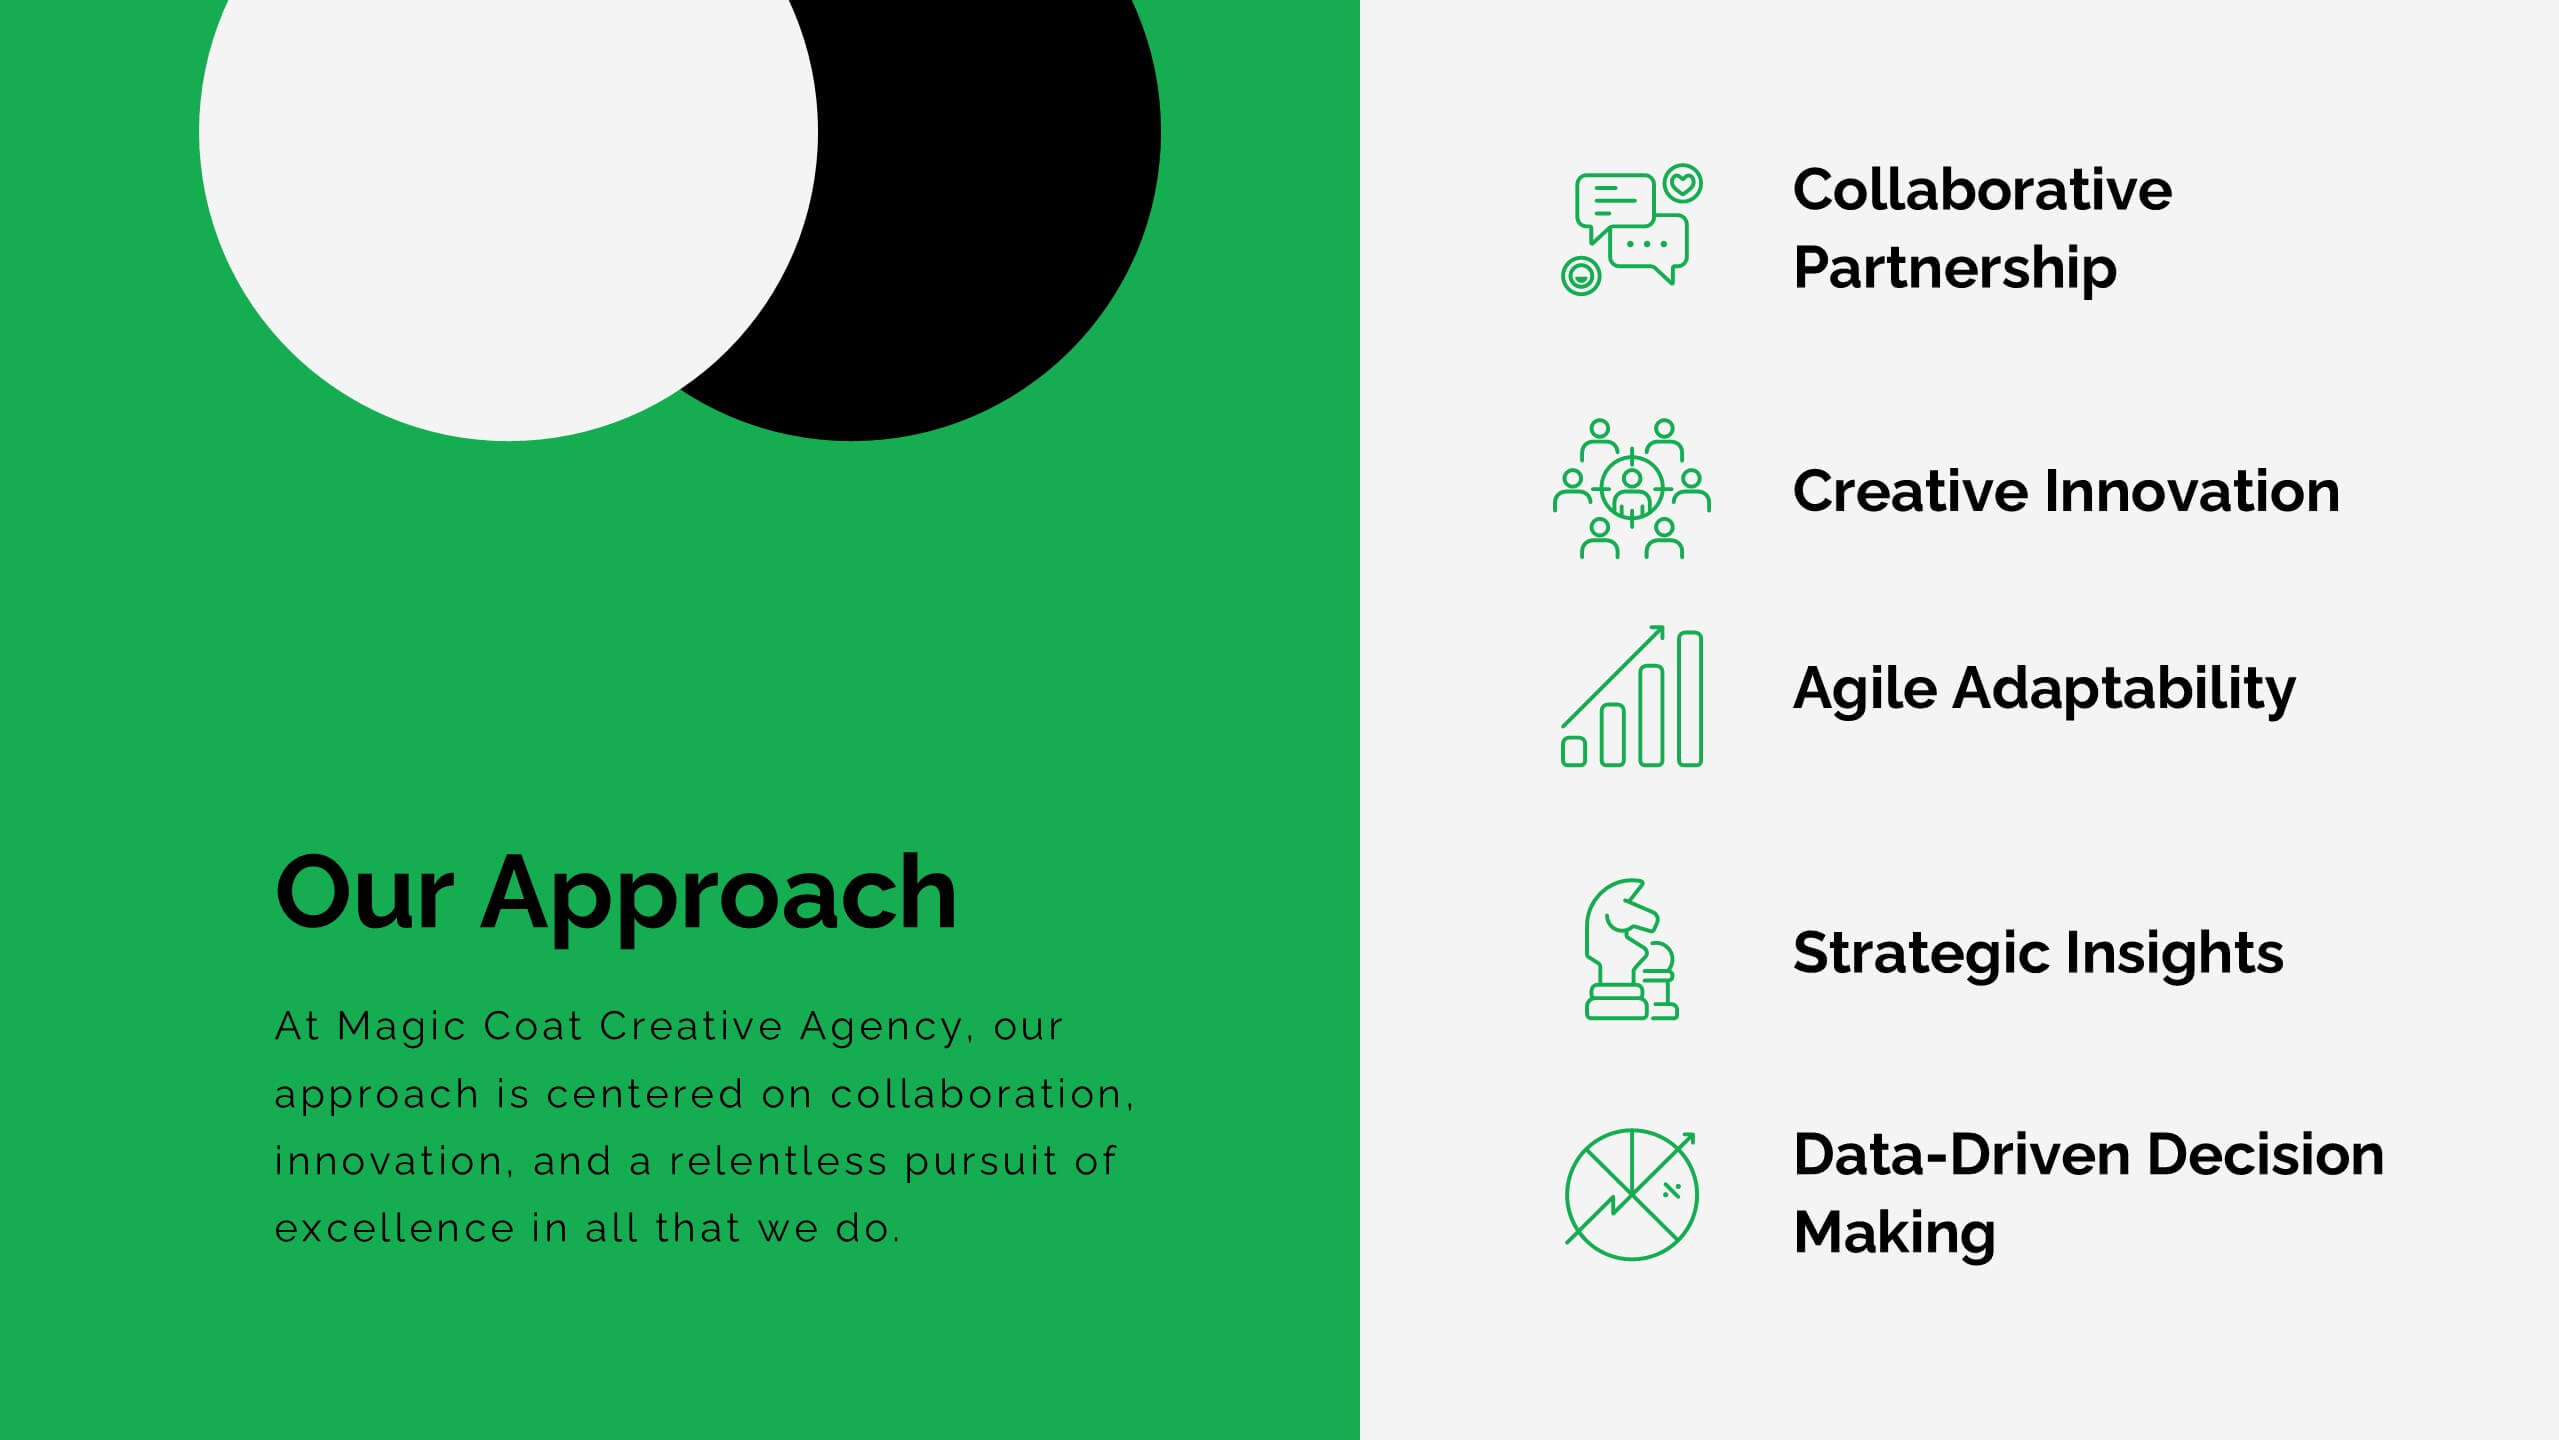
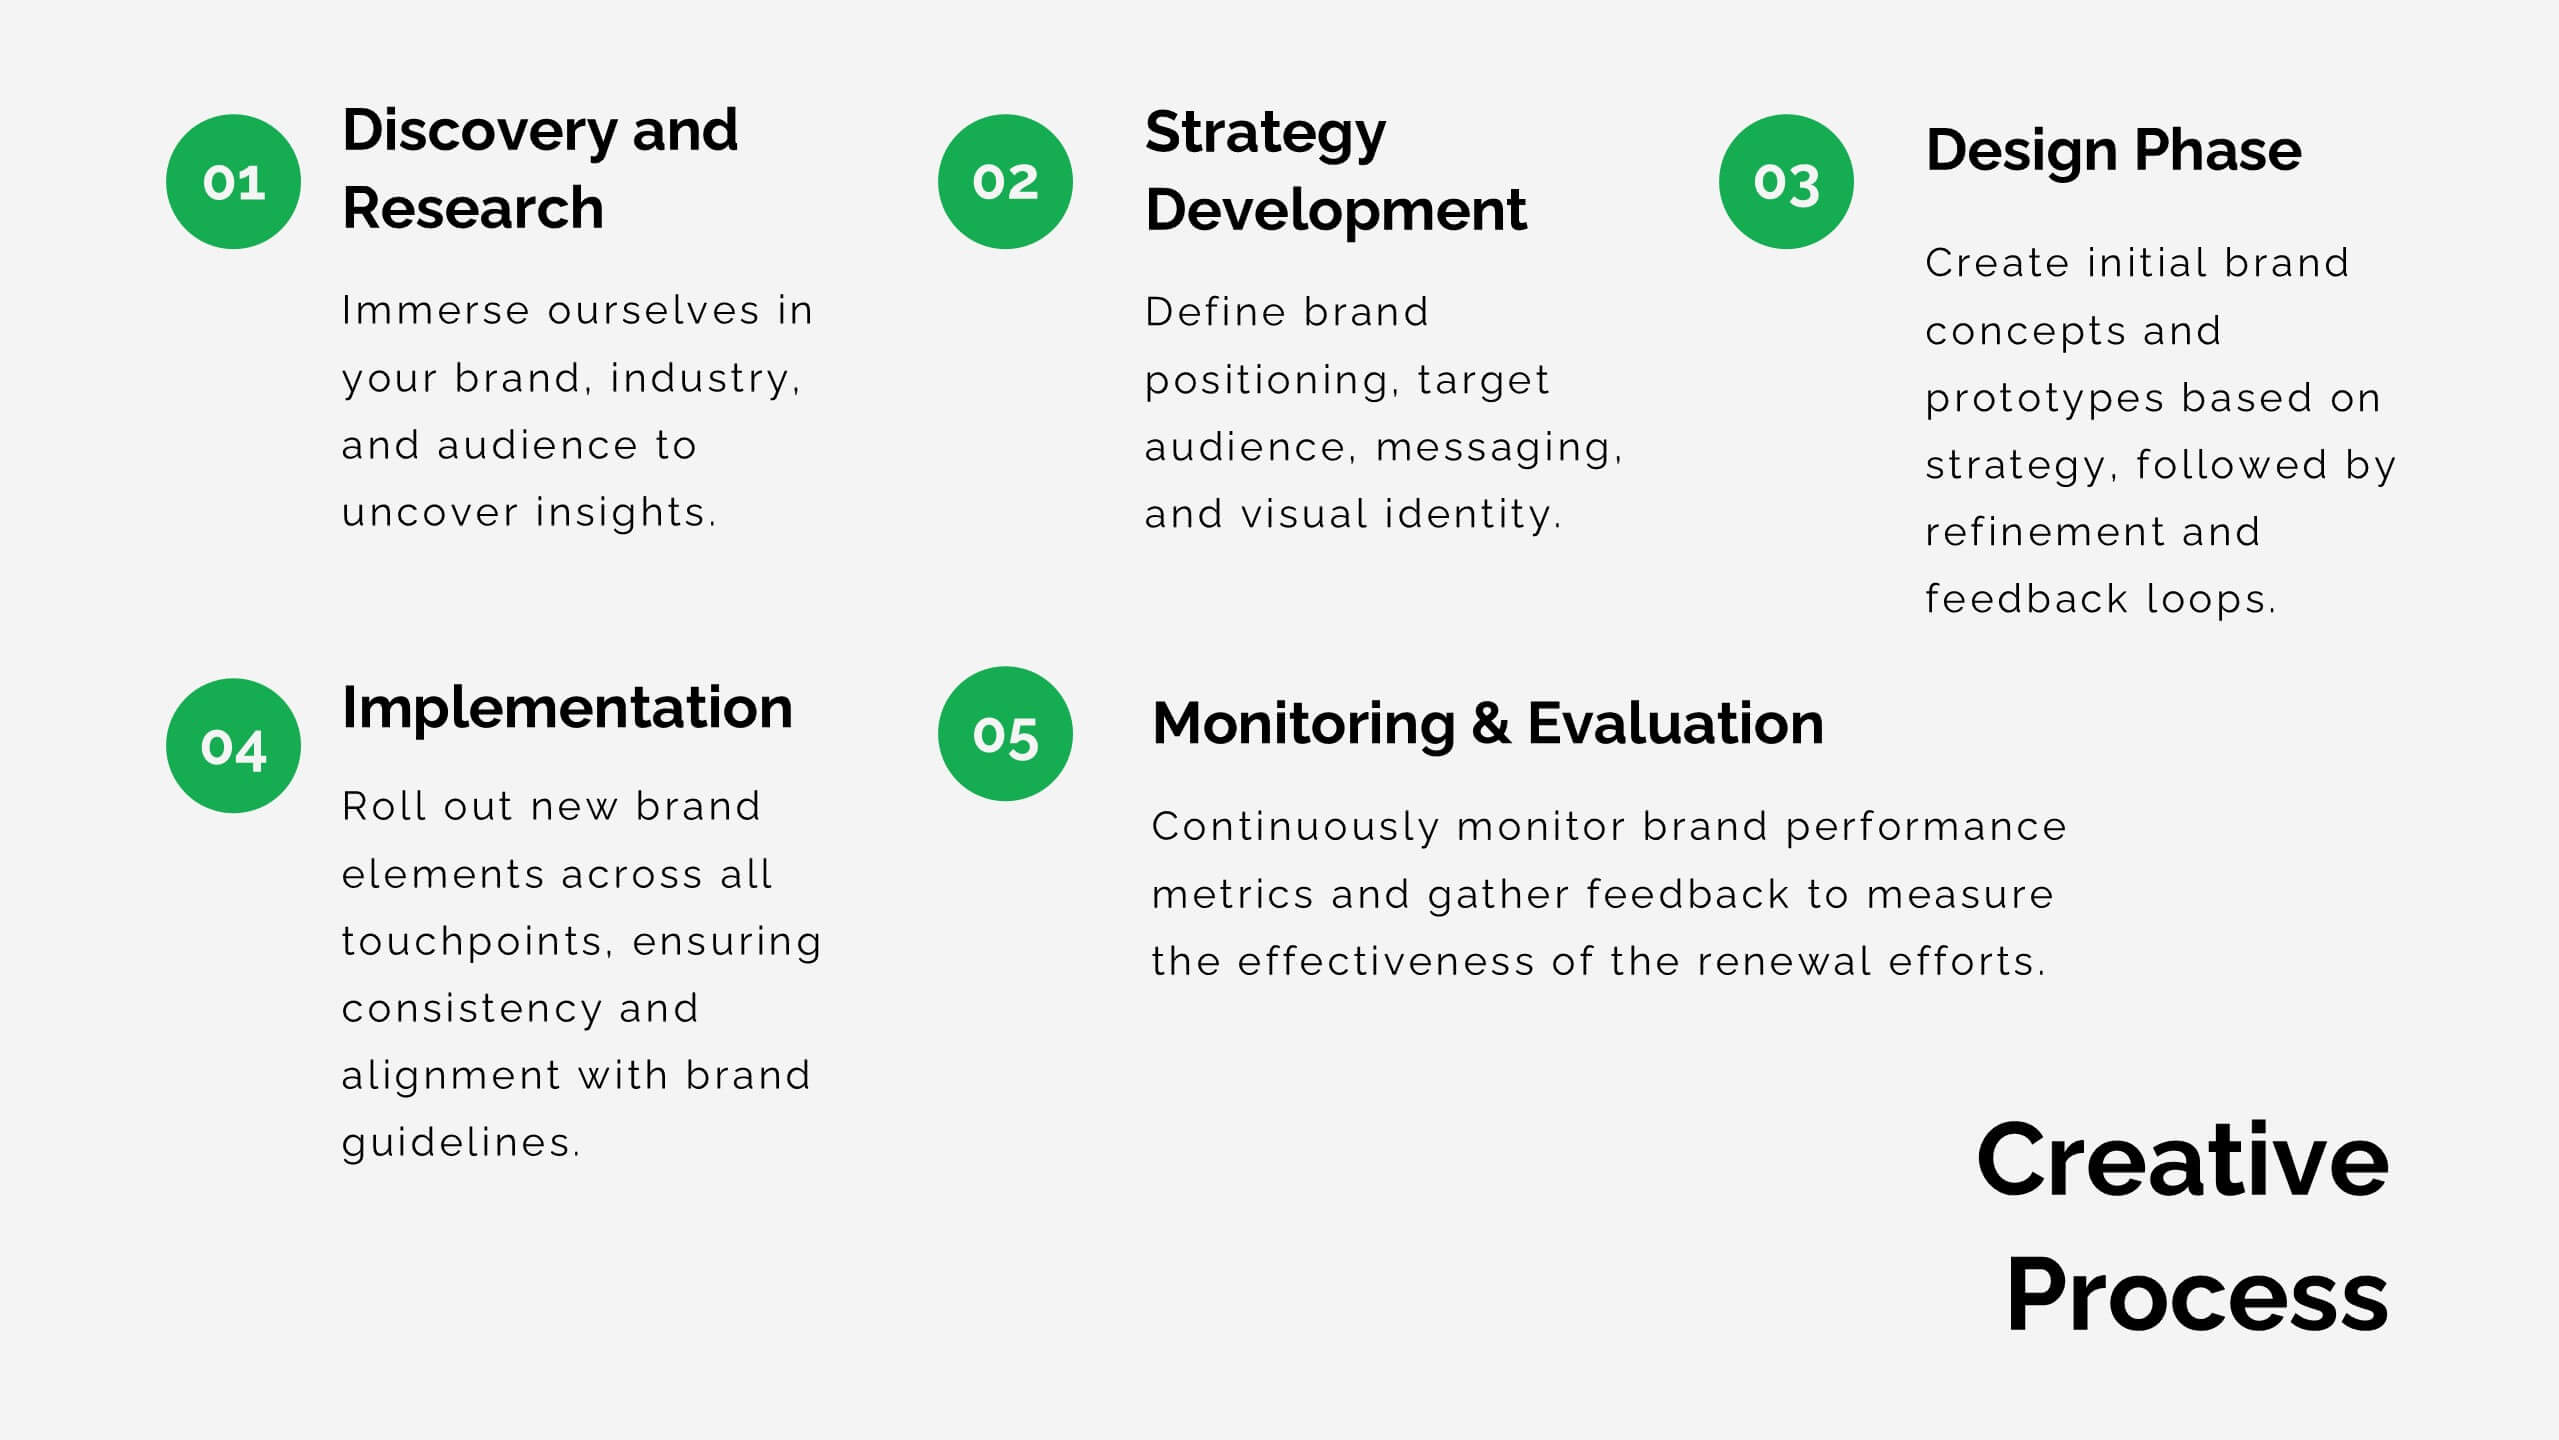
Elevate your advertising agency’s proposals with this sleek and modern template! It covers key areas like market analysis, case studies, client success stories, and campaign execution. Fully customizable, this template is perfect for presenting your agency’s services and strategies. Compatible with PowerPoint, Keynote, and Google Slides, it’s designed for impactful client presentations.


6 slides
System Maintenance and Support Presentation
Streamline your technical processes with the System Maintenance and Support Presentation. This slide features a clean alphabetical list layout (A–E) paired with icons and concise text areas—ideal for illustrating maintenance protocols, support categories, or troubleshooting stages. The right-side wrench graphic adds a visual metaphor for IT upkeep. Fully editable in PowerPoint, Keynote, and Google Slides.


20 slides
Aurabliss Content Marketing Pitch Deck Presentation
This Content Marketing Pitch Deck Template provides a professional and engaging layout to showcase your marketing strategies, trends, and insights. Featuring key sections such as industry overview, influencer marketing, SEO/SEM trends, and customer experience focus, it helps communicate your marketing plans effectively. The template includes charts, graphs, and visual elements to support data-driven storytelling. Fully customizable in PowerPoint, Keynote, and Google Slides, making it an ideal choice for marketing professionals, agencies, and business presentations.


7 slides
Strategic Alignment Using McKinsey 7S Presentation
Showcase organizational effectiveness with this Strategic Alignment Using McKinsey 7S Presentation. This diagram template visually maps all seven interconnected elements—Strategy, Structure, Systems, Shared Values, Skills, Style, and Staff—making it easy to communicate business alignment and transformation goals. Perfect for consultants, team leaders, and strategy professionals. Fully customizable in PowerPoint, Keynote, and Google Slides.


5 slides
Root Cause Analysis Fishbone Slide Presentation
Give your problem-solving sessions a fresh visual spark with a tree-style diagram that makes tracing causes feel clear and intuitive. This presentation helps you break down issues, organize insights, and present findings with clean, structured flow. Perfect for teams and workshops. Fully compatible with PowerPoint, Keynote, and Google Slides.


10 slides
South America Business Development Growth Map Presentation
Showcase business growth insights with this South America-focused development map. Featuring vibrant bar-style columns aligned with country highlights, this layout helps visualize economic potential, investment zones, and performance indicators. Perfect for regional strategy presentations, market analysis, and expansion proposals. Fully editable for PowerPoint, Keynote, and Google Slides compatibility.


6 slides
Business Milestone Timeline Presentation
Showcase key achievements and future goals with the Business Milestone Timeline Presentation. This visually engaging template allows you to highlight crucial company events, project phases, or strategic plans in a clear, structured format. Ideal for corporate reporting, business growth tracking, and investor presentations. Fully customizable and compatible with PowerPoint, Keynote, and Google Slides.


5 slides
Business Development Five-Step Plan Presentation
Accelerate your growth with the Business Development Five-Step Plan presentation. This structured template guides you through key stages of business expansion, from strategy to execution. Designed for entrepreneurs, startups, and corporate teams, this clear and engaging format ensures effective planning and communication. Fully customizable for PowerPoint, Keynote, and Google Slides to fit your specific needs.


5 slides
Leadership Decision-Making Process Presentation
Guide your audience through leadership challenges with this step-by-step visual. Featuring four clearly defined stages, this layout is perfect for illustrating strategy development, executive planning, or coaching frameworks. The rising path graphic and human figure emphasize progress and achievement. Fully editable and compatible with PowerPoint, Keynote, and Google Slides.


5 slides
Office Collaboration Illustration Pack Presentation
Visualize modern teamwork with this sleek office collaboration layout. Ideal for showcasing brainstorming sessions, decision-making flows, or team communication, this illustration-driven template is perfect for business updates, internal strategy briefs, or workflow discussions. Fully editable and compatible with PowerPoint, Keynote, and Google Slides.


22 slides
Hellenic Small Business Pitch Deck Presentation
Unleash the spirit of entrepreneurship with this captivating Hellenic-themed presentation! Designed specifically for small business pitches, this template allows you to showcase your business concept, market analysis, and financial plans with elegance and clarity. Its vibrant visuals will engage your audience and leave a lasting impression. Compatible with PowerPoint, Keynote, and Google Slides.


5 slides
Organic Search Growth Plan Presentation
Grow your visibility the natural way with this sleek and easy-to-follow organic strategy slide. Perfect for outlining SEO goals, keyword clusters, and growth tactics, this visual layout makes your presentation clean and compelling. Fully compatible with PowerPoint, Keynote, and Google Slides for flexible editing across platforms.


4 slides
Corporate Governance Structure and Rules Presentation
Define leadership roles, responsibilities, and oversight with the Corporate Governance Structure and Rules Presentation. This minimalist bar-style layout is perfect for illustrating hierarchical influence, compliance levels, or board member functions. Each section can be fully edited to align with your company’s governance model, helping stakeholders visualize how power and accountability are distributed. Ideal for board meetings, corporate compliance reports, or executive briefings. Fully compatible with PowerPoint, Google Slides, and Keynote.


4 slides
Revenue Growth and Sales Forecast Layout Presentation
Present your key performance indicators with precision using the Revenue Growth and Sales Forecast Layout Presentation. This template features clear bar and donut charts to highlight revenue progression, product performance, and stock availability. Ideal for quarterly business reviews, financial reports, and sales team updates. Fully editable in Canva, PowerPoint, Keynote, and Google Slides.