


Features
- 5 Unique slides
- Fully editable and easy to edit in Microsoft Powerpoint, Keynote and Google Slides
- 16:9 widescreen layout
- Clean and professional designs
- Export to JPG, PDF or send by email


Do you have any questions?
Recommend


26 slides
Market Growth Tactics Presentation
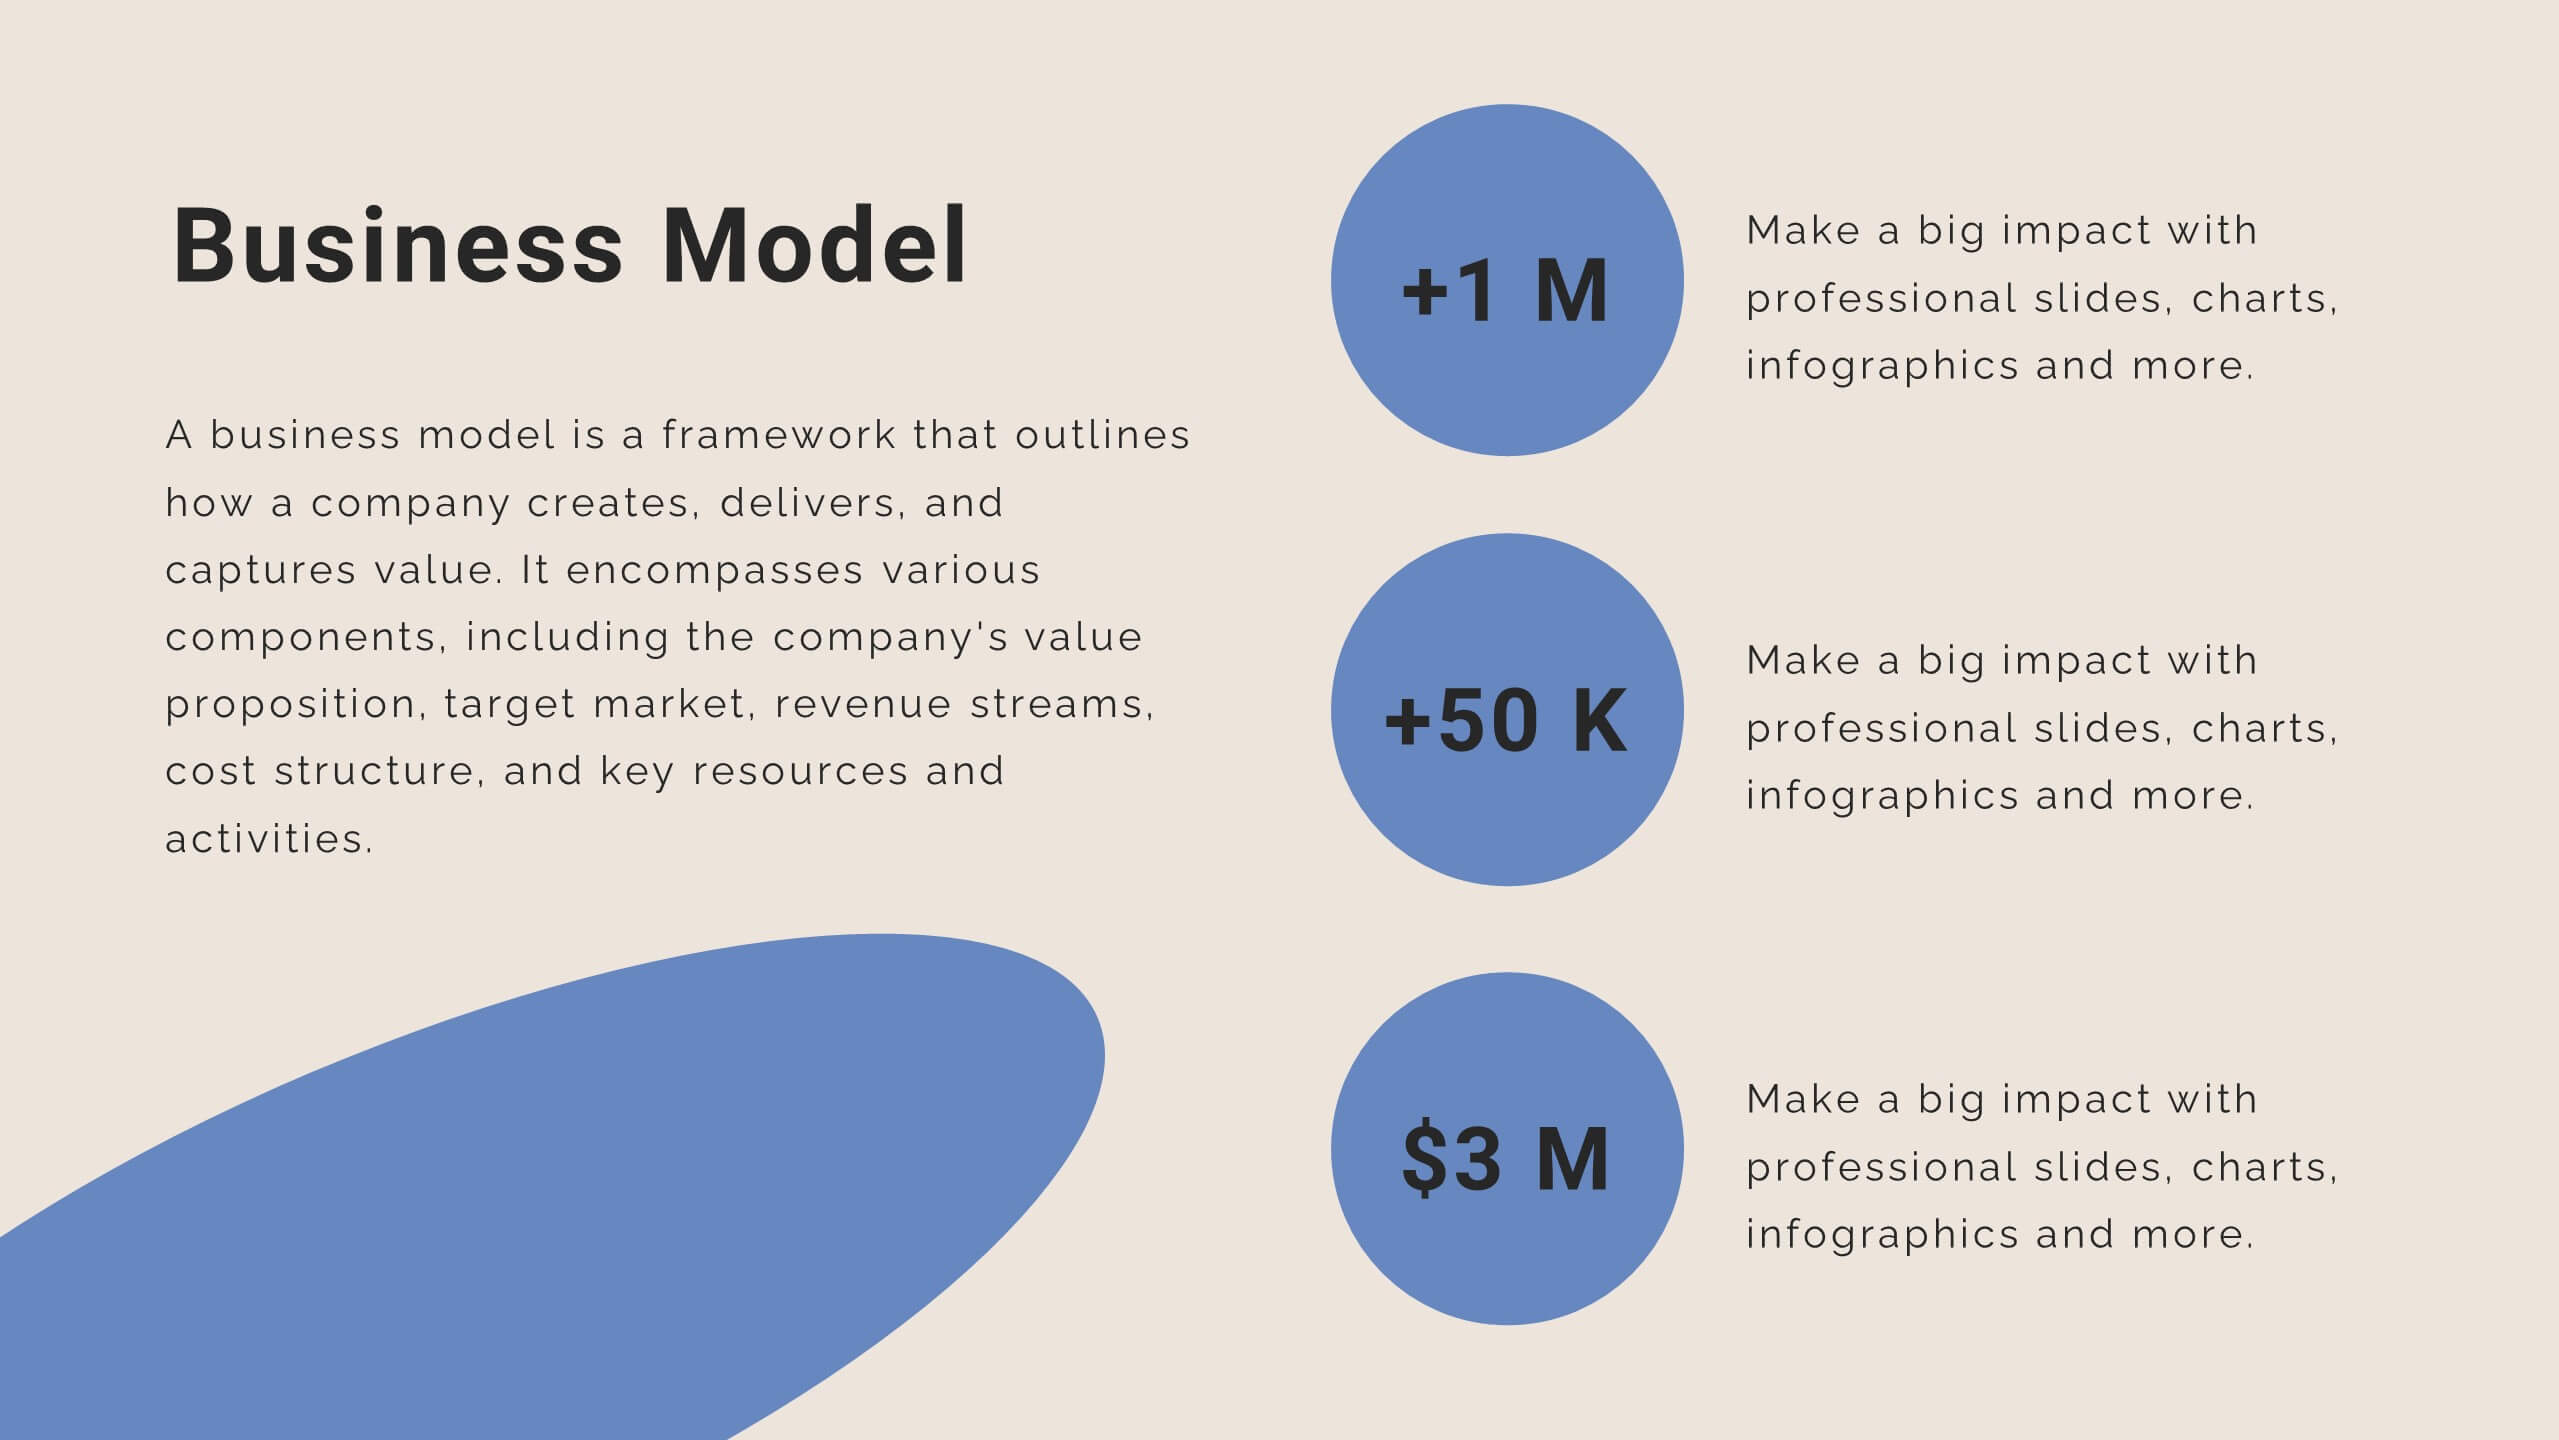
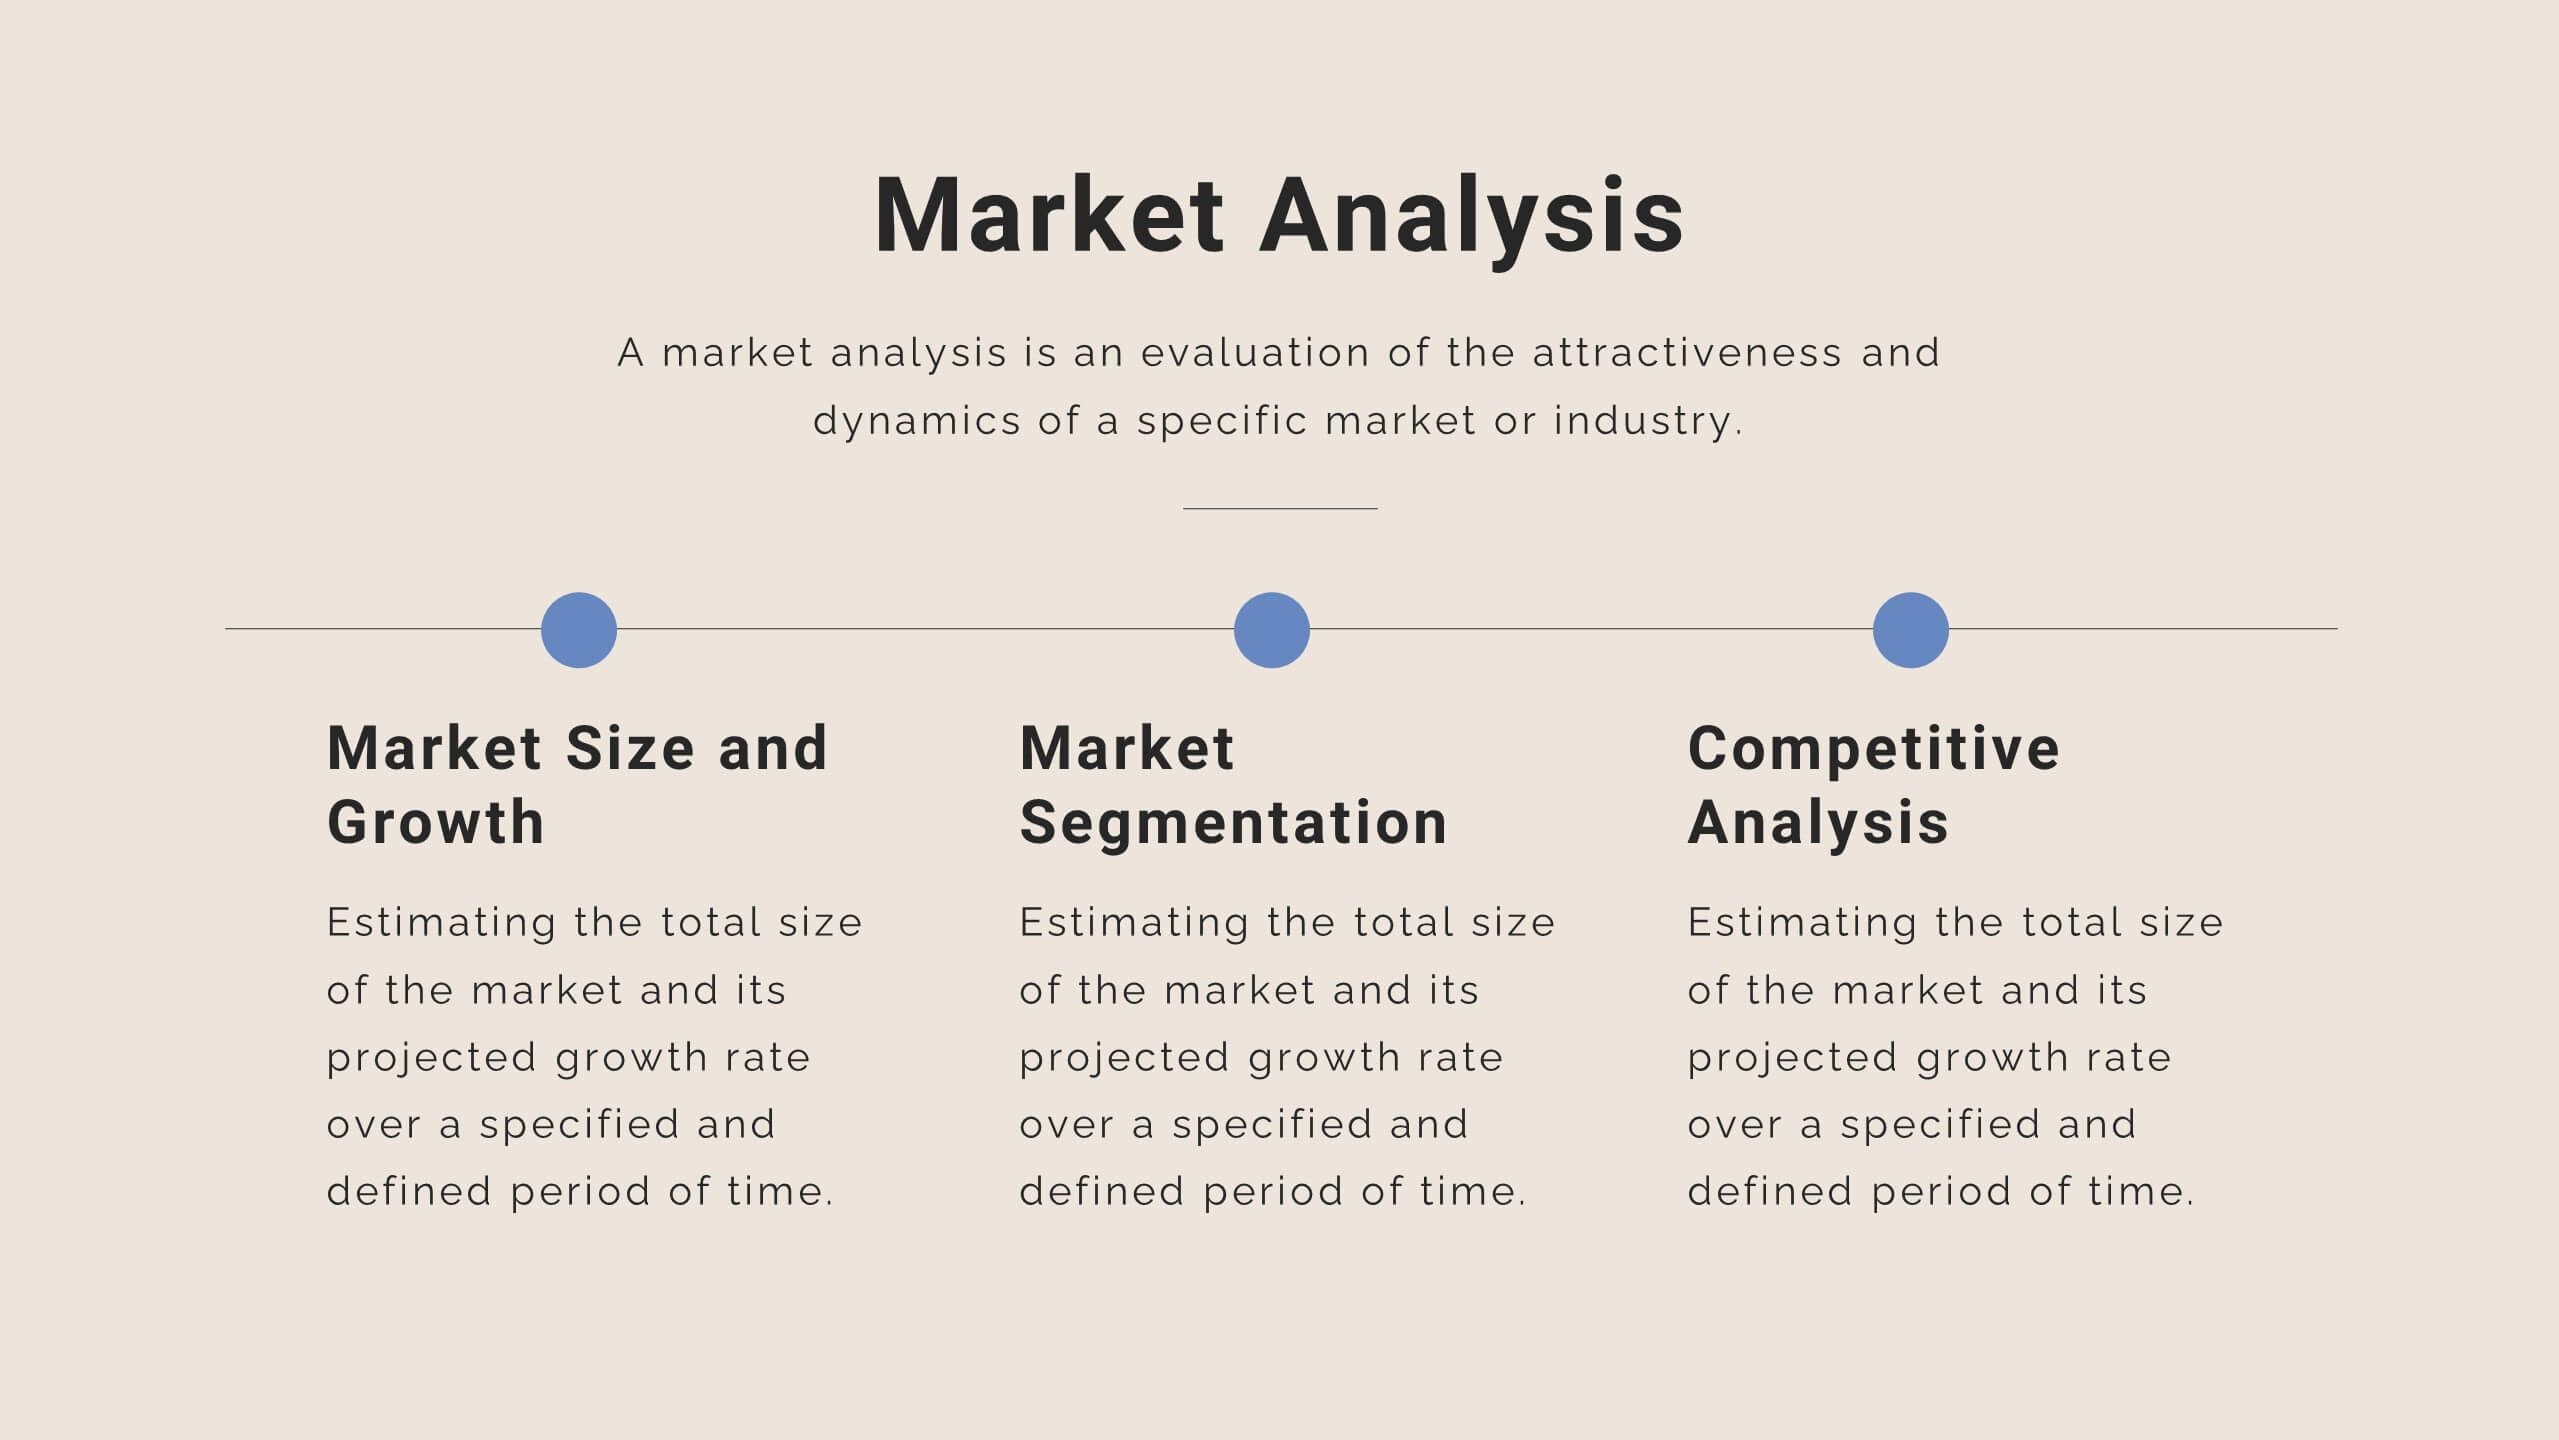
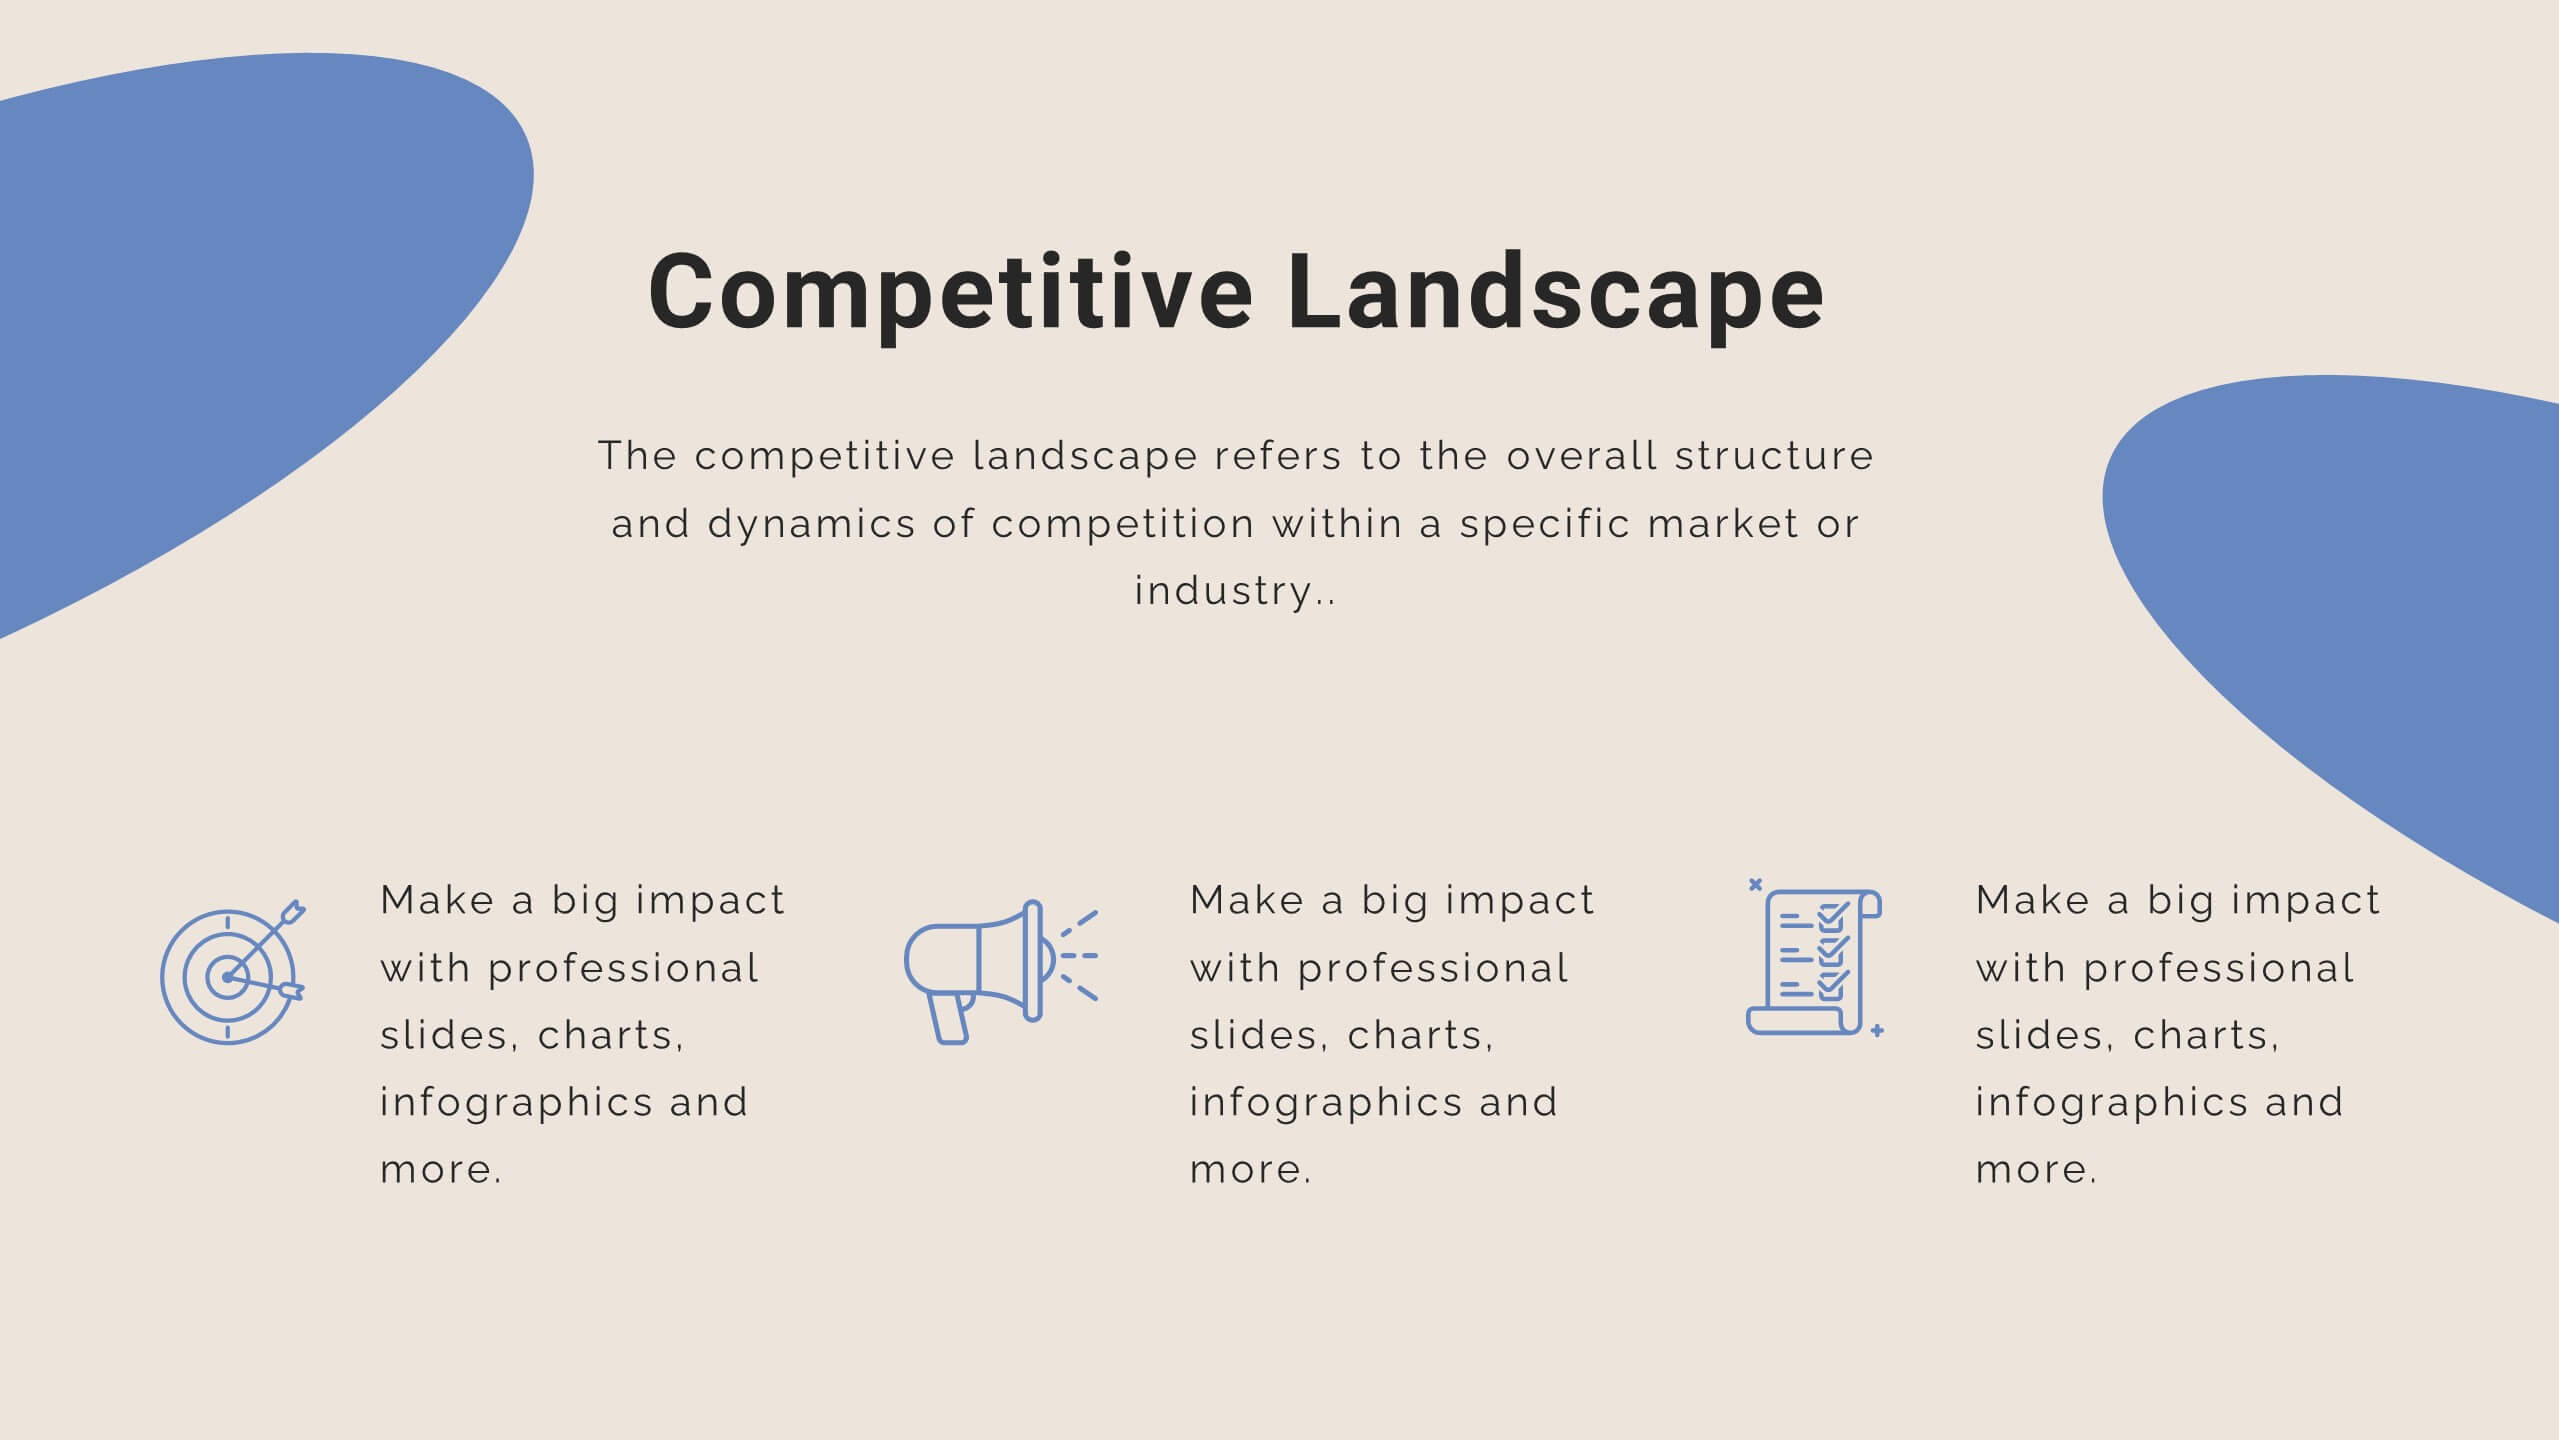
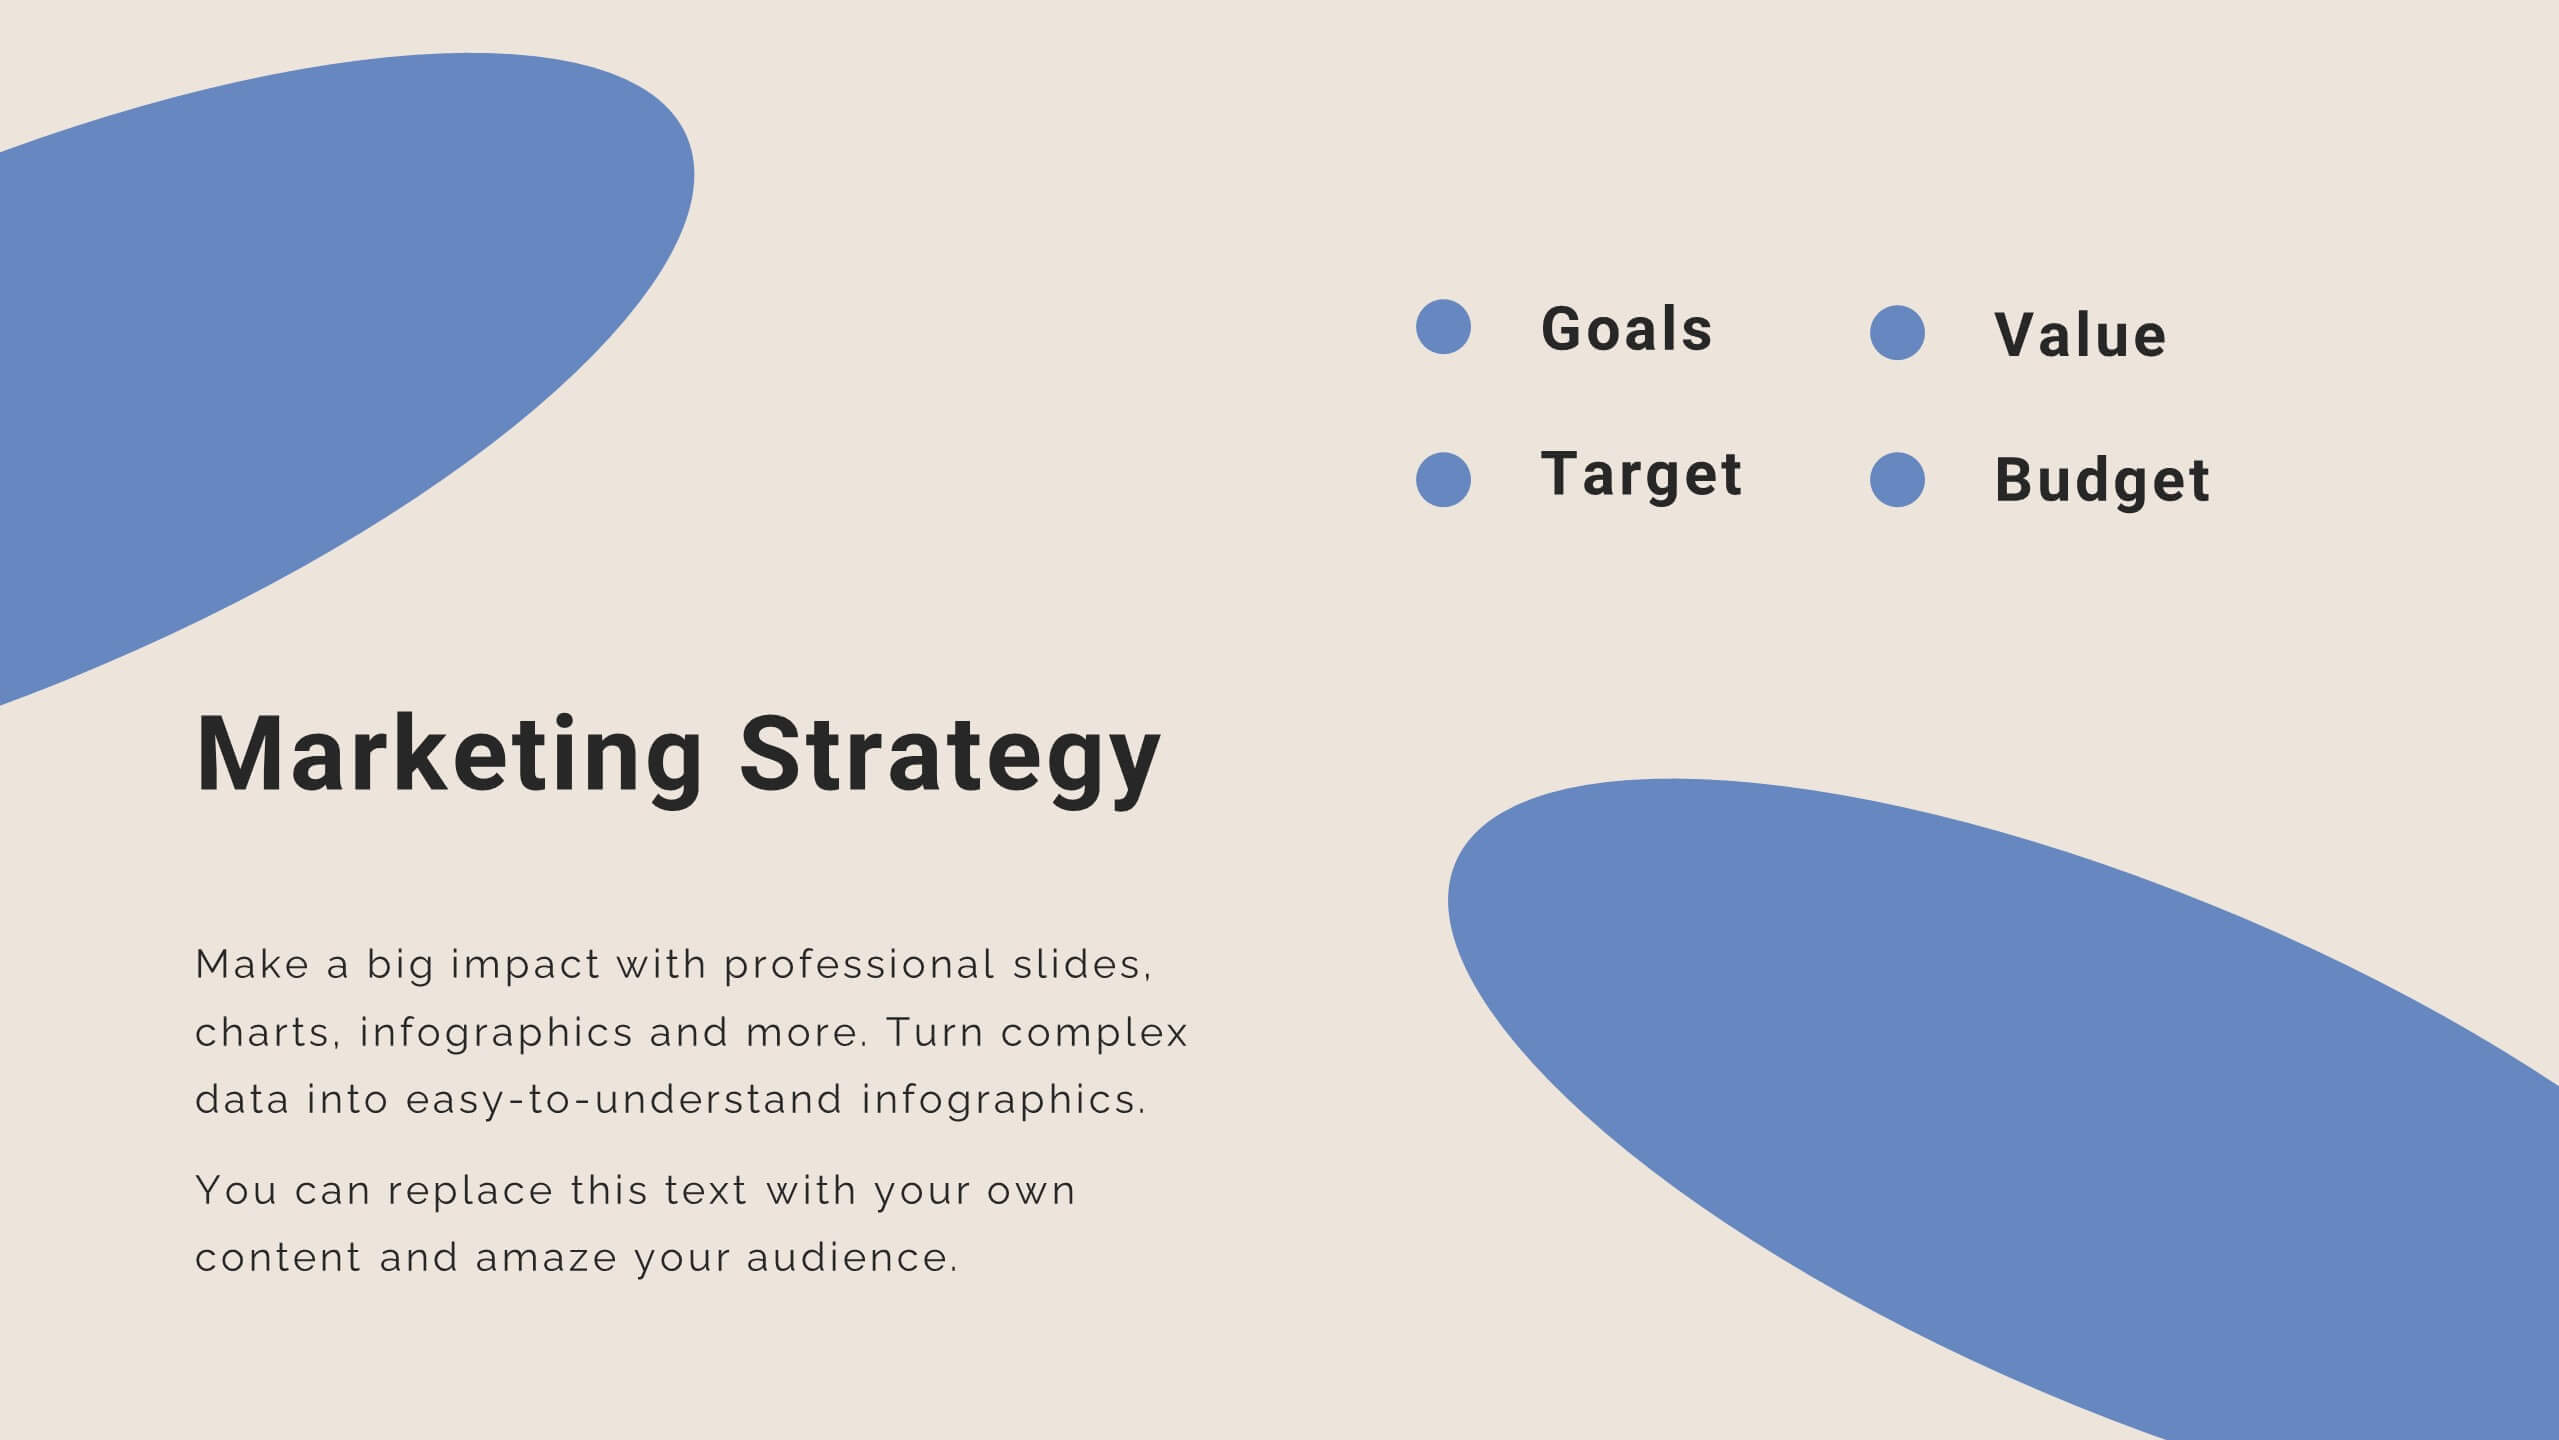
Chart a path to success with our Market Growth Tactics presentation template, designed for seamless use in PowerPoint, Keynote, and Google Slides. This template is a vital asset for business strategists, marketing professionals, and consultants who aim to drive growth and capture market share. Our Market Growth Tactics template lays out a strategic framework for identifying and leveraging growth opportunities. It provides a comprehensive array of slides to showcase market analysis, competitive landscape, growth strategies, and execution plans. With customizable elements, you can tailor your presentation to reflect specific market insights and growth targets relevant to your audience. The template is crafted to facilitate clear communication of complex growth strategies, breaking them down into actionable steps with the aid of charts, graphs, and infographics. This helps to convey your message effectively, ensuring that your audience can visualize the growth journey and understand the tactics involved. Elevate your market growth presentations and become an authoritative voice in your industry with our SEO-optimized template, designed to engage, inform, and inspire action towards market expansion.


6 slides
Market Challenges and Competitive Solutions Presentation
Visually map out business hurdles and strategic responses with this sleek 6-step infographic layout. Perfect for showcasing pain points on one side and proposed solutions on the other, it's ideal for sales decks, strategy reports, or competitor analysis. Customize each icon, title, and section easily in PowerPoint, Keynote, or Google Slides.


4 slides
Business Travel Logistic Plan Presentation
Make your business journey feel as smooth as your next flight! This infographic presentation template helps visualize logistics, travel routes, and resource allocation for corporate trips. Great for mapping key points and planning operations clearly. Fully editable and compatible with PowerPoint, Keynote, and Google Slides for easy customization and sharing.


5 slides
Medical Systems and Drug Research Overview Presentation
Present critical insights with this heart-themed infographic, ideal for showcasing medical systems, drug development stages, or treatment data. The visual layout supports four key points with a clear, engaging style. Fully customizable in PowerPoint, Keynote, and Google Slides—perfect for researchers, healthcare analysts, and pharmaceutical presentations.


6 slides
Responsive Design Display with Devices Presentation
Highlight your multi-device experience with the Responsive Design Display with Devices Presentation. This clean and modern layout features a central monitor and mobile phone illustration, surrounded by five customizable text points—ideal for showing key features or compatibility. Fully editable in Canva, PowerPoint, Keynote, and Google Slides.


4 slides
Social Media Analytics Dashboard Presentation
Easily monitor and report on your content performance with the Social Media Analytics Dashboard Presentation. This sleek, modular layout combines key metrics like items, uploads, comments, and feeds with a vertical bar chart to visualize insights across platforms. Ideal for campaign reviews, stakeholder updates, or team reporting. Fully customizable in PowerPoint, Keynote, and Google Slides.


7 slides
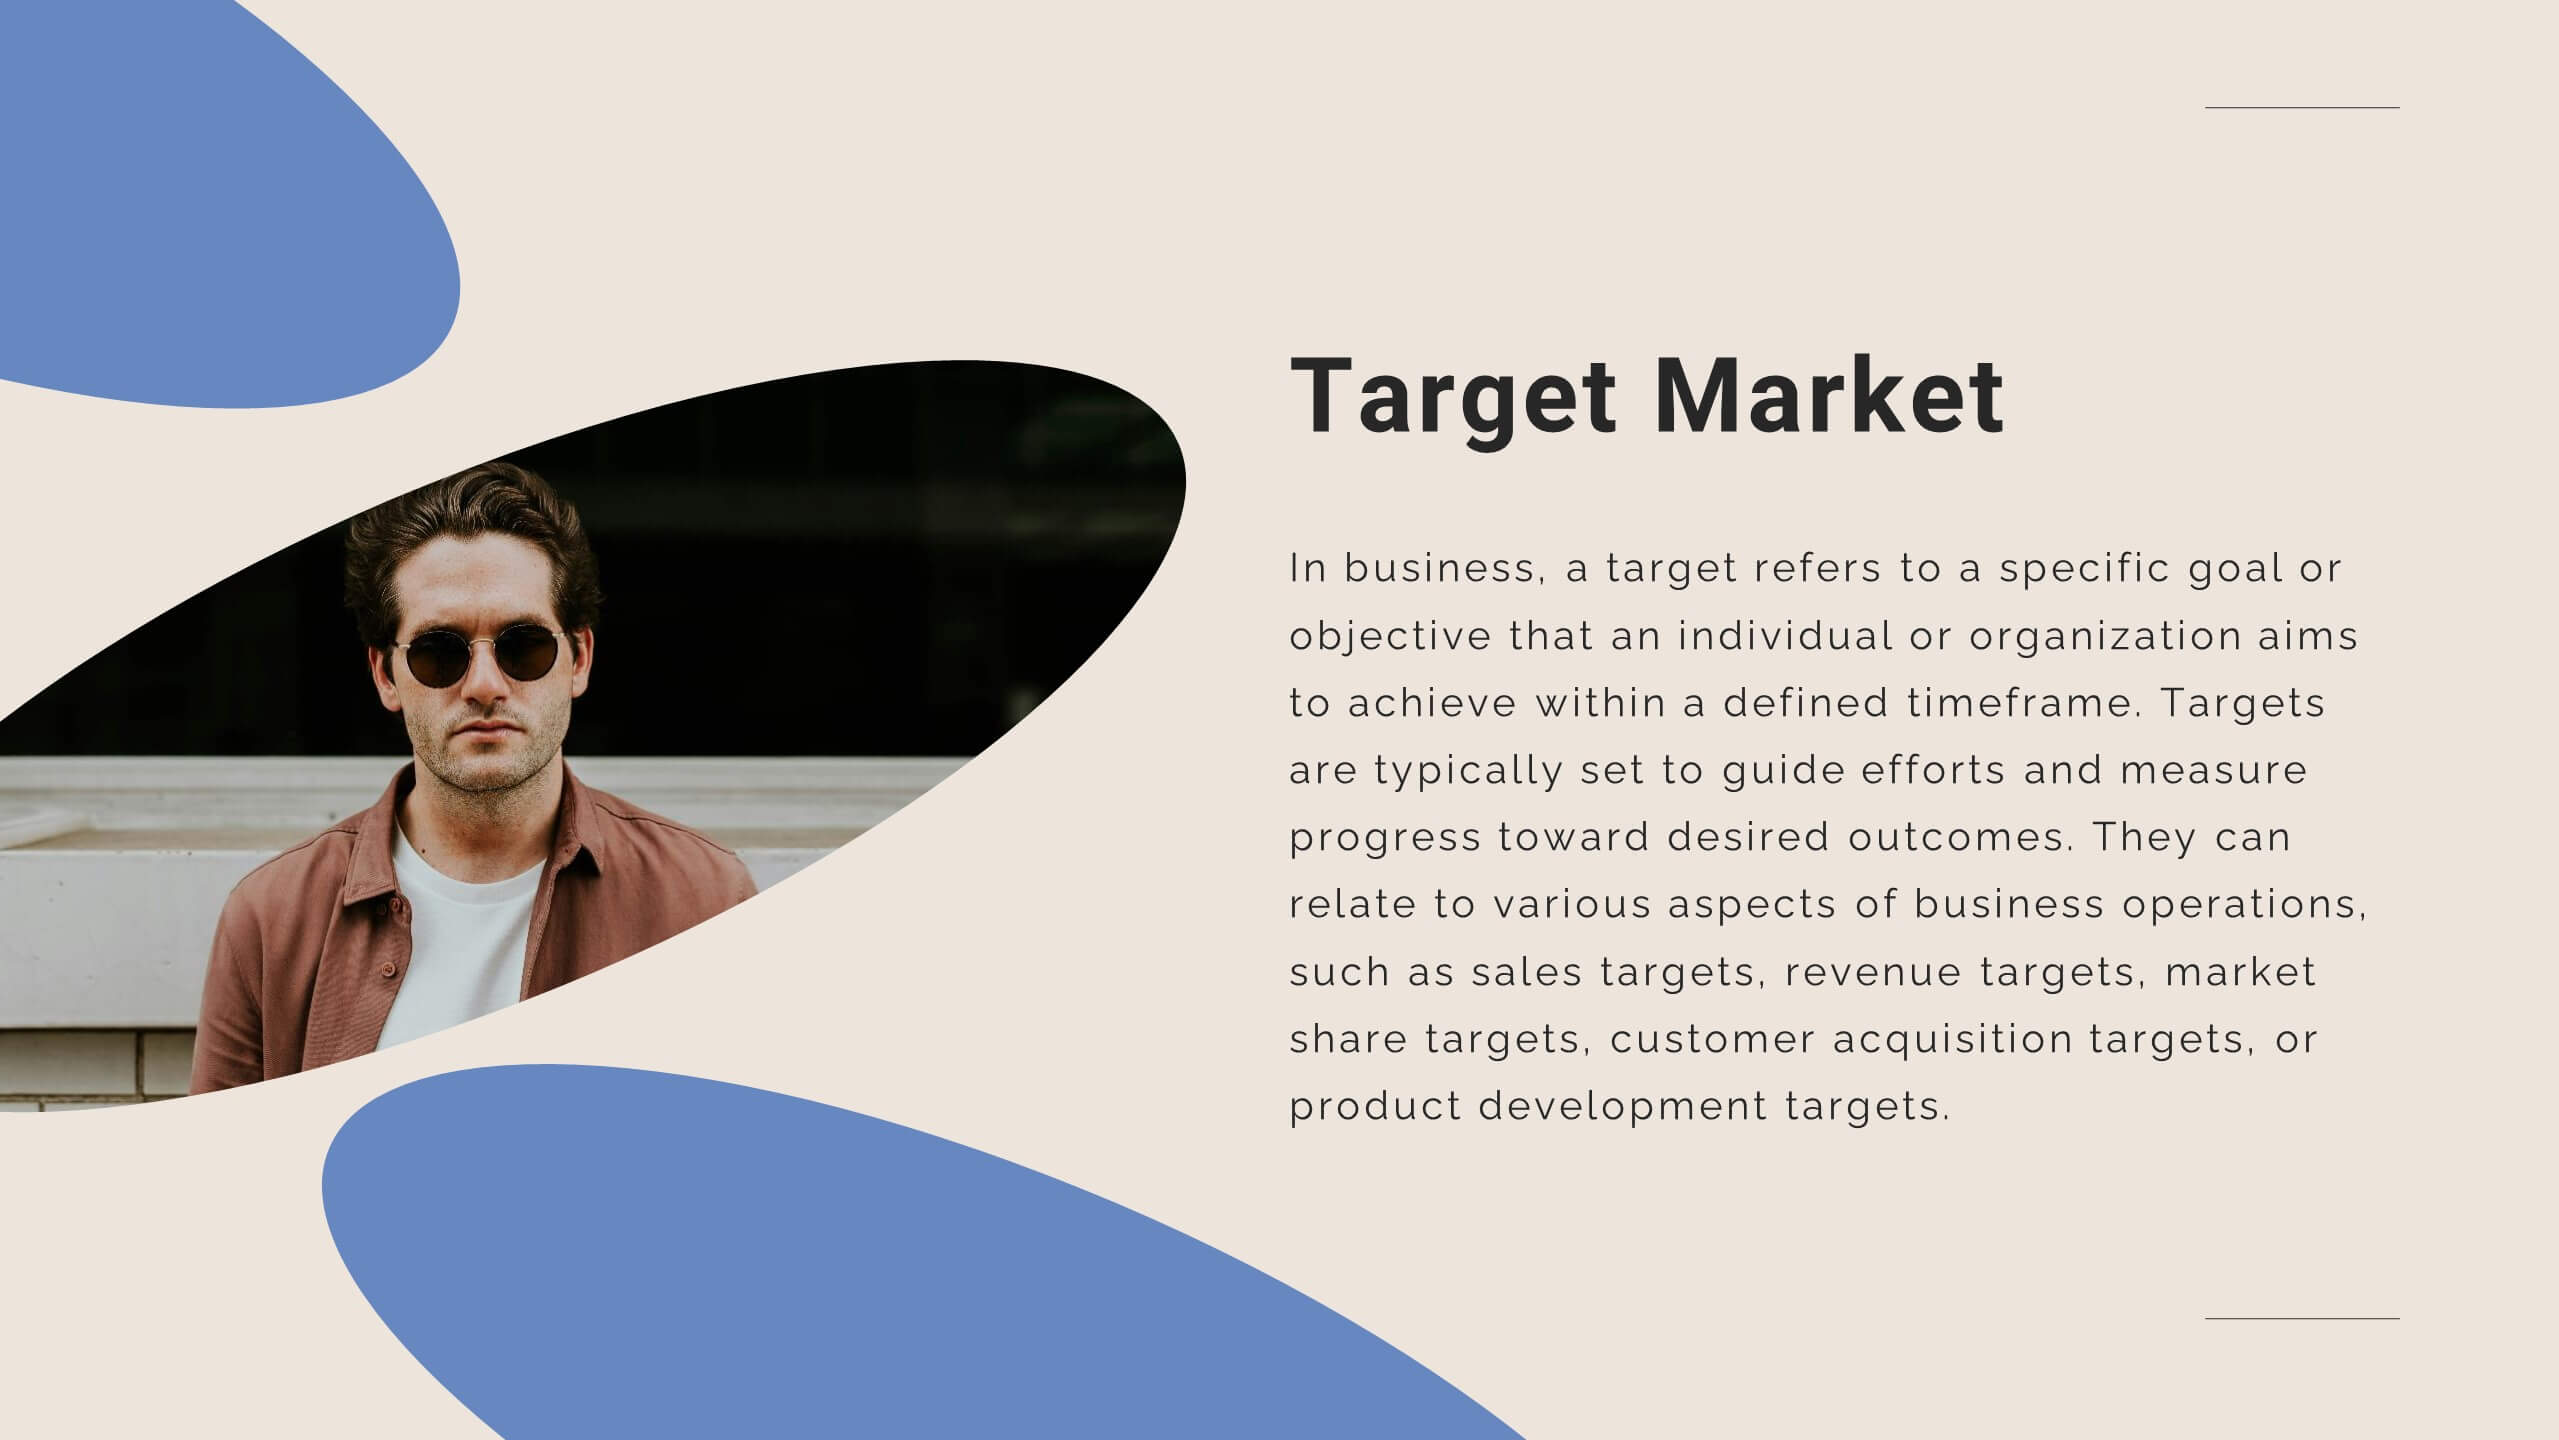
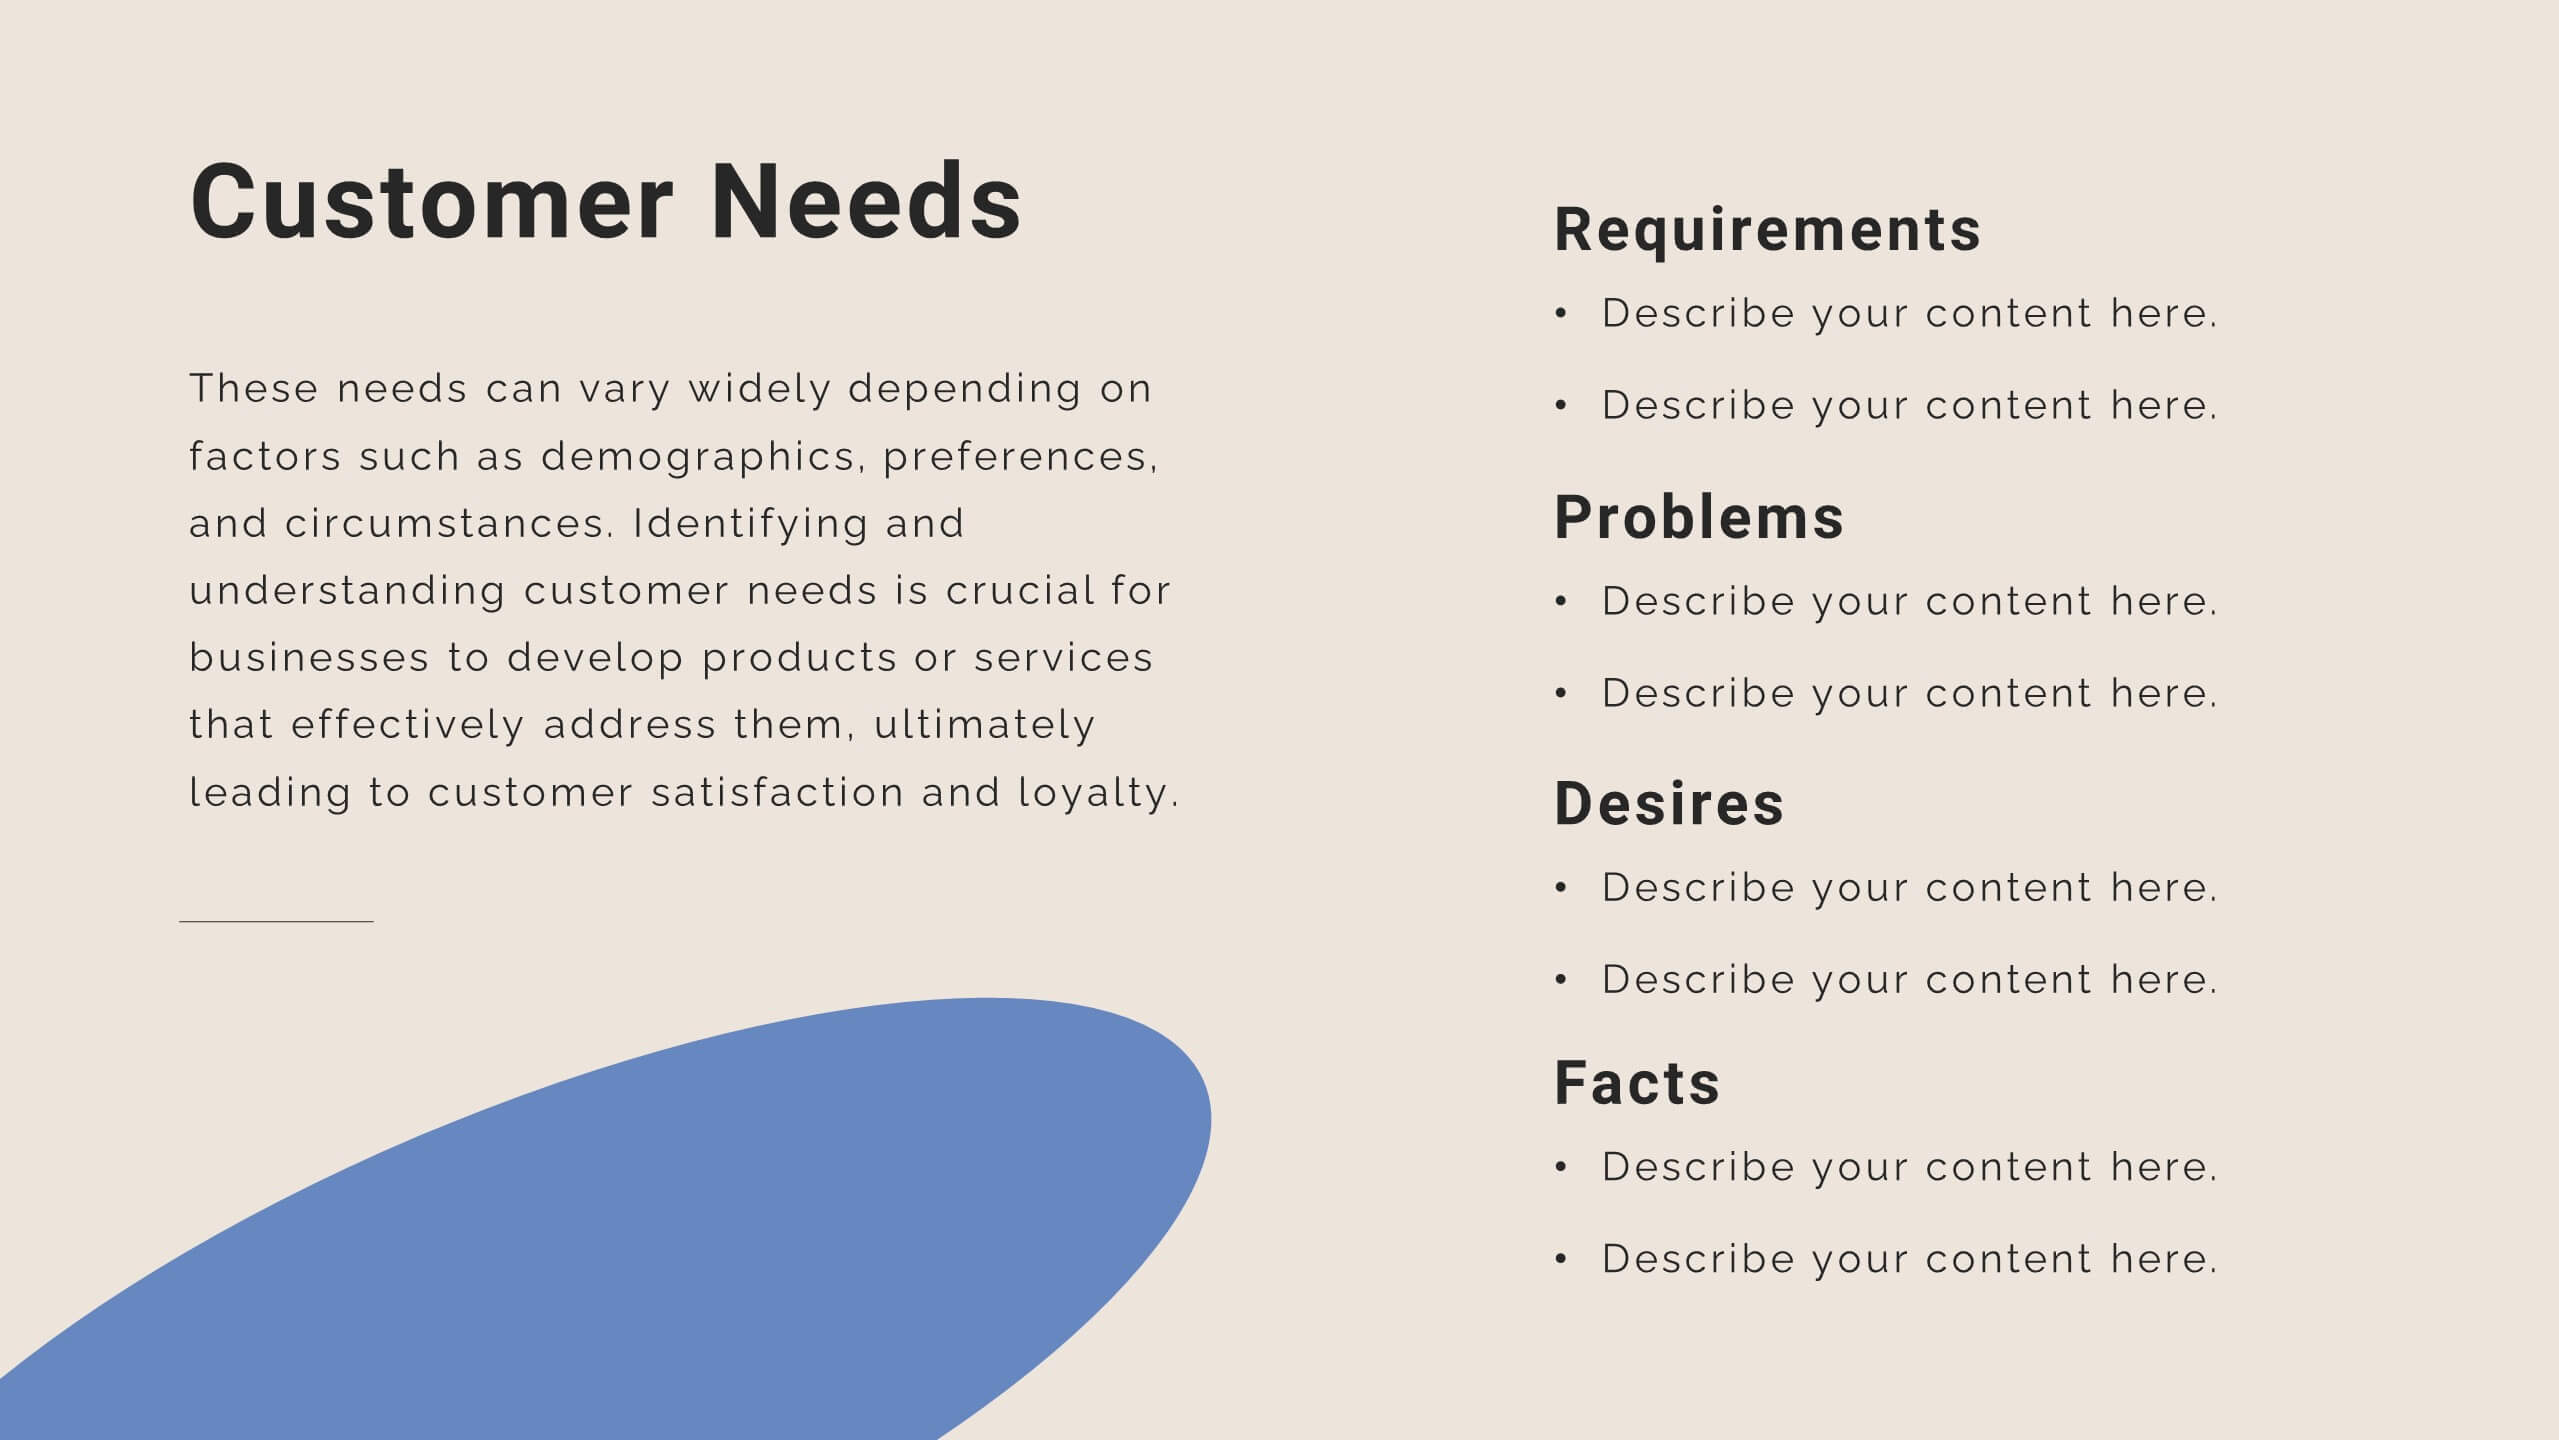
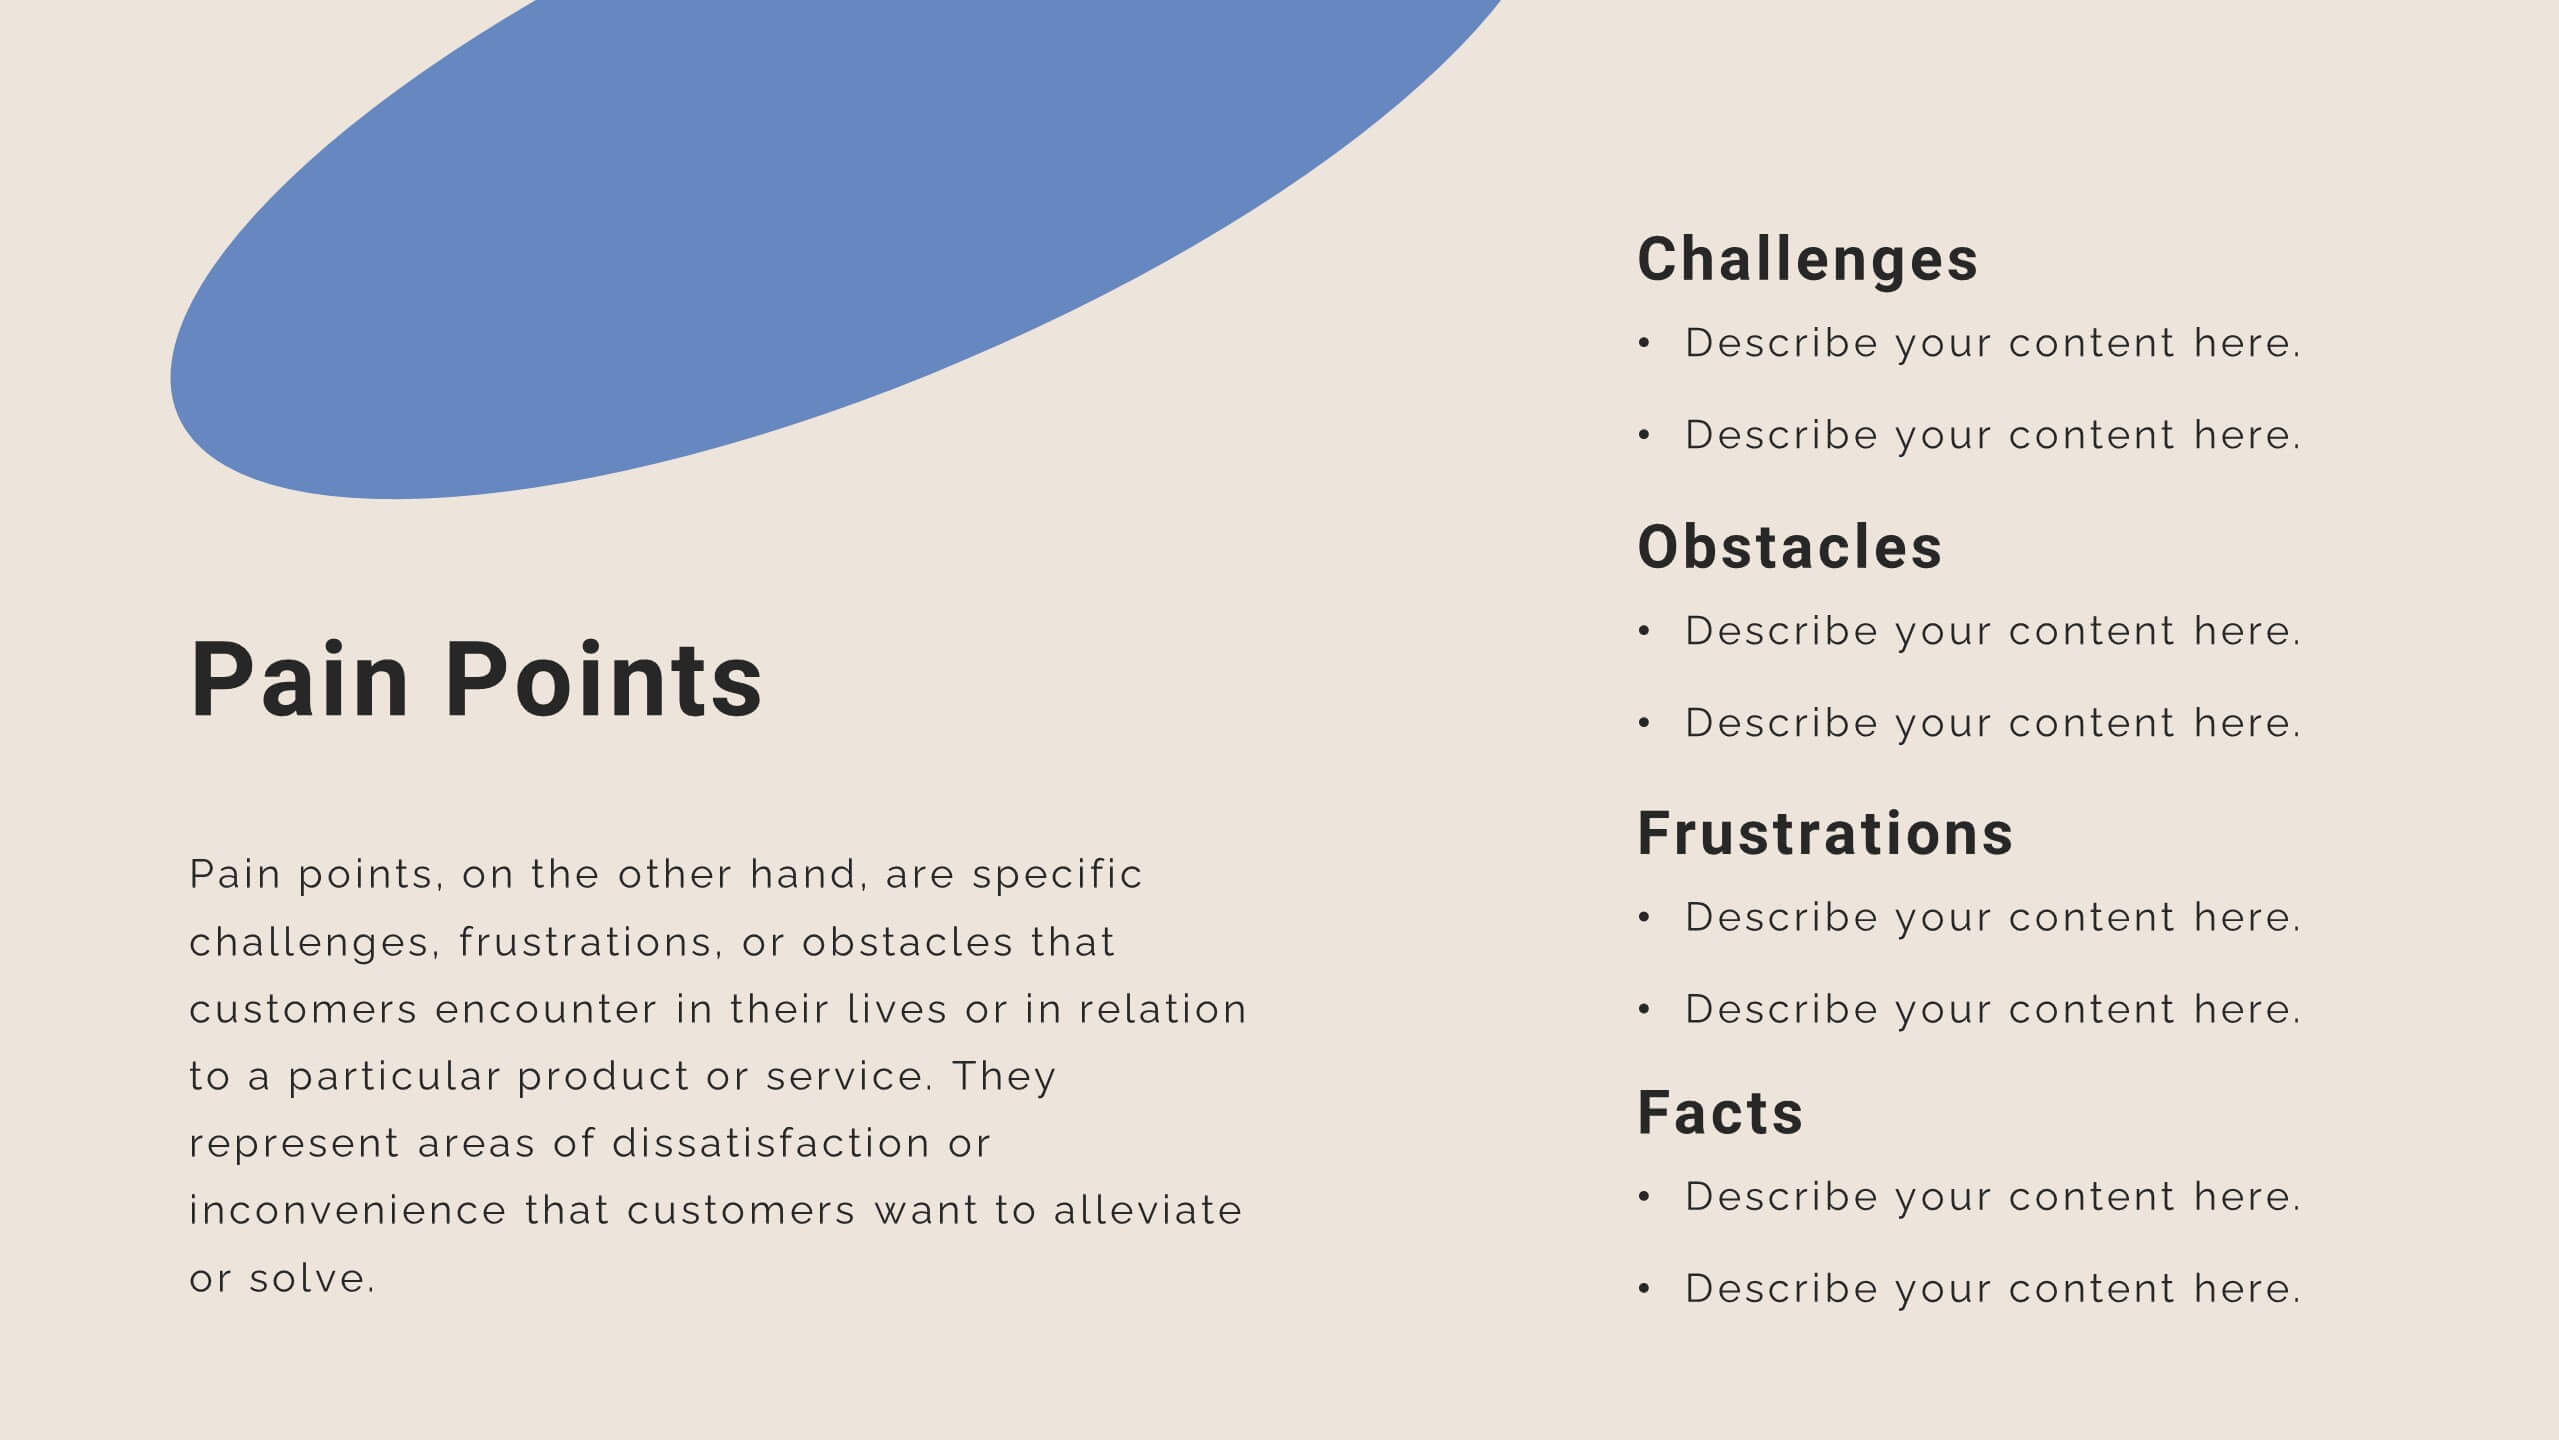
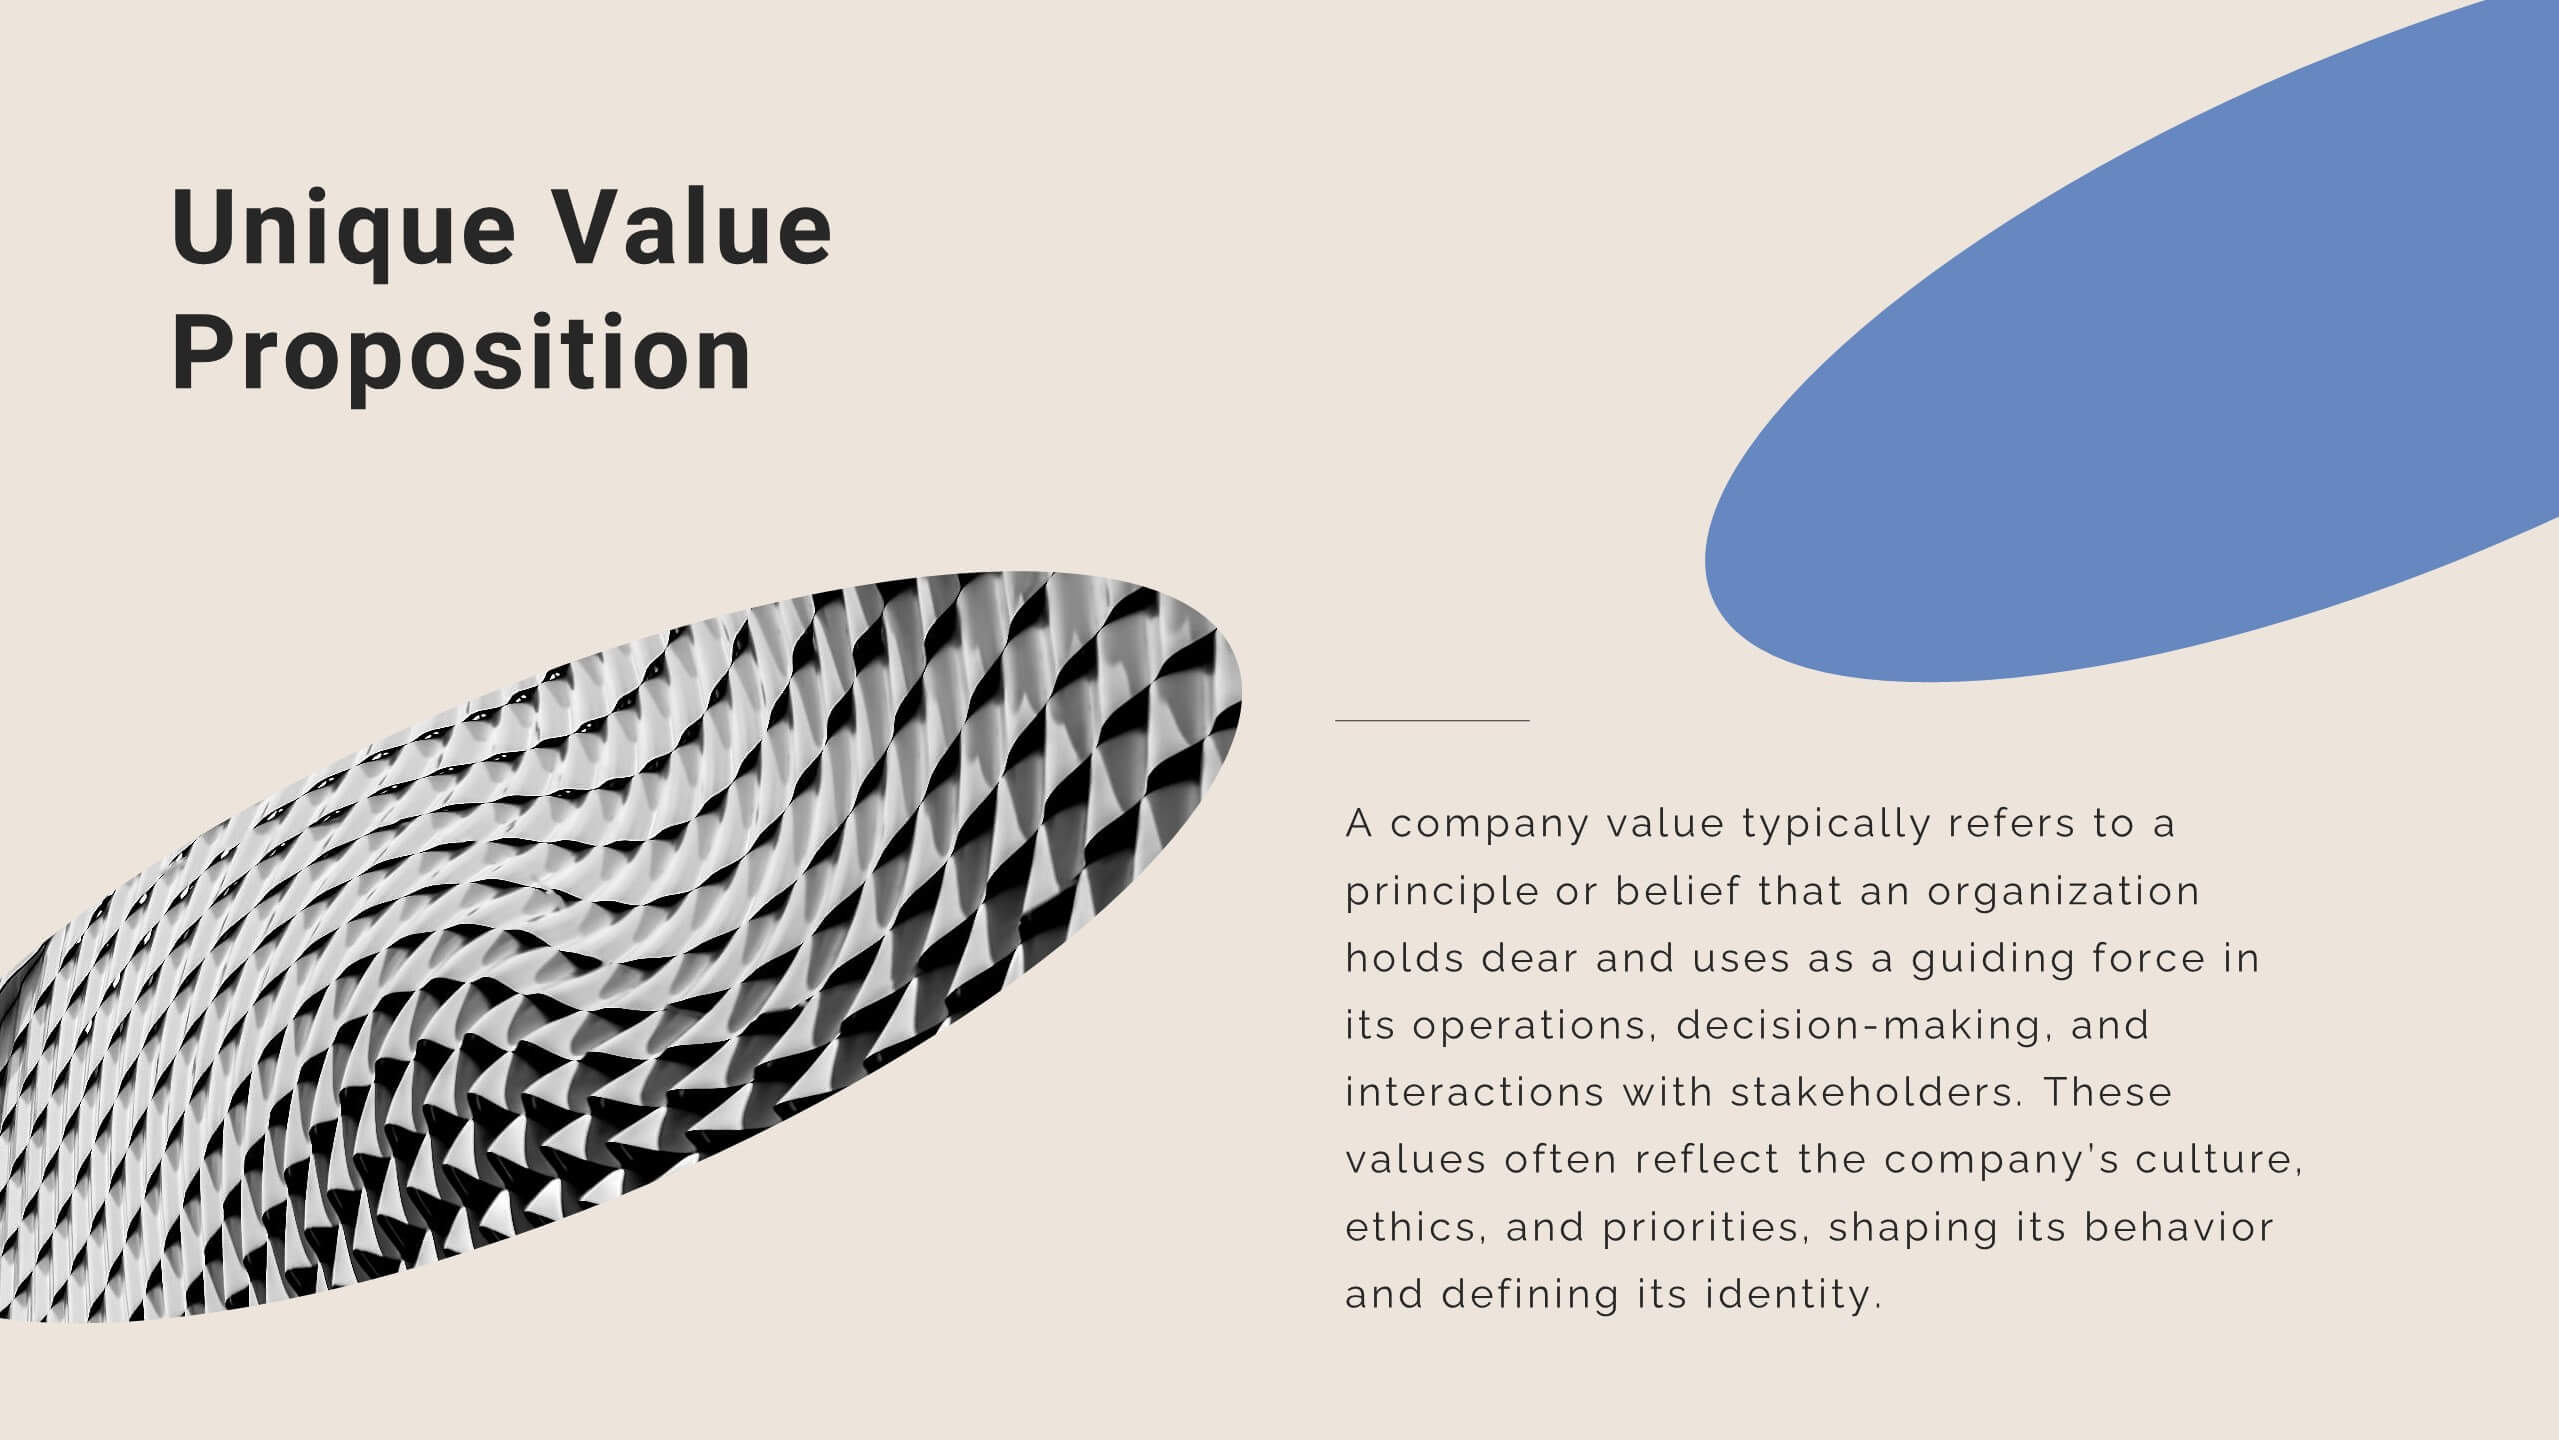
Target Market Identification Strategy
Spot your ideal customers with precision using this lightbulb-centered layout designed to highlight key market segments and decision-making factors. Whether you're building buyer personas or refining your strategy, this slide presents your insights in a smart, structured way. Fully compatible with PowerPoint, Keynote, and Google Slides.


20 slides
Spartan Content Marketing Pitch Deck Presentation
The Spartan Marketing Pitch Deck is designed to captivate and impress with its bold, modern layout and striking black-and-white color scheme. Perfect for delivering powerful marketing strategies, this template covers all essential aspects from industry overview to consumer behavior analysis. It seamlessly guides you through emerging technologies, content marketing trends, and mobile marketing insights. The deck emphasizes personalization trends, influencer marketing, and the latest eCommerce developments, ensuring your pitch resonates with cutting-edge strategies. Whether discussing SEO and SEM trends or diving into customer experience and brand storytelling, this template delivers your message with clarity and impact. Conclude with a strong call to action, ensuring your audience is engaged and ready to take the next step. Fully compatible with PowerPoint, Keynote, and Google Slides, the Spartan Marketing Pitch Deck is an excellent choice for professionals aiming to deliver a memorable and persuasive presentation.


7 slides
Gantt Chart Infographic Presentation Template
A Gantt chart is a graphic chart that illustrates the start and finish dates of project activities, and its tasks or events between a start and finish date. The resulting charts are often used to depict the relationship between individual tasks in addition to their dependencies and duration estimates. This Gantt chart template is easy to use, and allows you to adjust start and end dates with a simple drag and drop. This template is designed to help you start organizing your project by identifying tasks and dependencies on those tasks, without overwhelming you with a comprehensive layout.


3 slides
Project Status Report Overview Presentation
Bring clarity to your progress updates with this clean, easy-to-read template designed to track milestones, performance, and project goals at a glance. Ideal for team meetings and executive summaries, it turns data into visual insight. Fully compatible with PowerPoint, Keynote, and Google Slides for effortless customization and presentation.


4 slides
Leadership and Team Challenges Presentation
Illustrate your team’s journey with this engaging visual that highlights progress, obstacles, and achievements. Featuring a dynamic leader figure ascending an arrow-shaped path, this template is ideal for showcasing leadership development, team-building stages, or challenge-resolution frameworks. Fully editable and compatible with PowerPoint, Keynote, and Google Slides.


2 slides
Creative Business Presentation
Showcase your ideas with energy and style using this bold, contemporary presentation layout. Featuring dynamic visuals and clean typography, this template is ideal for business proposals, portfolios, and startup pitches. Easily customizable in PowerPoint, Keynote, and Google Slides to suit your brand's identity.


5 slides
Colorful Circular Flow Chart Presentation
Bring your ideas full circle with a vibrant, energetic flow that instantly grabs attention and makes complex processes feel effortless to follow. This presentation is perfect for illustrating cycles, workflows, or interconnected stages in a clear, dynamic way. Fully compatible with PowerPoint, Keynote, and Google Slides.


5 slides
New Hire Onboarding Roadmap Presentation
Guide new employees with clarity using the New Hire Onboarding Roadmap Presentation. This visual roadmap features a timeline layout with icons resembling briefcases, each representing a stage in the onboarding process. Ideal for HR professionals or team leads, it helps outline milestones such as orientation, training, and integration steps. Fully editable in Canva, PowerPoint, Google Slides, and Keynote.


22 slides
Mystic Startup Strategy Presentation
Launch your startup with confidence using this comprehensive funding proposal template! Perfect for showcasing your mission, vision, and business model to potential investors. Highlight your unique value proposition and growth plan with style. Compatible with PowerPoint, Keynote, and Google Slides, this template ensures your pitch stands out and secures the funding you need.


7 slides
Fishbone Analysis Infographic Presentation
A fishbone Infographic is a technique used to brainstorm the cause of a problem. The unique design helps you understand how one thing can lead to another and is effective at helping you create a solution that reviews all aspects. Start this template off using the head of the fish as a prompt and webbing out from there, draw up to six main causal categories and then sub-categories. Use this infographic to organize your ideas and identify key factors, as well as decide how to prioritize them. This template is compatible and completely editable with Powerpoint, keynote and google slides.


7 slides
Milestones Credit Card Infographic Presentation
A Milestones Infographic is a visual representation of significant events, accomplishments, or achievements in a project, business, or individual's life. This template include timelines, graphs, diagrams, and other visual elements to help convey important information. You can use this infographic to cover many different topics, including project management, business growth, personal achievements, or company history. This template is useful for businesses or individuals who want to showcase their accomplishments, highlight important dates or events, or just share progress updates.