


Features
- 5 Unique slides
- Fully editable and easy to edit in Microsoft Powerpoint, Keynote and Google Slides
- 16:9 widescreen layout
- Clean and professional designs
- Export to JPG, PDF or send by email


Do you have any questions?
Recommend


8 slides
Political, Economic, Social Analysis Presentation
Highlight key external influences with the Political, Economic, Social Analysis Presentation. This clean, hexagon-based layout offers a simple yet impactful way to break down PEST factors for strategy planning, market entry, or business reports. Fully editable in PowerPoint, Canva, and Google Slides for fast, polished presentations.


3 slides
Future of Aviation Technologies Presentation
Soar into the future of flight with this sleek, data-driven layout that visualizes progress and innovation in aviation. Perfect for showcasing new technologies, sustainability efforts, or industry growth trends, it balances clarity and impact. Fully customizable and compatible with PowerPoint, Keynote, and Google Slides for effortless presentation design.


12 slides
Strategic Planning with Strategy Wheel Presentation
Visualize your roadmap with this sleek strategy wheel template. Perfect for showcasing up to six strategic stages, this layout highlights progression while keeping your content organized and engaging. Ideal for business plans, project development, or performance cycles. Fully editable in PowerPoint, Keynote, and Google Slides.


6 slides
Public Healthcare System Strategy Presentation
Present key components of your medical or government plan with the Public Healthcare System Strategy Presentation. This clean and modern slide design uses a heart-centered layout with five surrounding icons to highlight core pillars—perfect for policy updates, strategy overviews, or health service workflows. Fully editable in Canva, PowerPoint, Keynote, and Google Slides.


21 slides
Manticore Financial Report Presentation
This financial report template features a sleek, modern design for presenting key highlights, performance metrics, and financial summaries. It includes sections for market trends, competitor insights, and strategic initiatives. Fully customizable and compatible with PowerPoint, Keynote, and Google Slides, it's perfect for delivering impactful financial presentations with clarity and style.


4 slides
Green Business Sustainability Report Presentation
Communicate your sustainability efforts effectively with the Green Business Sustainability Report Presentation template. This visually engaging slide deck is designed to showcase eco-friendly business initiatives, corporate responsibility strategies, and environmental impact assessments. With an organic, nature-inspired design and a clear, structured layout, this template is perfect for sustainability consultants, corporate leaders, and environmental advocates. Fully editable and compatible with PowerPoint, Keynote, and Google Slides for seamless customization and presentation.


5 slides
Investment Portfolio & Stock Forecast Presentation
Present key investment insights with clarity using the Investment Portfolio & Stock Forecast presentation template. Featuring a central briefcase visual and surrounding data points, this layout is perfect for showcasing portfolio allocation, stock predictions, market movements, or financial planning elements. Designed for finance professionals, analysts, and advisors, it simplifies complex data into digestible visuals. Fully editable and compatible with PowerPoint, Keynote, and Google Slides.


5 slides
Environmental and Social Sustainability Presentation
Explore the synergy of environmental protection and social responsibility with our Environmental and Social Sustainability Presentation template. This visual aid is a compelling tool for discussing key strategies in balancing ecological and social impacts, providing a roadmap for sustainable business practices. Ideal for engaging audiences in discussions about conservation and community engagement, the template is fully compatible with PowerPoint, Keynote, and Google Slides, ensuring a smooth presentation experience in any setting.


8 slides
Project Timeline and Schedule Presentation
Keep your projects on track with this clear and professional timeline layout. This presentation is designed to help you outline tasks, milestones, and deadlines week by week. Easily visualize the flow of work, allocate resources efficiently, and ensure everyone stays aligned on the project schedule. Perfect for business meetings, project proposals, team updates, and academic planning. Fully editable and compatible with PowerPoint, Keynote, and Google Slides.


5 slides
Operational Workflow Process Chart Presentation
Streamline your operations with the Operational Workflow Process Chart Presentation. This template provides a clear visual layout to map out step-by-step processes, helping teams align on roles, timelines, and dependencies. Perfect for training, reporting, or system audits—fully customizable in PowerPoint, Canva, and Google Slides.


5 slides
Cloud Computing Services Overview Presentation
Simplify cloud service explanations with this Cloud Computing Services Overview template. Perfect for IT professionals, business leaders, and tech strategists, this slide visually breaks down key cloud services and infrastructure using an intuitive, easy-to-understand layout. Featuring color-coded icons and modern design, this template helps showcase essential cloud computing components effectively. Fully compatible with PowerPoint, Keynote, and Google Slides for seamless integration into your presentations.


20 slides
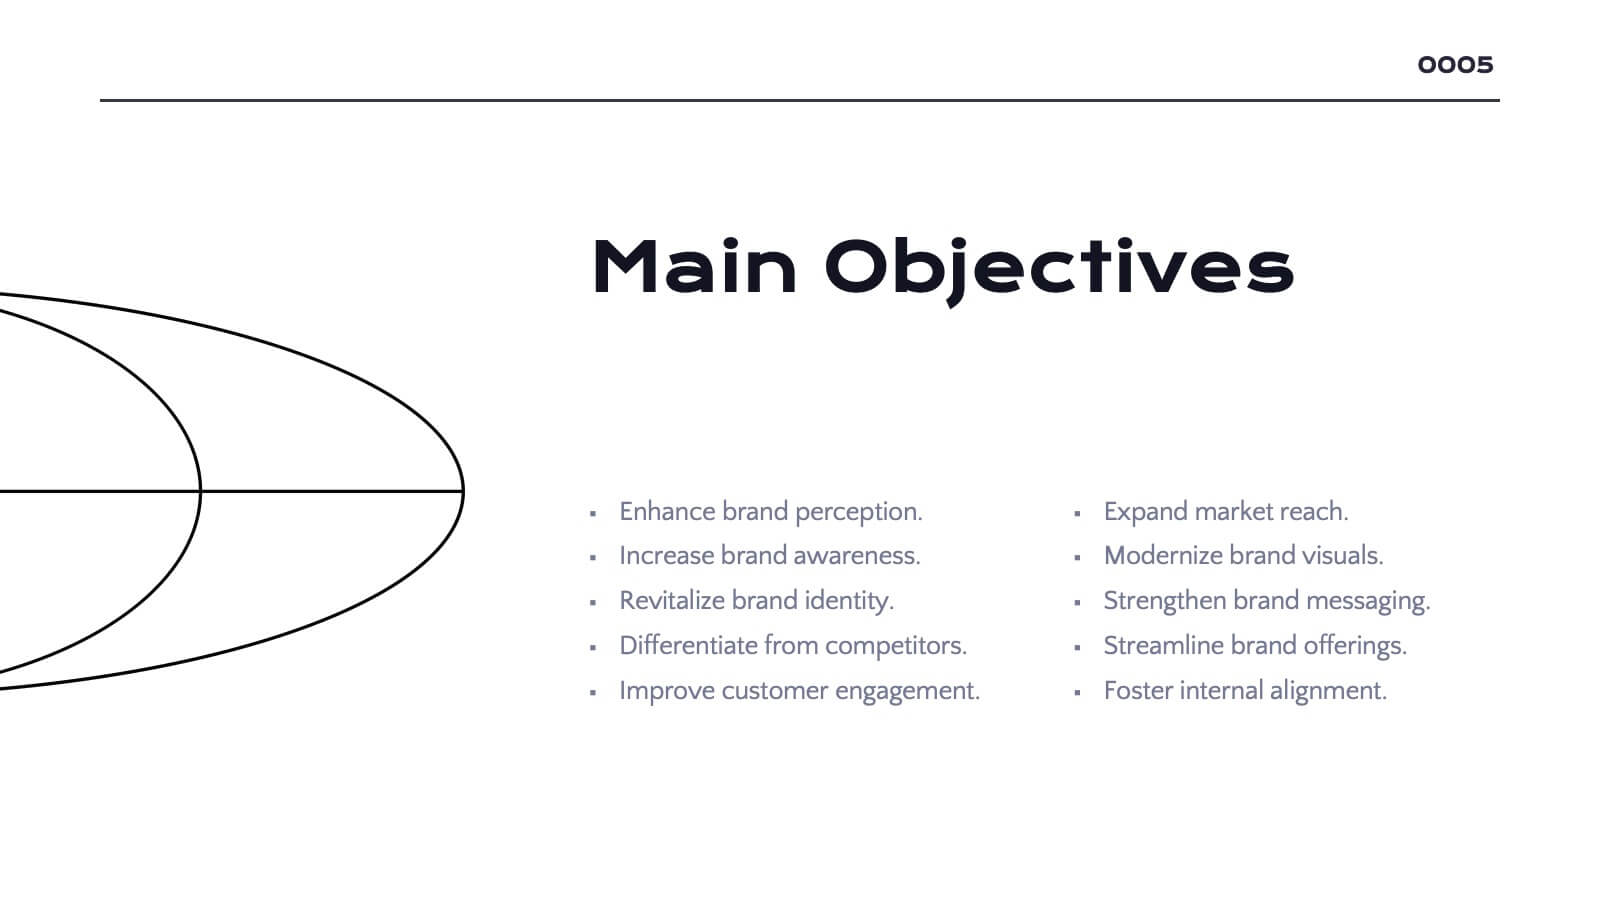
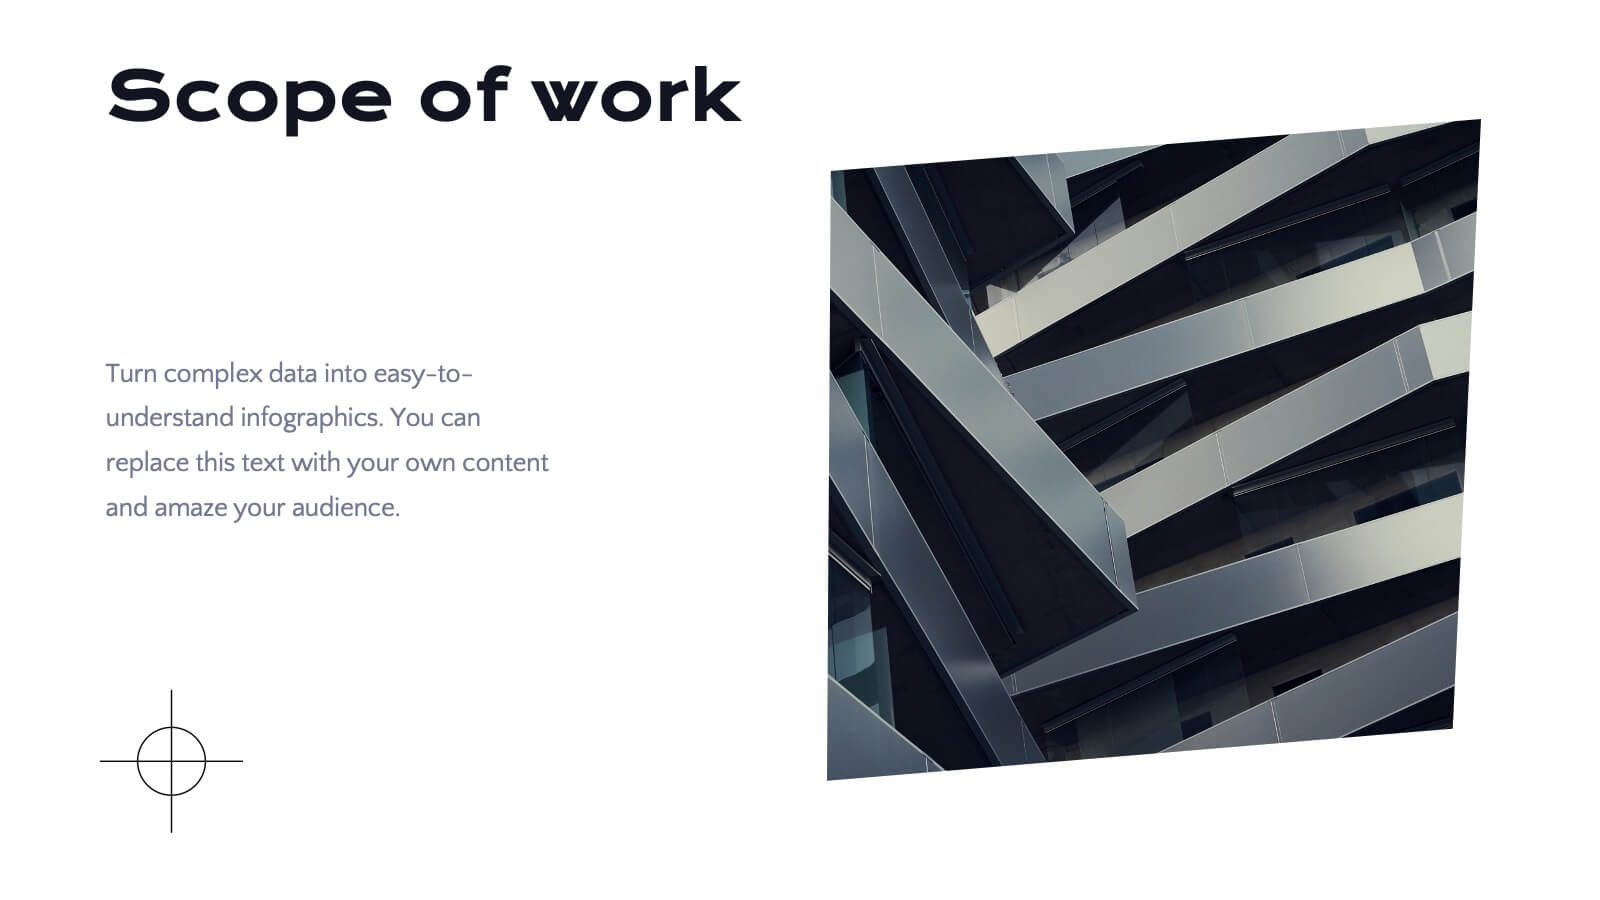
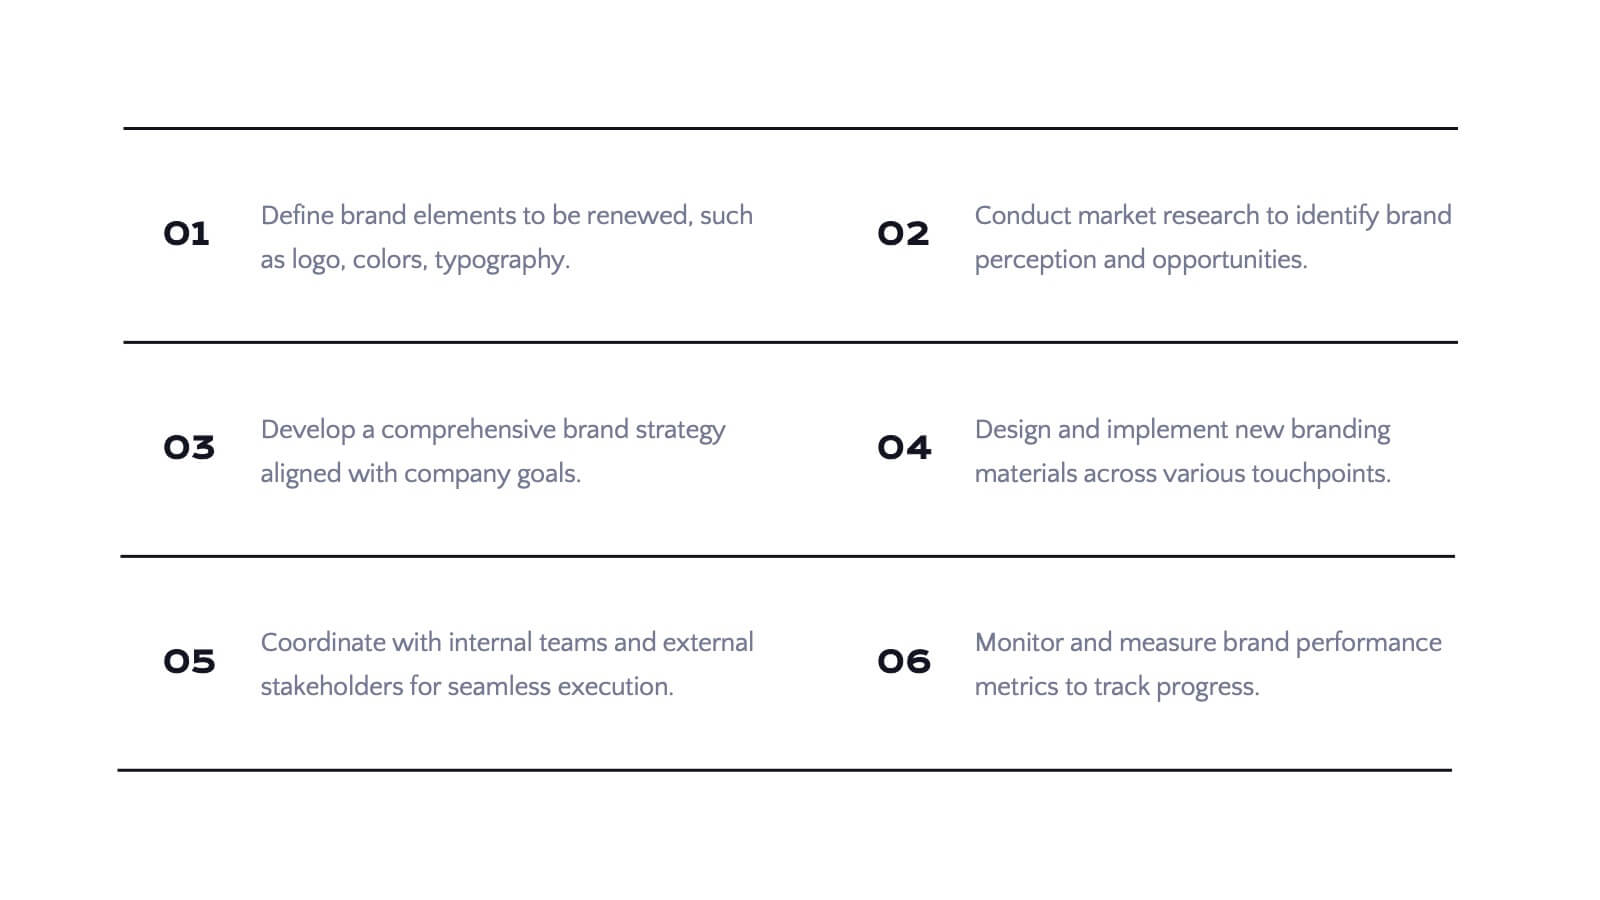
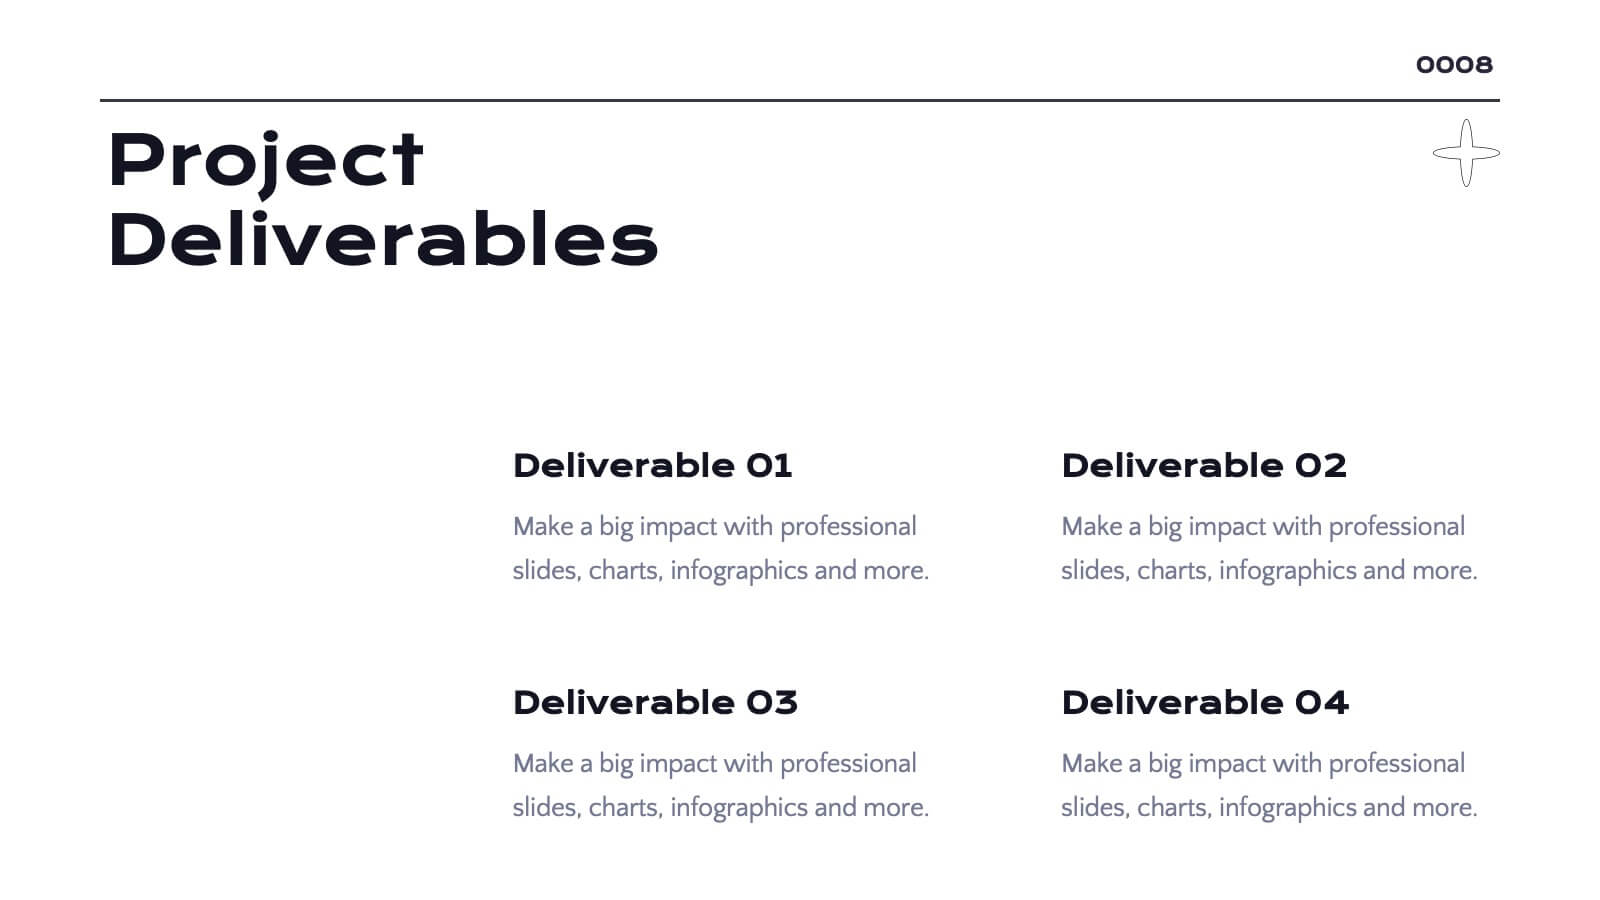
Lumen Marketing Proposal Presentation
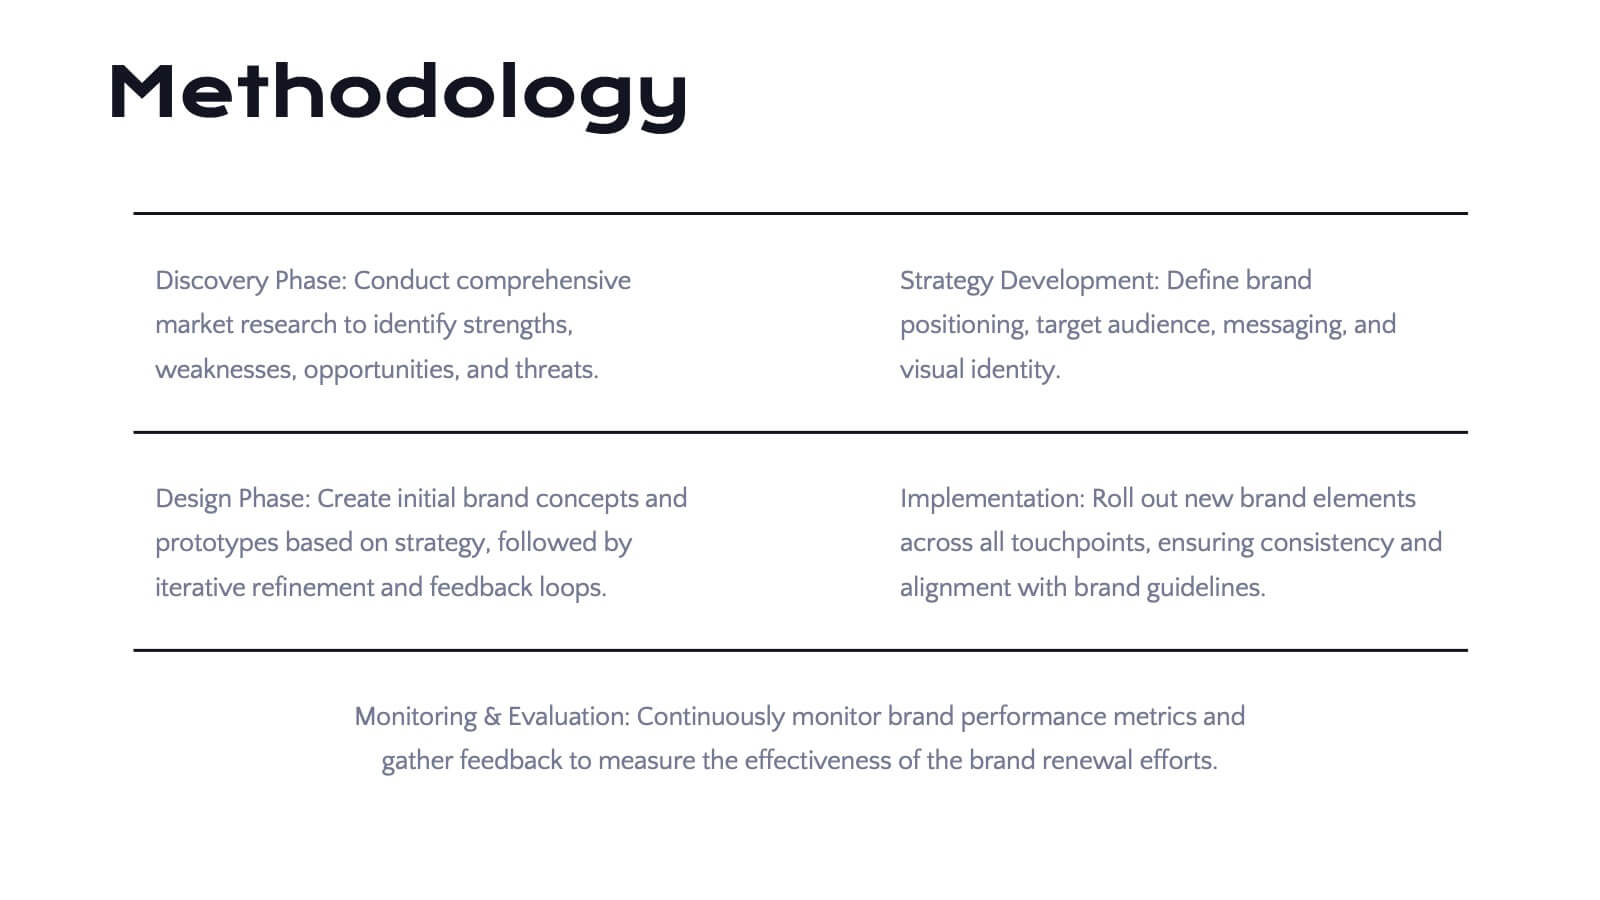
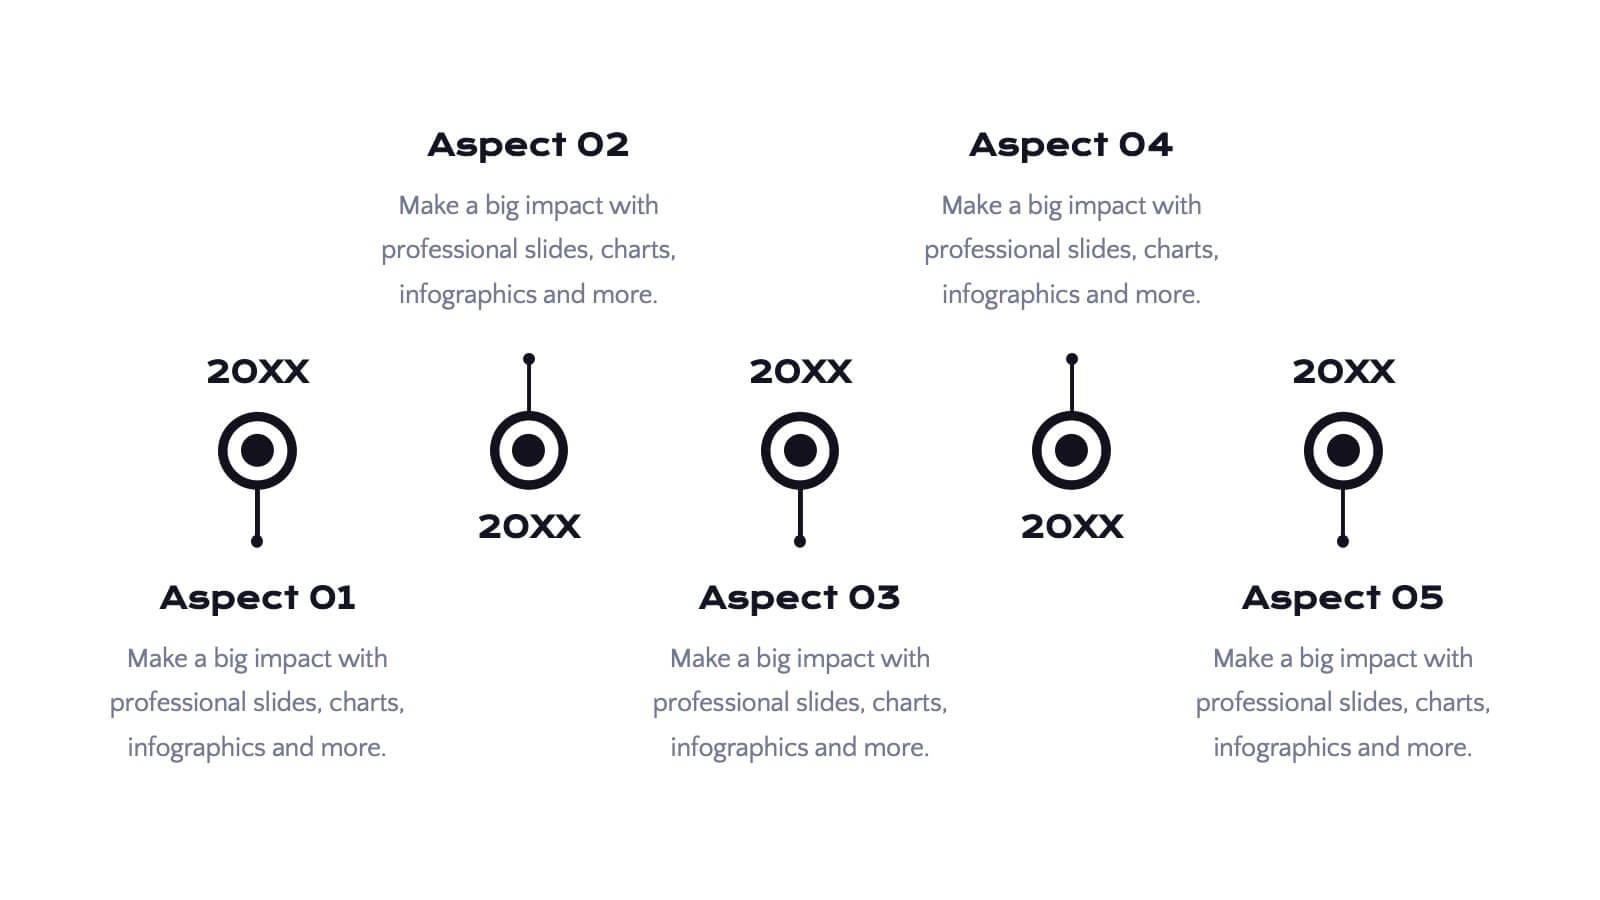
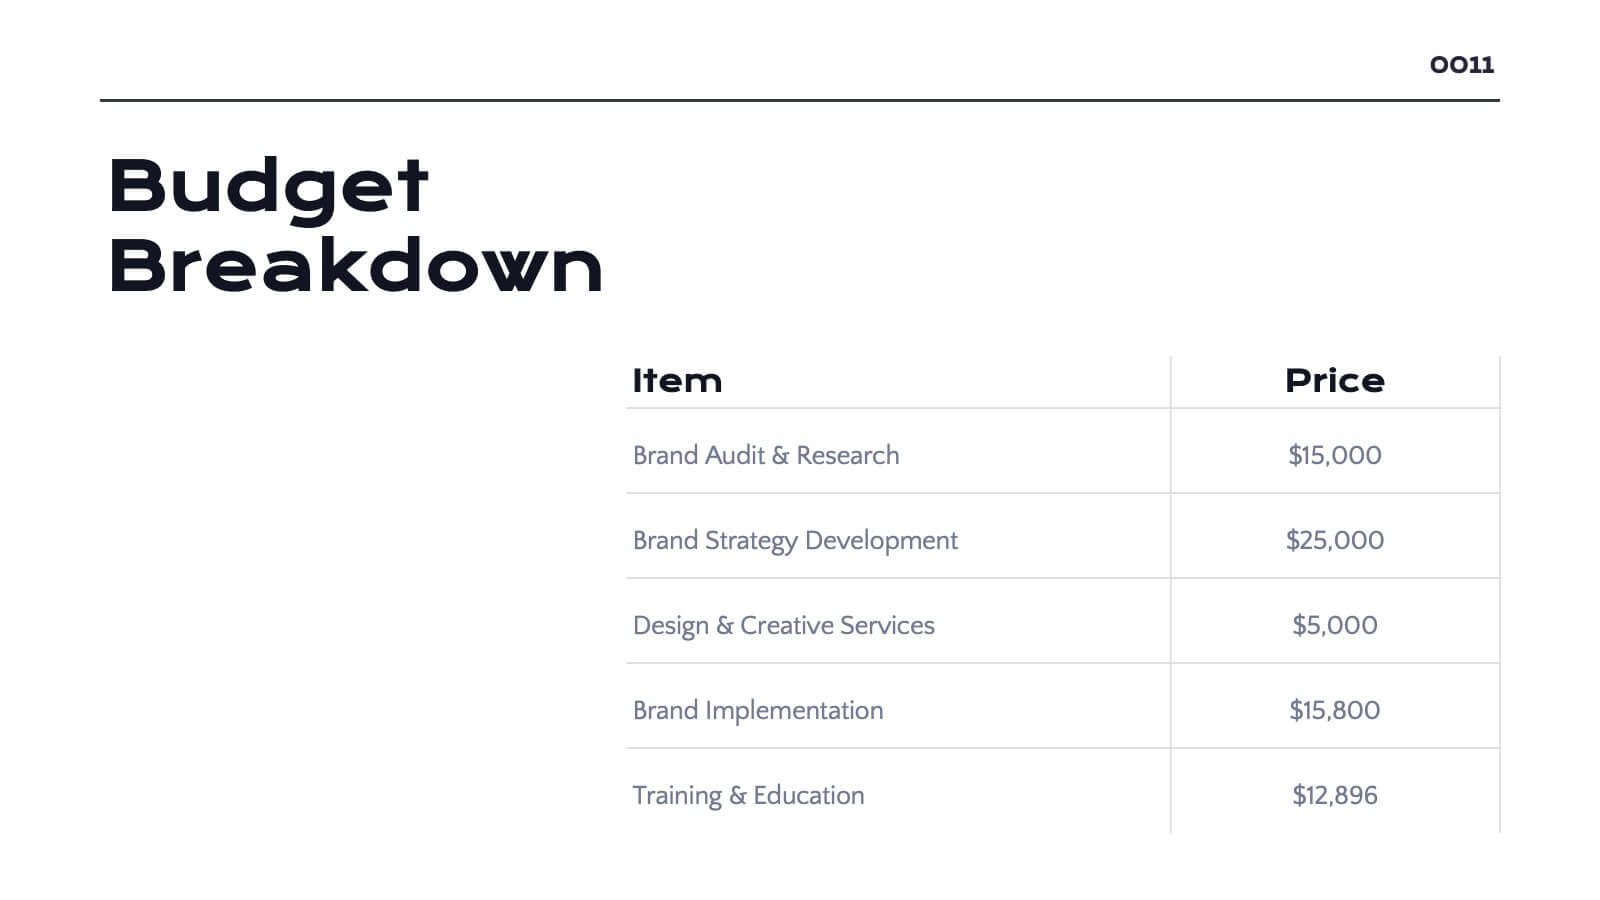
Pitch your marketing strategy effectively with this sleek and professional proposal presentation! Covering sections like project summary, proposed solutions, deliverables, and budget breakdowns, it ensures all your ideas are communicated clearly. Perfect for client pitches or internal strategy sessions, this template is fully compatible with PowerPoint, Keynote, and Google Slides.


7 slides
RACI Matrix Project Infographic
A RACI Matrix, sometimes referred to as a Responsibility Assignment Matrix, is a project management tool used to clarify and communicate the roles and responsibilities of team members in completing tasks and activities within a project. This is a visually captivating and informative template designed to demystify the complexities of project accountability. Navigate through the world of roles and responsibilities in a project setting with this dynamic and easily digestible visual aid. With this infographic your audience will journey toward effective project management and accountability with the RACI Matrix.


7 slides
Home Buyer Checklist Infographic
Step into your dream home with confidence using our Home Buyer Checklist Infographic Template. This visually engaging guide is meticulously designed to streamline the home-buying process, making it transparent and manageable for first-time buyers and seasoned investors alike. This template provides a comprehensive checklist that covers every important aspect of home buying, from budgeting and financing to inspecting and closing. Its intuitive layout and vibrant design elements make complex tasks approachable and easy to understand, ensuring you don’t miss a beat on your journey to homeownership. Tailor each slide to your specific needs by customizing colors, text, and graphics to reflect your personal style or brand identity. Ideal for real estate agents, mortgage advisors, and educational workshops, this template empowers users to navigate the maze of real estate transactions with ease and assurance.


2 slides
Weekly Agenda Presentation
Keep your week running smoothly with a clean, organized layout that highlights priorities, tasks, and key reminders at a glance. This presentation makes planning effortless, helping teams stay aligned and focused throughout the week. Ideal for meetings, schedules, and productivity workflows. Fully compatible with PowerPoint, Keynote, and Google Slides.

21 slides
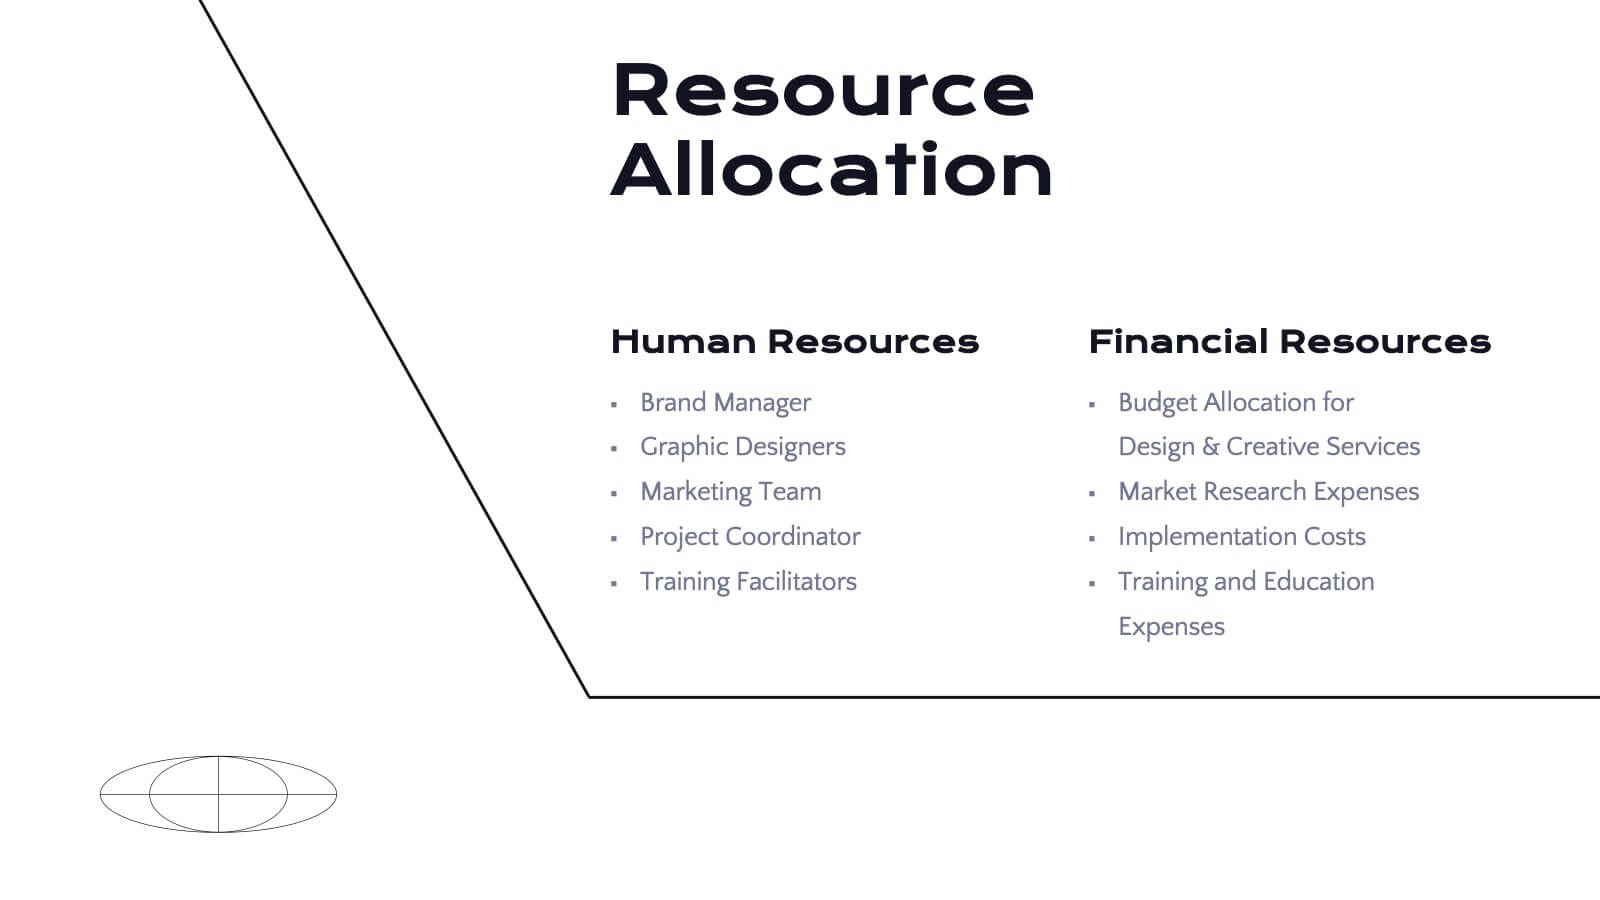
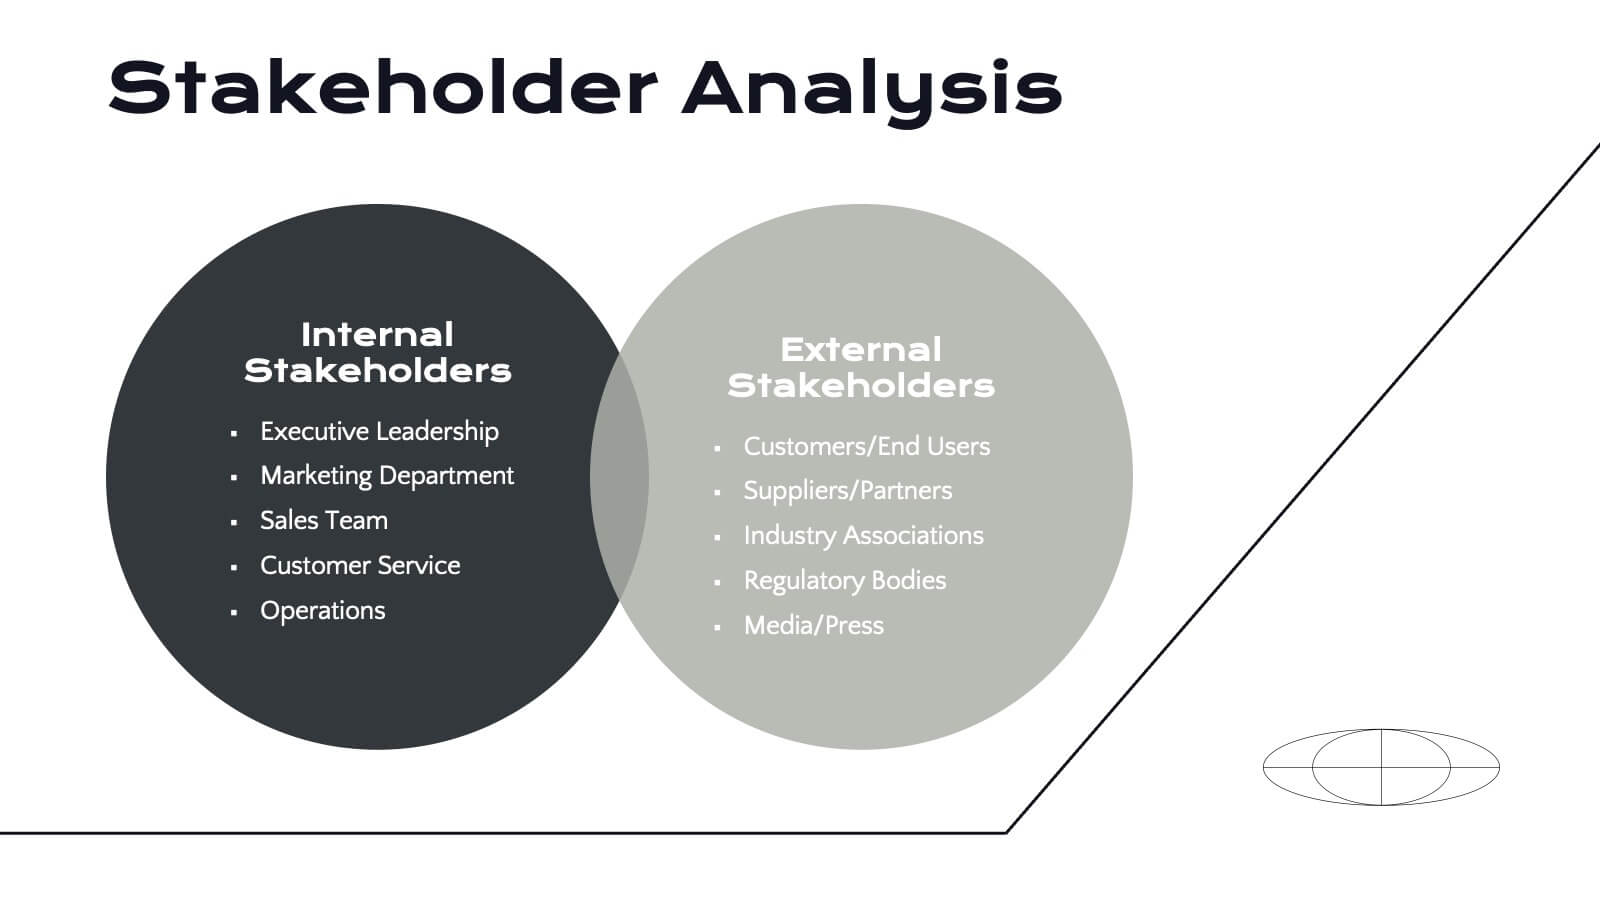
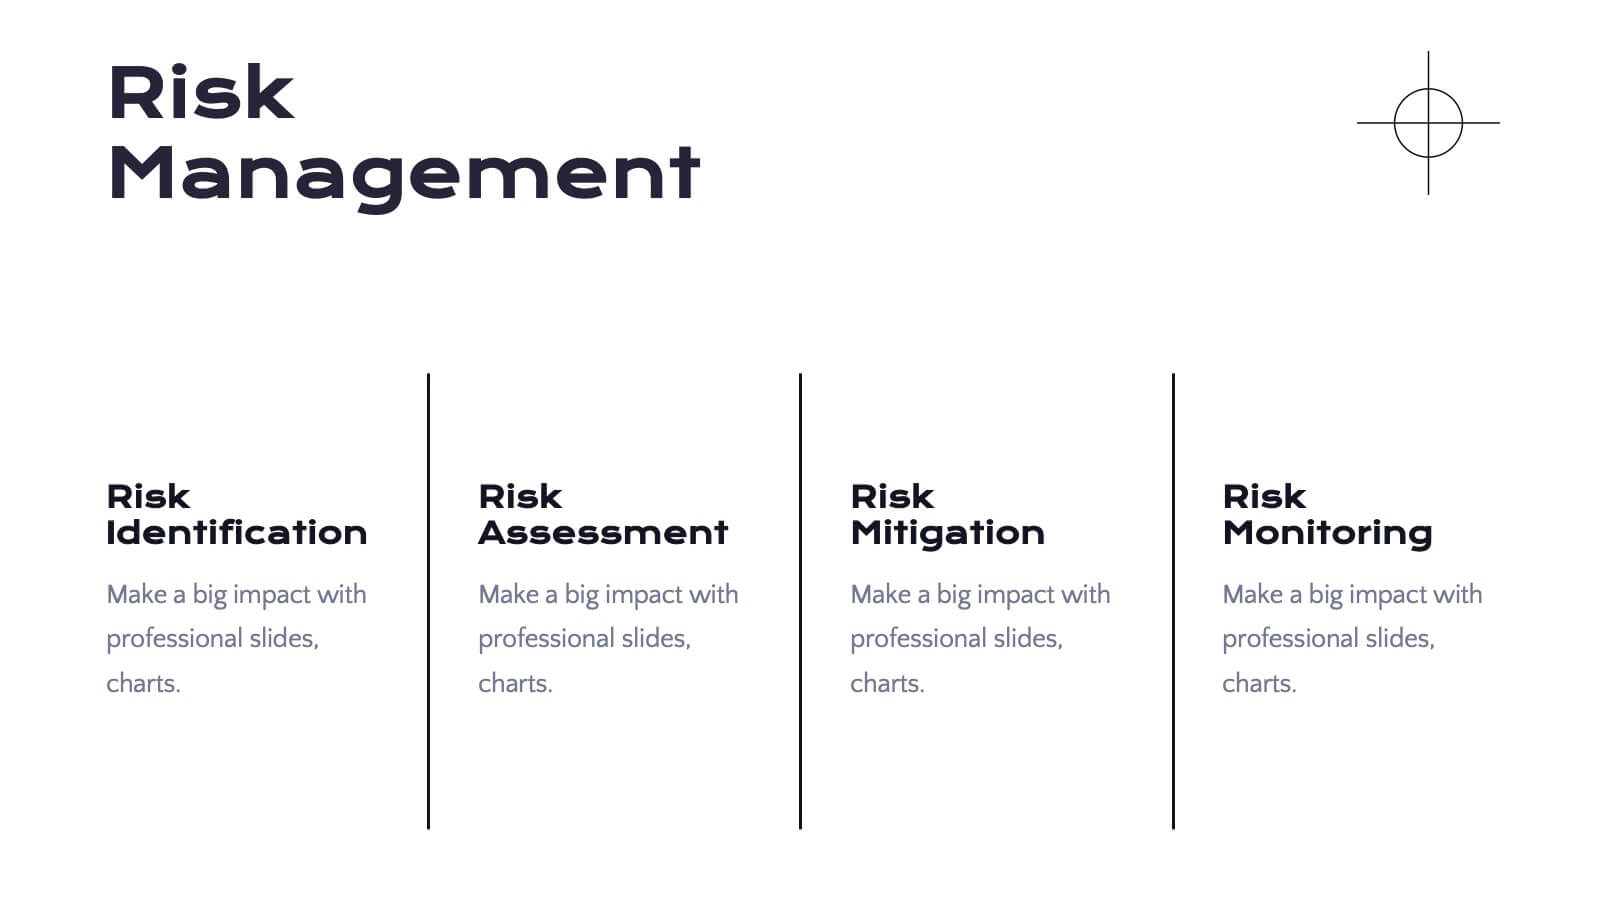
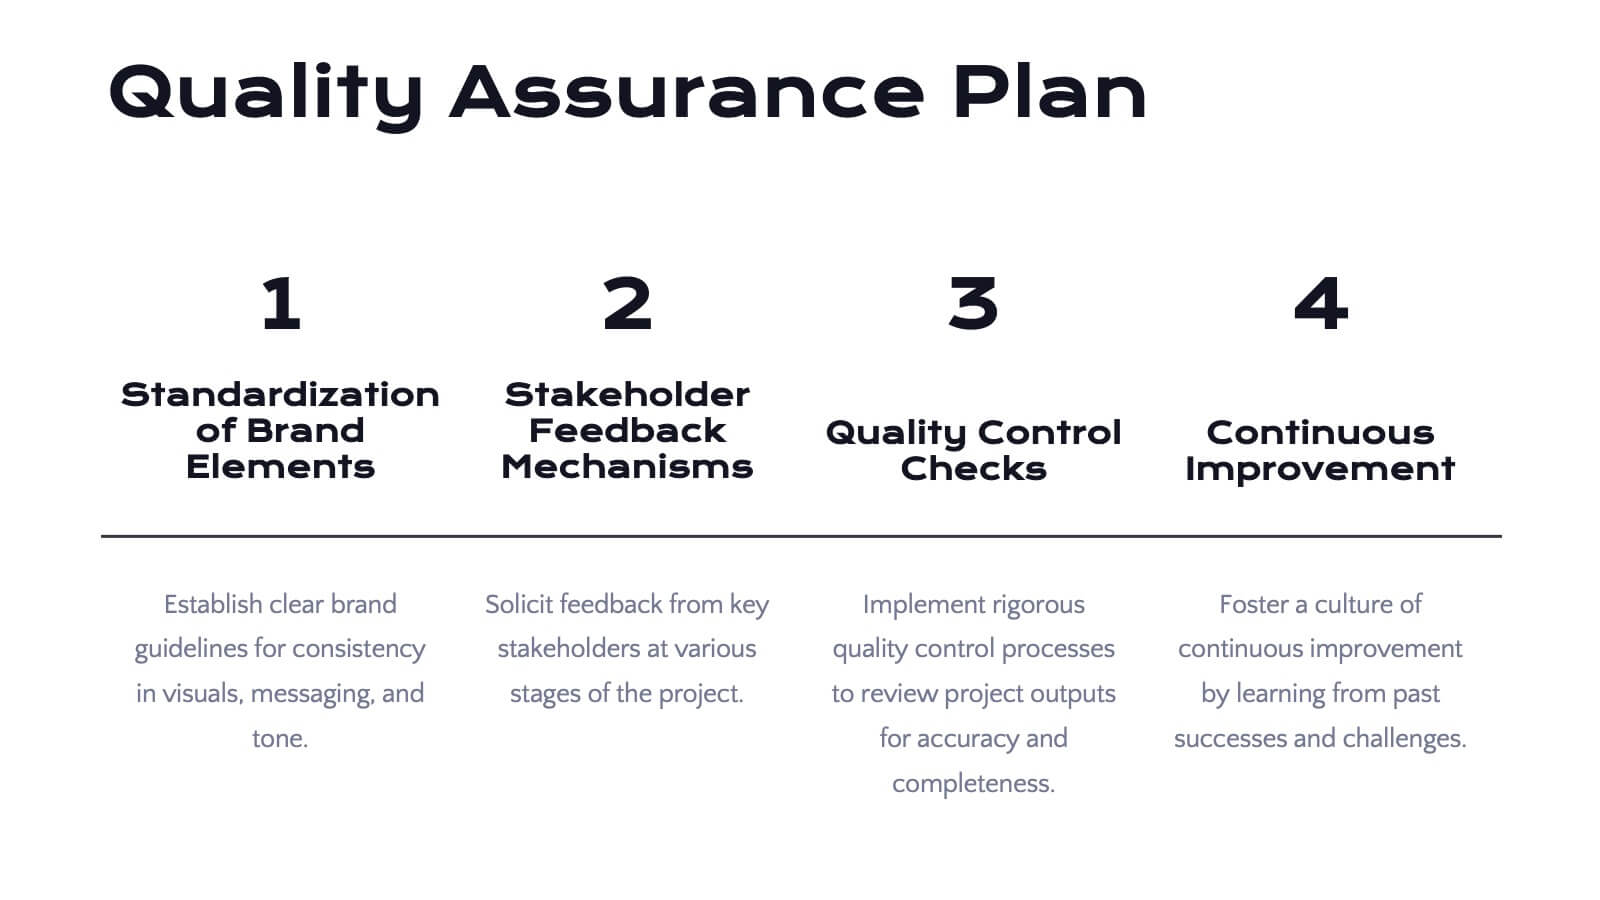
Radiance Detailed Project Execution Plan Presentation
Elevate your project execution presentations with this sleek template, covering everything from objectives to timelines and budget breakdowns. It's perfect for aligning your team and stakeholders. Compatible with PowerPoint, Keynote, and Google Slides, it ensures professionalism and clarity in showcasing your project plans.


4 slides
Strategic Idea Pitch Presentation
Present your strategic ideas with clarity using this structured Strategic Idea Pitch template. Designed for business professionals and entrepreneurs, it simplifies complex ideas with a visual roadmap. Fully customizable and compatible with PowerPoint, Keynote, and Google Slides, it ensures a polished, persuasive presentation for pitching strategies and innovations effectively.