


Features
- 5 Unique slides
- Fully editable and easy to edit in Microsoft Powerpoint, Keynote and Google Slides
- 16:9 widescreen layout
- Clean and professional designs
- Export to JPG, PDF or send by email


Do you have any questions?
Recommend


12 slides
Customer Support Common Questions Presentation
Enhance customer support efficiency with this modern and structured presentation slide. Featuring a head silhouette with question marks, this template effectively represents customer inquiries and problem-solving processes. Perfect for help desk teams, customer service training, and support workflow presentations, it is fully editable, allowing you to customize text, colors, and layout for a tailored experience. Compatible with PowerPoint, Keynote, and Google Slides for seamless integration.


7 slides
Finance Infographic Presentation Template
Finance is a field that deals with the study of investments and the management of money. Finance Infographics are visual representations of financial information, data, and concepts. This template uses charts, graphs, diagrams, and illustrations to help explain complex financial information in a simple and easy-to-understand way. This Finance Infographic can cover a range of topics including budgeting, investments, expenses, and market analysis, among others. This is the perfect template to use for businesses, financial organizations, and educators to help people understand financial concepts.


5 slides
Eco-Friendly Practices Summary Presentation
Bring your green initiatives to life with a vibrant, city-inspired visual that makes sustainability easy to explain and engaging to explore. This presentation helps you outline key eco-friendly efforts, goals, and results in a clean, modern layout. Fully customizable and compatible with PowerPoint, Keynote, and Google Slides.


6 slides
Creative 3D Elements Slide
Add visual depth and structure to your ideas with this unique 3D cube environment. Ideal for breaking down five components or phases, this layout helps your content stand out while maintaining a professional, modern aesthetic. Compatible with PowerPoint, Keynote, and Google Slides.
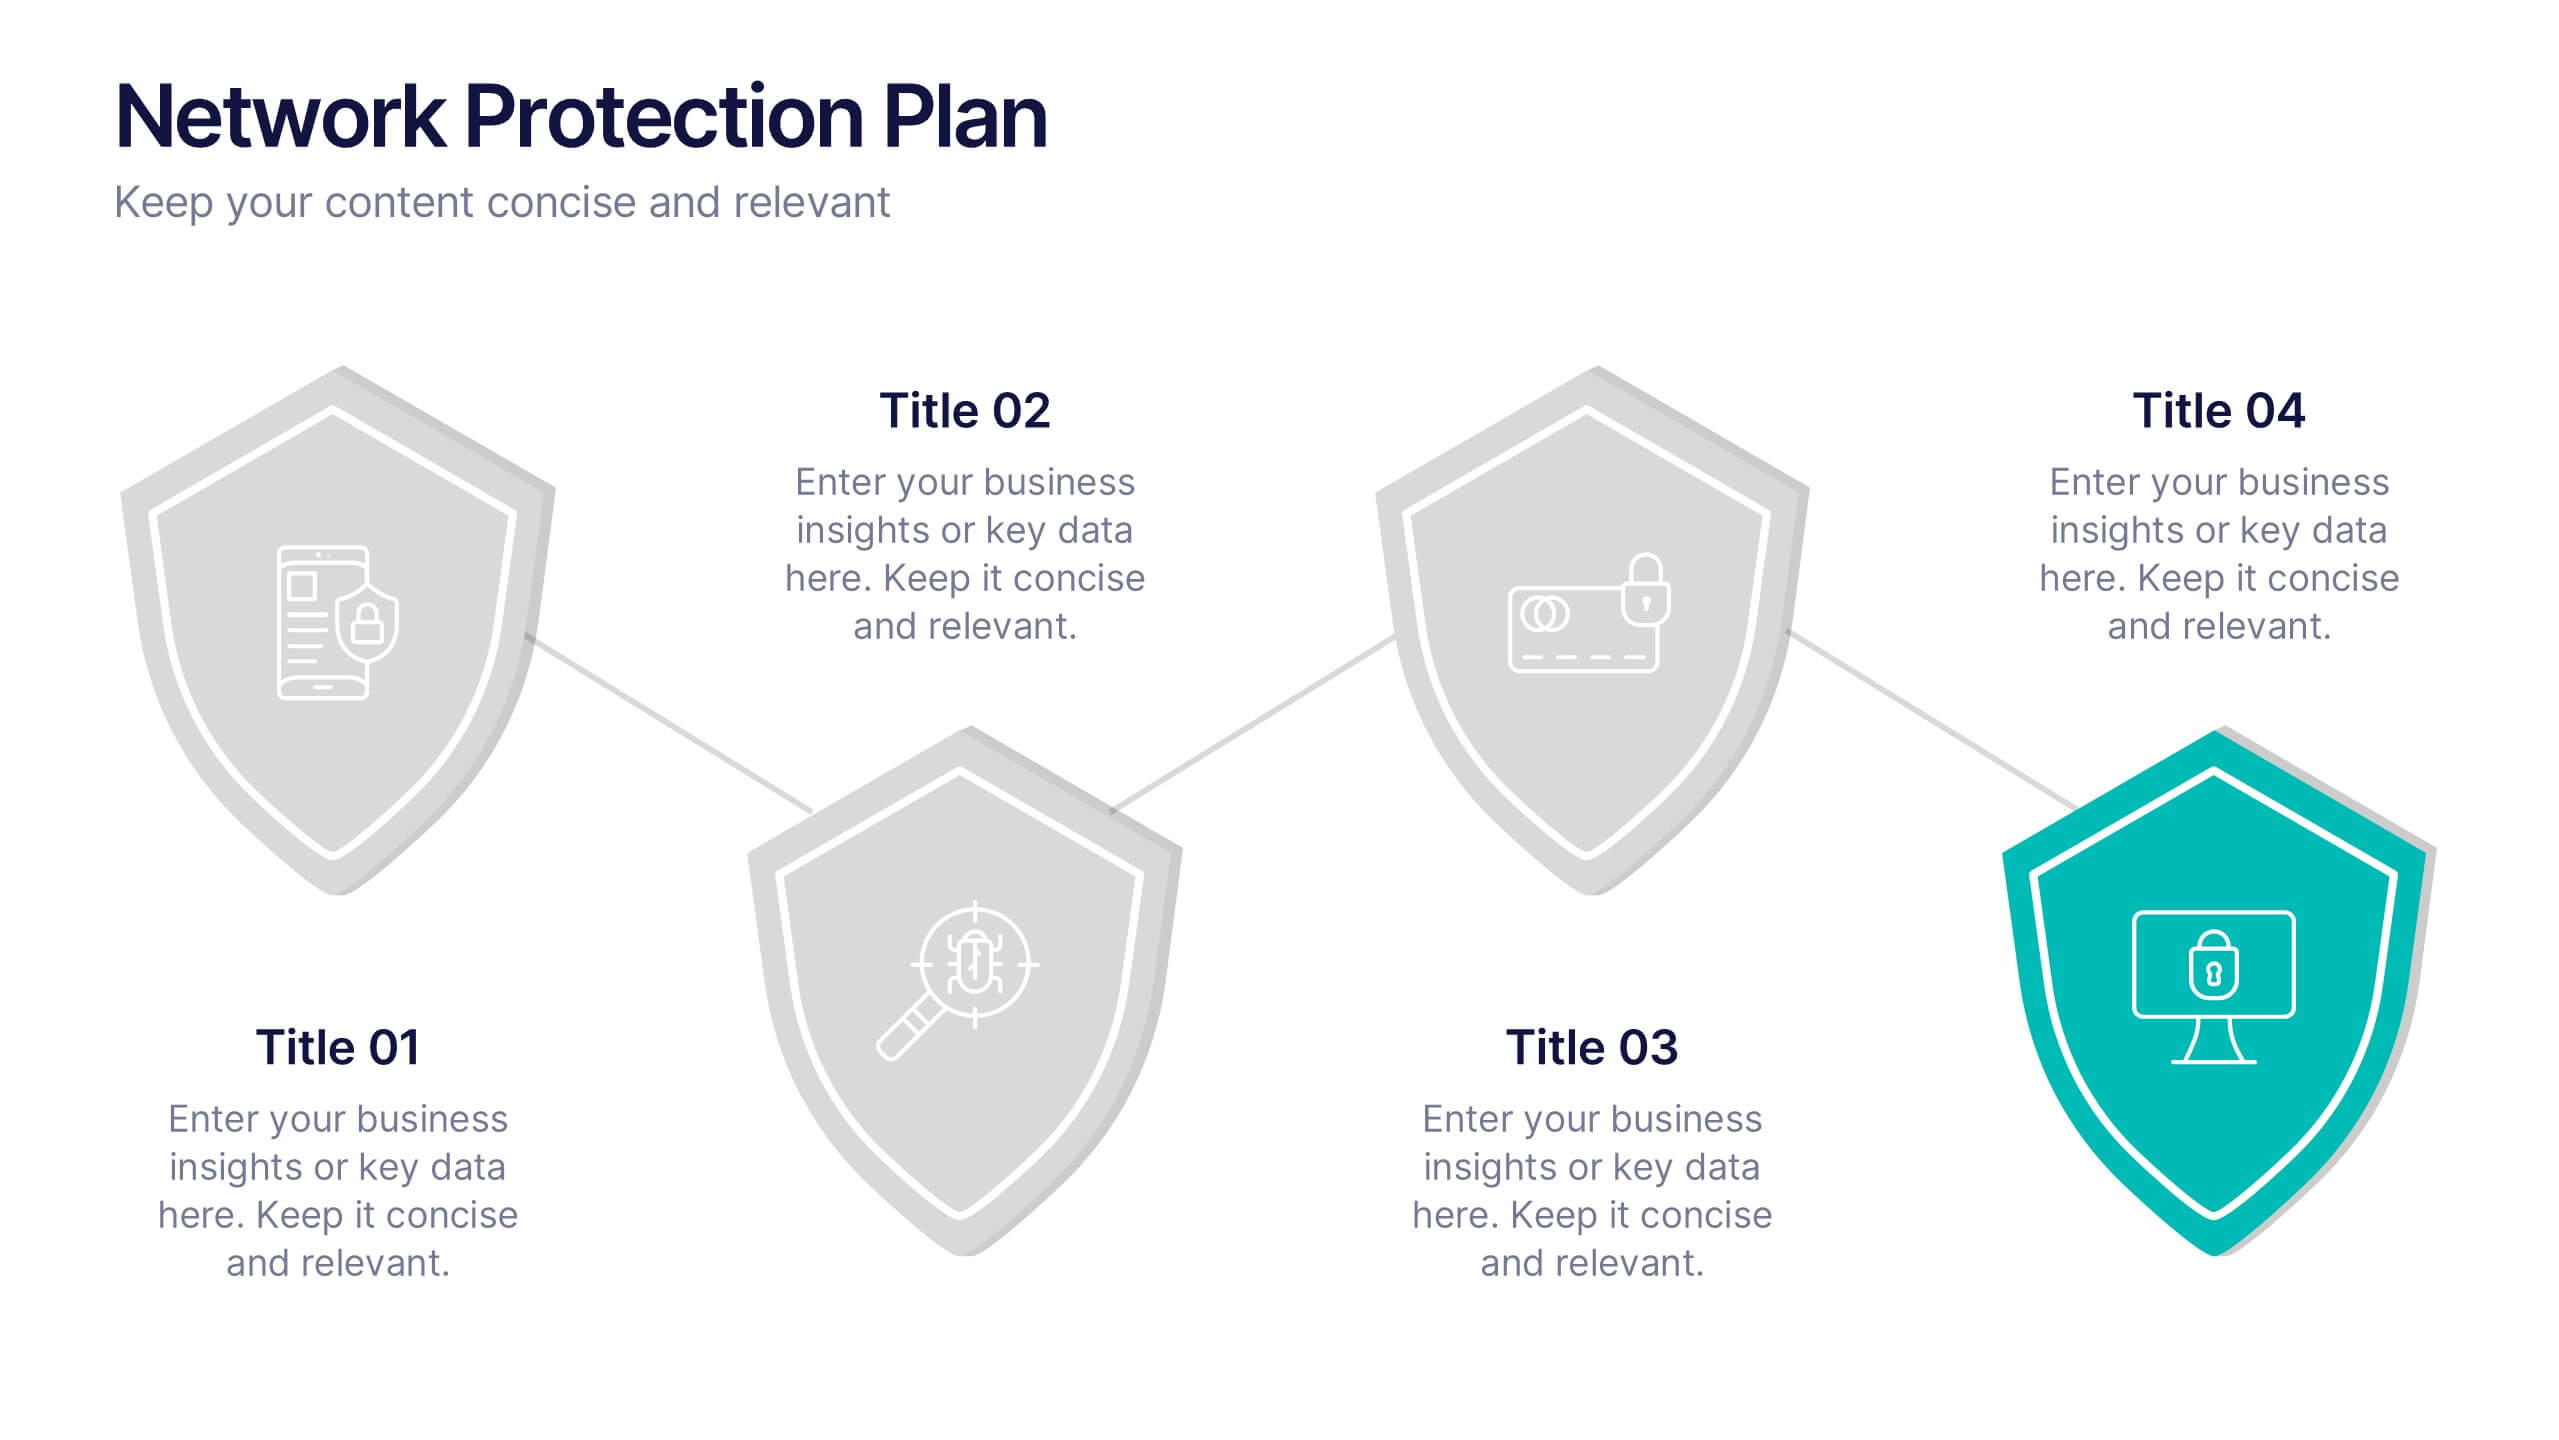
5 slides
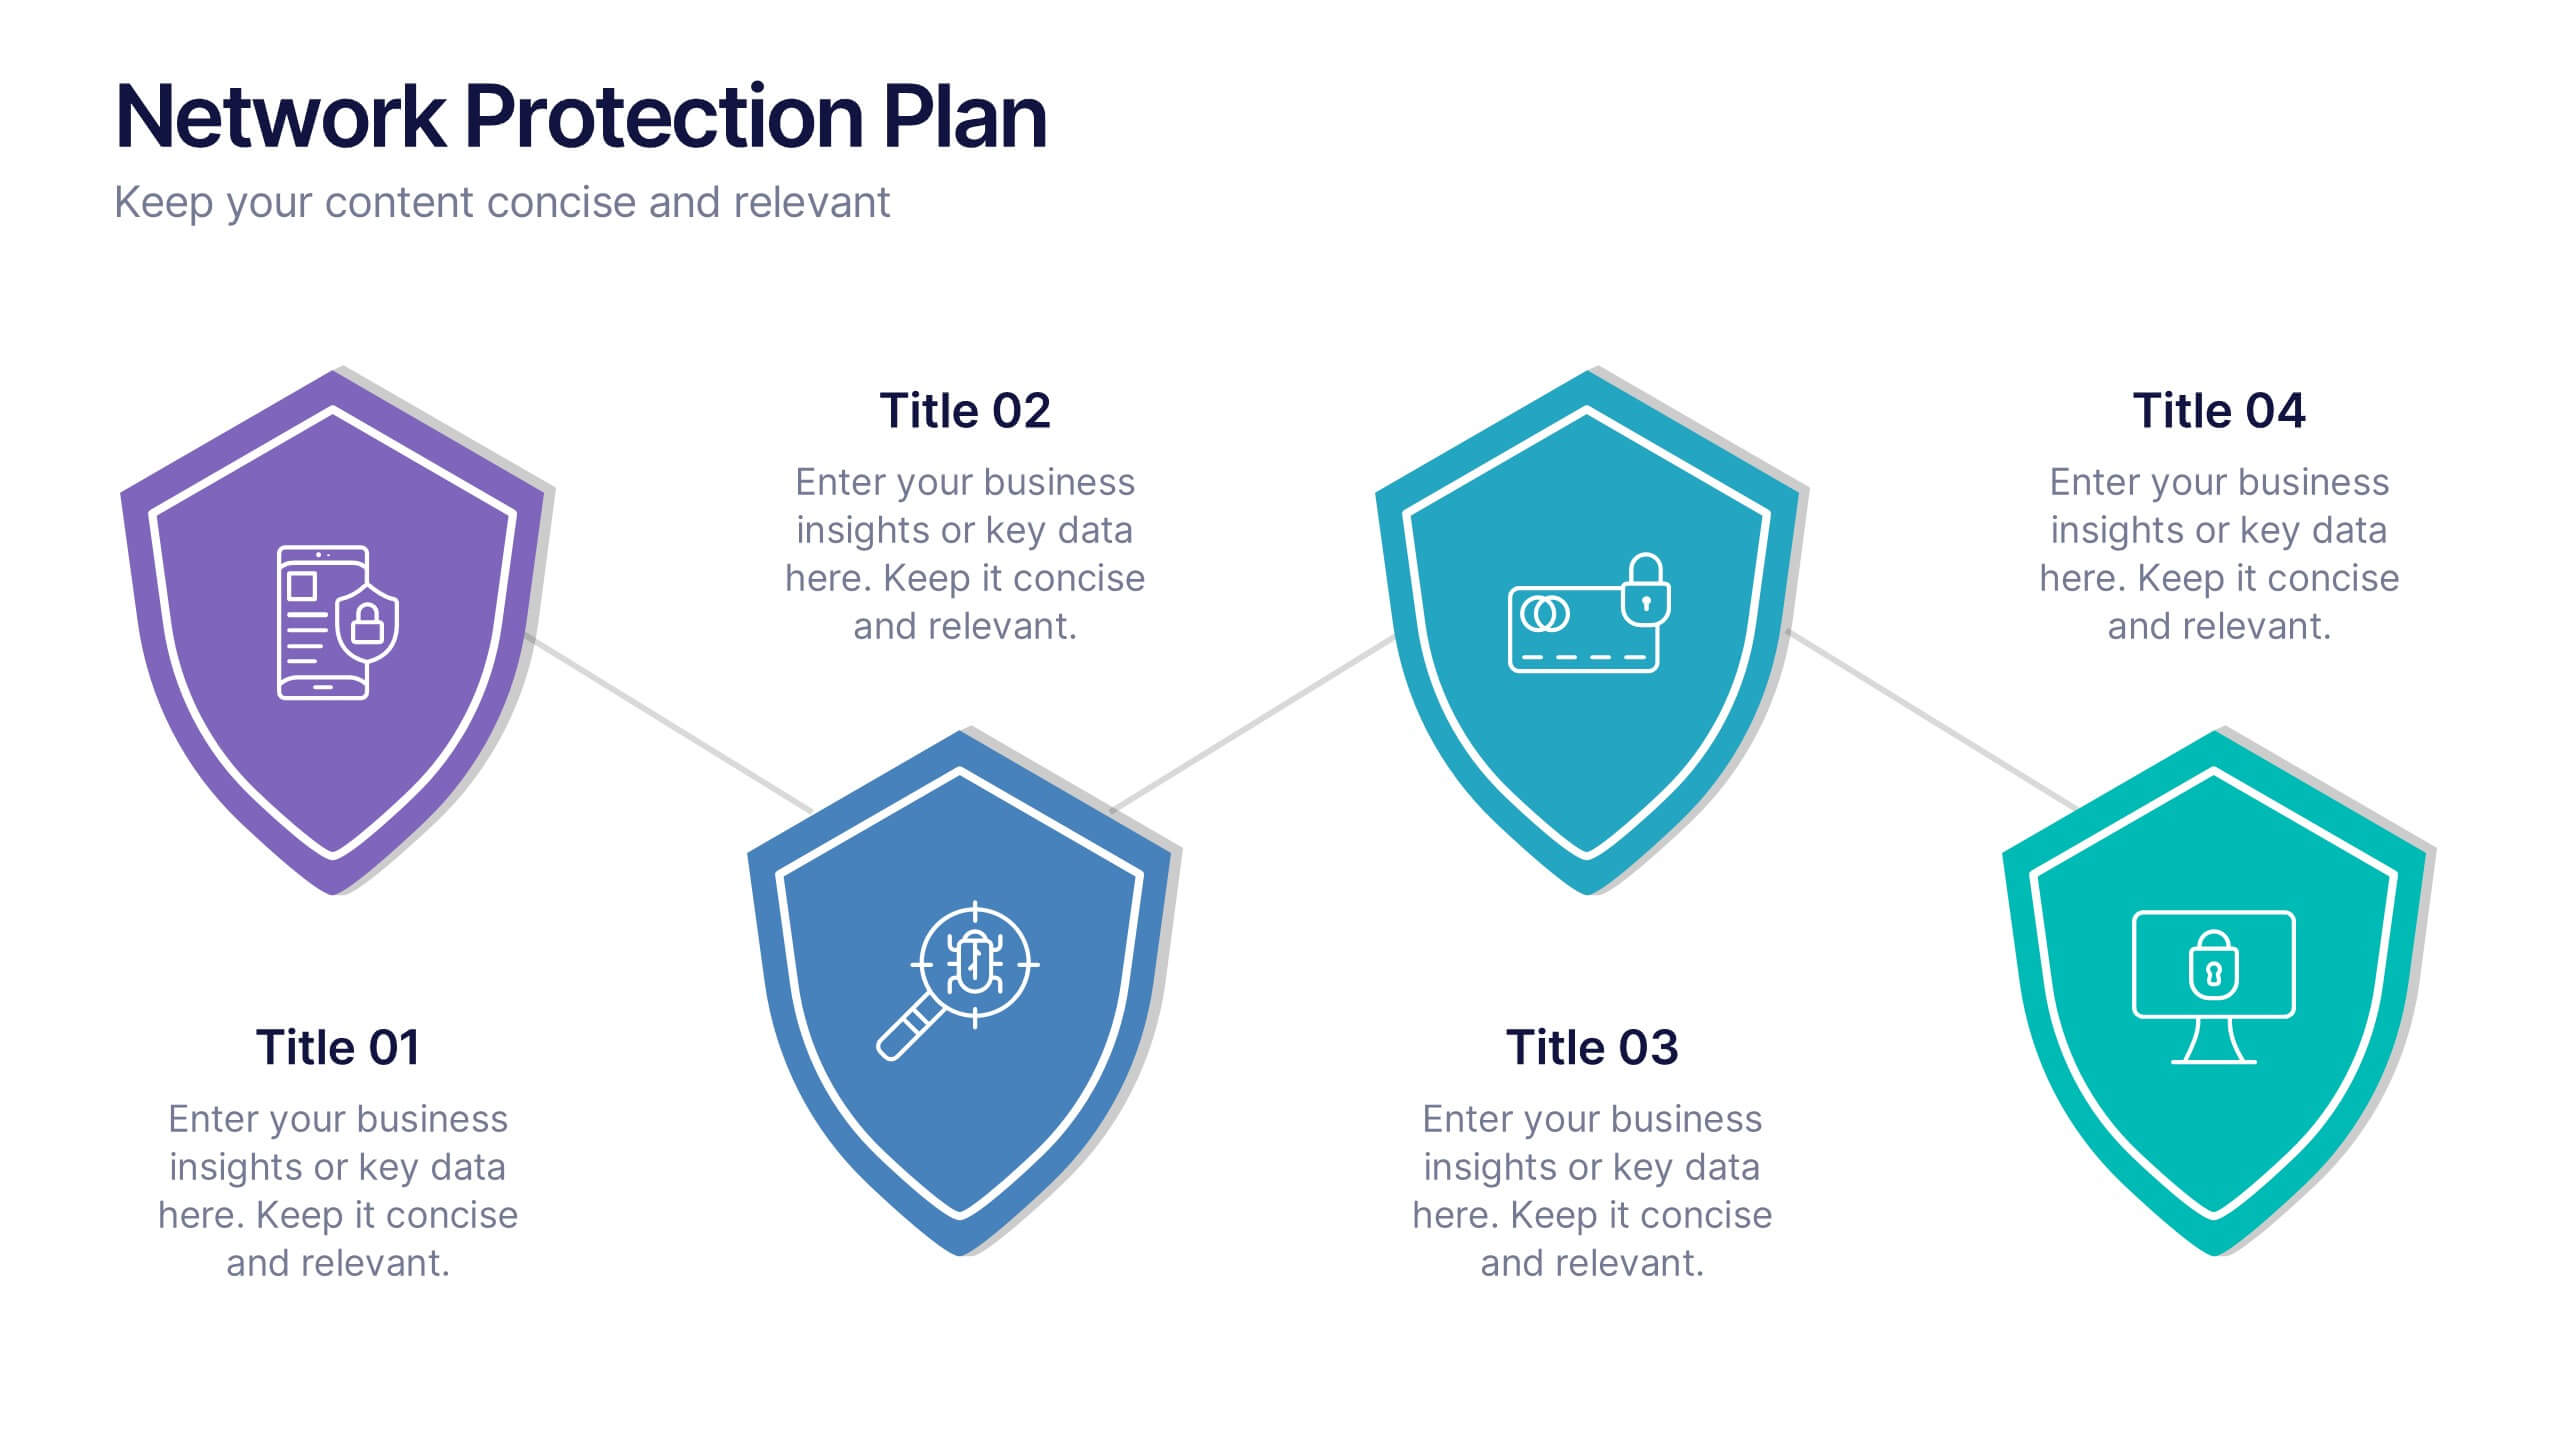
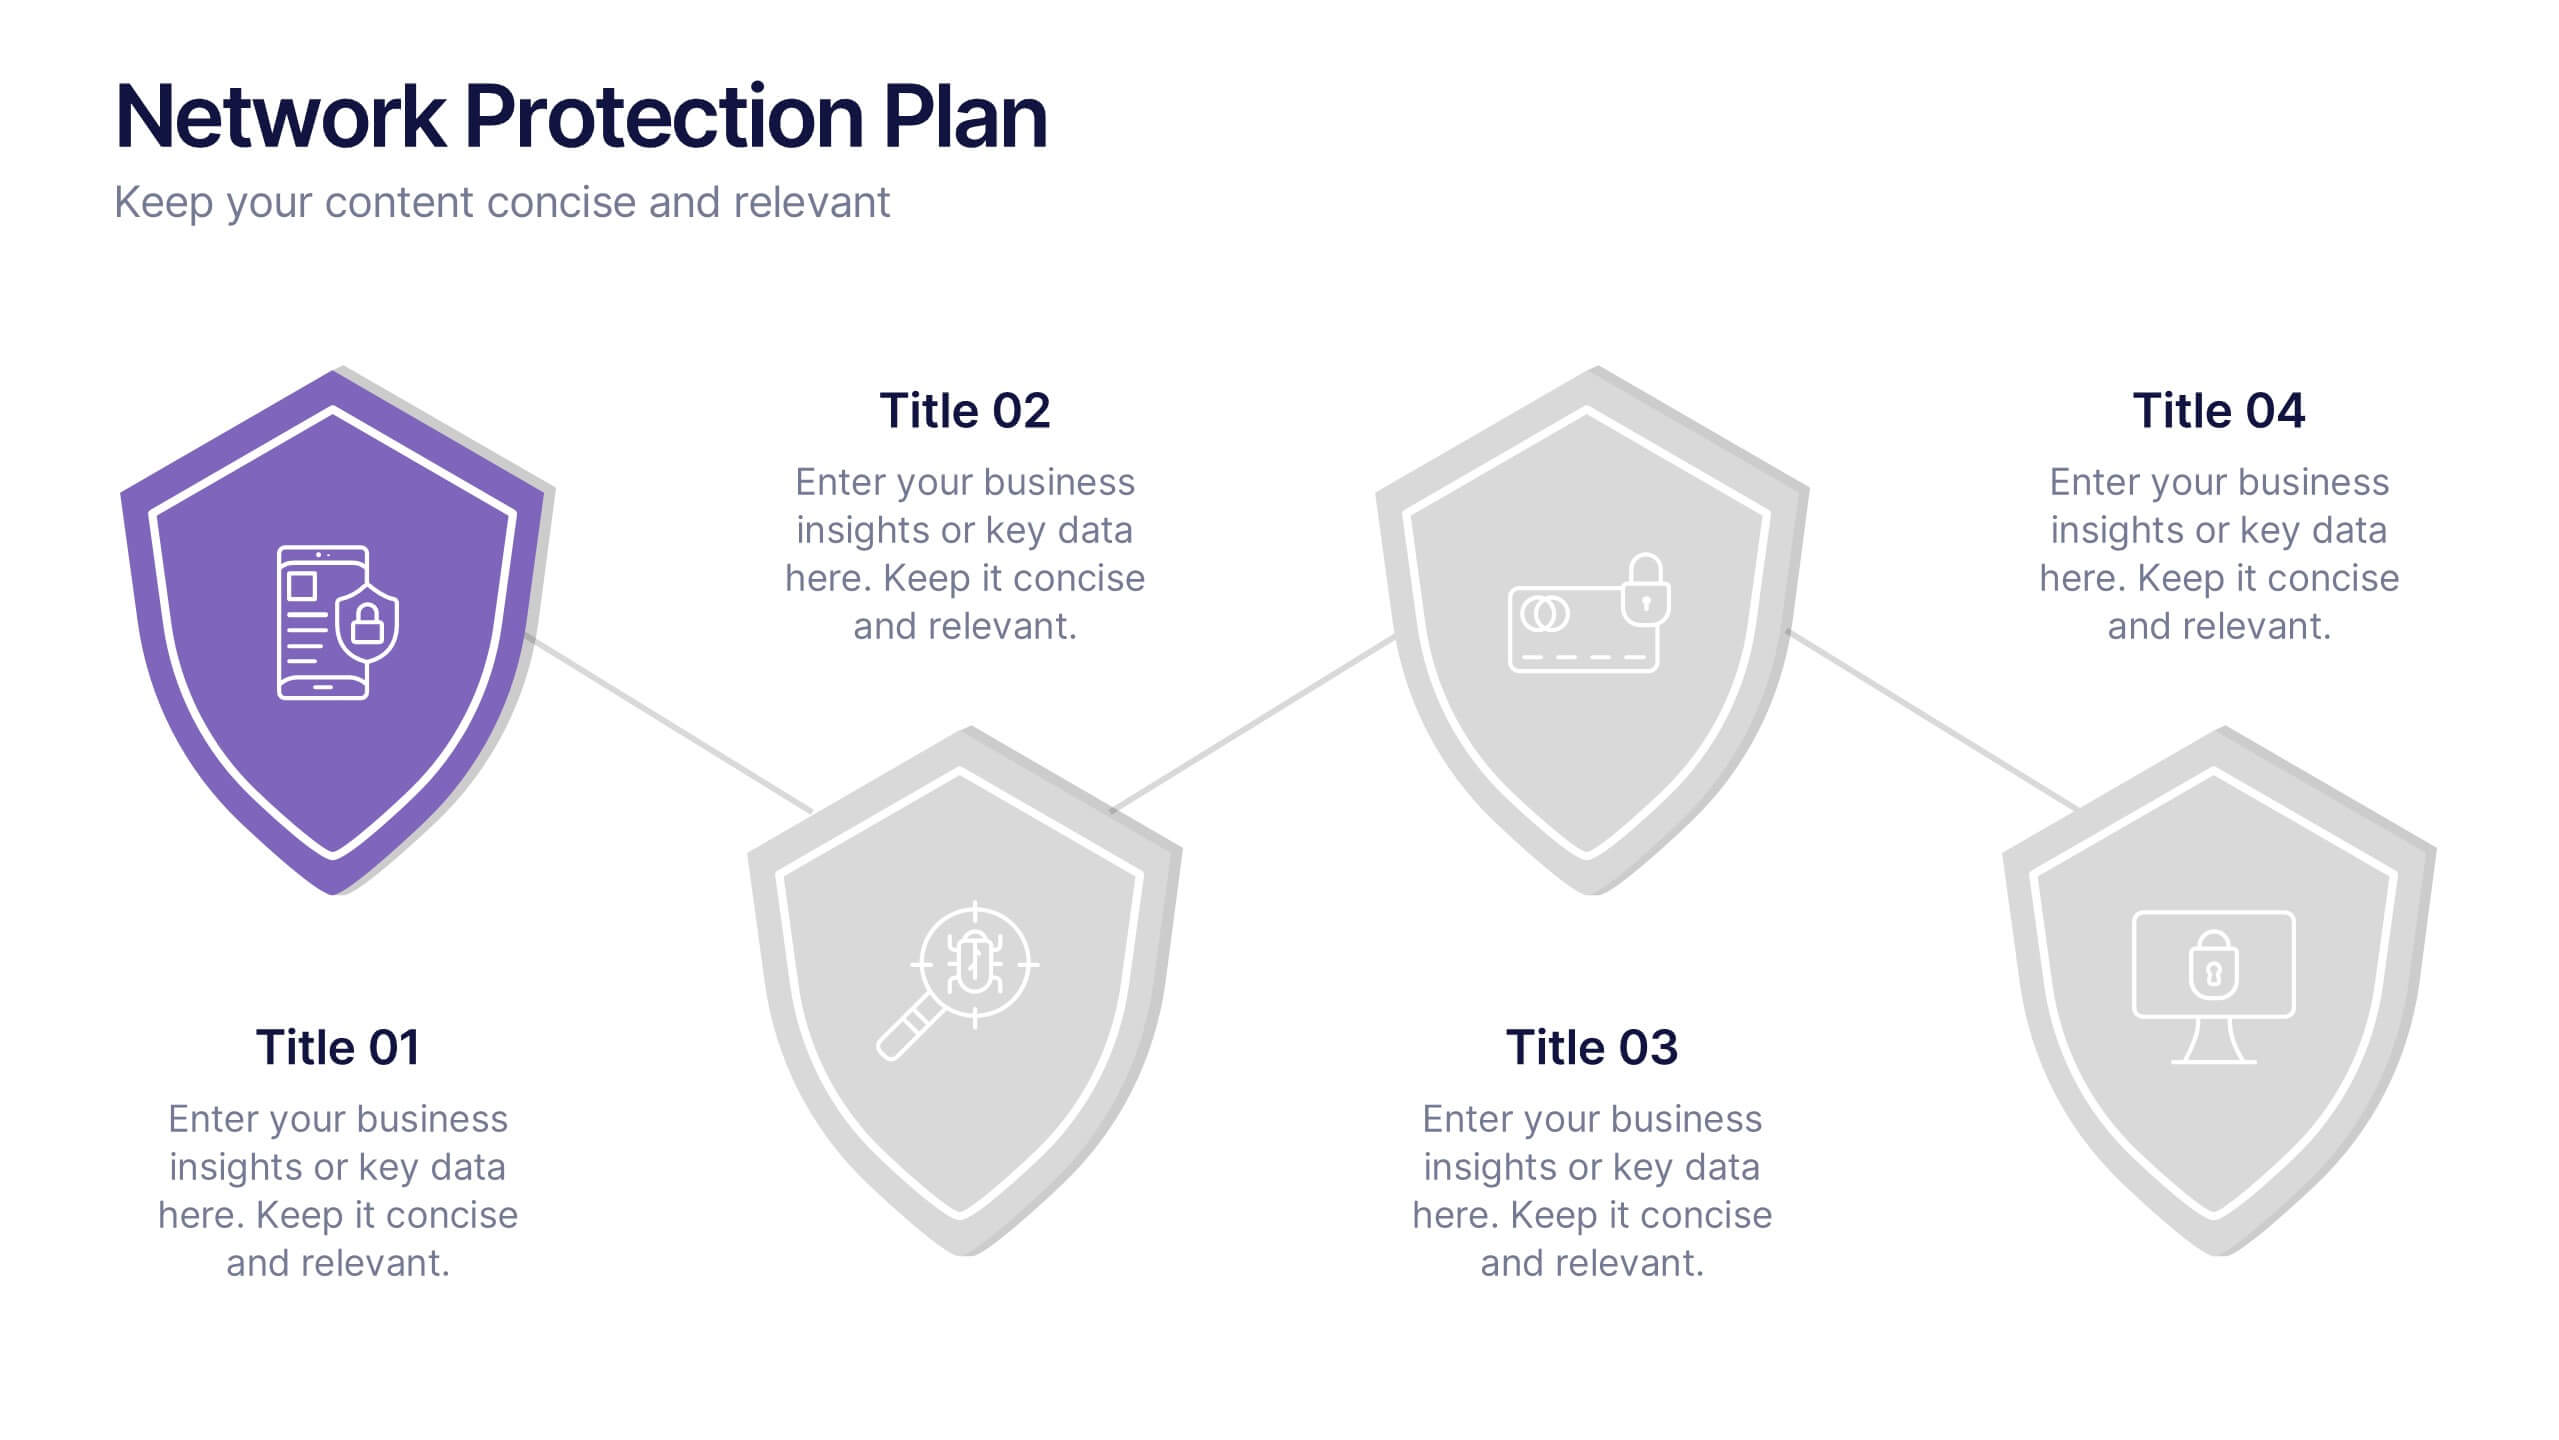
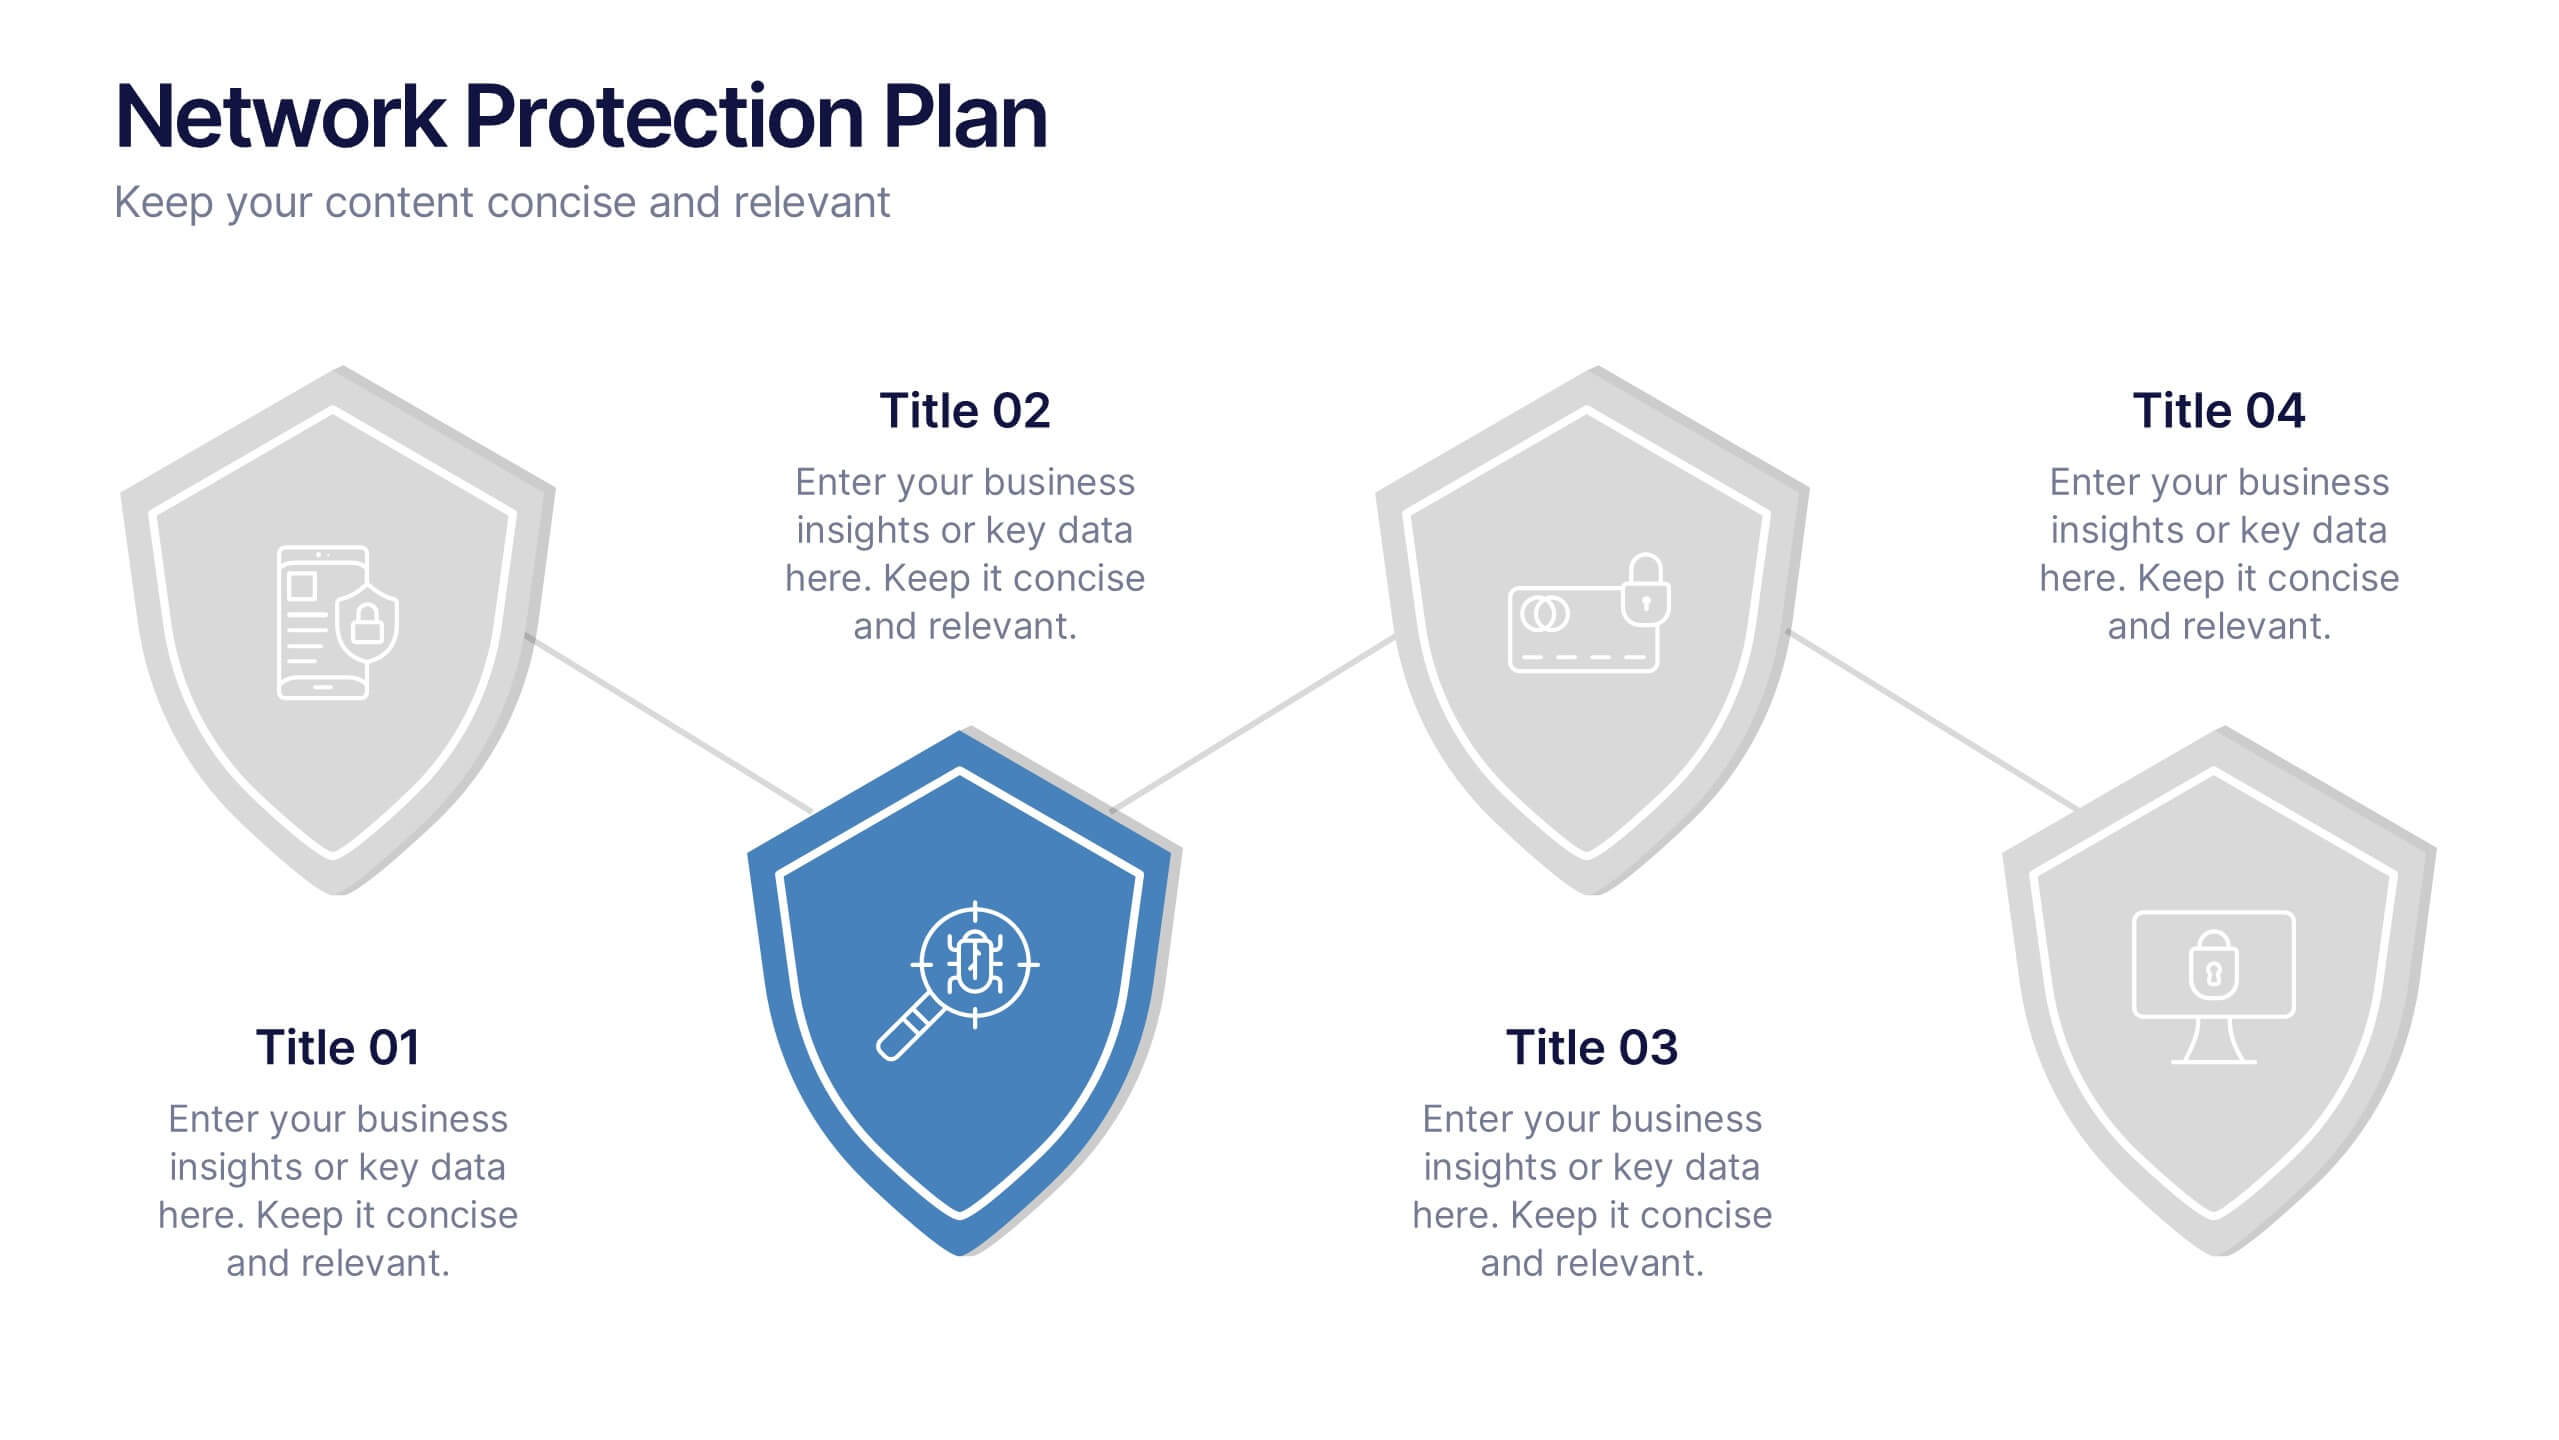
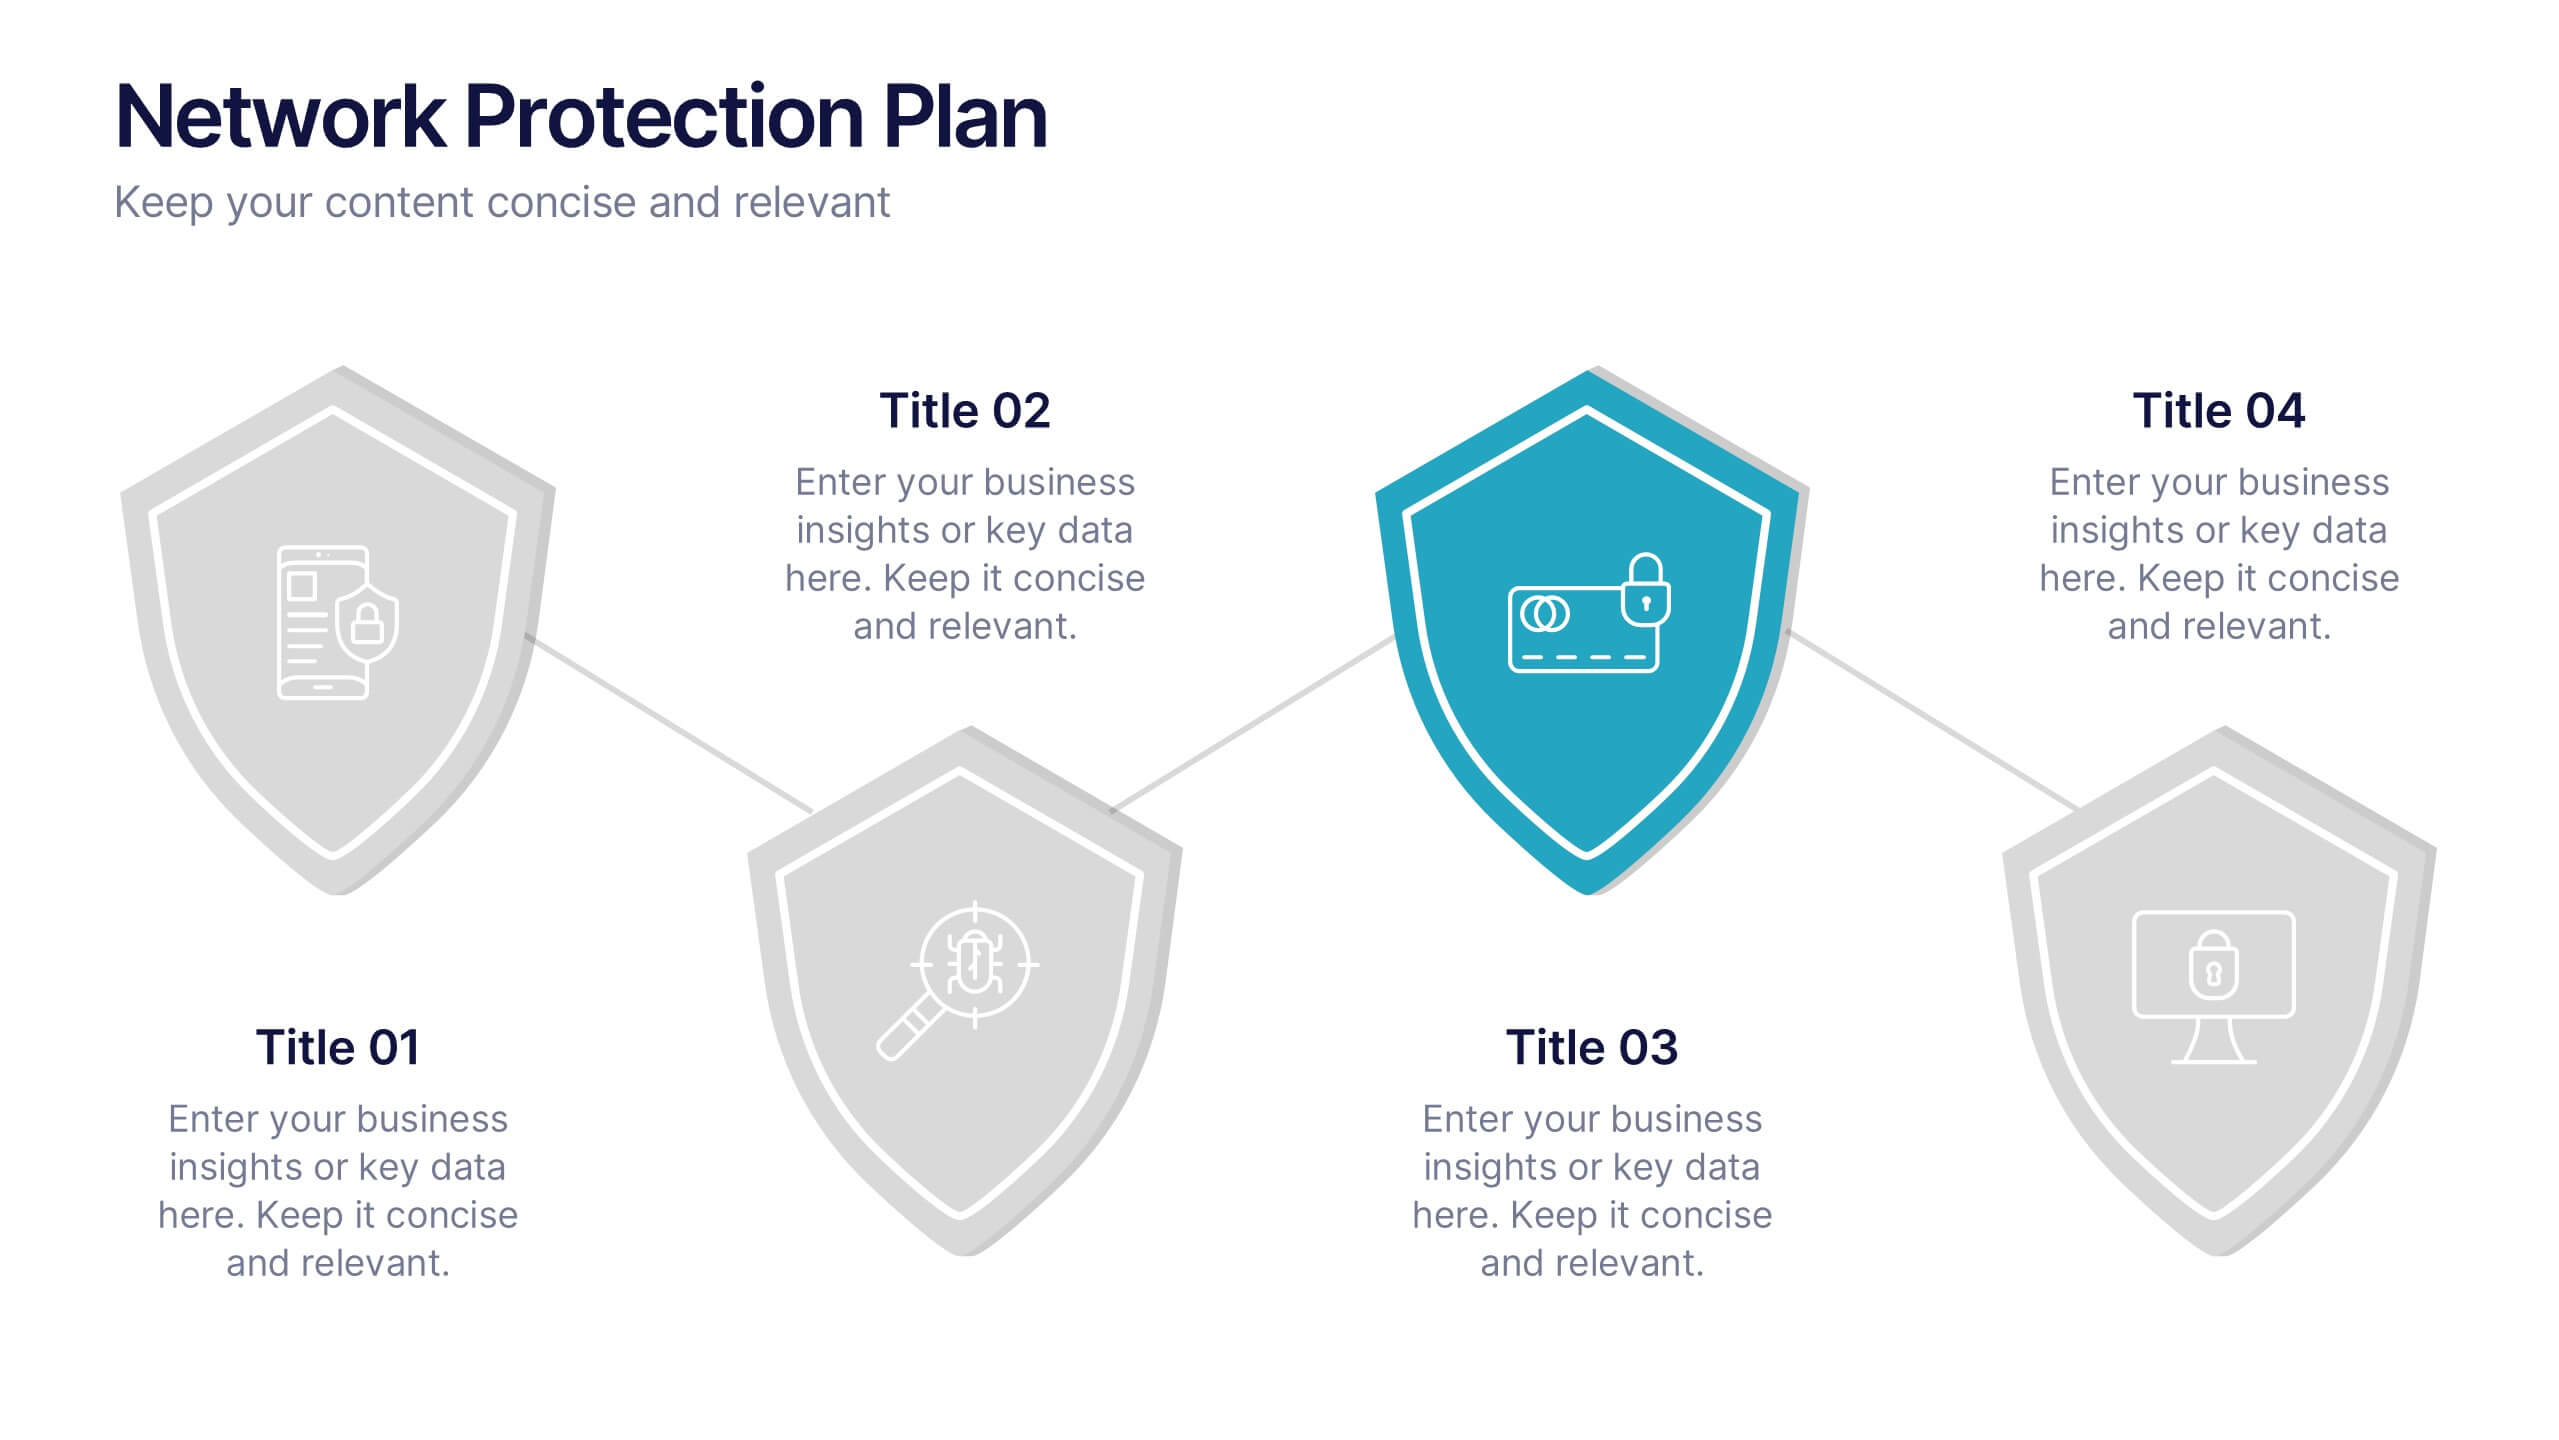
Network Protection Plan Presentation
Bold visuals and clean structure make this presentation a powerful way to communicate your protection strategy with clarity and confidence. It helps you break down key security stages, outline responsibilities, and show how each layer strengthens overall network resilience. Fully compatible with PowerPoint, Keynote, and Google Slides.


5 slides
Business Comparison Infographics
Elevate your business presentations with our business comparison infographics, the perfect tool for showcasing competitive analysis. In a striking array of orange and red tones, these infographics are designed to command attention. Entrepreneurs, business analysts, and students of business studies can leverage this template. Compatible with Powerpoint, Keynote, and Google Slides. Its creative style integrates compelling graphics and icons, simplifying complex data into digestible, engaging visuals. Ideal for meetings, or educational content, these infographics offer a clear, comparative insight, empowering informed business decisions.


6 slides
Presentation Roadmap Agenda Outline
Plan your sessions with clarity using the Presentation Roadmap Agenda Outline Presentation. This sleek visual tracks five key points along a timeline, using numbered markers and matching text areas—perfect for agendas, project stages, or presentation flows. Fully customizable in PowerPoint, Keynote, and Google Slides.


4 slides
SEO Keyword Planning and Ranking Goals Presentation
Stand out in the crowded digital space with bold visuals that simplify complex strategies! This infographic presentation helps you break down SEO keyword planning and ranking goals into clear, layered steps using a funnel format that’s intuitive and professional. Perfect for SEO agencies, marketers, and digital strategists aiming to communicate data-driven insights effectively. Compatible with PowerPoint, Keynote, and Google Slides.


6 slides
Business Flow Chart Design Presentation
Bring clarity and momentum to your process with a clean, visual layout that turns complex steps into an easy-to-follow flow. This presentation helps teams map stages, responsibilities, and progress with confidence, making it perfect for planning, strategy, and operations. Fully compatible with PowerPoint, Keynote, and Google Slides.


4 slides
Workforce Skills Gap Analysis
Spot the gap. Bridge the skills. This Workforce Skills Gap Analysis slide helps visualize the journey from your team’s current capabilities to their desired performance level, with a clear action plan in between. Fully editable and works seamlessly in PowerPoint, Keynote, and Google Slides.


5 slides
Impacts of Information Technology Infographics
Information Technology has had a profound impact on various aspects of society, including business, communication, education, healthcare, and entertainment. These infographic templates are designed to help you communicate complex technological concepts in a visually compelling way, making it suitable for IT professionals, businesses, or anyone interested in understanding and highlighting the transformative power of information technology. The template features a sleek design with customizable layouts, icons, and color schemes that can be adjusted to match your branding. It is compatible with PowerPoint, Keynote, and Google Slides.
5 slides
Feedback Rating Smile Icons Presentation
Light up your presentation with a playful visual that turns audience feedback into clear, colorful insights. This slide helps you compare ratings, highlight sentiment patterns, and present review data in a friendly, memorable way. Perfect for surveys, reports, and performance reviews. Fully compatible with PowerPoint, Keynote, and Google Slides.


5 slides
Understanding Customer Needs with Empathy Map Presentation
Gain deeper customer insights with the Understanding Customer Needs with Empathy Map Presentation. This template simplifies user research by visually organizing customer thoughts, behaviors, and emotions into a clear layout. Perfect for UX teams, product designers, and marketers aiming to craft user-centric strategies. Fully editable in PowerPoint, Keynote, Canva, and Google Slides.
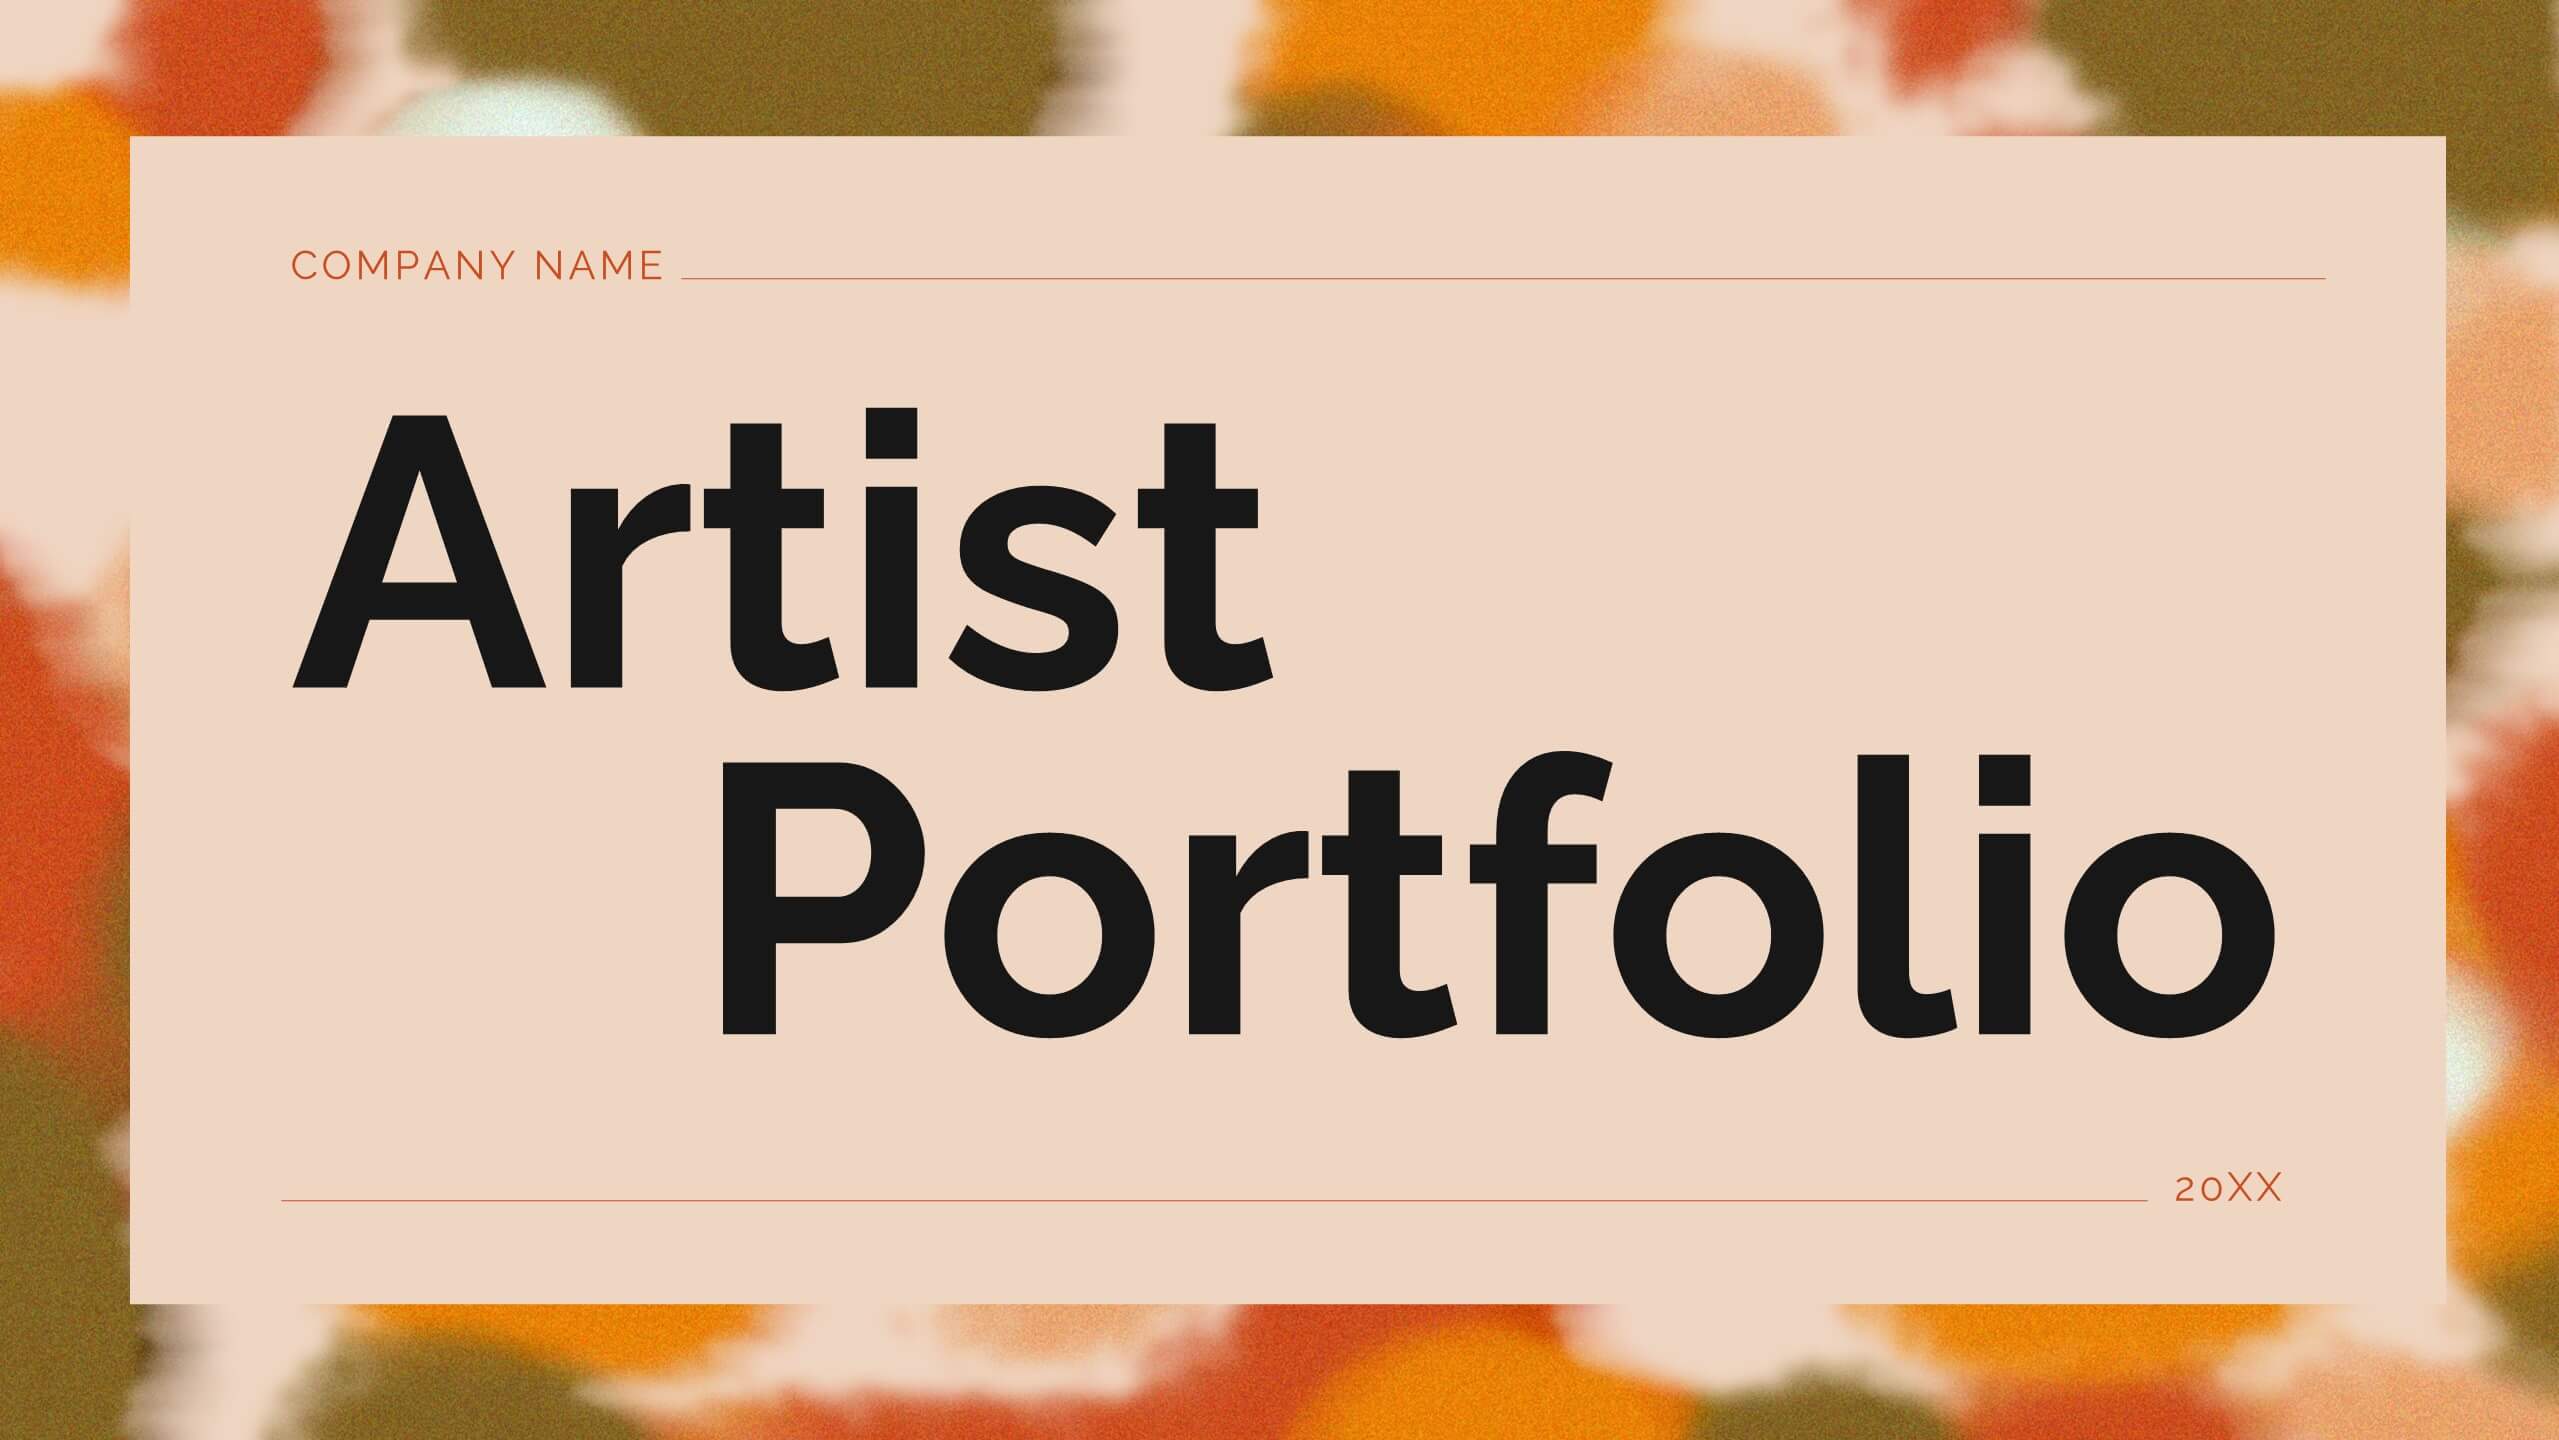
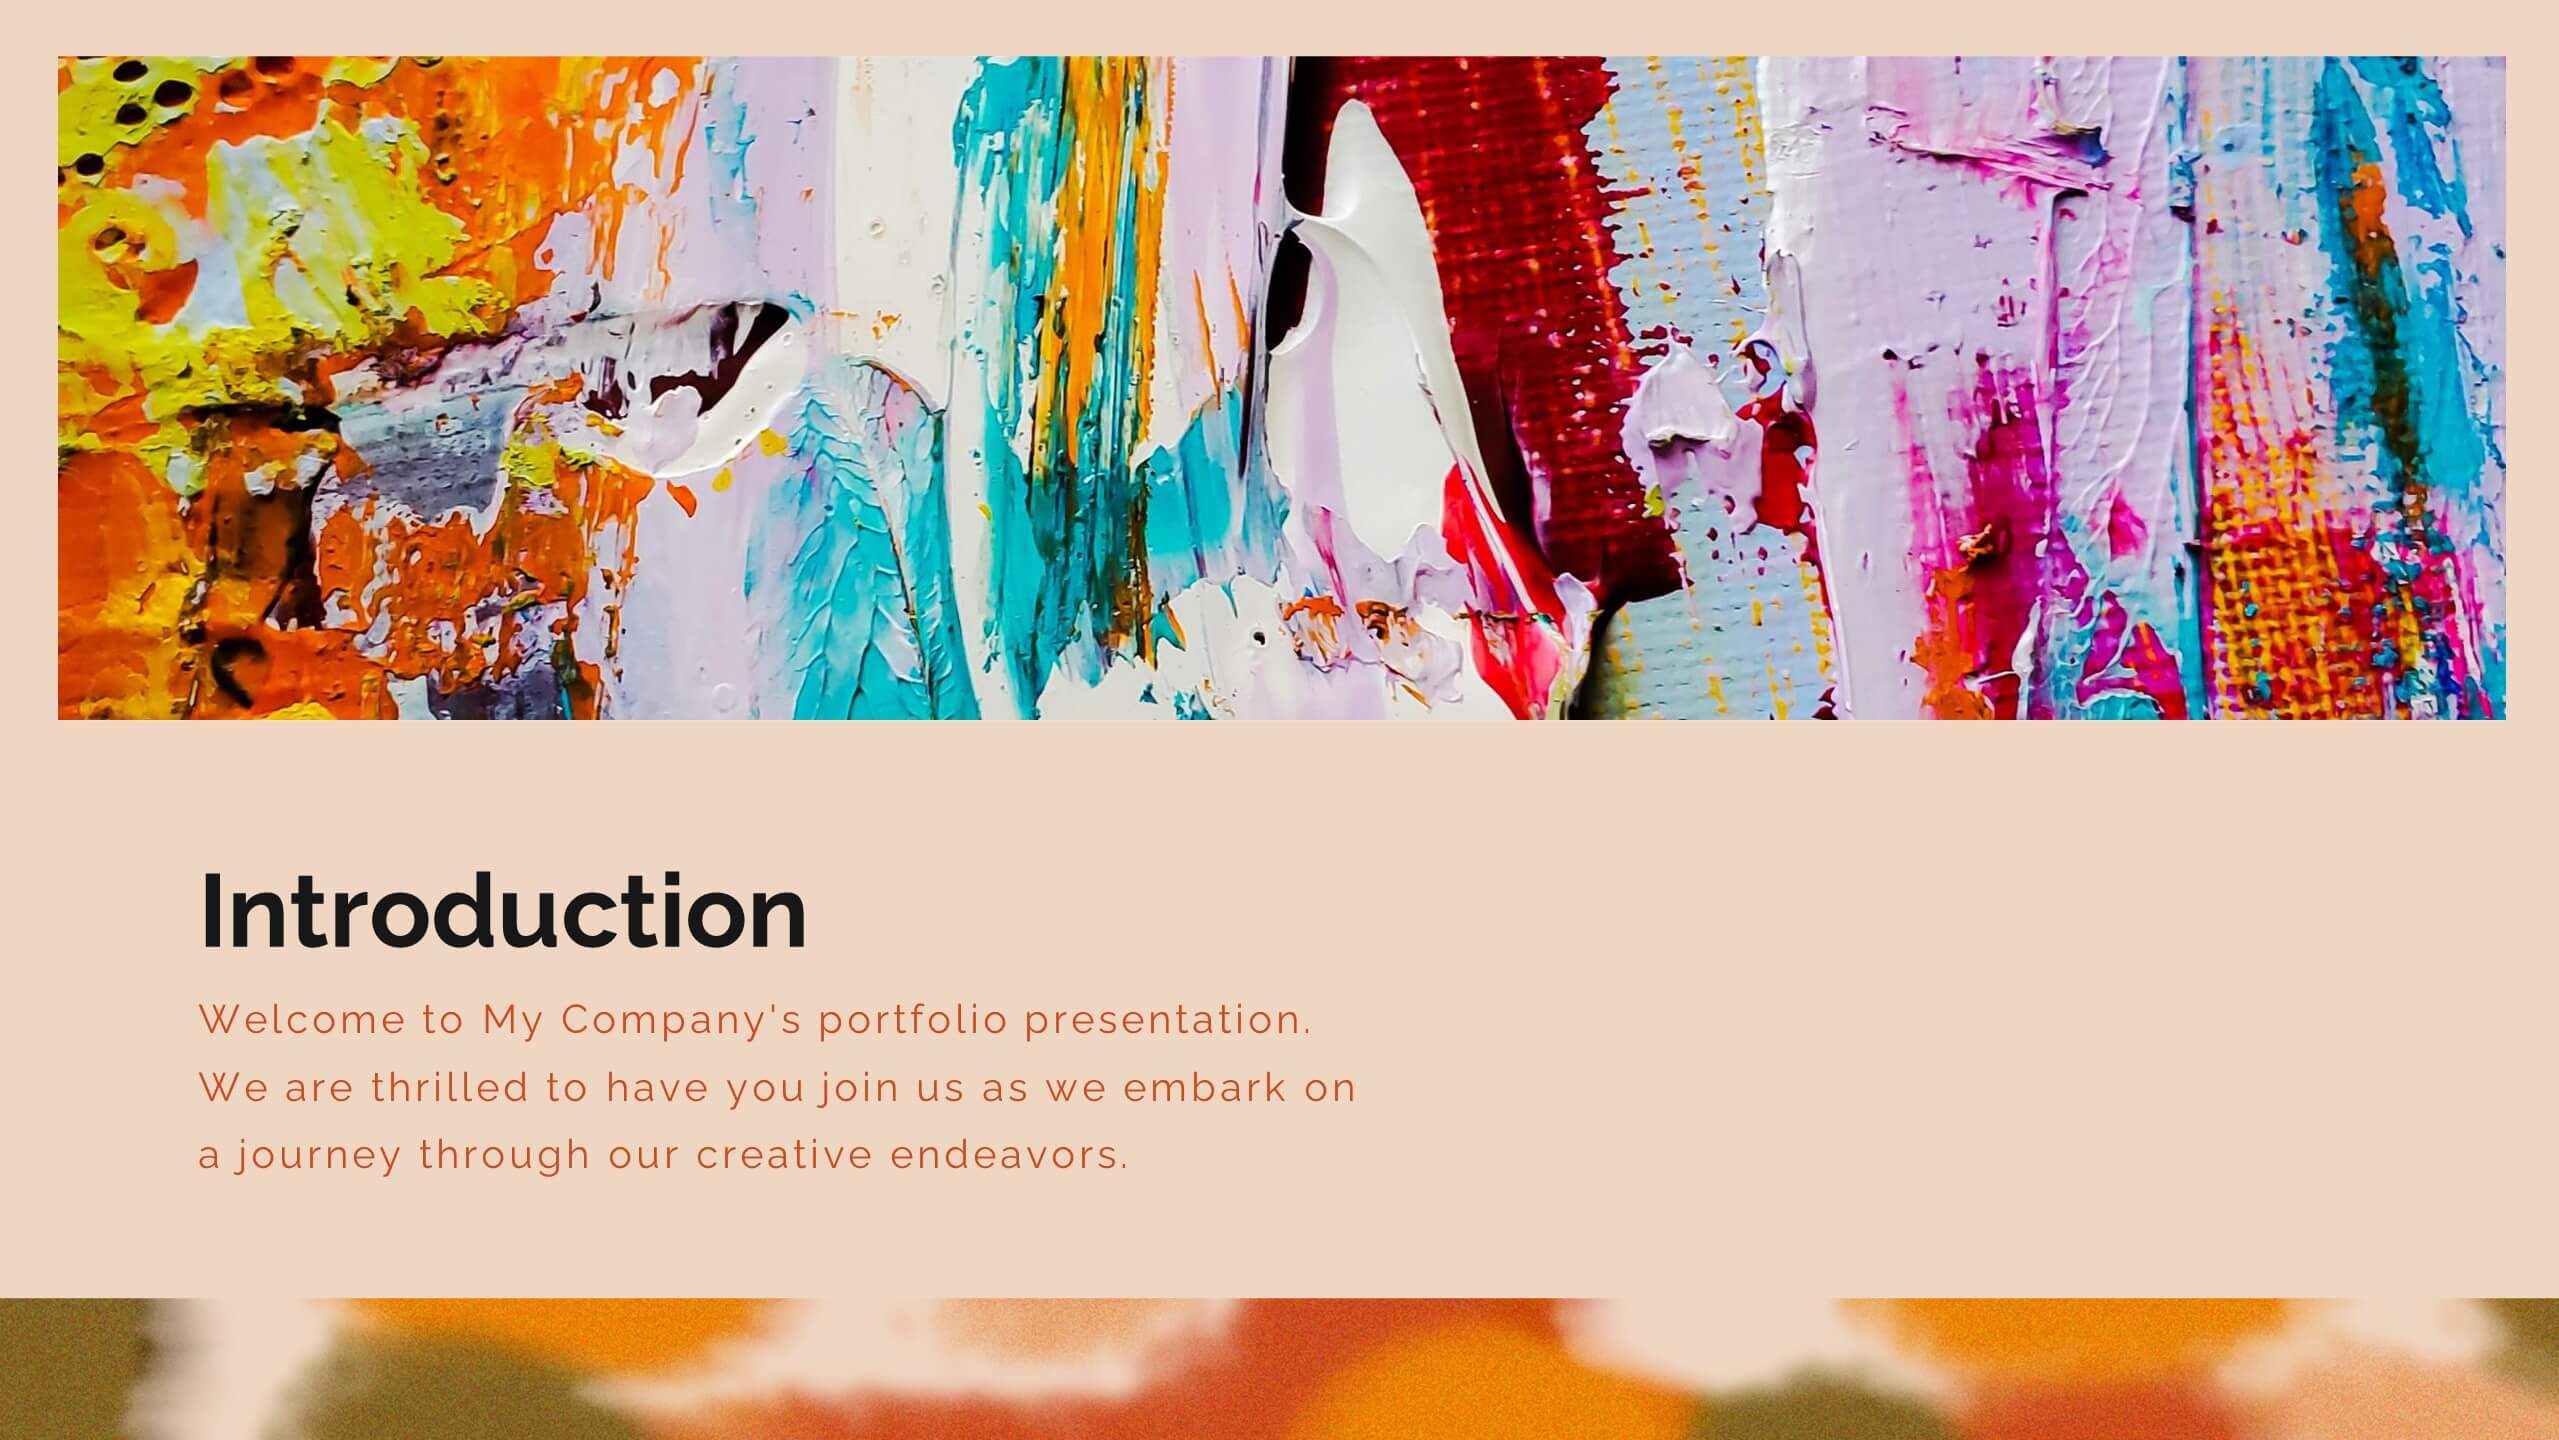


20 slides
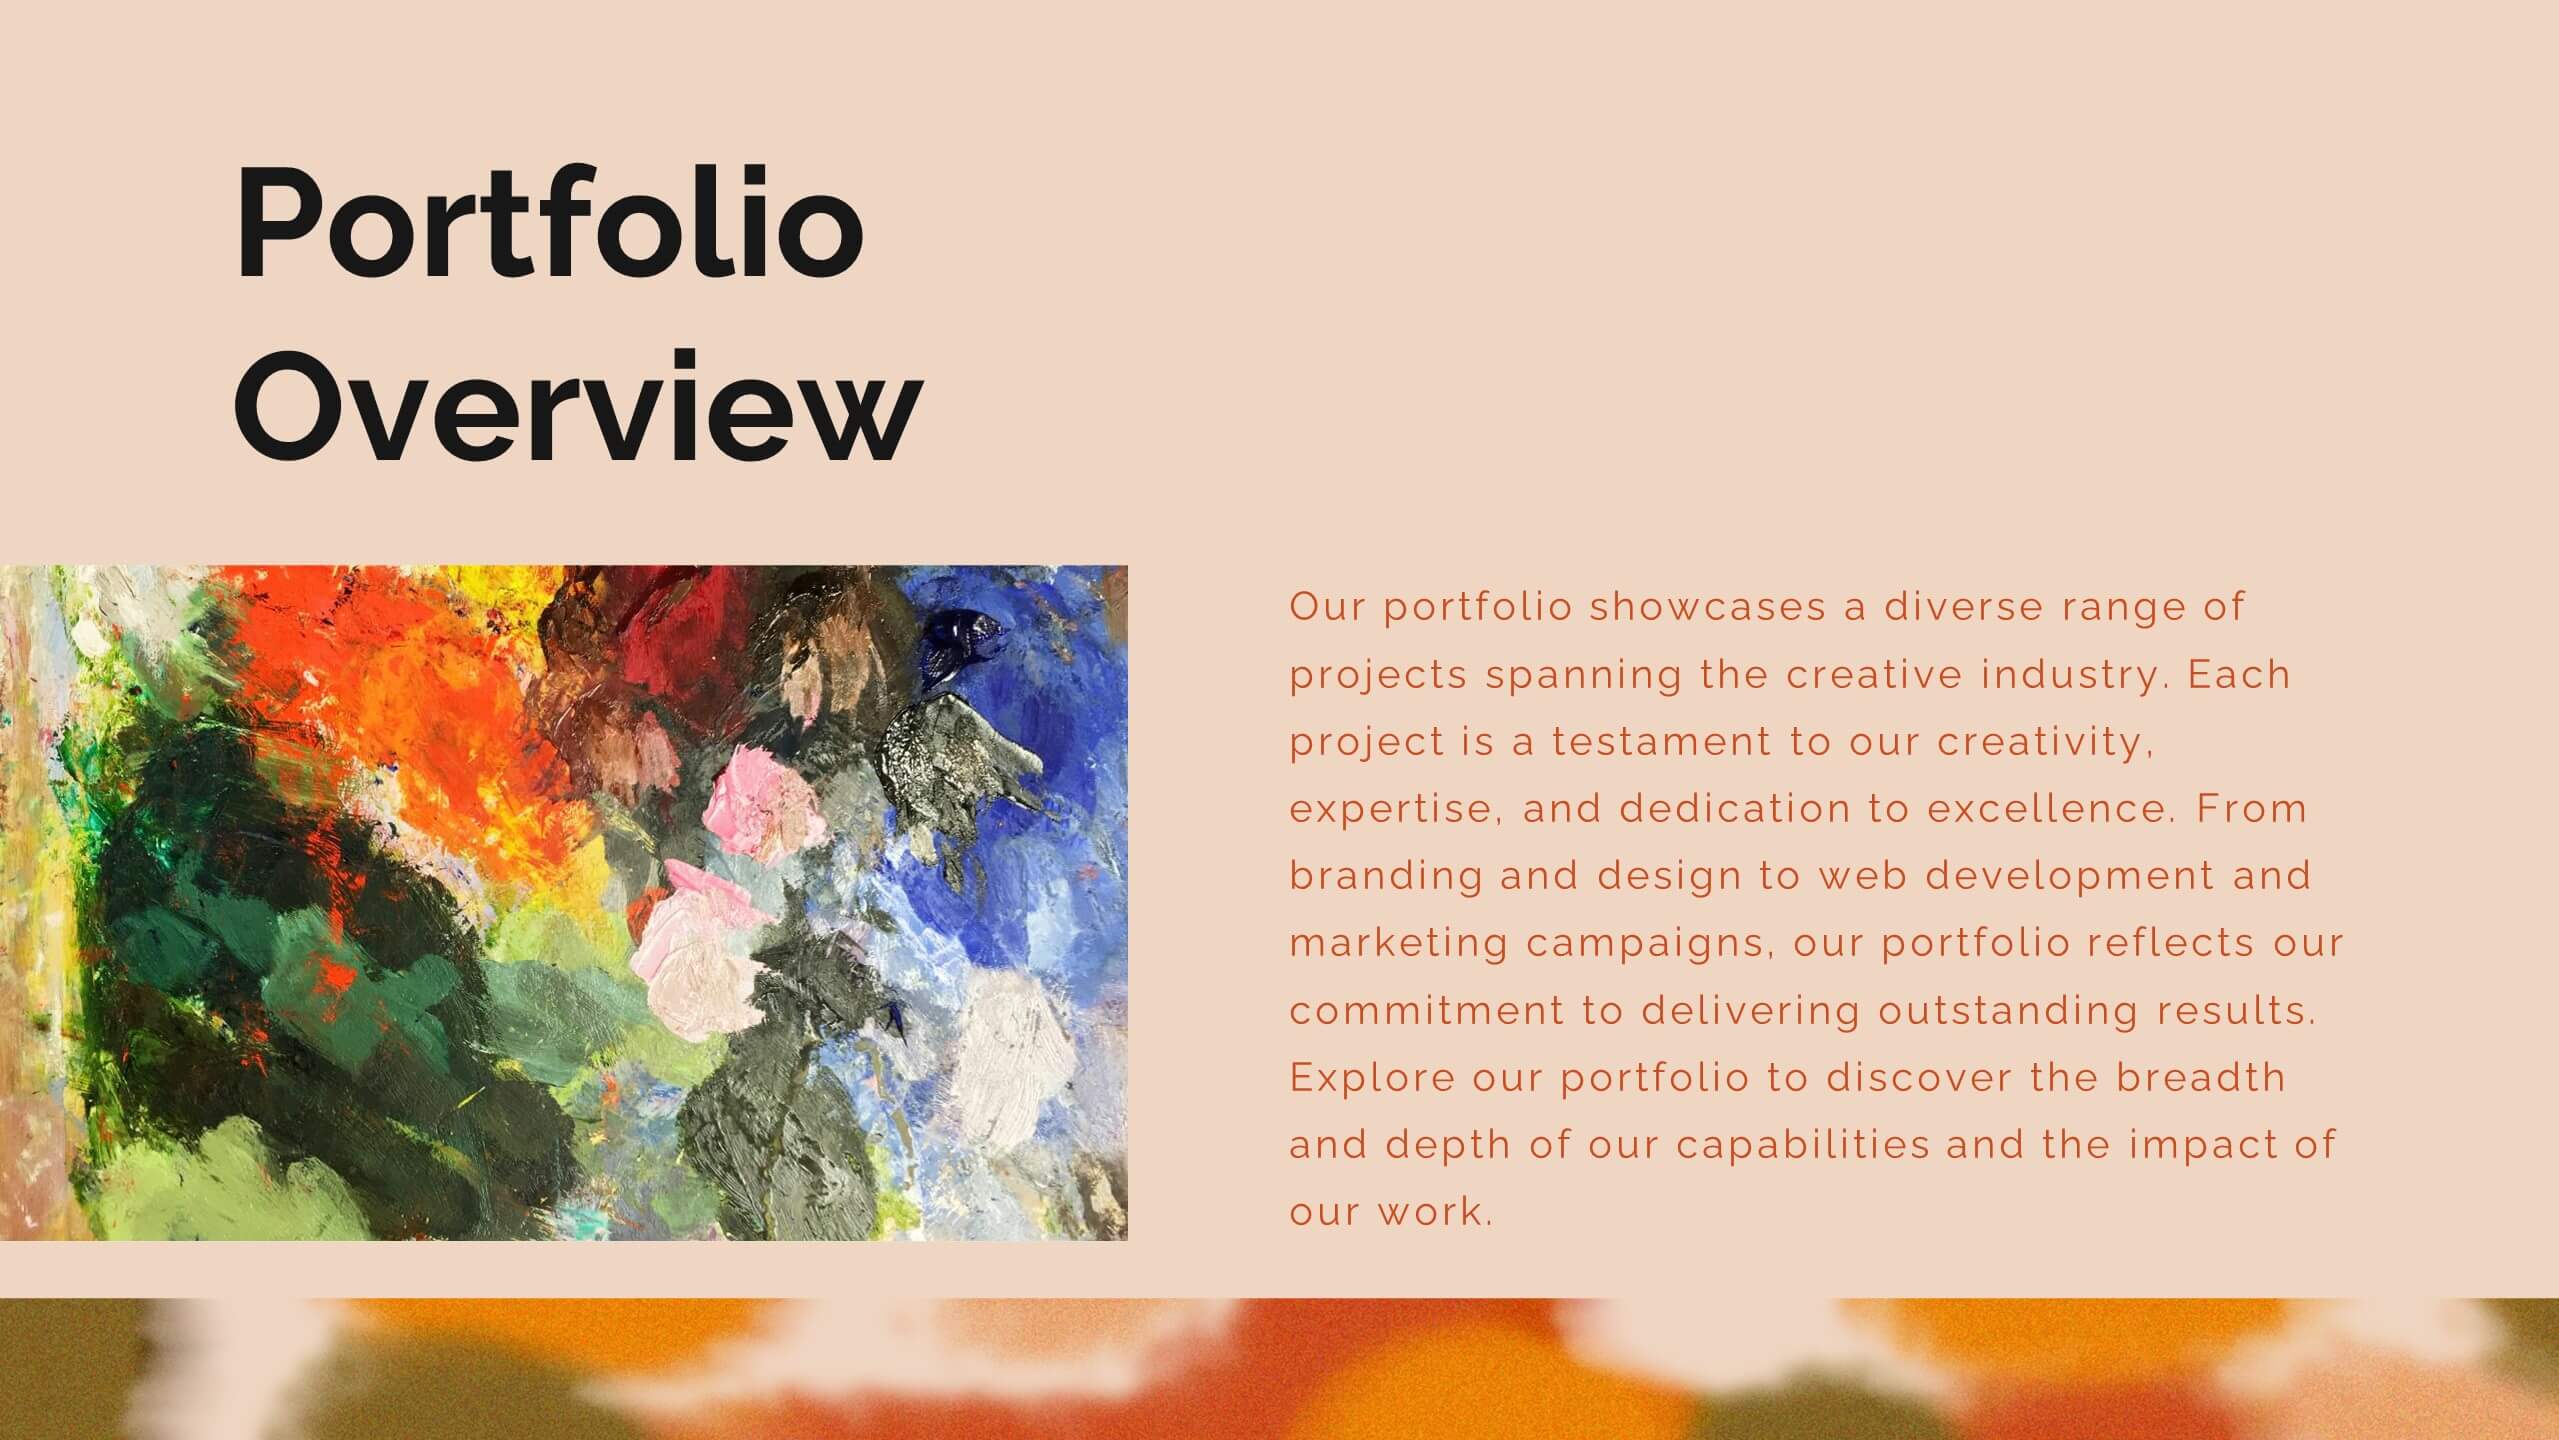
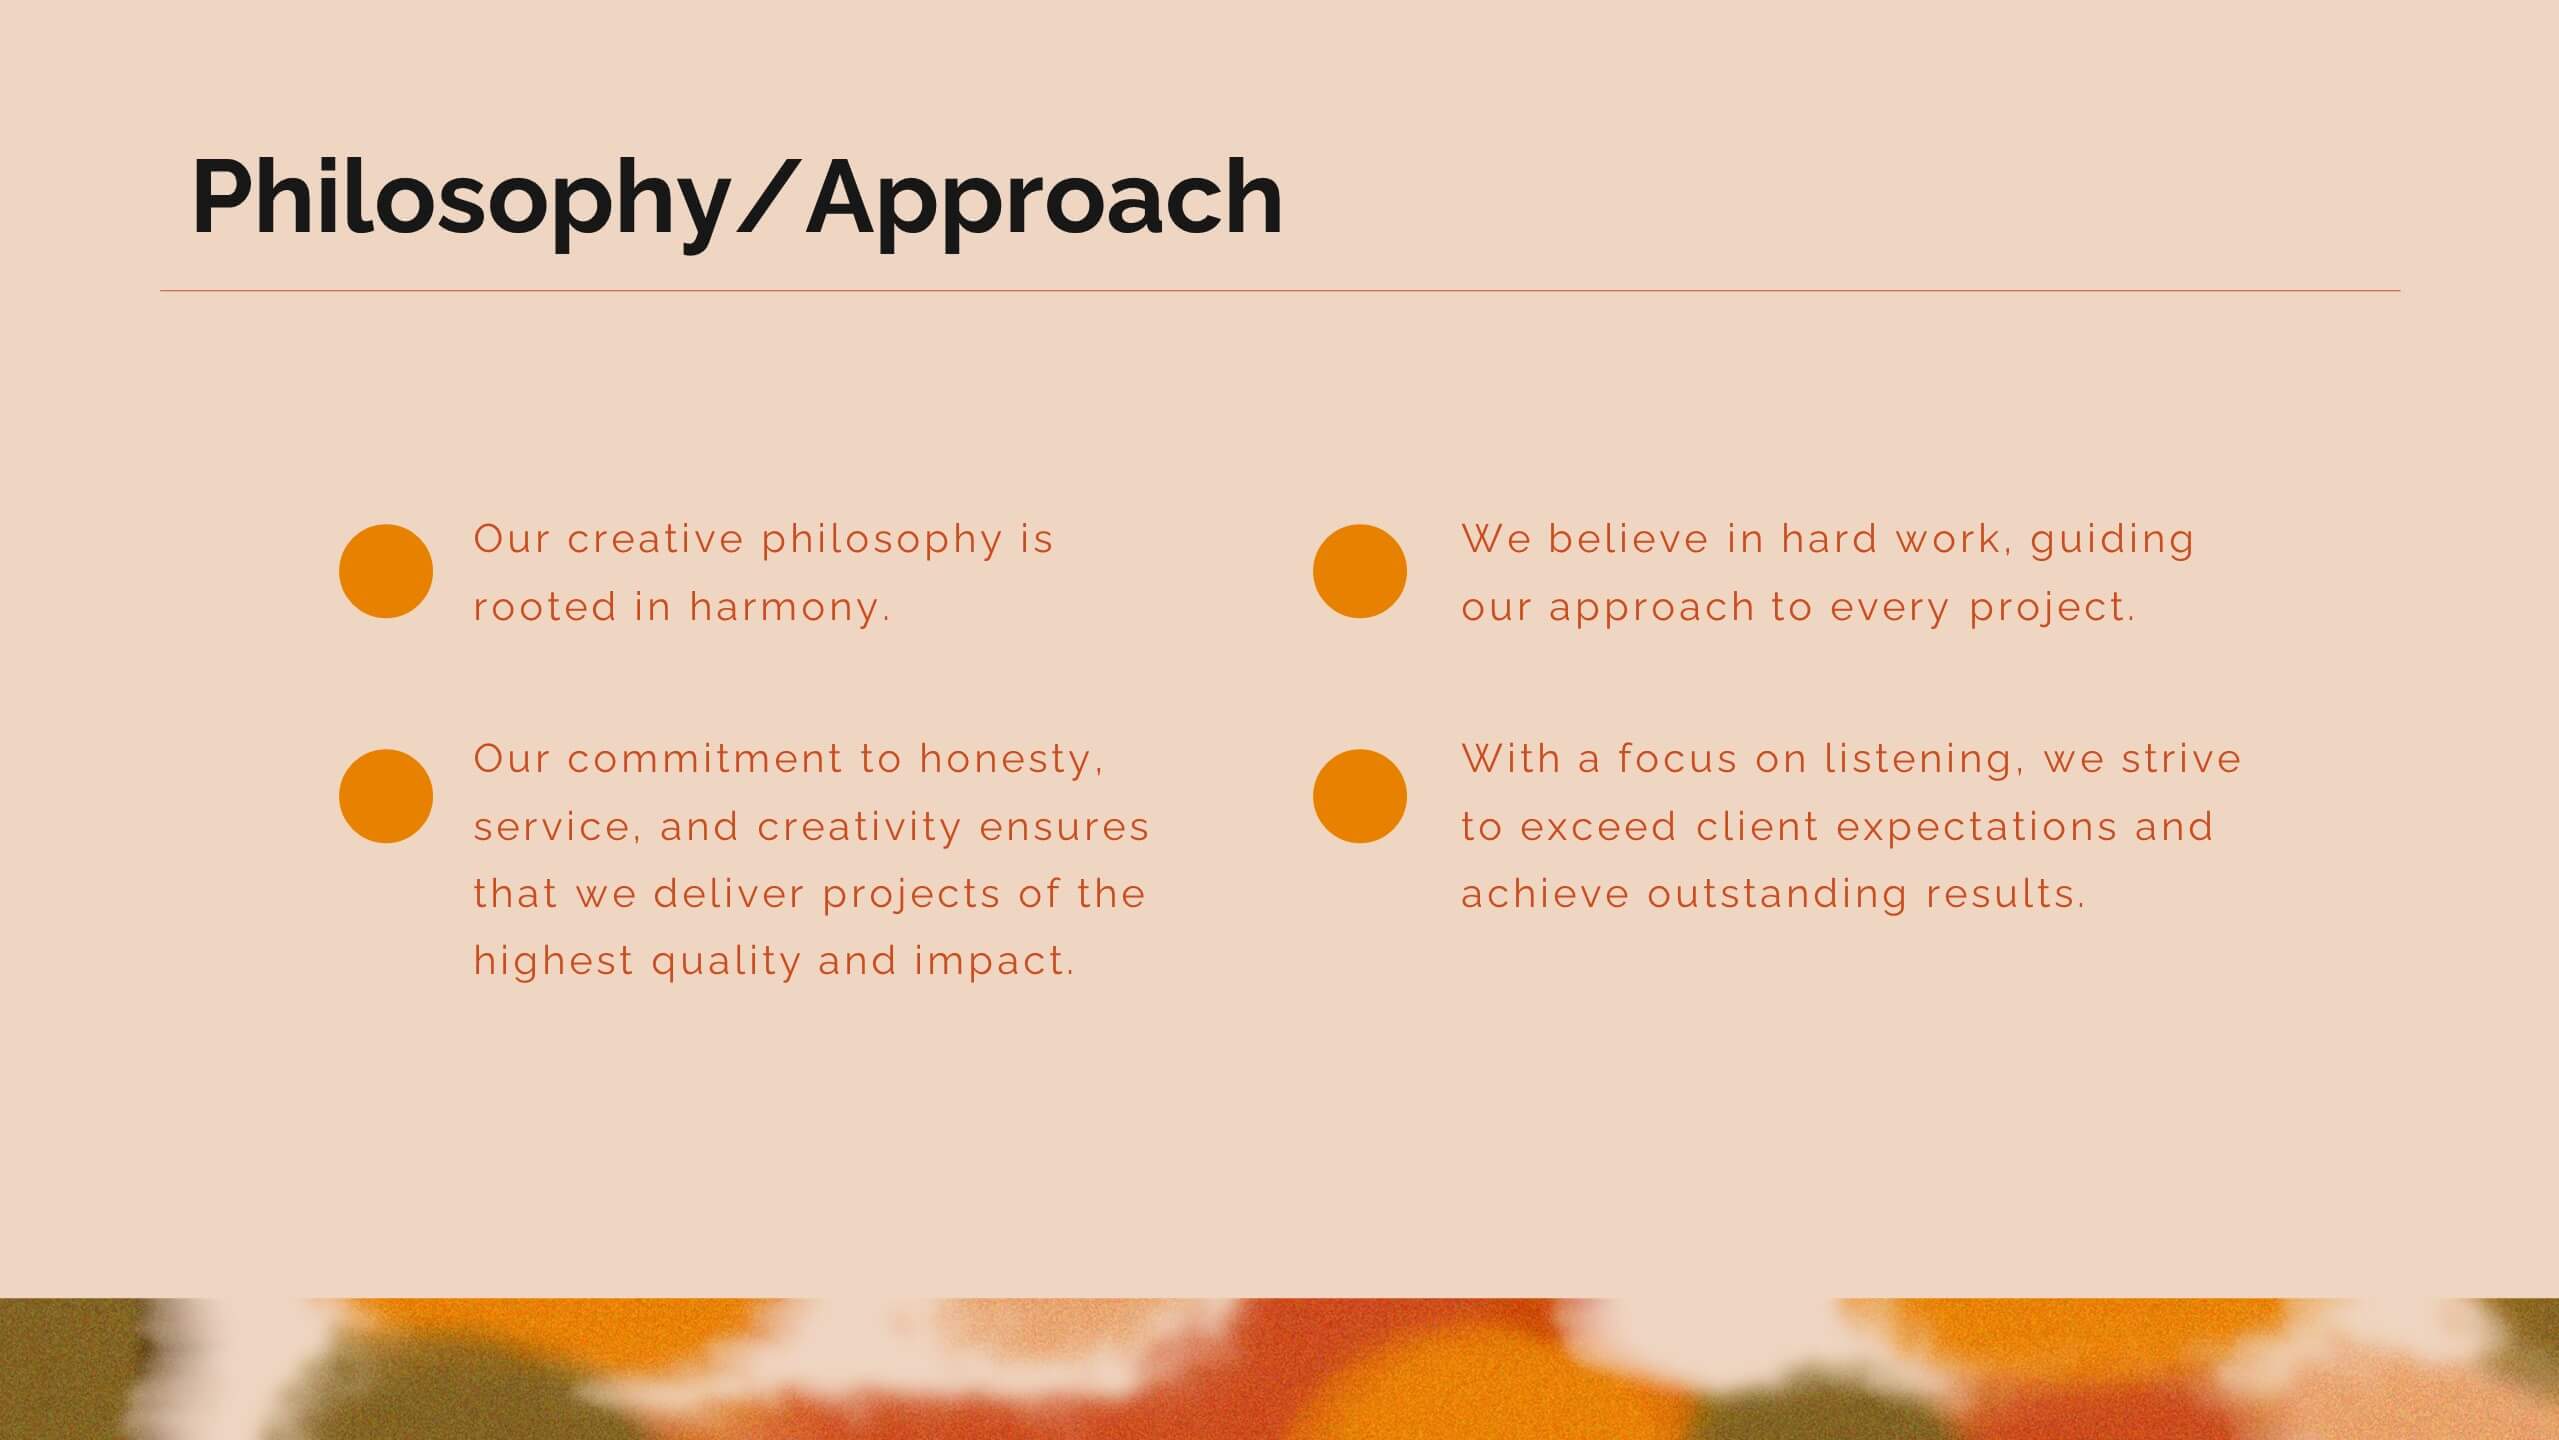
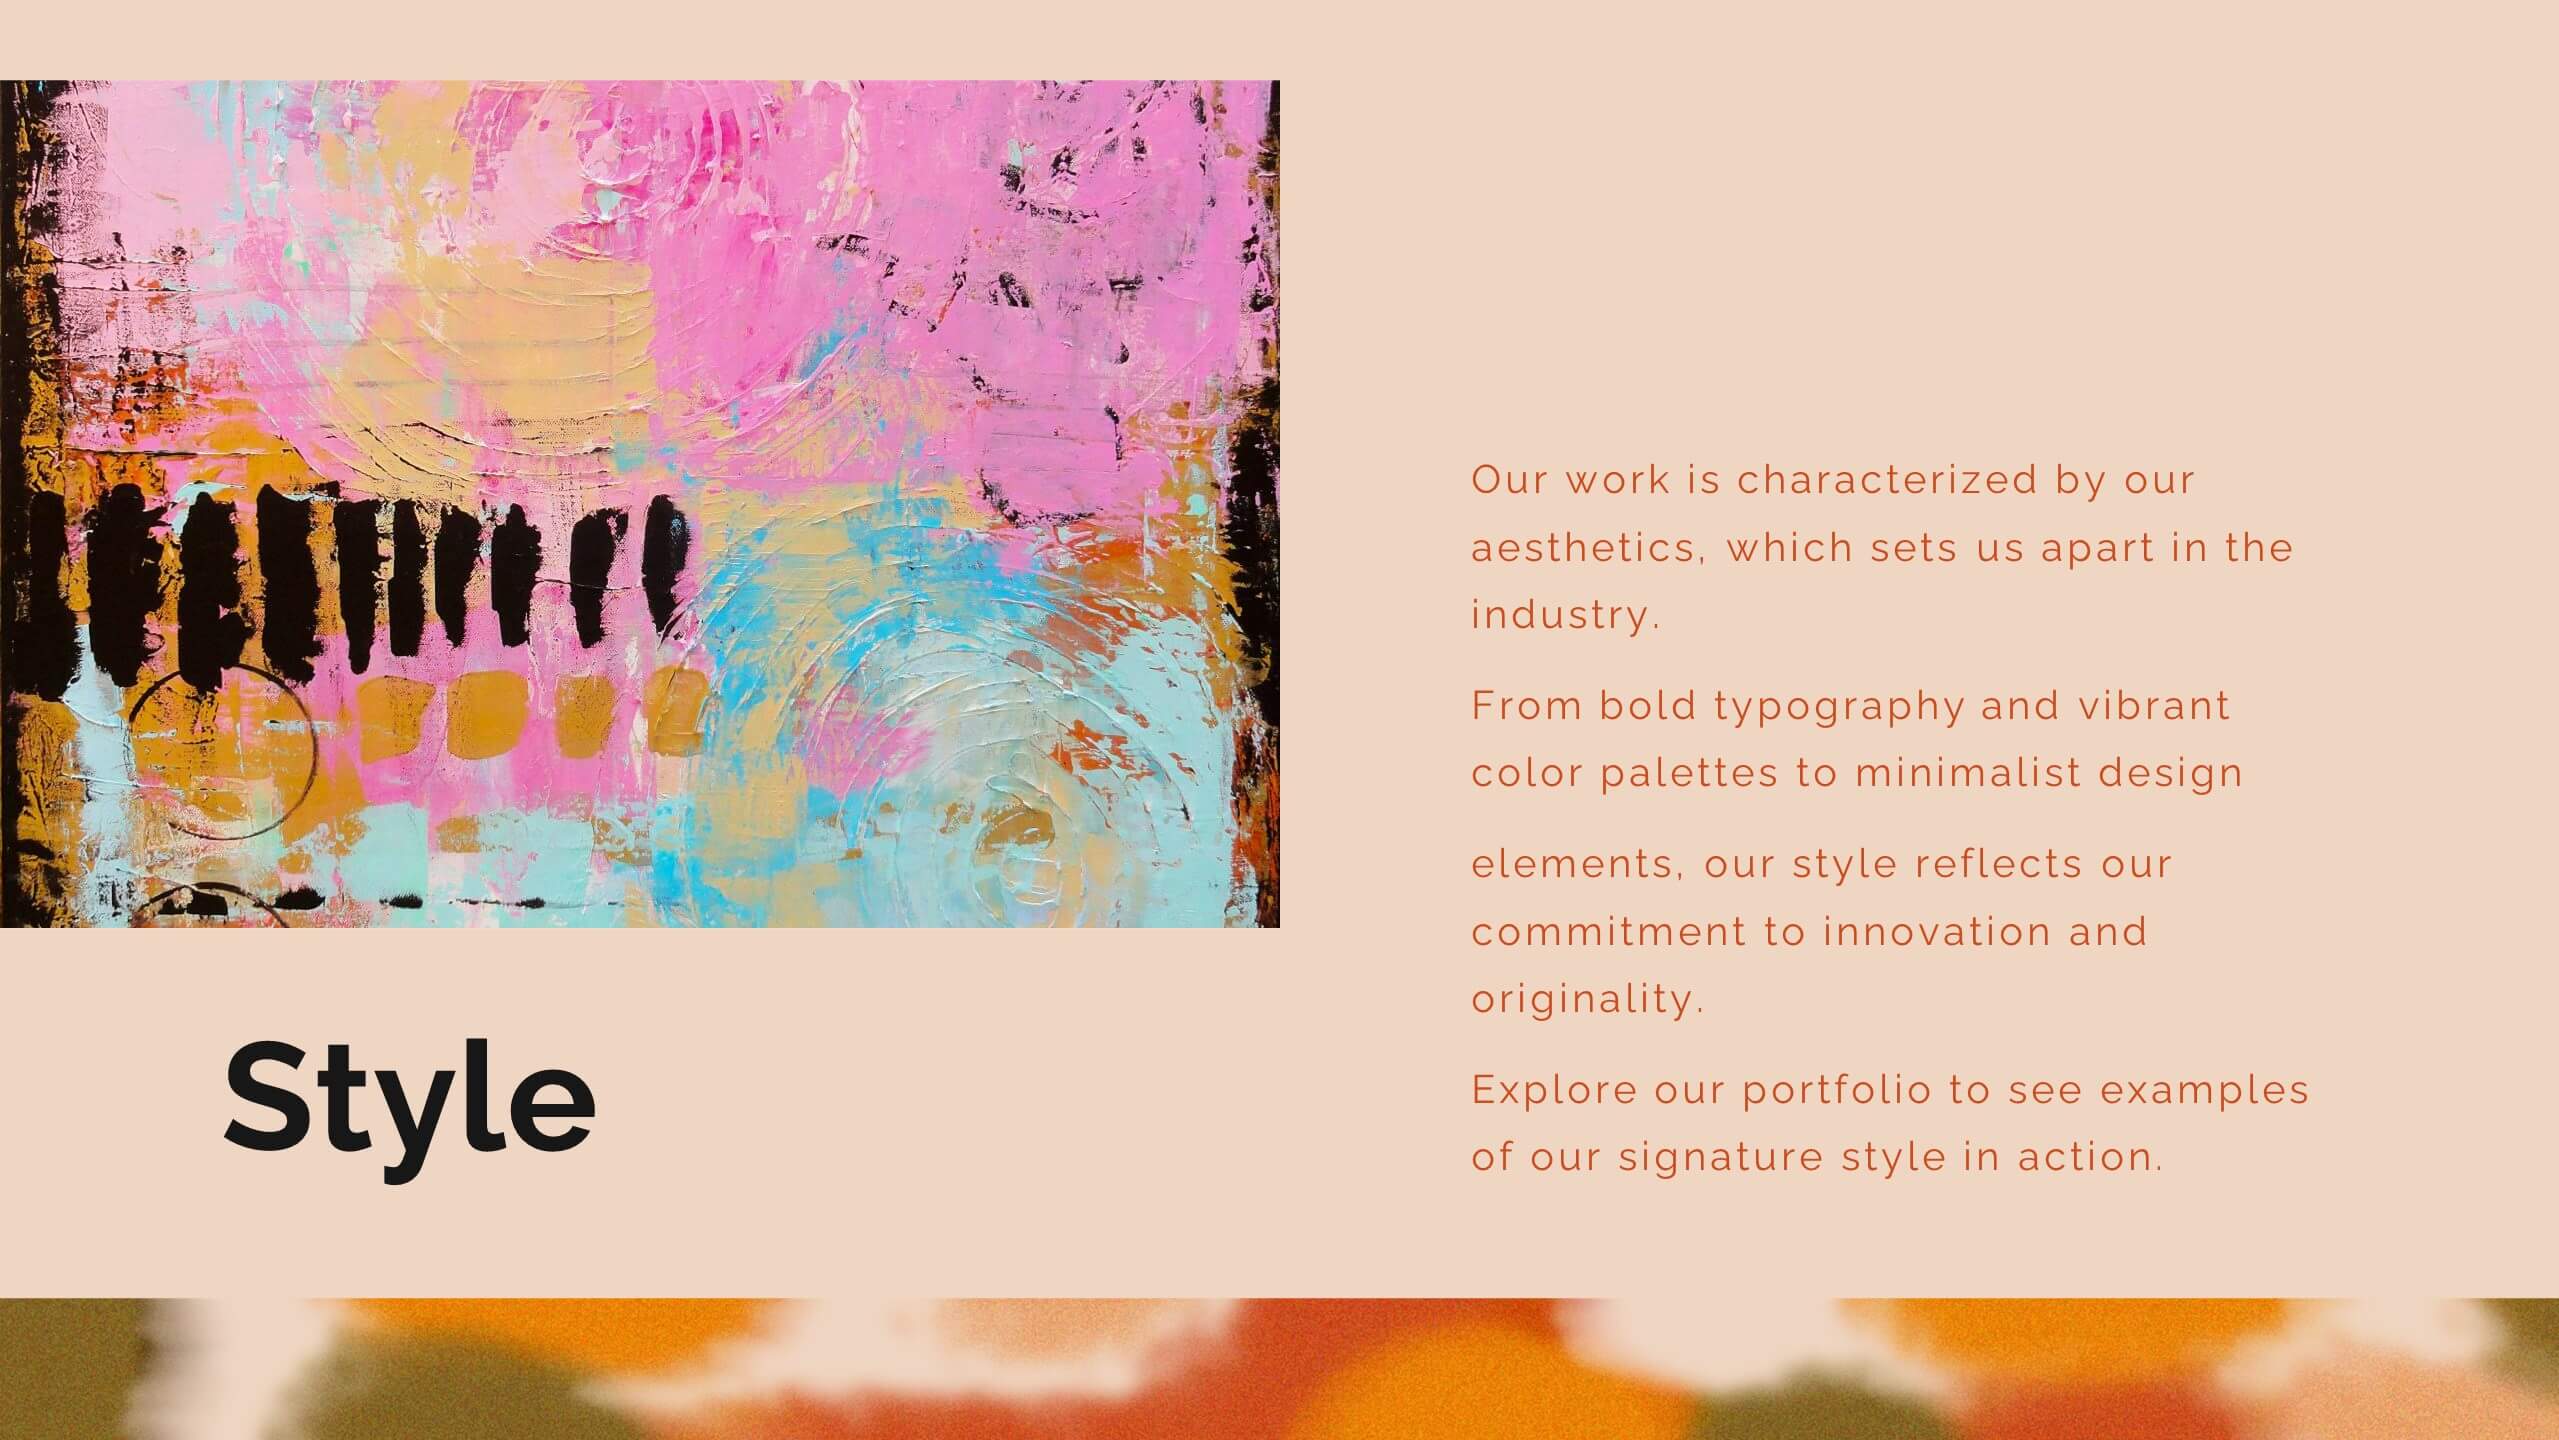
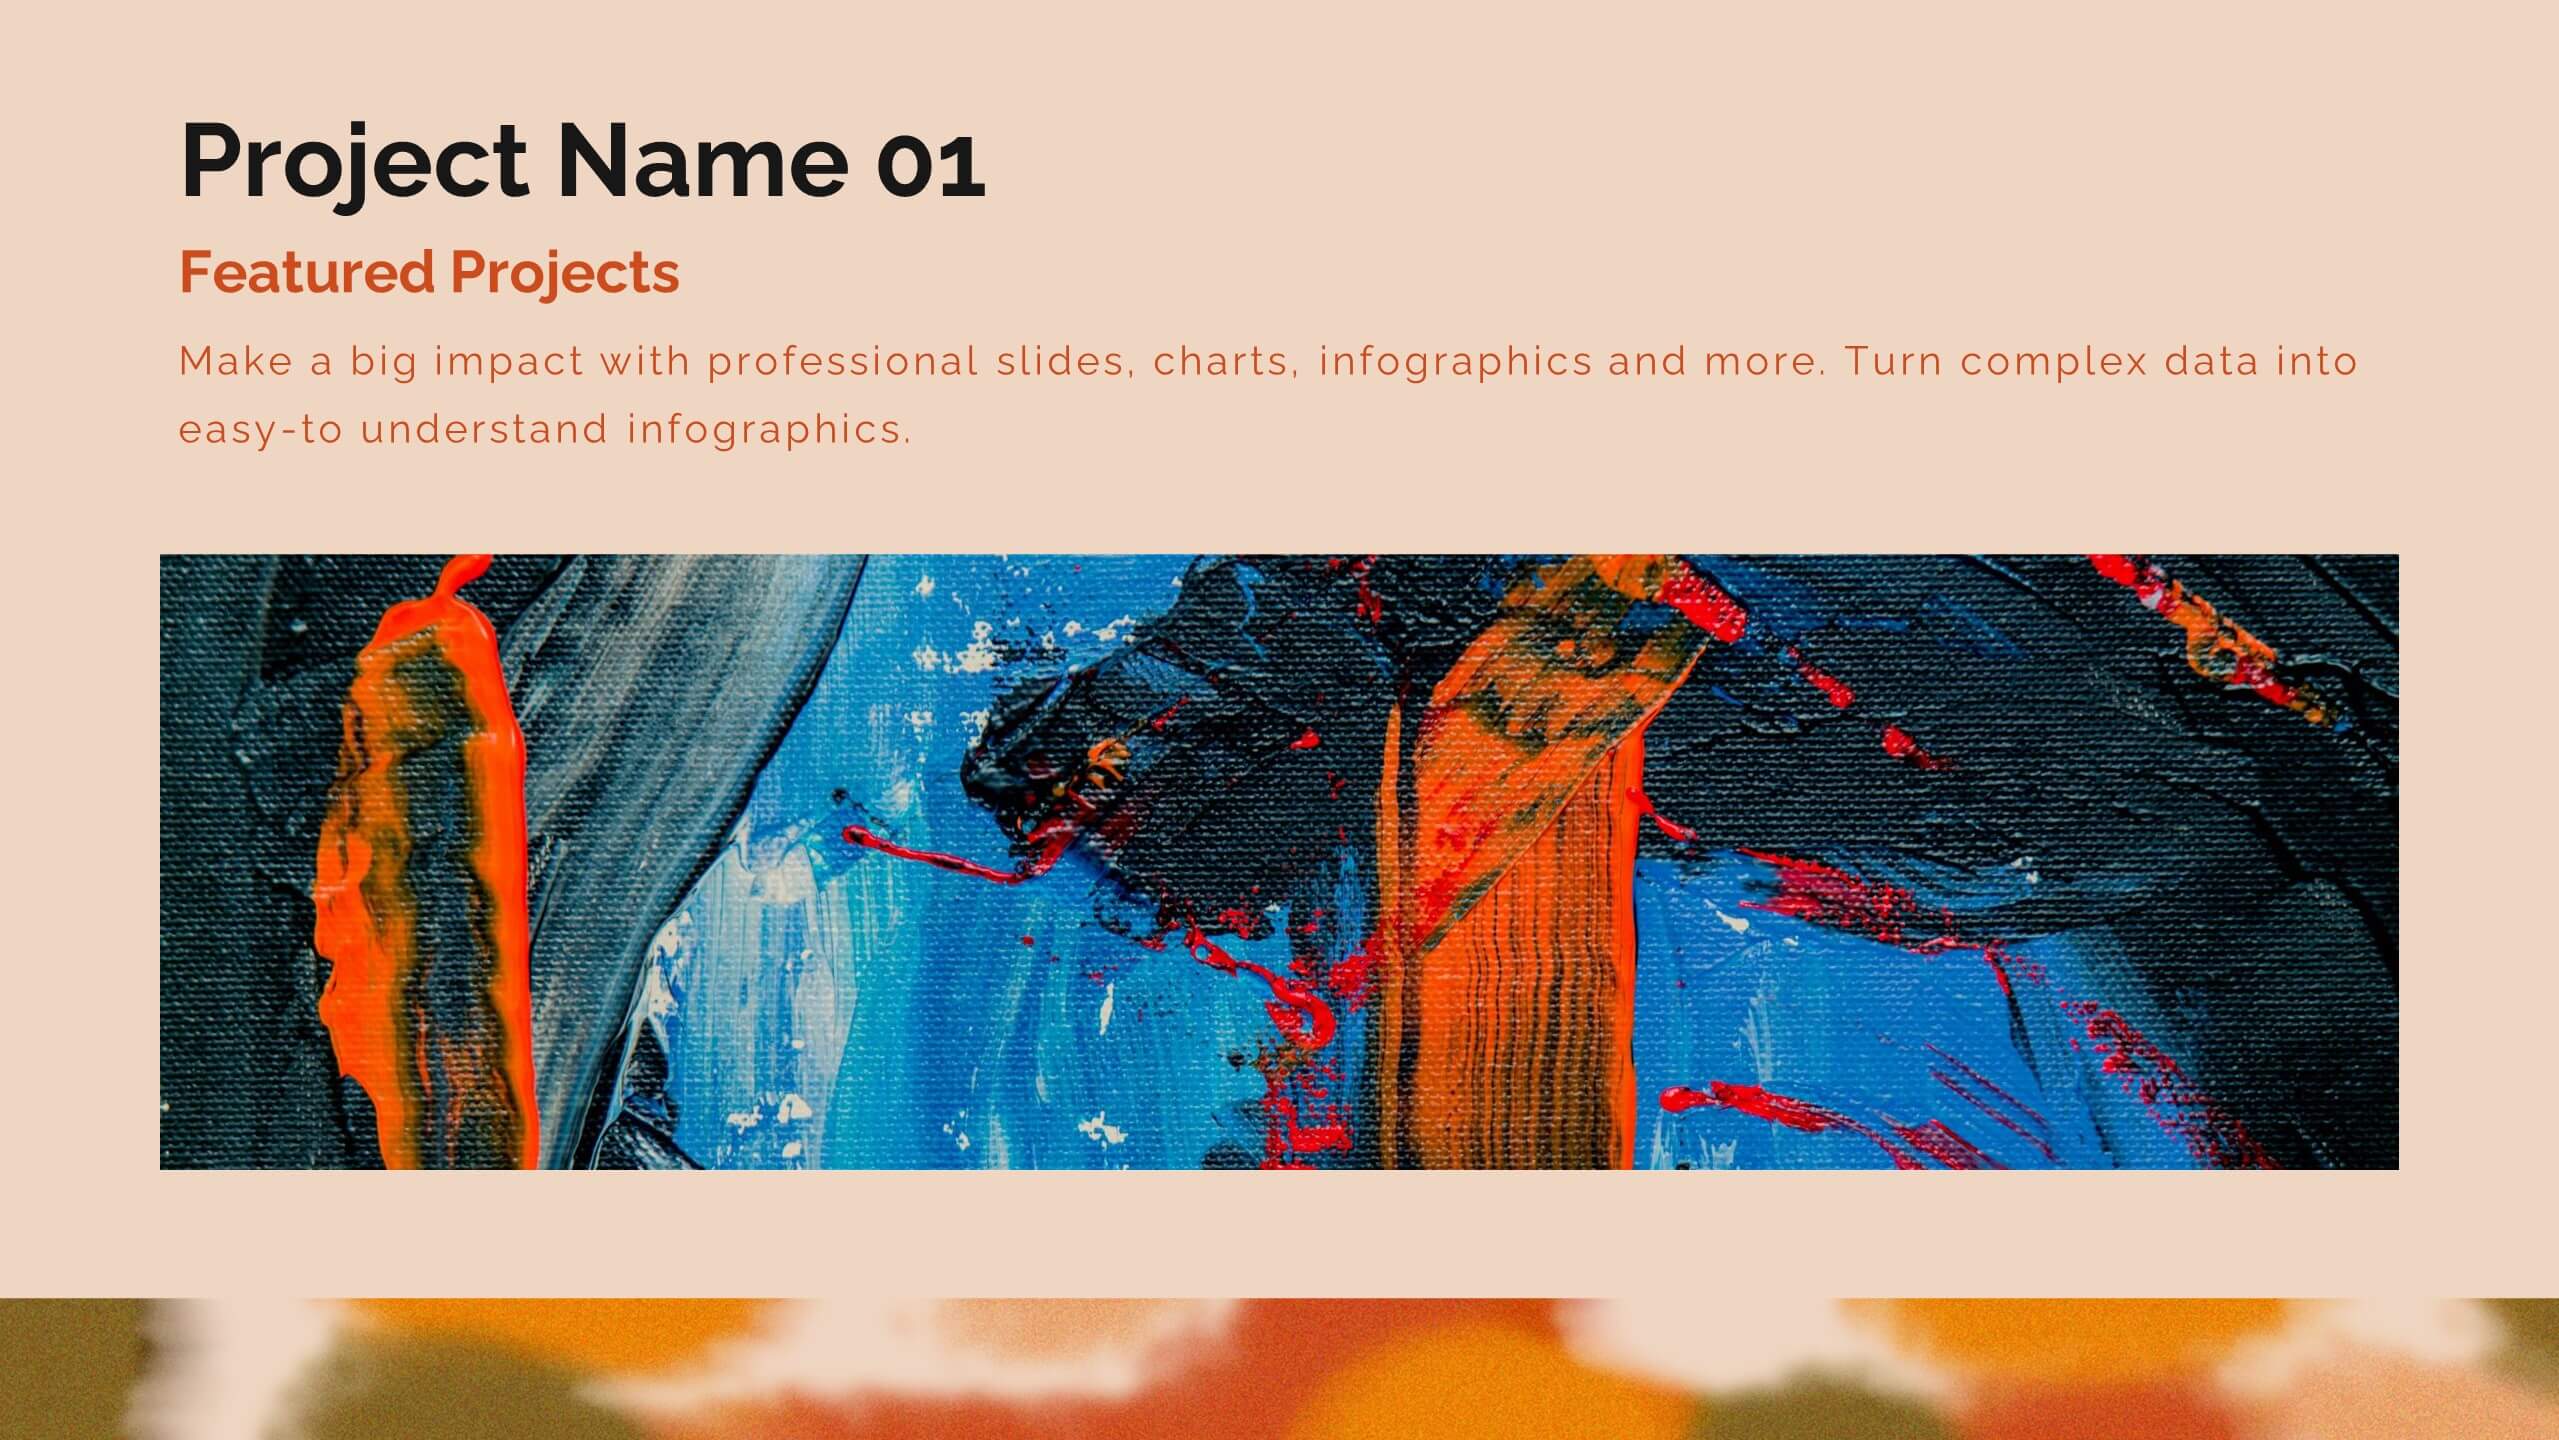
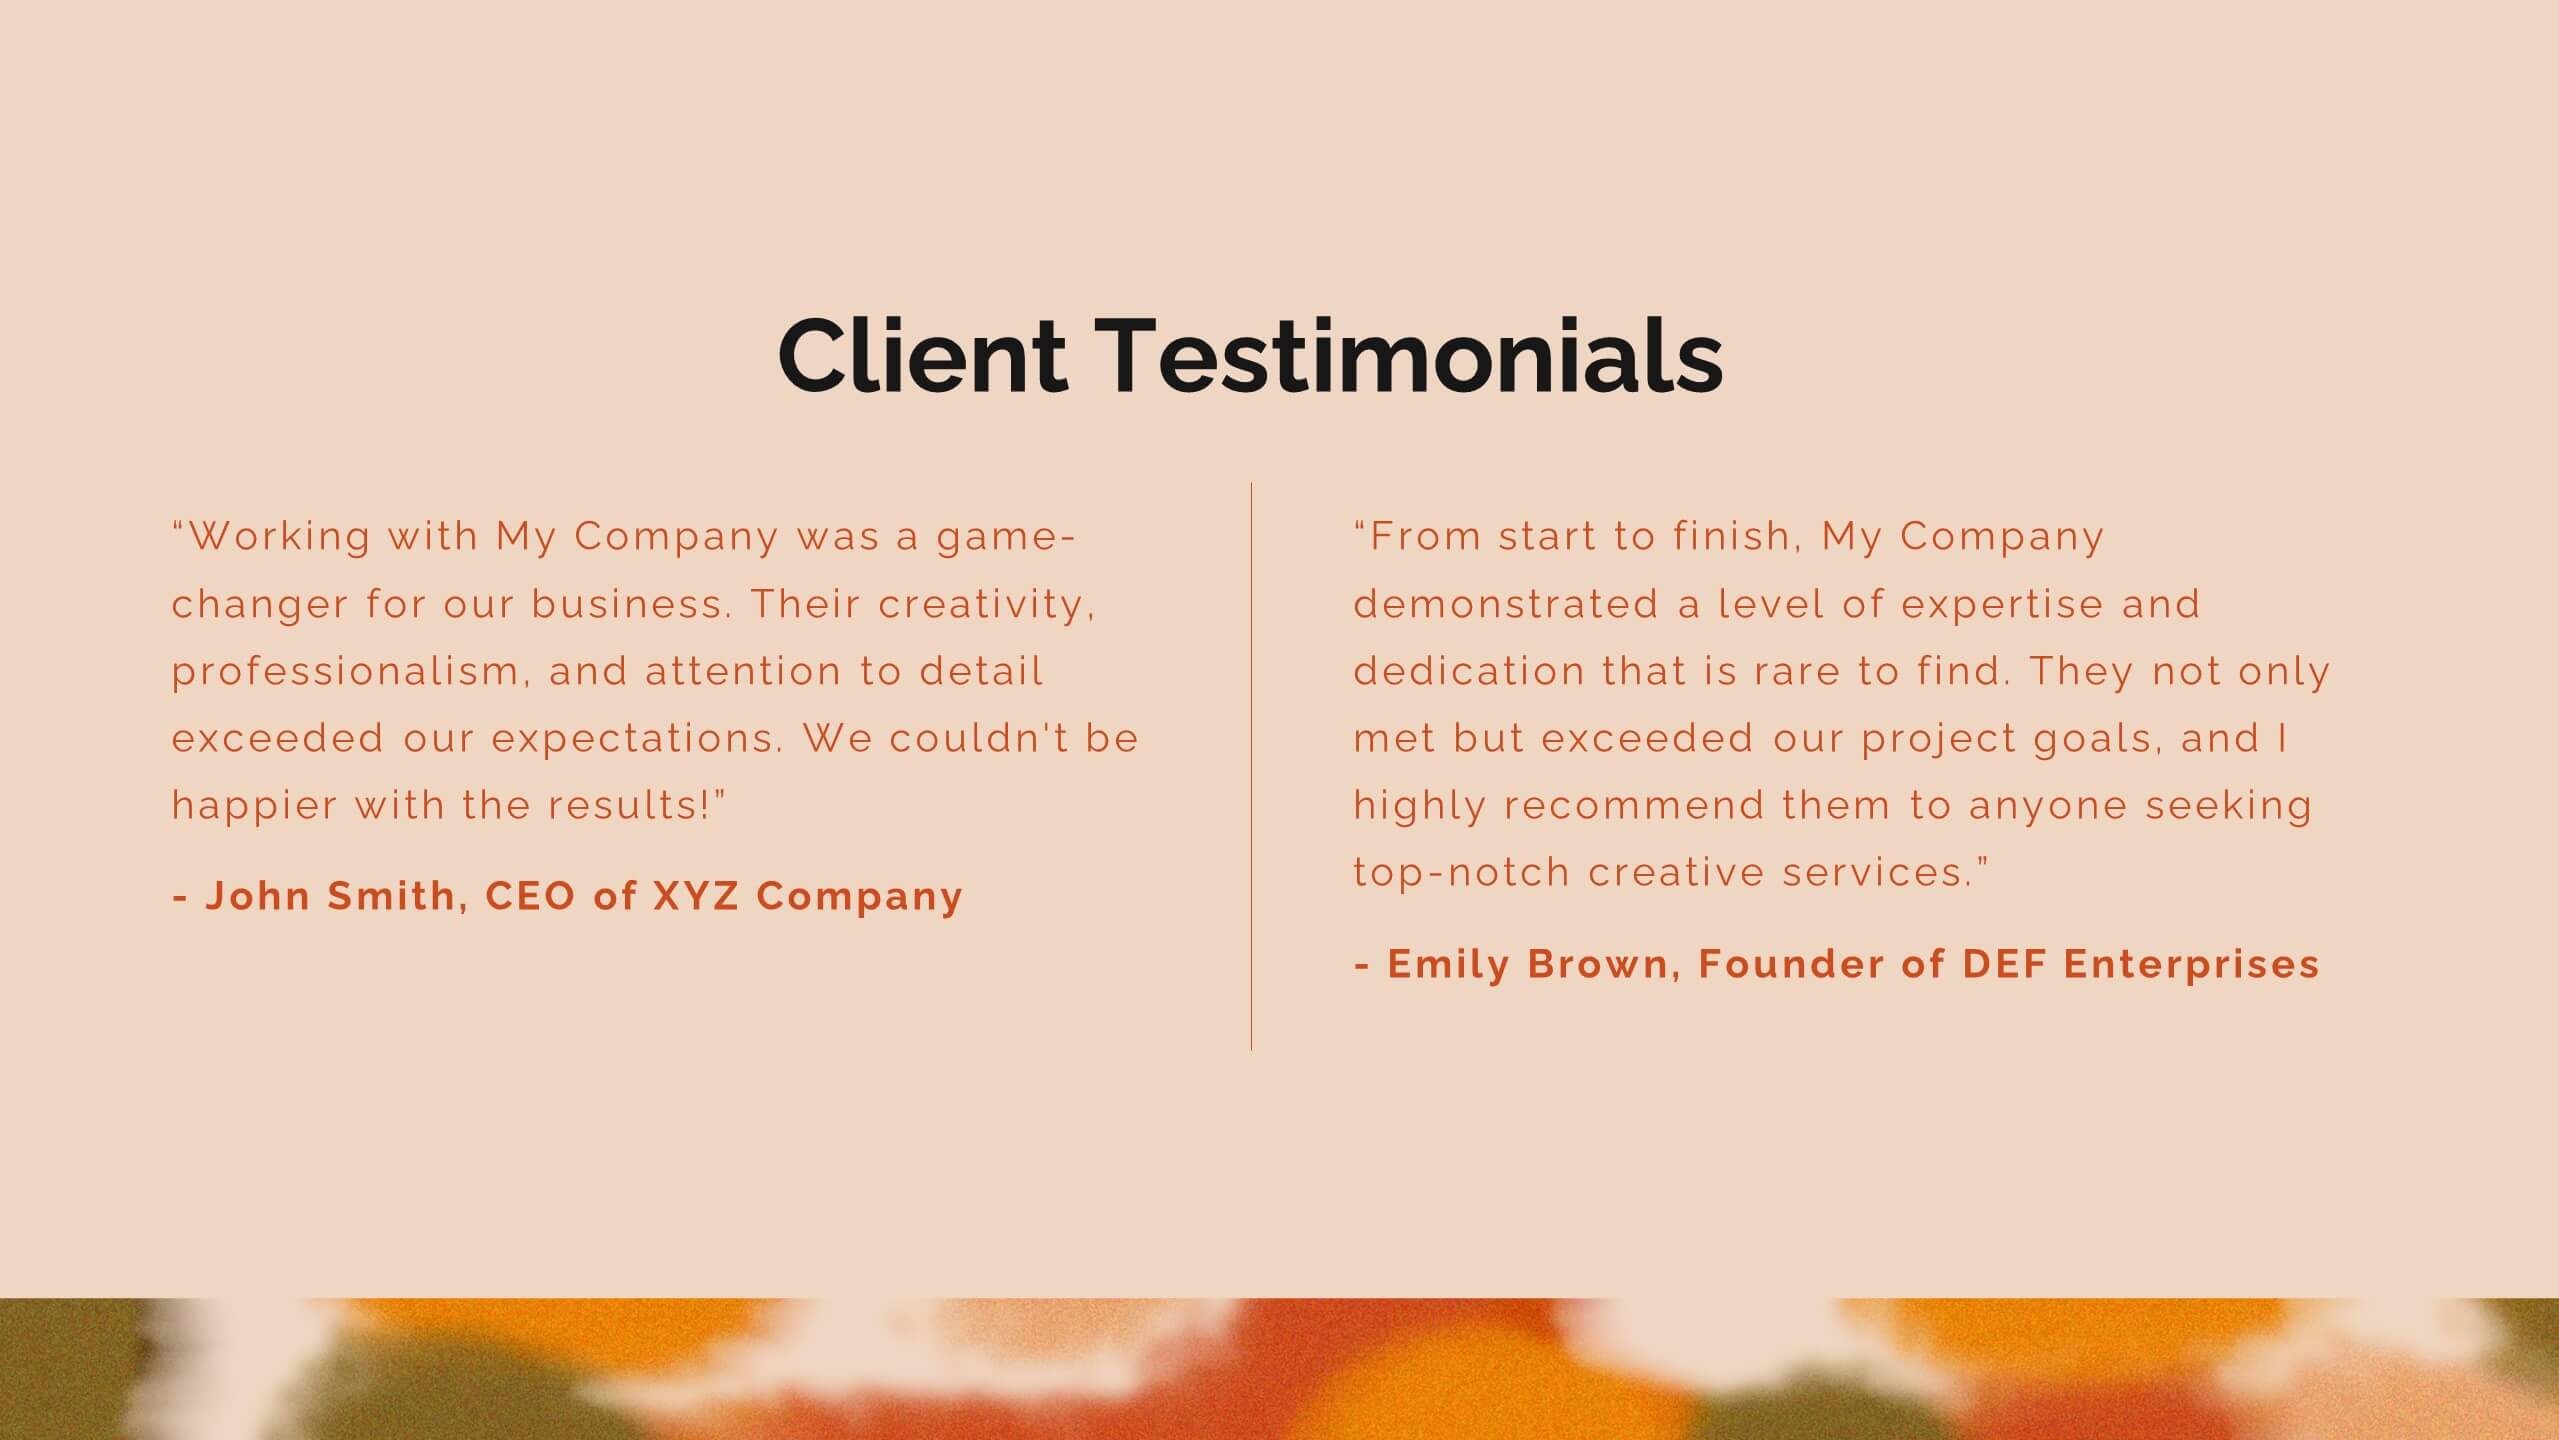
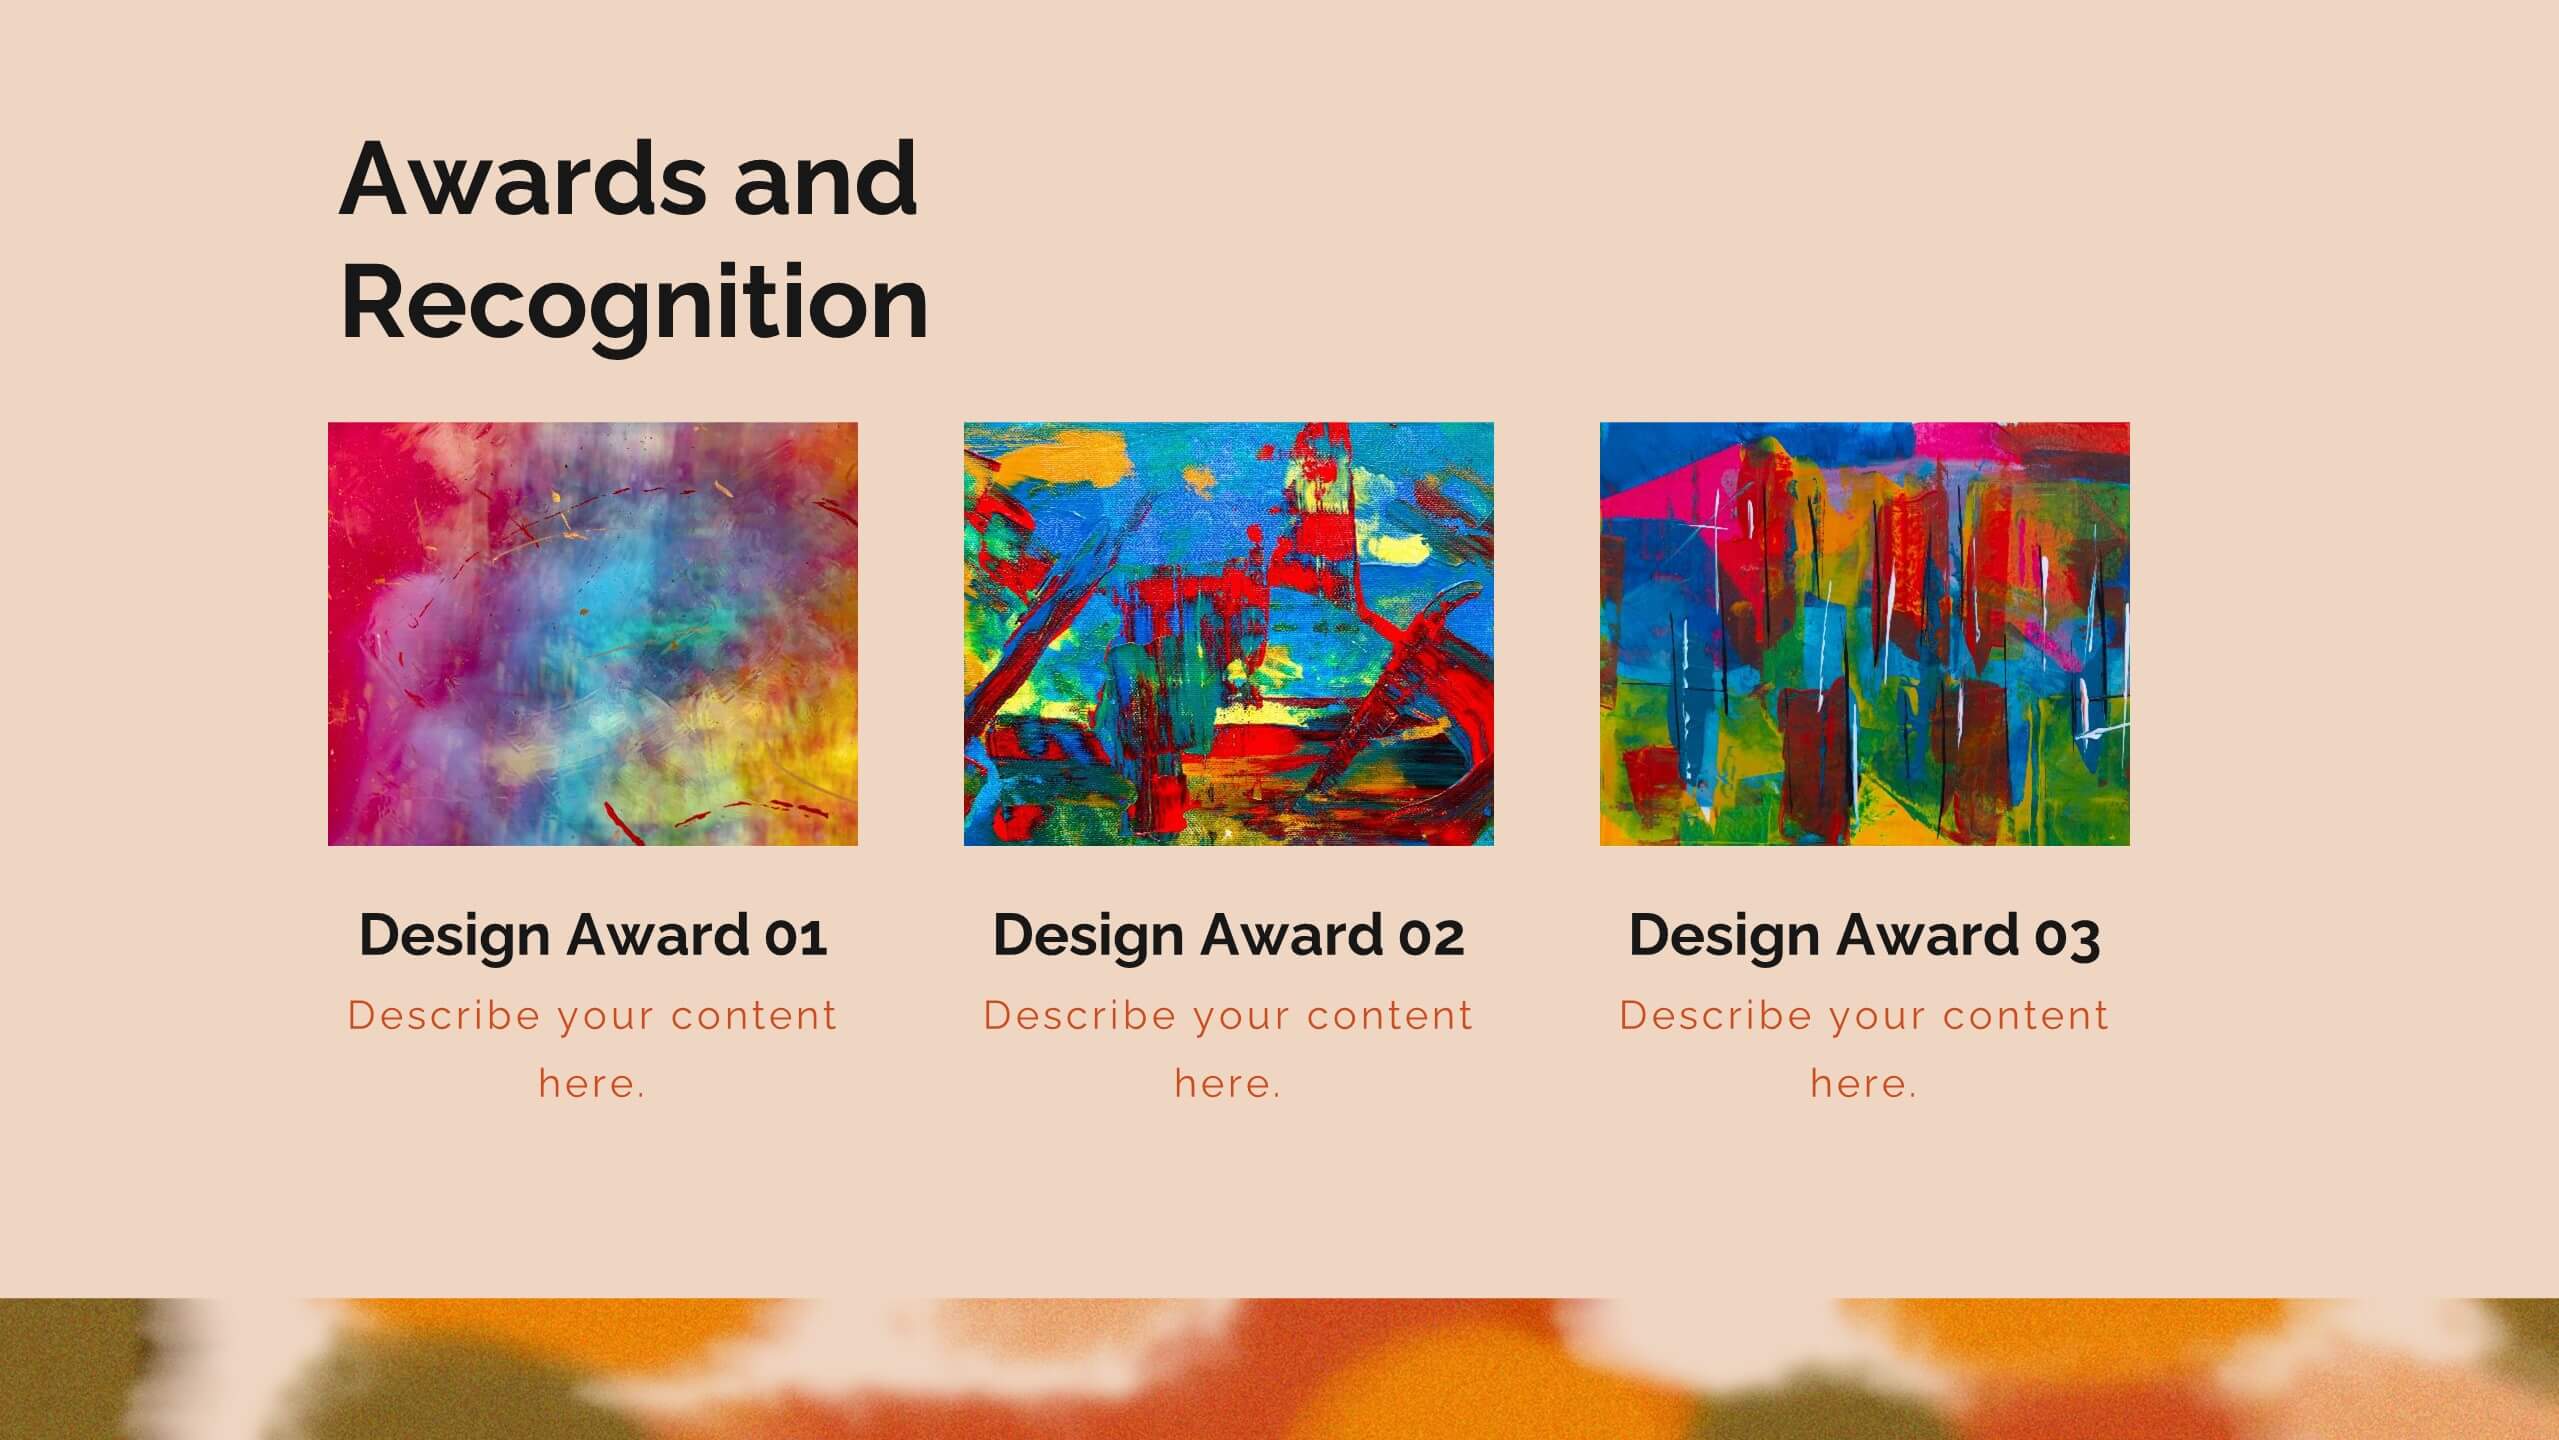
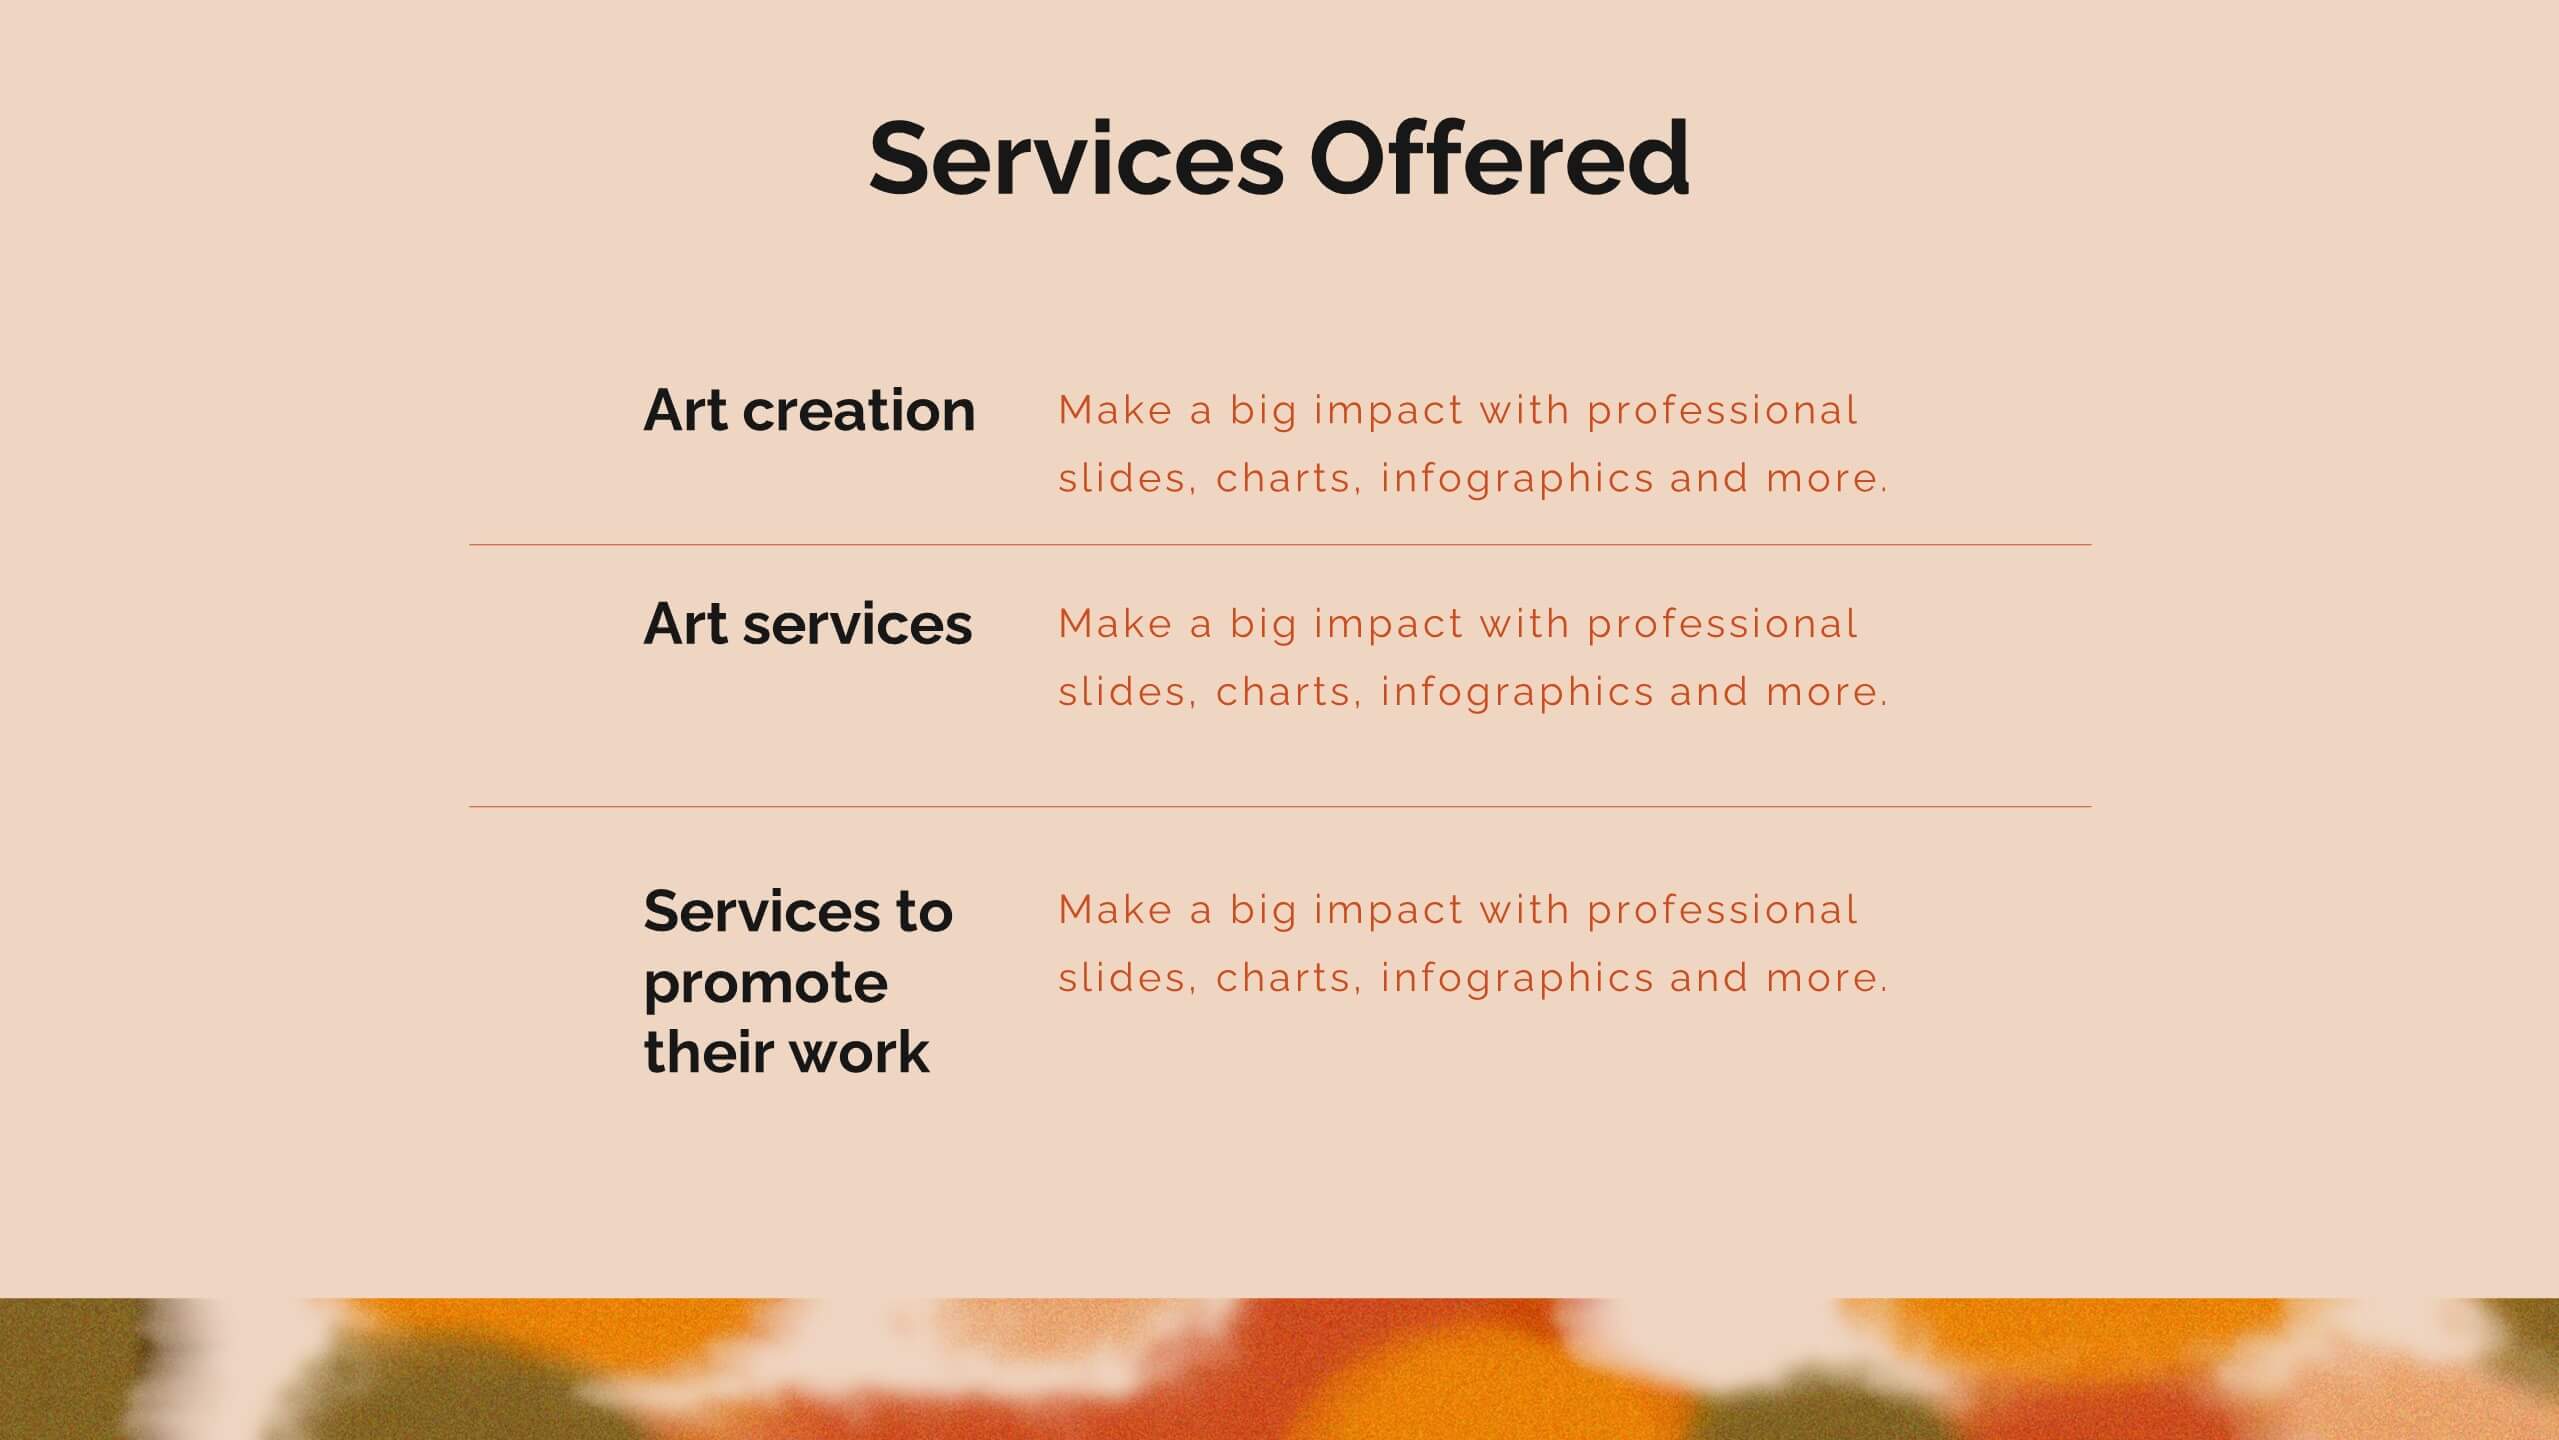
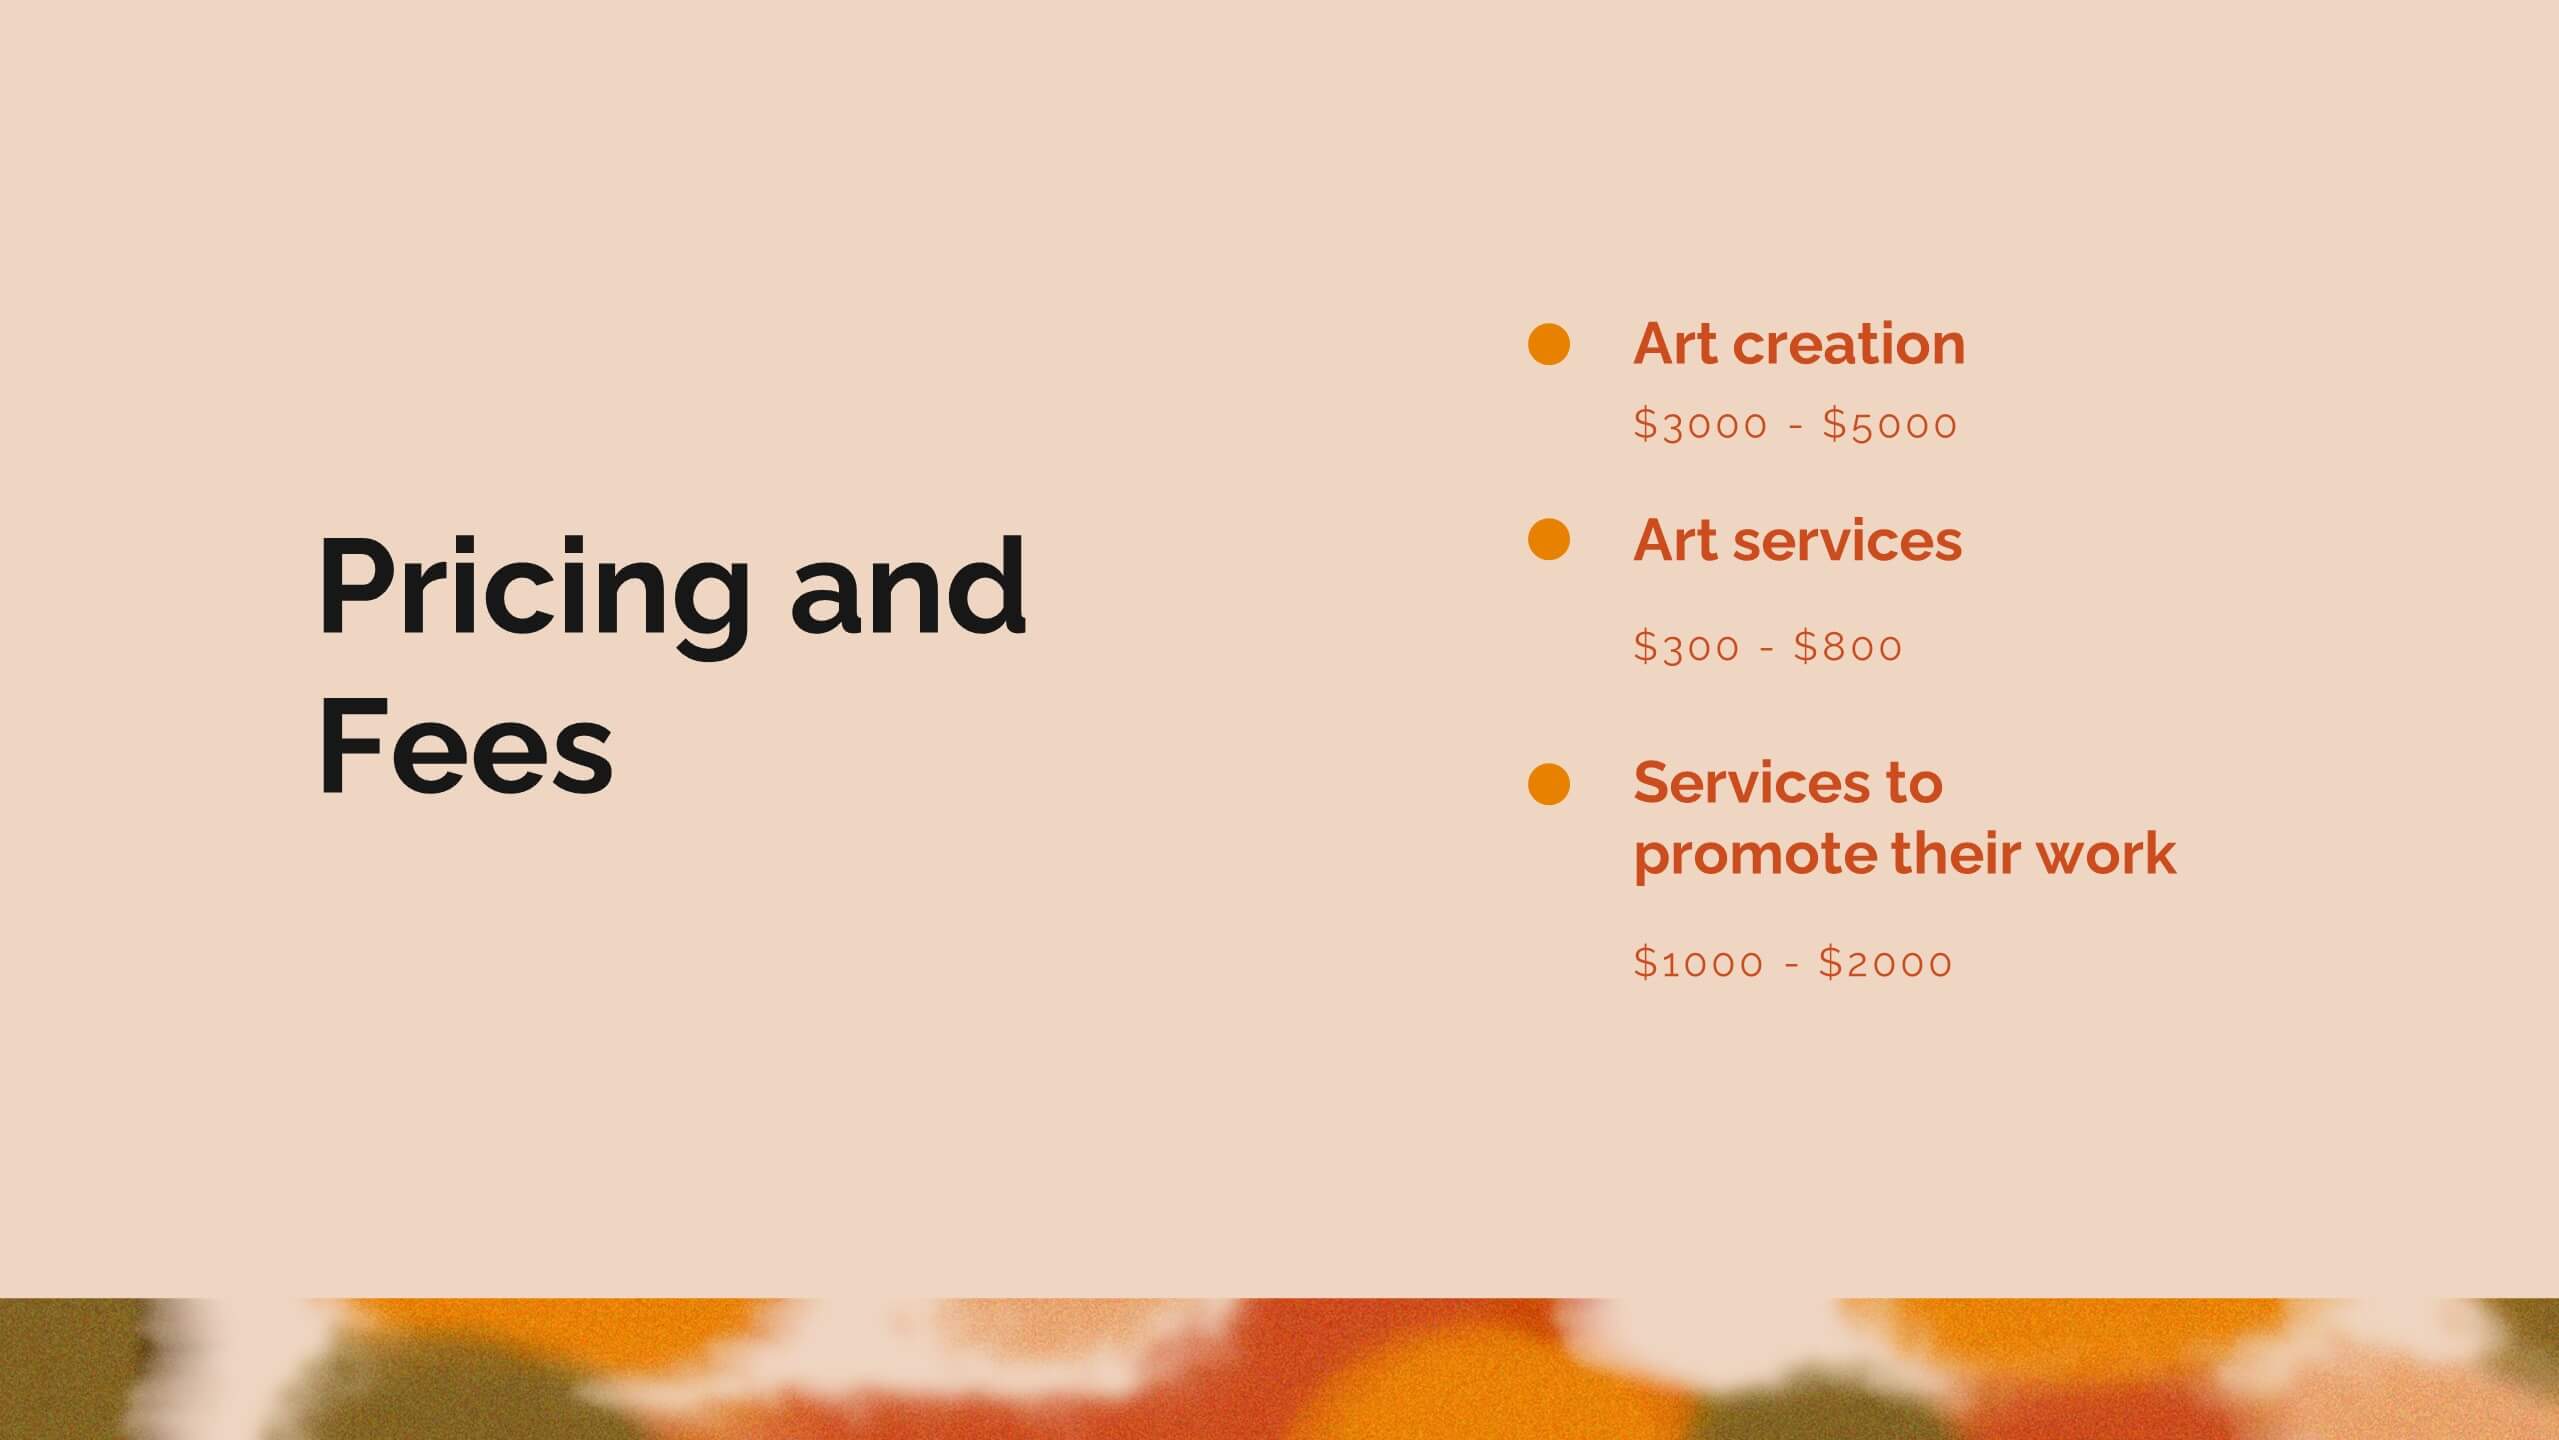
Zenith Artist Portfolio Presentation
Showcase your artistic journey with this captivating portfolio template! Perfect for presenting your projects, creative process, and client testimonials. Ideal for artists aiming to highlight their work and achievements. Compatible with PowerPoint, Keynote, and Google Slides, this template ensures your portfolio is visually stunning and professionally presented. Make your art stand out!


4 slides
Buyer Persona and Market Segmentation Presentation
Visualize ideal customer types with this engaging buyer persona template. Showcase personality traits, goals, brand affinities, and bios in a stylish format with tropical-inspired accents. Ideal for market segmentation, branding, and campaign alignment. Fully editable in PowerPoint, Keynote, and Google Slides to match your marketing strategy and presentation tone.


7 slides
Concept Development for Great Ideas Presentation
Bring your ideas to life with the Concept Development for Great Ideas Presentation. This visually engaging layout features a central lightbulb icon surrounded by six customizable segments—ideal for breaking down key phases of ideation, planning, or innovation strategy. Clean, color-coded elements help guide your audience through your thought process. Compatible with Canva, PowerPoint, Keynote, and Google Slides.


23 slides
Cloudrift UX Case Study Presentation
Present a comprehensive and visually engaging UX Case Study with this dynamic and modern template. Begin with an introduction to the design challenge, followed by detailed slides for project overviews, user research, and persona development. Highlight the user journey mapping, information architecture, and wireframing process to showcase your structured approach to solving design problems. This template offers dedicated sections for prototyping, user testing, and feedback iterations, ensuring every stage of your process is documented. Dive into critical components like interaction design, responsive design, and accessibility considerations, demonstrating your commitment to delivering user-centric solutions. Conclude with a project showcase that highlights the final product and its impact. Fully customizable and compatible with PowerPoint, Google Slides, and Keynote, this template is perfect for presenting your UX design insights with clarity and professionalism.