


Features
- 5 Unique Slides
- Fully editable and easy to edit in Microsoft Powerpoint, Keynote and Google Slides
- 16:9 widescreen layout
- Clean and professional designs
- Export to JPG, PDF or send by email


Do you have any questions?
Recommend
19 slides
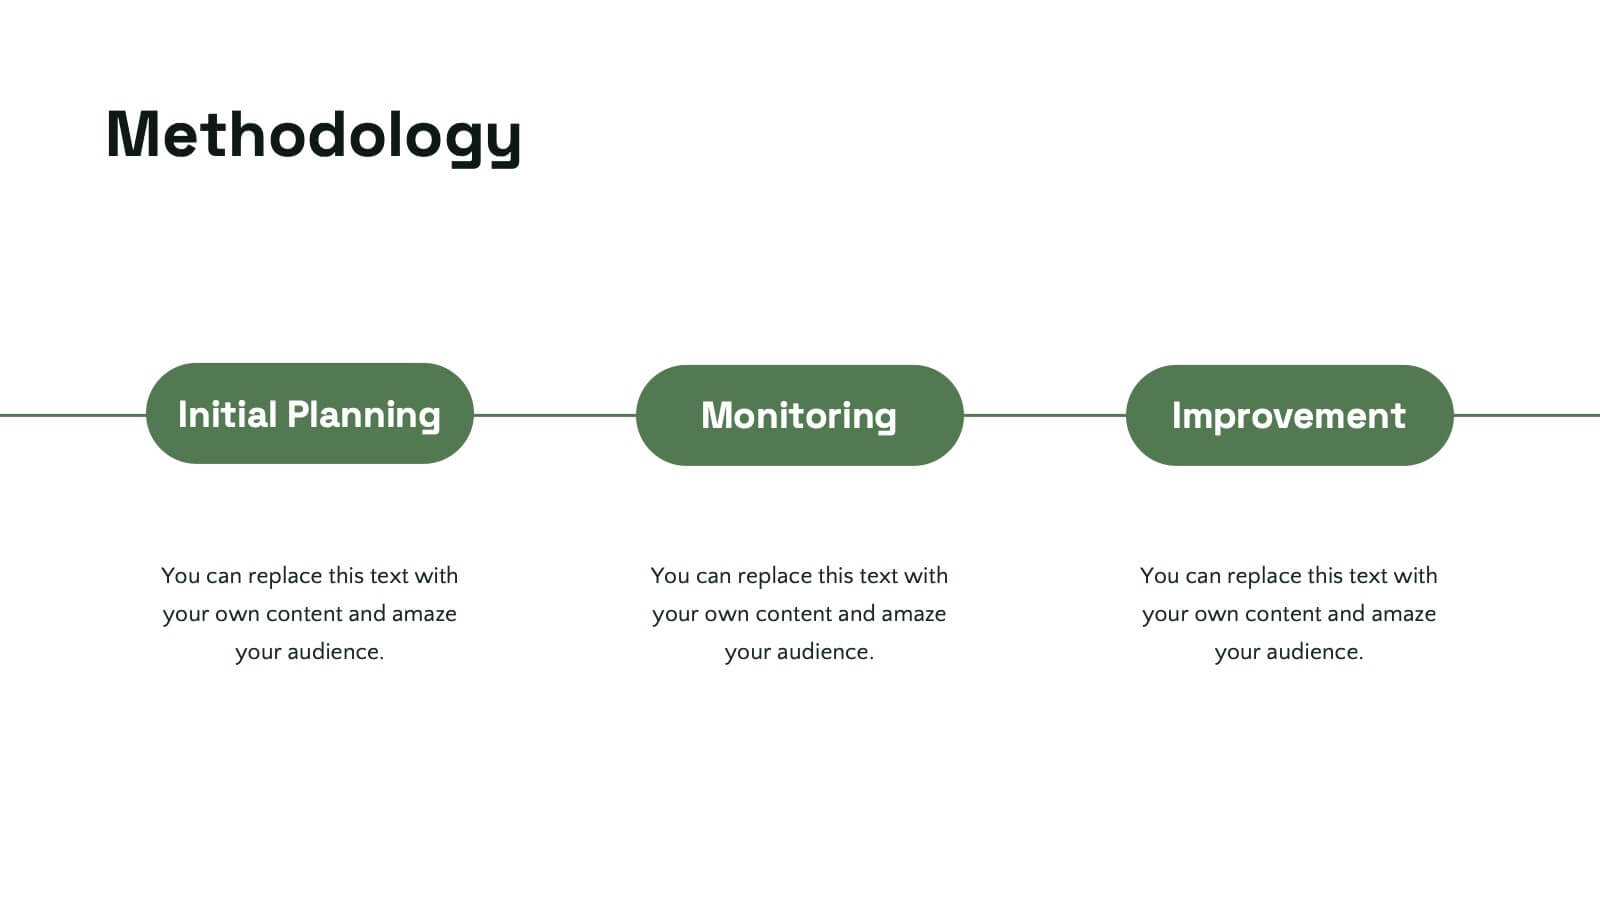
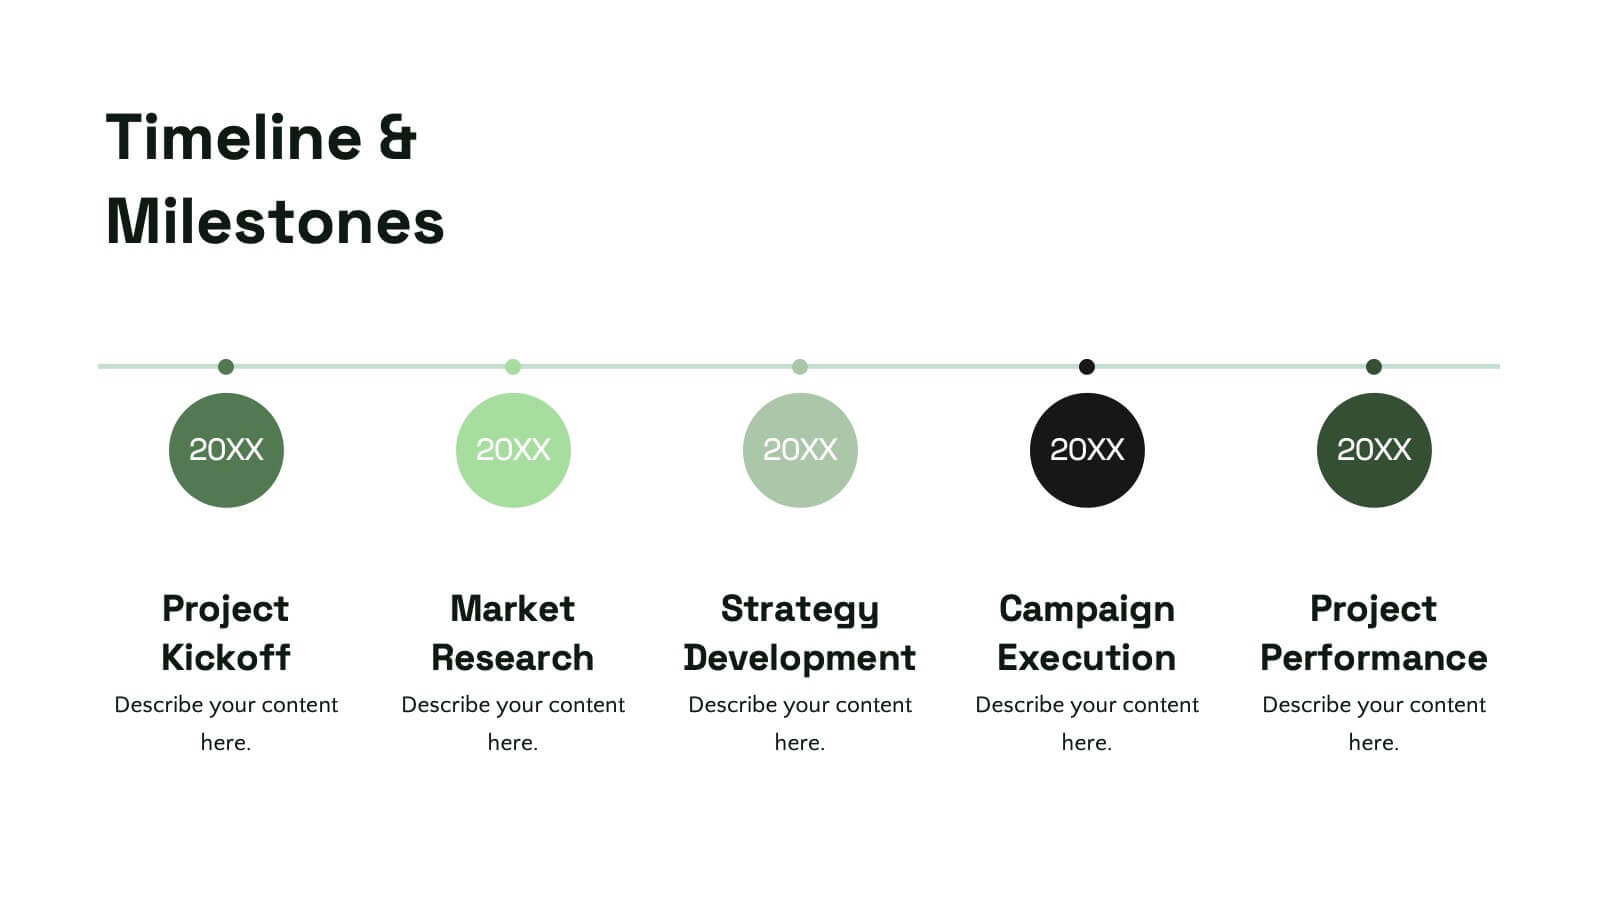
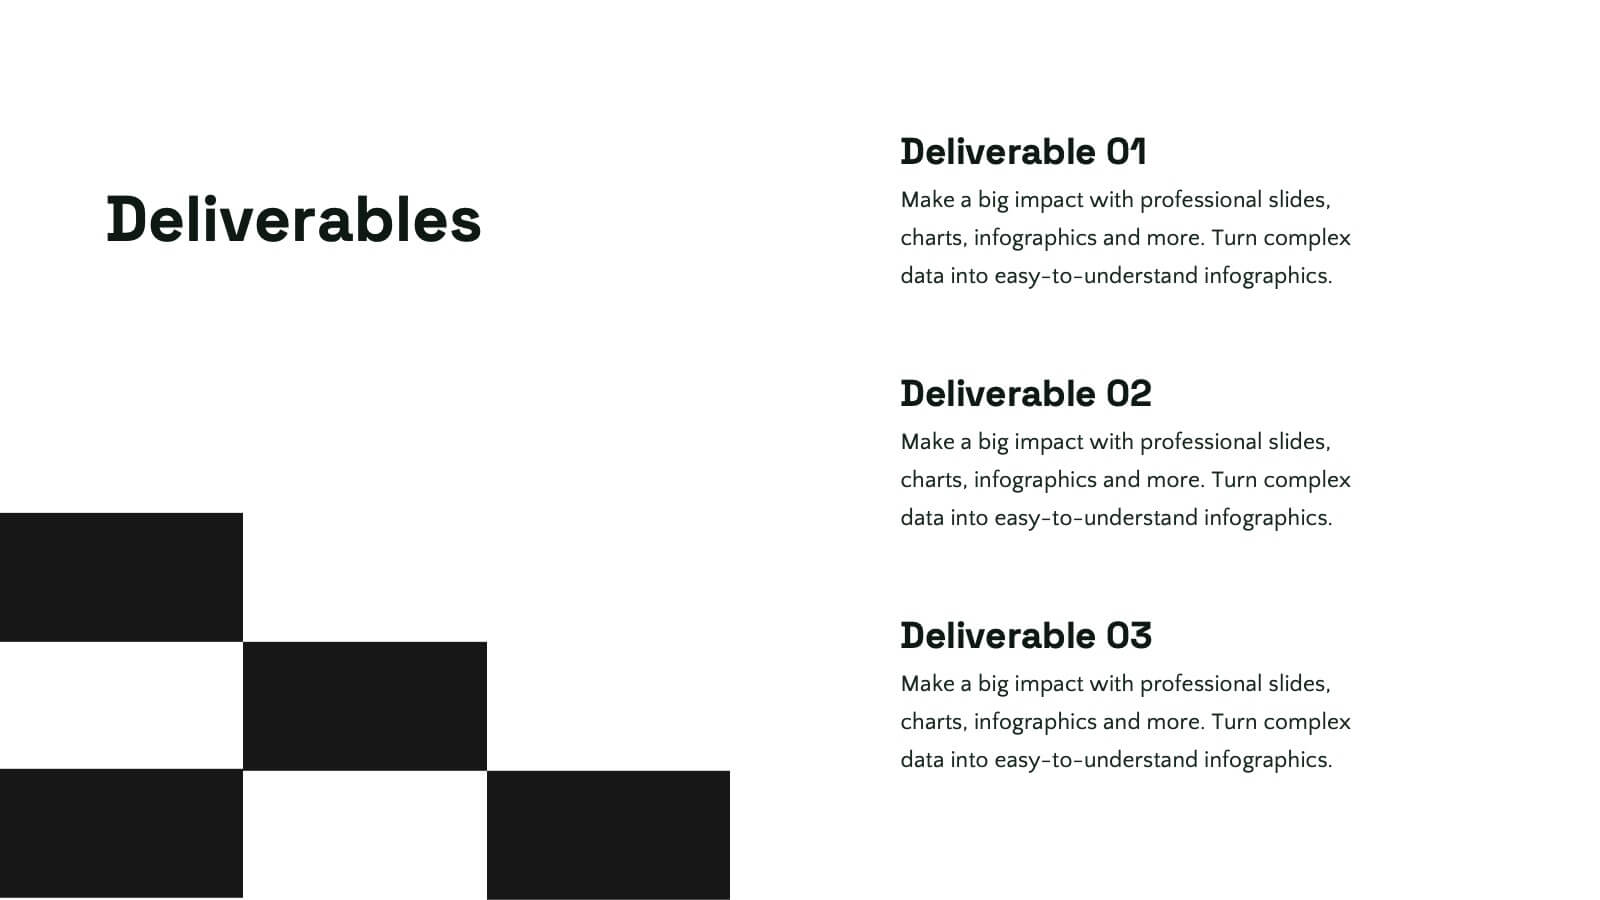
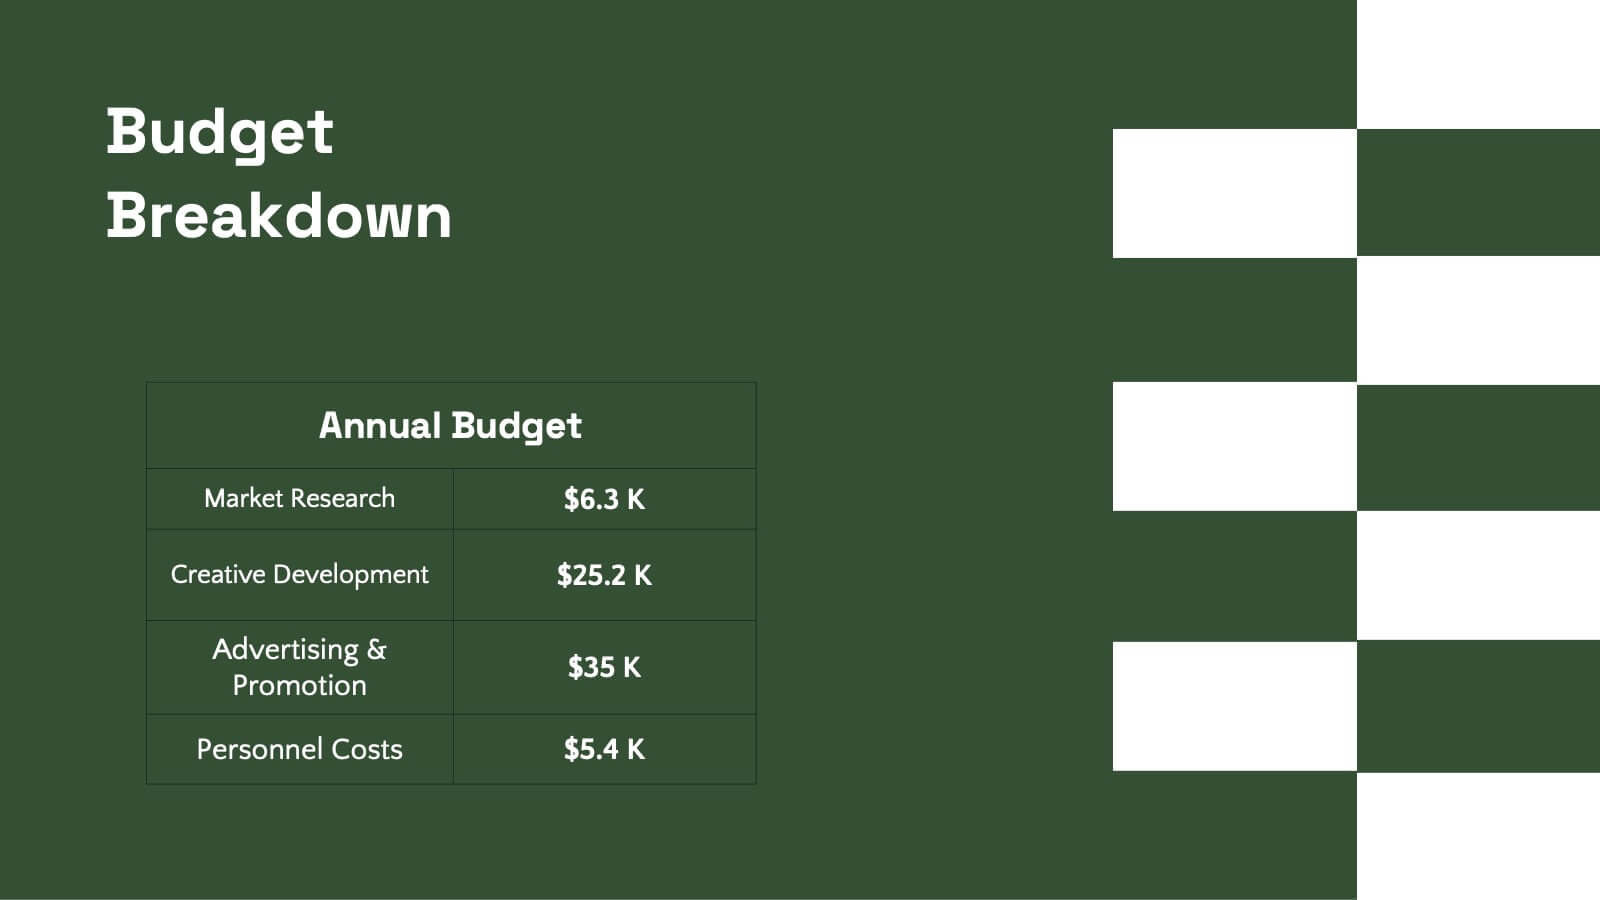
Tidal Design Proposal Presentation
Elevate your pitch with this sleek design proposal template! Perfect for presenting project details, objectives, methodology, and milestones, it ensures your ideas stand out. Impress stakeholders with clear, structured slides and professional aesthetics. Compatible with PowerPoint, Keynote, and Google Slides for a seamless presentation experience across all platforms.


21 slides
Sapphire Graphic Design Project Plan Presentation
Make your next project plan sparkle with this sleek, sapphire-inspired presentation design! This template is perfect for showcasing your graphic design project, helping you organize key milestones, timelines, and objectives. With its modern layout and clean aesthetics, your ideas will stand out beautifully. Compatible with PowerPoint, Keynote, and Google Slides.


6 slides
Hexagon Layout for Core Concepts Presentation
Present key concepts with impact using the Hexagon Layout for Core Concepts Presentation. This modular design highlights up to six core ideas in a clean, symmetrical grid—perfect for showcasing features, pillars, or foundational elements. Fully customizable and compatible with Canva, PowerPoint, Google Slides, and Keynote.


25 slides
Hollowfern Brand Identity Presentation
Showcase your brand's unique essence with this structured and visually appealing brand identity presentation template. Highlight key elements like brand values, logo design, color palettes, and typography, providing a cohesive foundation for your brand's image. Dive deeper into the brand tone, consumer personas, and competitive positioning to ensure clarity and alignment with your target audience. This template offers dedicated sections for market analysis, unique selling proposition, and brand guidelines, helping you communicate your strategy with professionalism. Whether you're crafting a social media presence, building a website, or refining packaging designs, this template empowers you to stay consistent and compelling. Fully compatible with PowerPoint, Google Slides, and Keynote, it's tailored for seamless customization and presentation across platforms.


5 slides
Economy Resumption Infographics
Economy Resumption refers to the process of restarting or restoring economic activity following a period of disruption or decline. This Infographic is a visual representations of information and data related to the economy after a disruption. They are designed to provide insights into the current state of the economy, the factors affecting its recovery, and the measures being taken to stimulate growth. This template can provide valuable insights into the state of the economy by presenting data and information in an accessible and visually engaging way. This can help decision-making and drive positive economic outcomes.


8 slides
Cost Analysis and Budgeting Presentation
Easily assess financial performance with the Cost Analysis and Budgeting Presentation template. This visually engaging slide helps break down cost structures, budget allocation, and financial comparisons in a clear and professional manner. Ideal for financial analysts, business strategists, and project managers presenting financial data. Fully editable in PowerPoint, Keynote, and Google Slides for effortless customization.


26 slides
Digital Art Tools and Techniques Presentation
Unleash your creativity with this vibrant presentation on digital art tools and techniques. Covering essential topics like graphic design software, digital brushes, layering methods, and creative workflows, this template helps artists and designers enhance their skills. Fully customizable and compatible with PowerPoint, Keynote, and Google Slides for a seamless and visually stunning presentation experience.


5 slides
Smart Decision Making Models Presentation
Make complex choices simple with this modern and colorful template designed to visualize analytical thinking and structured planning. Ideal for presenting frameworks, strategies, or goal-setting models, it helps communicate logic and clarity effectively. Fully compatible with PowerPoint, Keynote, and Google Slides for smooth customization and presentation delivery.


4 slides
Task Management Checklist Presentation
Stay organized and boost productivity with the Task Management Checklist template. This structured design helps you categorize tasks into Do’s and Don’ts, ensuring a clear workflow for efficient task execution. Fully editable and compatible with PowerPoint, Keynote, and Google Slides, making it perfect for teams and professionals alike.


8 slides
Early Detection and Prevention of Breast Cancer Presentation
Take a proactive approach to health with the Early Detection and Prevention of Breast Cancer template, designed to emphasize essential awareness and prevention strategies. This template, compatible with PowerPoint, Keynote, and Google Slides, uses intuitive icons and a clean design to effectively communicate key prevention measures and screening importance, ideal for healthcare seminars and community health initiatives.


7 slides
Roadmap Guide Infographic
A roadmap guide is a visual representation of the steps you need to take in order to reach your destination. A roadmap infographic is a great way to show your clients what the future will look like. Use this template to create an infographic that's high-energy, enthusiastic, and engaging. This infographic is designed to help guide you by showing where you are now, what direction you're going, and where you need to go next. This template is fully customizable and compatible with Powerpoint, Keynote, and Google Slides. Break down complex plans into easily digestible visual elements.


10 slides
Creative Business Pitch Deck Presentation
Make your ideas stand out with a presentation that blends creativity and professionalism. Perfect for entrepreneurs and teams showcasing innovative business concepts, it helps structure your pitch with clarity and impact. Fully customizable and compatible with PowerPoint, Keynote, and Google Slides for seamless editing and polished results.


5 slides
Innovative Business Solutions Presentation
Elevate your strategy discussions with the Innovative Business Solutions template, providing a visually engaging framework designed to present complex business solutions clearly and effectively. It features a unique puzzle design that integrates up to five key business insights, ensuring each piece contributes to a holistic understanding of strategies or solutions. It is compatible with PowerPoint, Keynote and Google Slides, providing flexibility and ease of use across different platforms.


6 slides
5-Step Implementation for Business Growth Presentation
Present your strategic plan with clarity using the 5-Step Implementation for Business Growth Presentation. This horizontal arrow layout guides your audience through five key phases of execution—from planning to final results. Each step is clearly numbered and color-highlighted for visual flow. Fully editable in PowerPoint, Keynote, Google Slides, and Canva.


4 slides
Sustainable Farming Practices Presentation
Explore the essentials of sustainable farming with our visually engaging presentation template. Perfect for educational and advocacy purposes, it outlines key practices that promote environmental sustainability in agriculture. This template features easy-to-understand graphics and placeholders for comprehensive discussions on eco-friendly farming techniques.


5 slides
Ishikawa Fishbone Diagram Presentation
Bring clarity to problem-solving with a visual that makes root-cause analysis feel simple and intuitive. This presentation helps you map issues, organize insights, and highlight contributing factors with clean, structured design. Perfect for workshops, audits, and process improvement. Fully compatible with PowerPoint, Keynote, and Google Slides.


6 slides
School Goals and Administration Presentation
Visualize key academic priorities with this notebook-style layout, perfect for school administrators and teachers. Featuring colorful pushpin markers and a two-page spread, this template is great for outlining goals, responsibilities, or class guidelines. Fully editable in PowerPoint, Keynote, and Google Slides for customized, classroom-ready presentations.