


Features
- 5 Unique slides
- Fully editable and easy to edit in Microsoft Powerpoint, Keynote and Google Slides
- 16:9 widescreen layout
- Clean and professional designs
- Export to JPG, PDF or send by email


Do you have any questions?
Recommend


7 slides
Smile Rating Importance Infographic Presentation
Smile Rating is a metric used in customer service to measure the level of customer satisfaction or happiness with a particular experience, interaction or service. This template will help you make a vibrant, friendly and original presentation. This smile rating infographic is easy to use and customize. It is fully editable and the layout allows you to personalize it. This template can be edited in PowerPoint, Keynote, and Google Slides. This is perfect for business presentations, strategic planning, idea-sharing sessions or just a fun way to share your thoughts on this design topic.


5 slides
Optimized Process Flow Diagram Presentation
Streamline workflows with the Optimized Process Flow Diagram. This professional template visualizes key business processes for efficient decision-making and execution. Designed for project managers, analysts, and strategists, it ensures a clear, structured overview of sequential steps. Fully editable and compatible with PowerPoint, Keynote, and Google Slides.


5 slides
Iceberg Model Diagram Presentation
Visualize surface issues and deeper underlying factors with this Iceberg Model Diagram Template. Perfect for presentations on behavior analysis, root cause, or systems thinking. Each layer is clearly marked with colorful labels and matching text areas. Fully editable in PowerPoint, Keynote, and Google Slides for streamlined, impactful communication.


5 slides
Editable RACI Chart Presentation
Streamline your team’s responsibilities with this clean and easy-to-use RACI chart template! Perfect for project managers, this presentation helps define who is Responsible, Accountable, Consulted, and Informed for each task. Simplify workflows, boost collaboration, and keep everyone aligned. Fully editable and compatible with PowerPoint, Keynote, and Google Slides for seamless customization.


6 slides
Market Expansion Strategy with Asia Map Presentation
Explore new business frontiers with the Market Expansion Strategy with Asia Map template, your strategic platform for analyzing and expanding market presence across Asia. This presentation is designed to guide businesses through the complexities of Asian market landscapes. Featuring an integrated Asia map and designated spaces for in-depth insights, this template is ideal for corporate strategists and market analysts. It supports PowerPoint, Keynote and Google Slides for versatile presentation options.


6 slides
Business Growth with TAM SAM SOM Framework
Fuel your next big idea with a clear, structured breakdown of market potential. This easy-to-follow visual helps explain the TAM, SAM, and SOM layers of business growth—ideal for investors, strategy teams, or product managers. Fully editable in PowerPoint, Keynote, and Google Slides for fast, seamless presentation design.


26 slides
Modern Company Profile Striped Presentation
Present your company with style, our modern company profile presentation, is the perfect template to showcase your business in a contemporary and stylish way. This template combines professionalism with a touch of flair and striped elements, making it ideal for modern businesses looking to make a lasting impression. Ideal for tech startups, creative agencies, or a professional service firms, this presentation will help you convey your company's professionalism. Fully customizable and compatible with Powerpoint, Keynote, and Google Slides. This makes it easy for potential clients, partners, and investors to reach out!


6 slides
Decision-Making Using Tree Diagrams Presentation
Clarify complex decisions with the Decision-Making Using Tree Diagrams Presentation. This slide design features a clear, hierarchical structure that helps visualize choices, outcomes, and decision paths step by step. Perfect for business strategy, risk analysis, or logic-based planning. Fully editable in PowerPoint, Keynote, and Google Slides.


6 slides
Roles and Responsibilities for Teams Presentation
Clearly outline team functions with this roles and responsibilities presentation. Highlight up to five individual positions using intuitive icons and clean visual layouts. Perfect for onboarding, team structuring, or project assignments. Fully editable in PowerPoint, Keynote, and Google Slides—ideal for aligning expectations and improving team collaboration across departments or initiatives.


4 slides
Ishikawa Diagram for Process Review Presentation
Visualize cause-and-effect relationships with the Ishikawa Diagram for Process Review Presentation. Also known as a fishbone diagram, this template is perfect for identifying potential root causes during quality control or team brainstorming sessions. Easily editable in Canva, PowerPoint, and Google Slides to match your workflow and style.


22 slides
Quirinus Investor Pitch Presentation
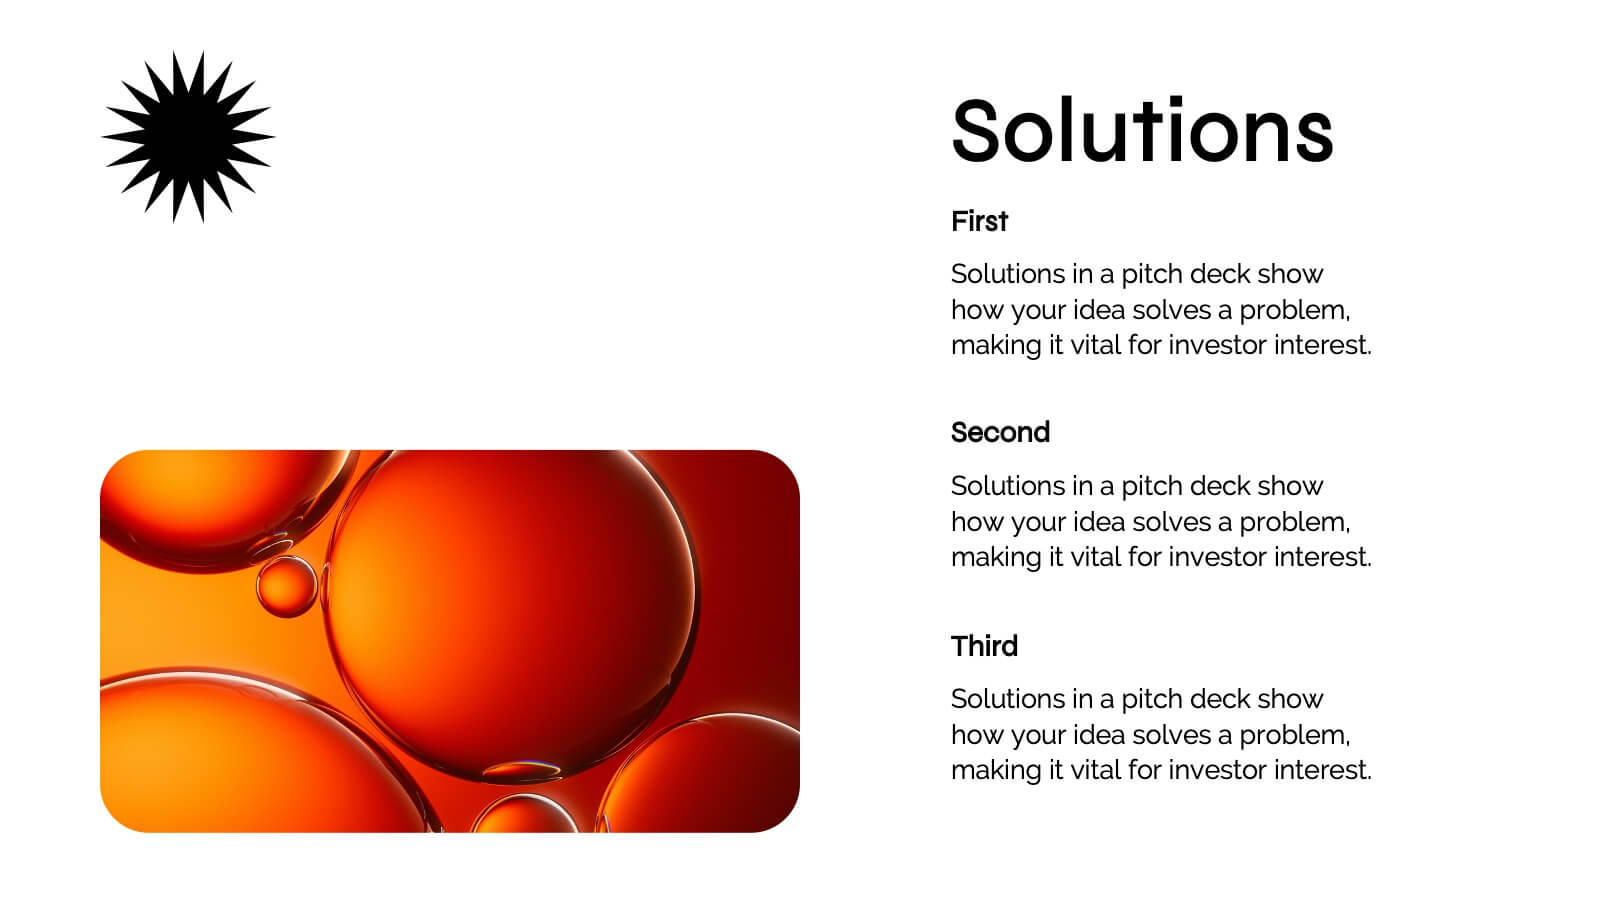
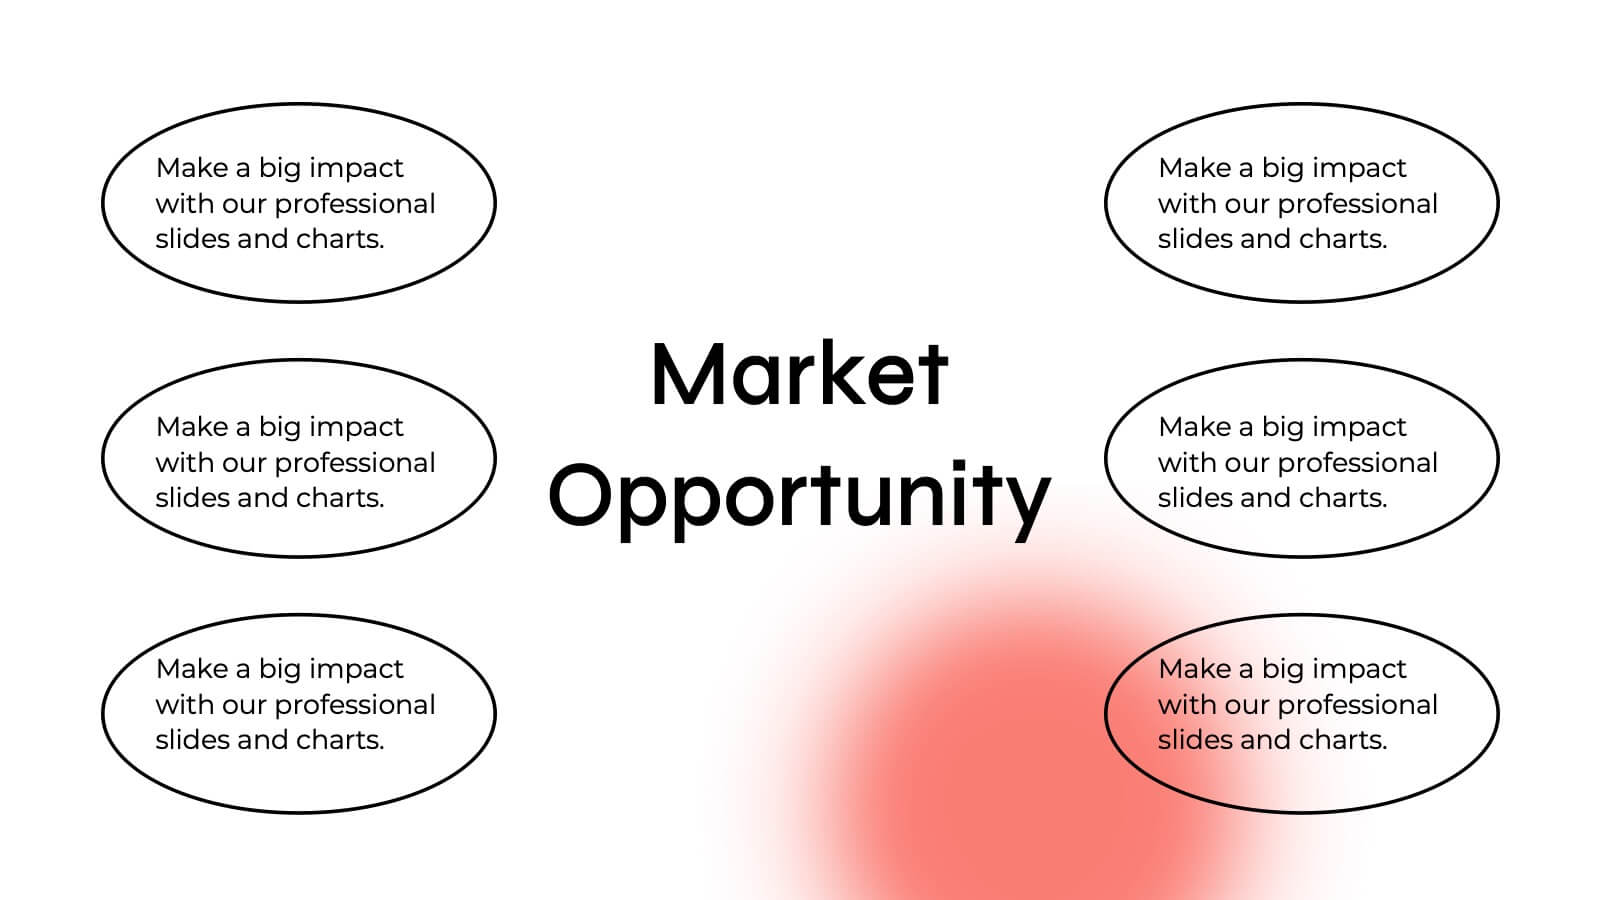
Ready to impress investors and stakeholders? This sleek and modern pitch deck template covers all the essentials, from problem statements and market opportunities to revenue models and growth projections. Each slide is designed to convey clear and compelling information for maximum impact. Fully compatible with PowerPoint, Keynote, and Google Slides, making it the perfect tool for your next product launch!


5 slides
AI for Business Innovation Presentation
The "AI in Business" presentation template showcases how AI can be applied across different business processes. It features a friendly robot icon that creatively represents AI's role in modern business, making it visually engaging. The four connected nodes A, B, C, and D likely detail specific applications or case studies of AI in business, such as data analysis, automation, customer interaction, and innovation. This layout is excellent for presentations that aim to explain complex technological implementations in a straightforward and accessible manner, perfect for corporate training or stakeholder briefings.


5 slides
Revenue Streams & Expense Management Layout Presentation
Visualize your income and costs with the Revenue Streams & Expense Management Layout Presentation. This slide layout uses a vertical arrow chart to display four data categories, ideal for comparing sources of income and related expenditures. Great for financial reports, budgeting reviews, and strategy discussions. Compatible with Canva, PowerPoint, Google Slides, and Keynote.


6 slides
Customer Loyalty Rewards Structure Presentation
Illustrate your brand’s customer retention strategy with the Customer Loyalty Rewards Structure presentation. This visually engaging template highlights reward tiers, perks, and loyalty card systems—perfect for showcasing how customers earn incentives over time. Ideal for marketing teams, retail businesses, and loyalty program proposals. Fully editable in PowerPoint, Keynote, and Google Slides.


6 slides
Problem-Solving Framework for Business Success Presentation
Streamline your approach to complex challenges with this 6-step business problem-solving framework. This professional slide layout clearly separates each stage—from identifying the issue to implementing solutions—using easy-to-edit circular markers and concise content boxes. Ideal for consulting pitches, internal planning, or strategy development, this slide is fully customizable in PowerPoint, Keynote, and Google Slides.


6 slides
Informational Data Table Overview Presentation
Present your tasks with clarity using this Informational Data Table Overview presentation. Perfect for team planning, status updates, or project management, this slide helps you organize tasks by name, due date, priority, and assignment. Visual indicators make it easy to track progress at a glance. Fully editable in PowerPoint, Canva, and Google Slides.


5 slides
Team Communication and Info Sharing Presentation
Keep your team aligned and informed with this clear, visual communication flow template. Designed to illustrate how information moves between individuals or departments, it helps teams optimize collaboration and transparency. Great for onboarding, project handoffs, or workflow discussions. Fully compatible with PowerPoint, Keynote, and Google Slides.