


Features
- 10 Unique slides
- Fully editable and easy to edit in Microsoft Powerpoint, Keynote and Google Slides
- 16:9 widescreen layout
- Clean and professional designs
- Export to JPG, PDF or send by email


Do you have any questions?
Recommend


7 slides
Business Process in Step-by-Step Presentation
Streamline operations with the Business Process in Step-by-Step presentation. This structured template breaks down complex workflows into clear, actionable steps, enhancing clarity and decision-making. Perfect for project planning, strategy execution, and workflow optimization. Fully customizable in PowerPoint, Keynote, and Google Slides for seamless presentation delivery.


21 slides
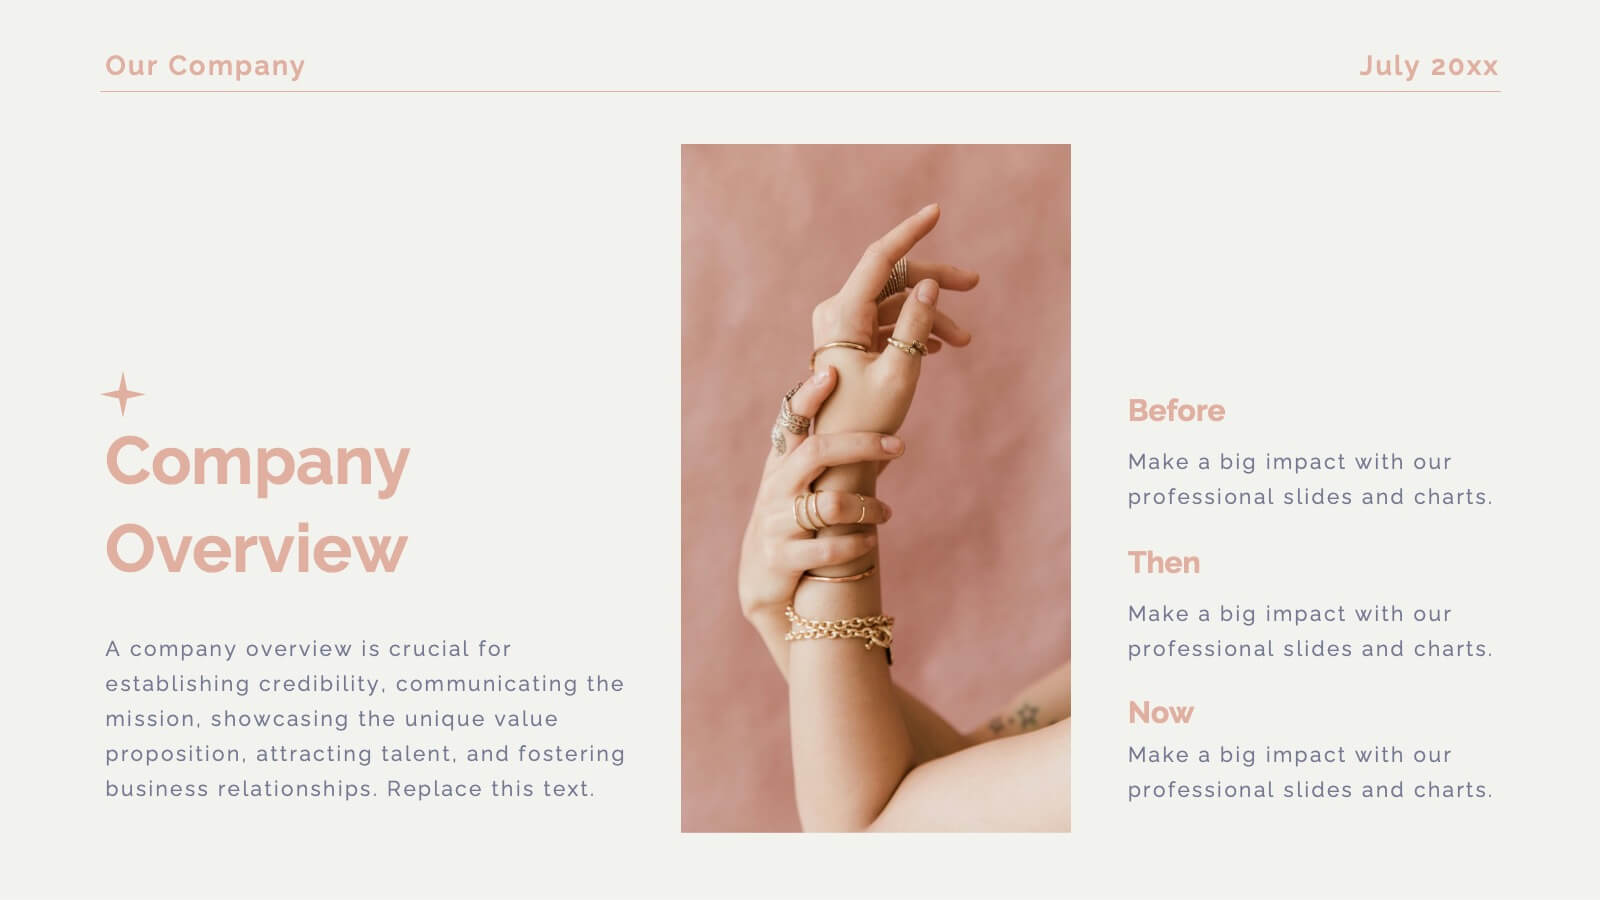
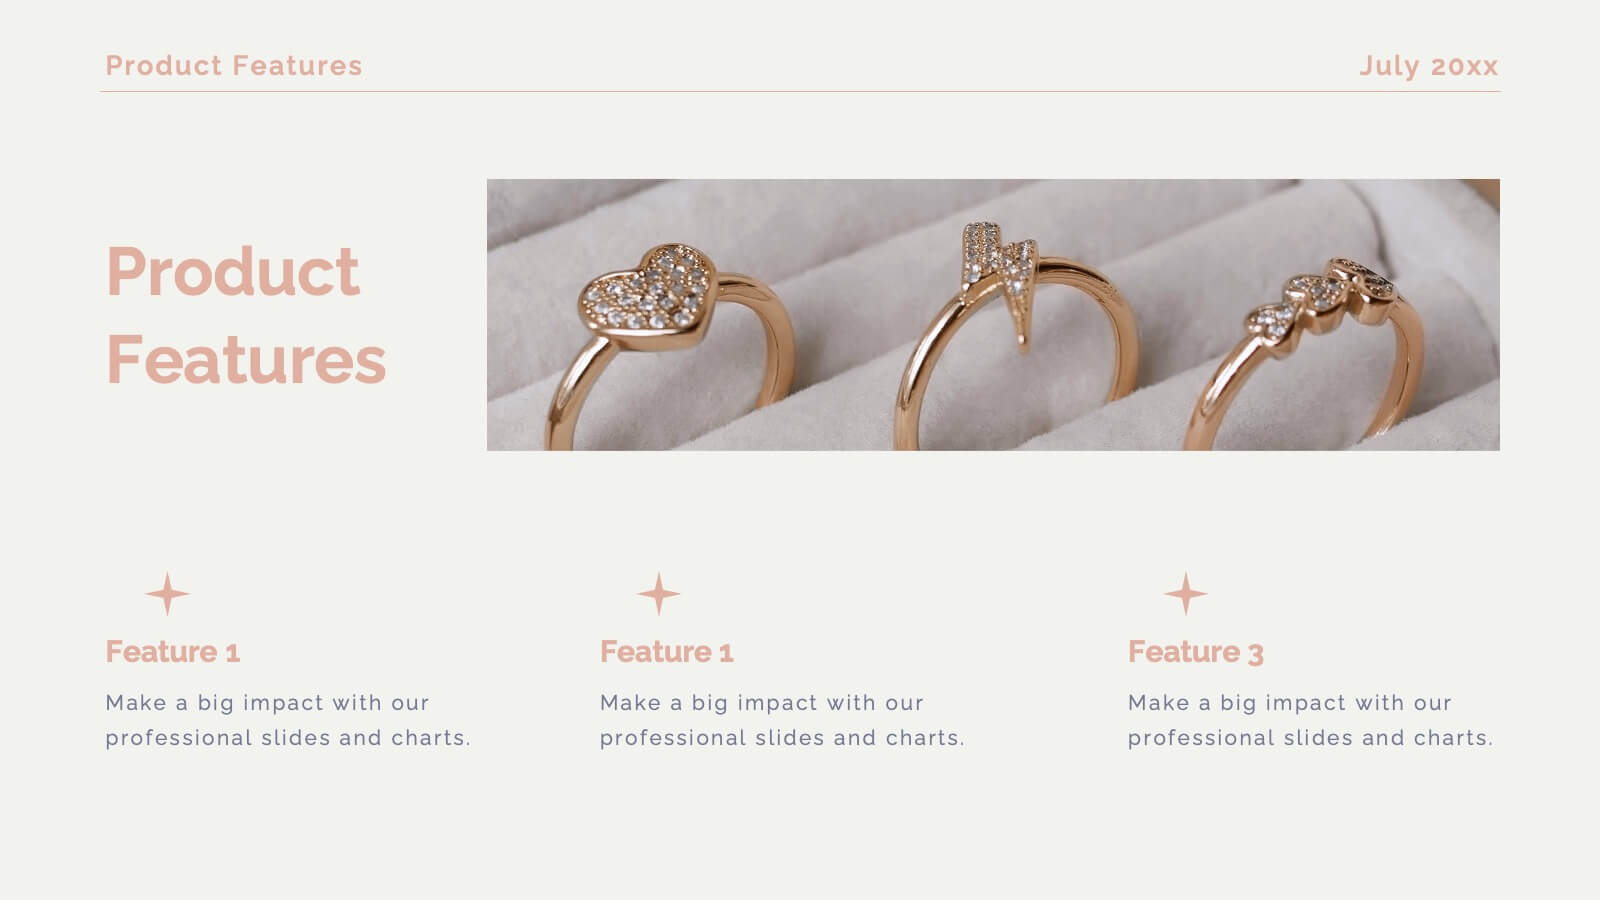
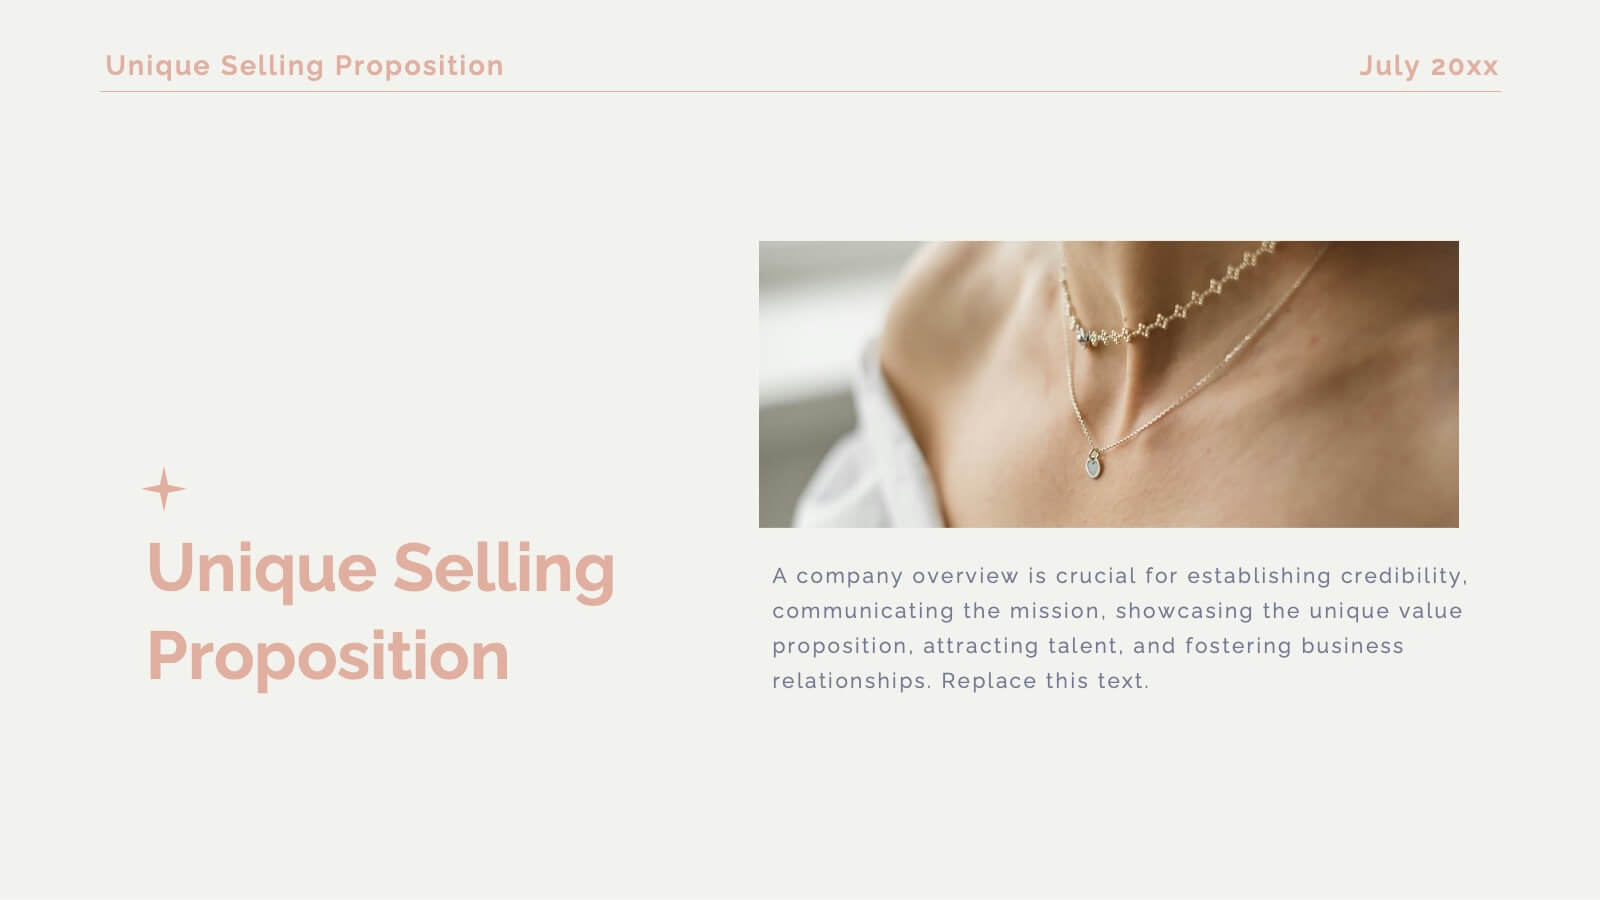
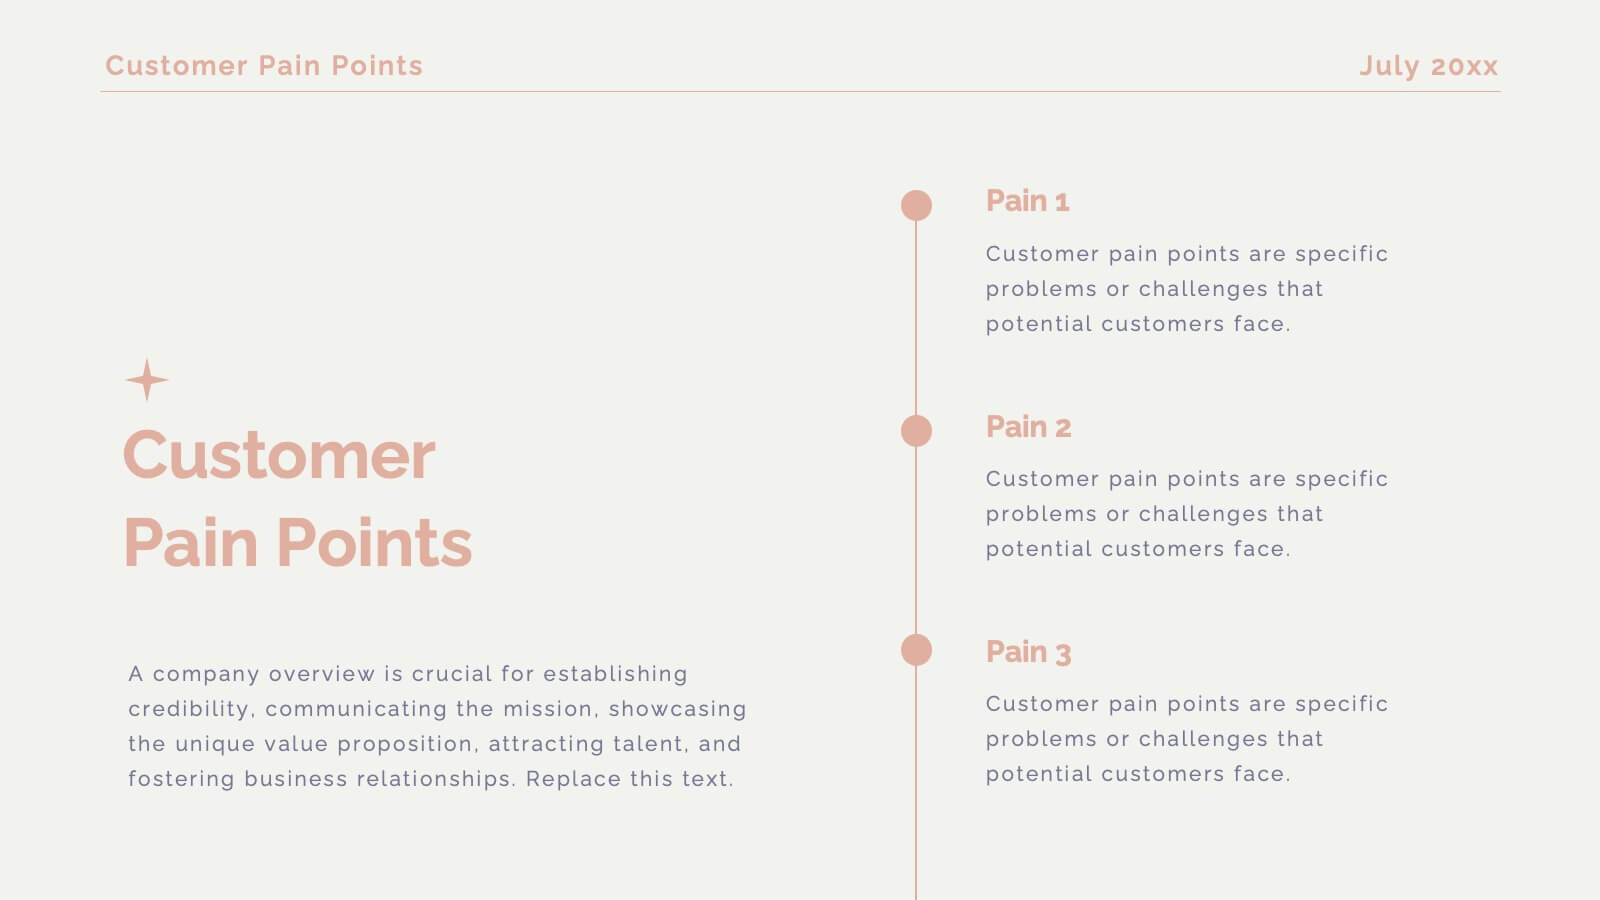
Company Overview Presentation
Deliver a comprehensive company overview with this Company Overview presentation template. It includes structured slides covering the introduction, history, mission, team, market presence, and competitive landscape. Ideal for engaging stakeholders, this template also features sections on financial highlights and corporate social responsibility. Compatible with PowerPoint, Keynote, and Google Slides, it's perfect for detailed corporate presentations.


20 slides
Legacy Product Launch Presentation
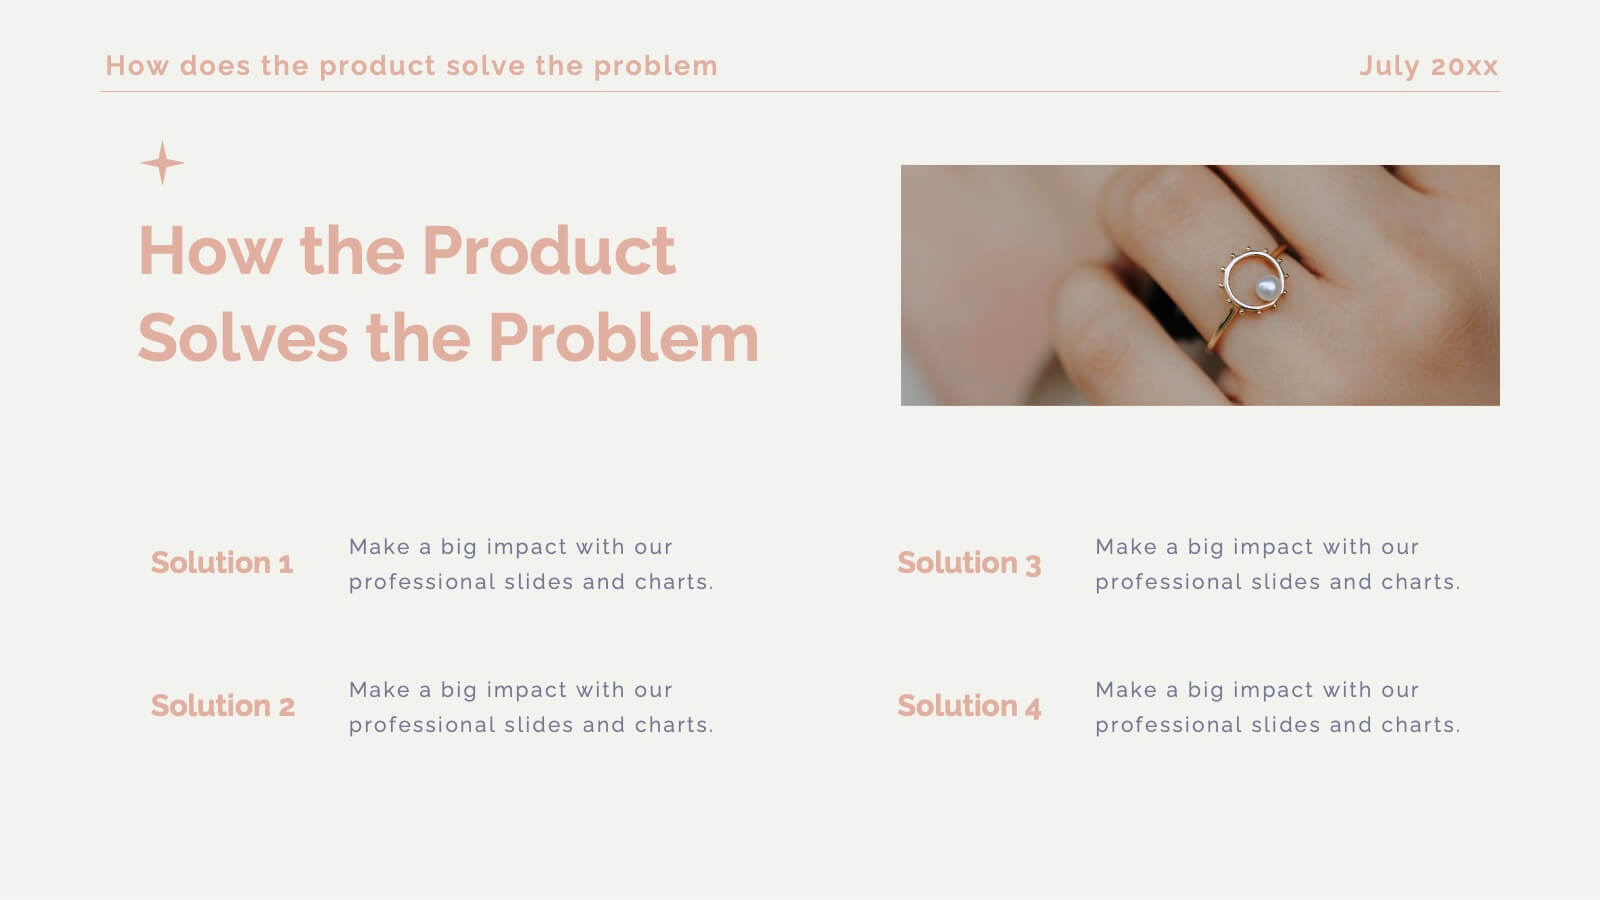
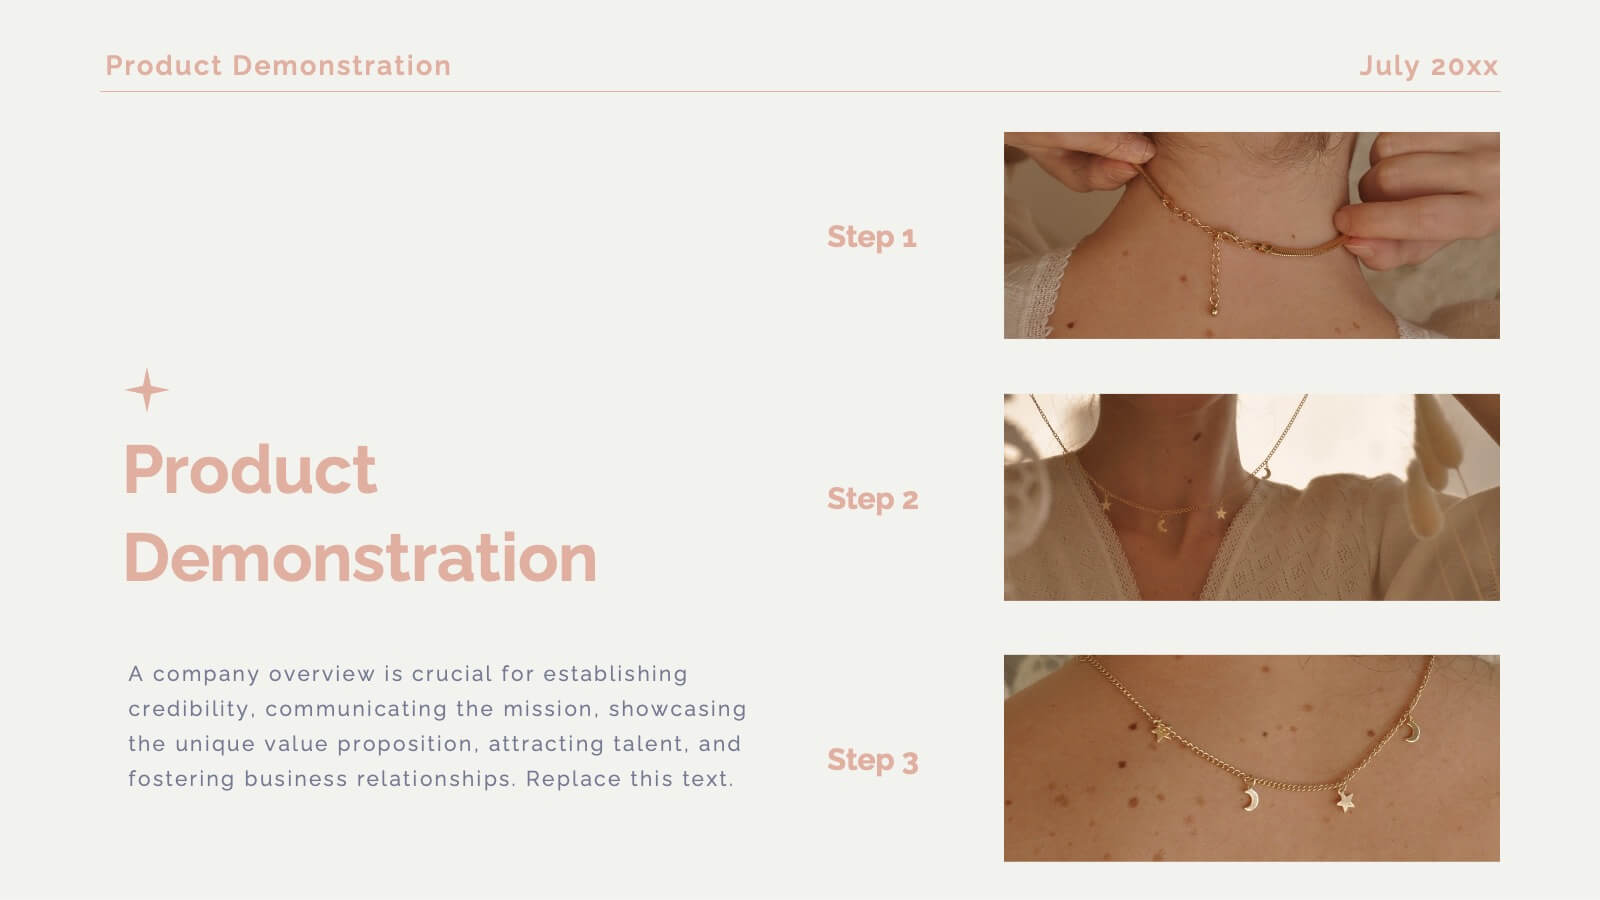
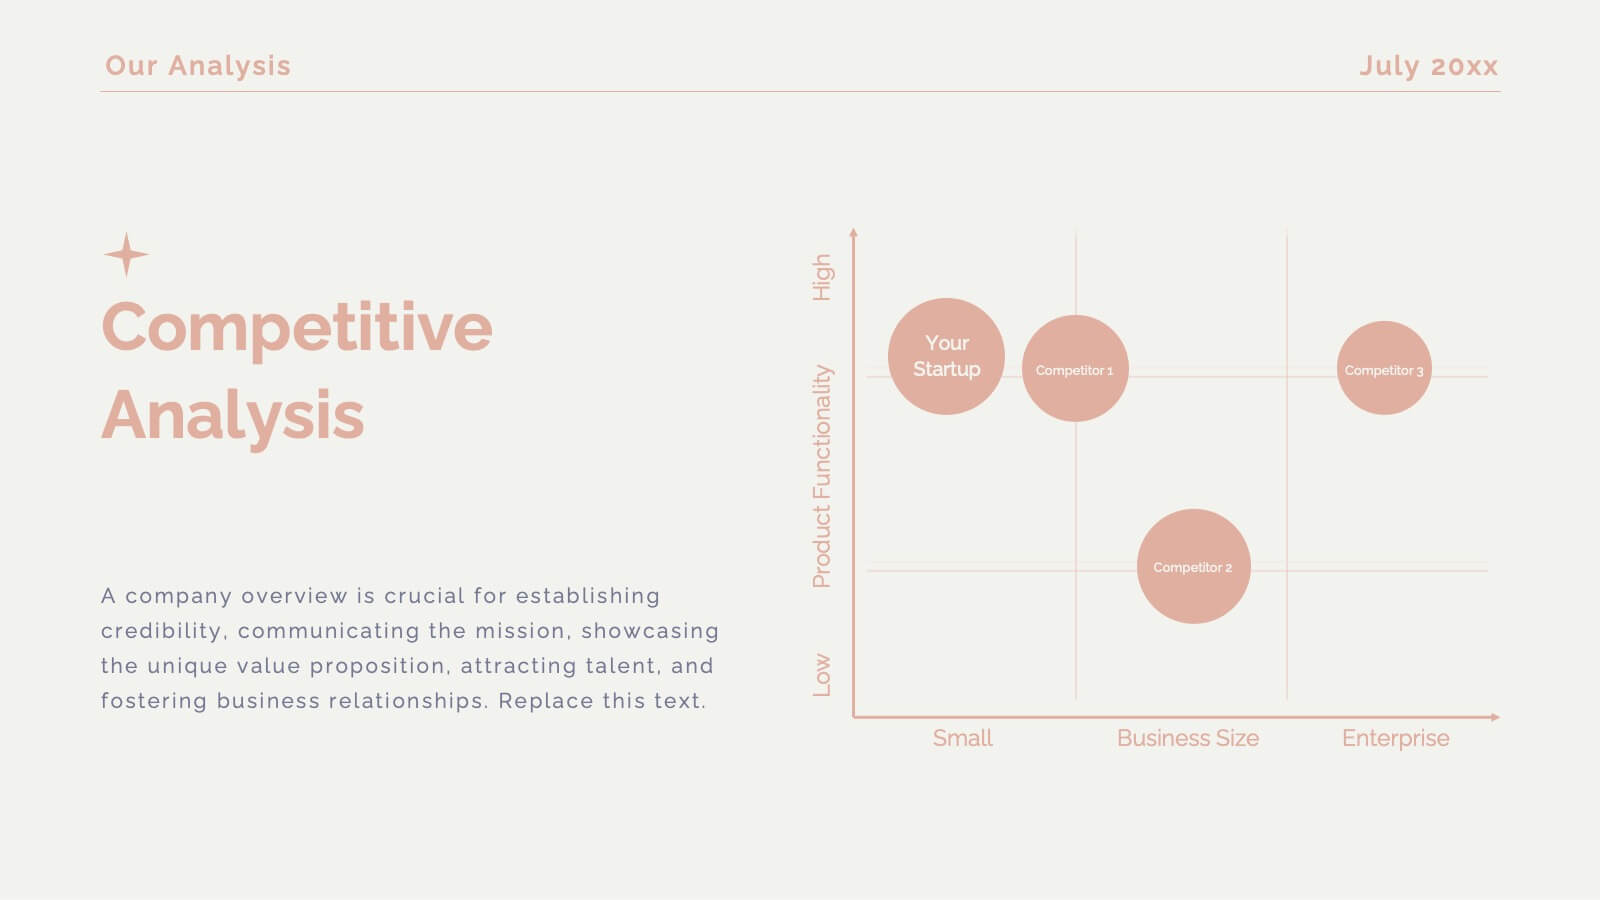
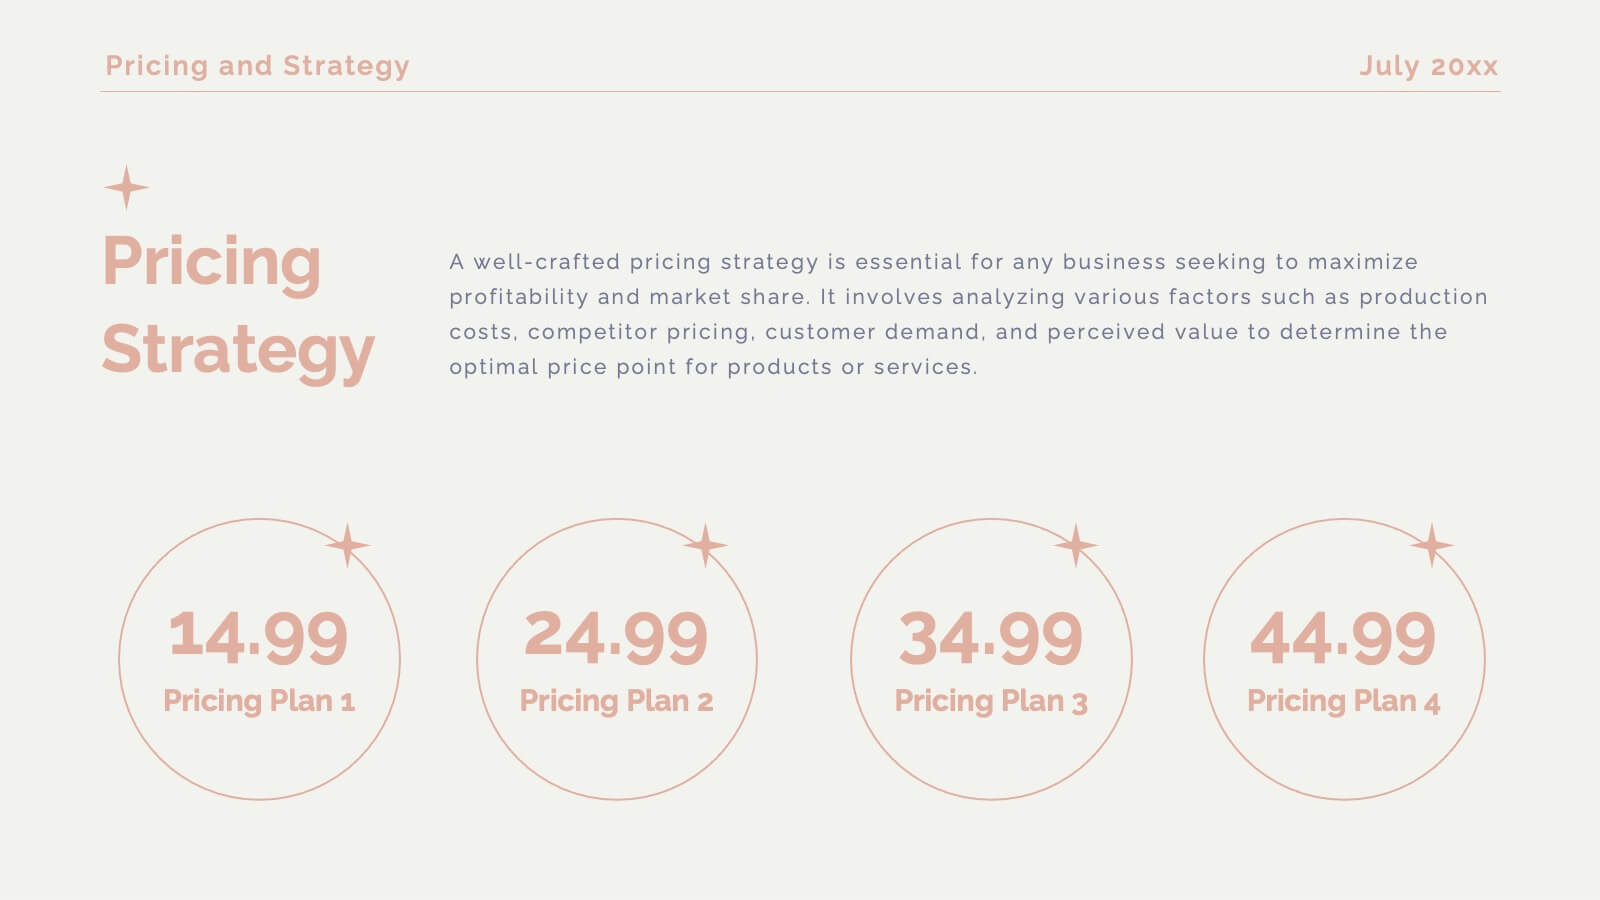
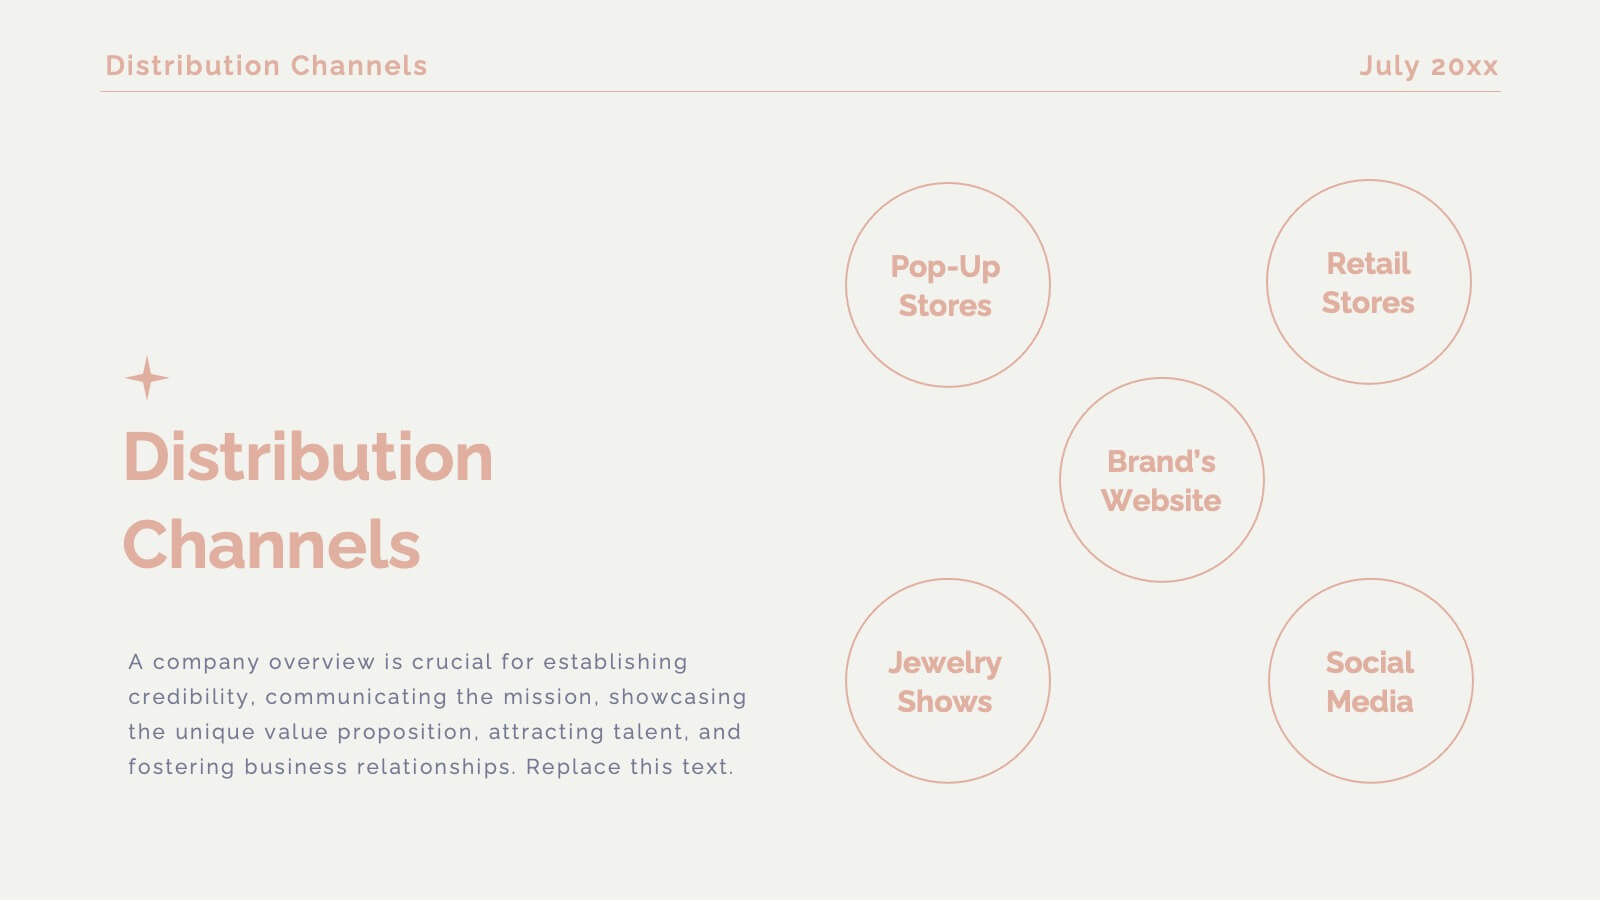
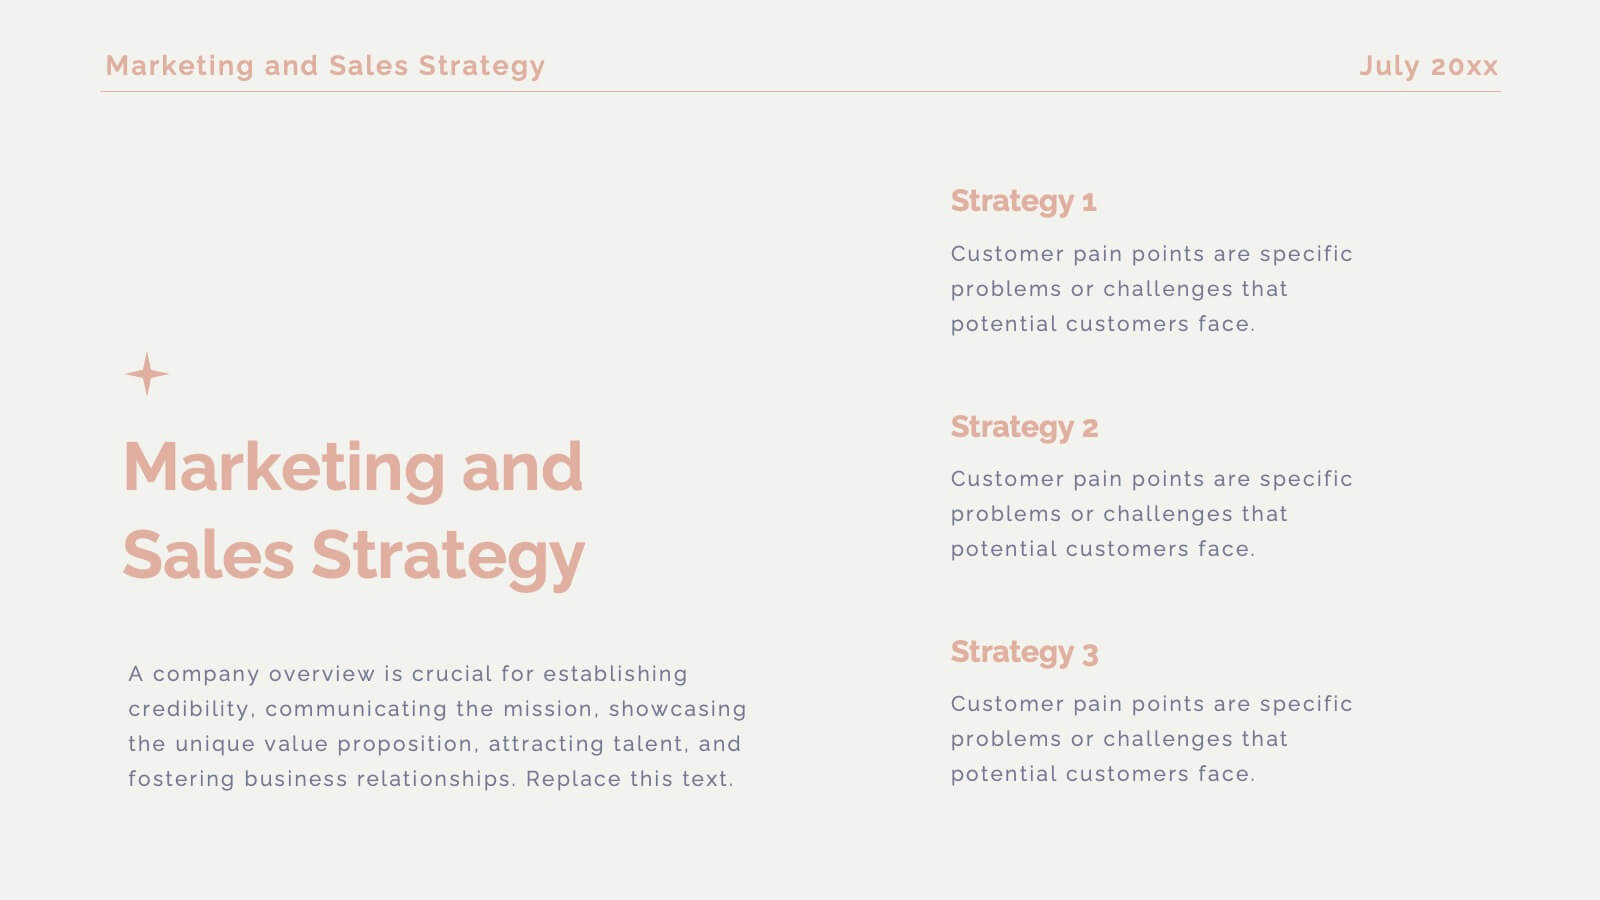
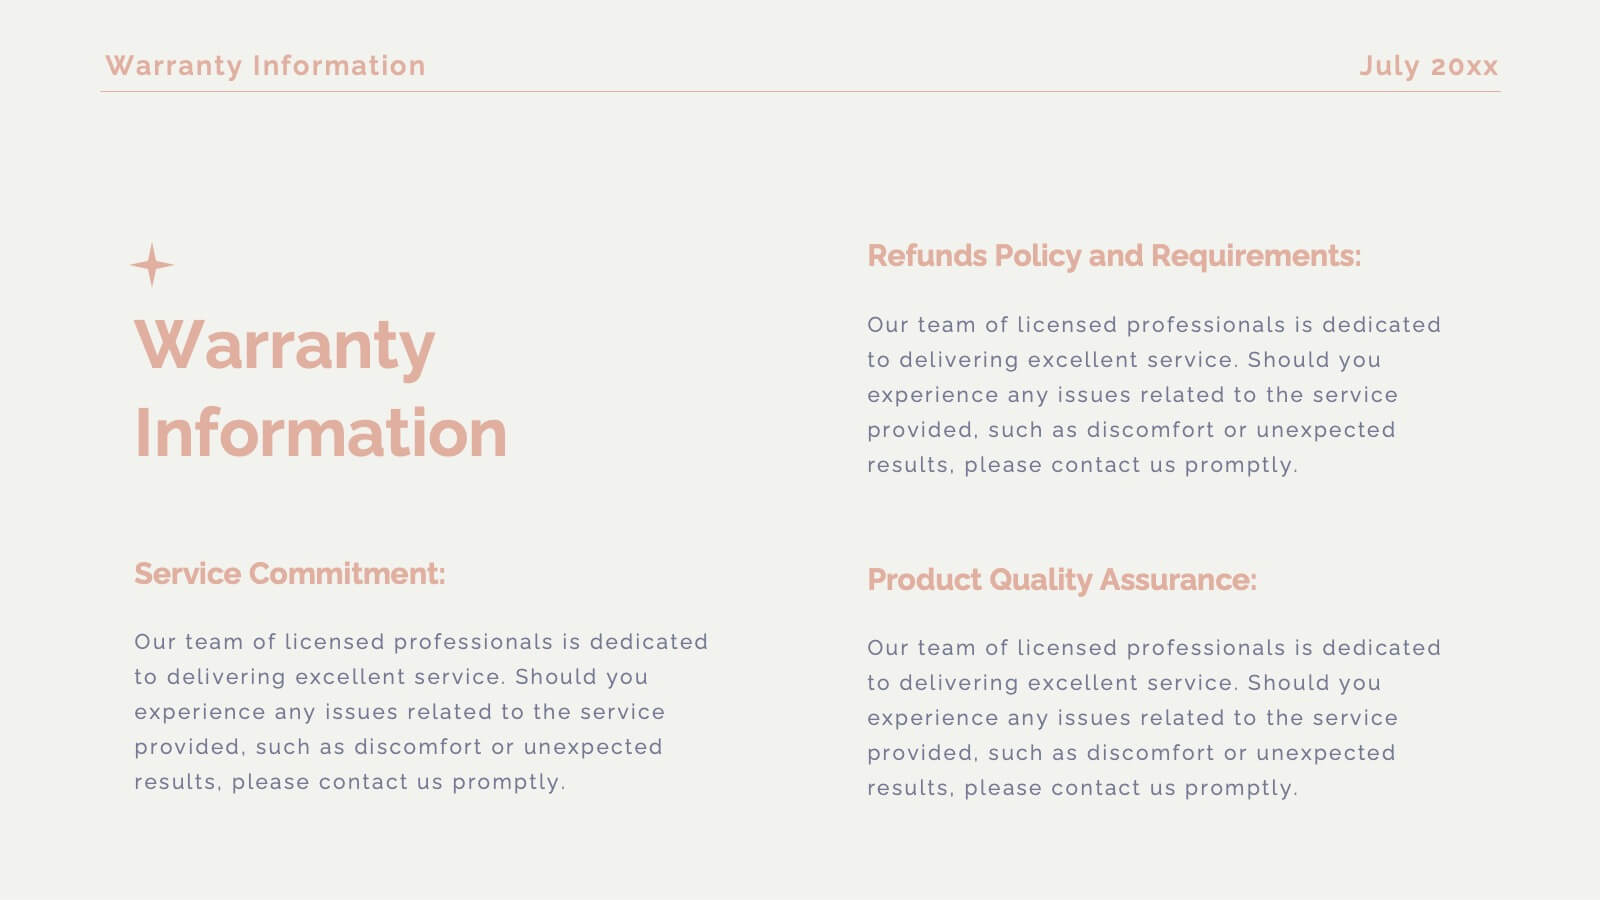
Get ready to unveil your product with a stunning and sophisticated launch template designed to captivate and convert! This template offers everything you need to present your product in the most compelling way possible, from an inviting welcome slide to an in-depth company overview that sets the stage for your brand’s story. The sleek design highlights key product features, unique selling propositions, and a thorough competitive analysis that positions your product as the market leader. With sections dedicated to customer pain points, solutions, and a powerful product demonstration, this template ensures your audience understands the value and impact of your offering. It also includes critical details like pricing strategy, distribution channels, and manufacturing processes, giving a full picture of your product’s journey from concept to market. Compatible with PowerPoint, Keynote, and Google Slides, this template is your ultimate tool for a successful product launch that leaves a lasting impression!


6 slides
Threat and Mitigation Bowtie Model Presentation
Clarify cause and consequence pathways with the Threat and Mitigation Bowtie Model Presentation. This template helps visualize risk sources, critical events, and mitigation strategies in a clear bowtie format. Ideal for incident analysis, safety reviews, and compliance reporting. Fully editable in PowerPoint, Keynote, and Google Slides.


4 slides
Economic Impact on Stock Market
Visualize financial cause and effect with this step-by-step economic impact infographic. Ideal for explaining market trends, policy changes, or fiscal outcomes, this slide uses a four-part arrow path starting with a money bag icon. Each stage—A to D—can be customized with data and analysis. Fully editable in PowerPoint, Keynote, and Google Slides.


7 slides
Smart Goals Infographic
Smart goals are a framework used to create effective and achievable objectives in various contexts, including personal development, business, education, and more. Our smart goals infographic is your roadmap to success. Uncover the power of smart goals - Specific, Measurable, Achievable, Relevant, and Time-bound, and how they can revolutionize your journey towards personal and professional achievement. This Infographic is more than a visual guide; it's an invitation to transform your ambitions into achievements. Discover the power of smart goals, seize control of your destiny, and embark on a path to success like never before.


5 slides
Empathy to Ideation Process Framework Presentation
Visualize the journey from understanding user needs to generating innovative ideas with the Empathy to Ideation Process Framework Presentation. This slide features a side-profile silhouette and five clear, horizontal stages, each representing a key step in design thinking. Ideal for innovation workshops, UX strategy sessions, or educational use. Fully editable in Canva, PowerPoint, Google Slides, and Keynote.


5 slides
Industry Competition Assessment with Porter’s Forces Presentation
Present your competitive landscape with this Porter’s Five Forces slide. Designed for strategic analysis, it visually maps key industry forces—New Entrants, Supplier Power, Buyer Power, Substitutes, and Competitive Rivalry—around a central business icon. Fully customizable and ideal for PowerPoint, Keynote, or Google Slides to elevate professional presentations.


6 slides
Logistics and Procurement Supply Chain Presentation
Optimize your supply chain strategy with the Logistics and Procurement Supply Chain template. Designed to illustrate key logistics processes, procurement flows, and operational efficiency, this structured layout helps you present crucial data with clarity. Fully customizable and compatible with PowerPoint, Keynote, and Google Slides for seamless business integration.


4 slides
Communication Model and Channels Presentation
Illustrate how your messages move through various channels using this clean, visual communication model slide. Ideal for team briefings, marketing workflows, or internal training, it simplifies how information is shared across platforms. Fully editable in Canva, PowerPoint, and Google Slides for seamless customization to match your branding and messaging goals.


20 slides
Valkyrie Design Strategy Proposal Presentation
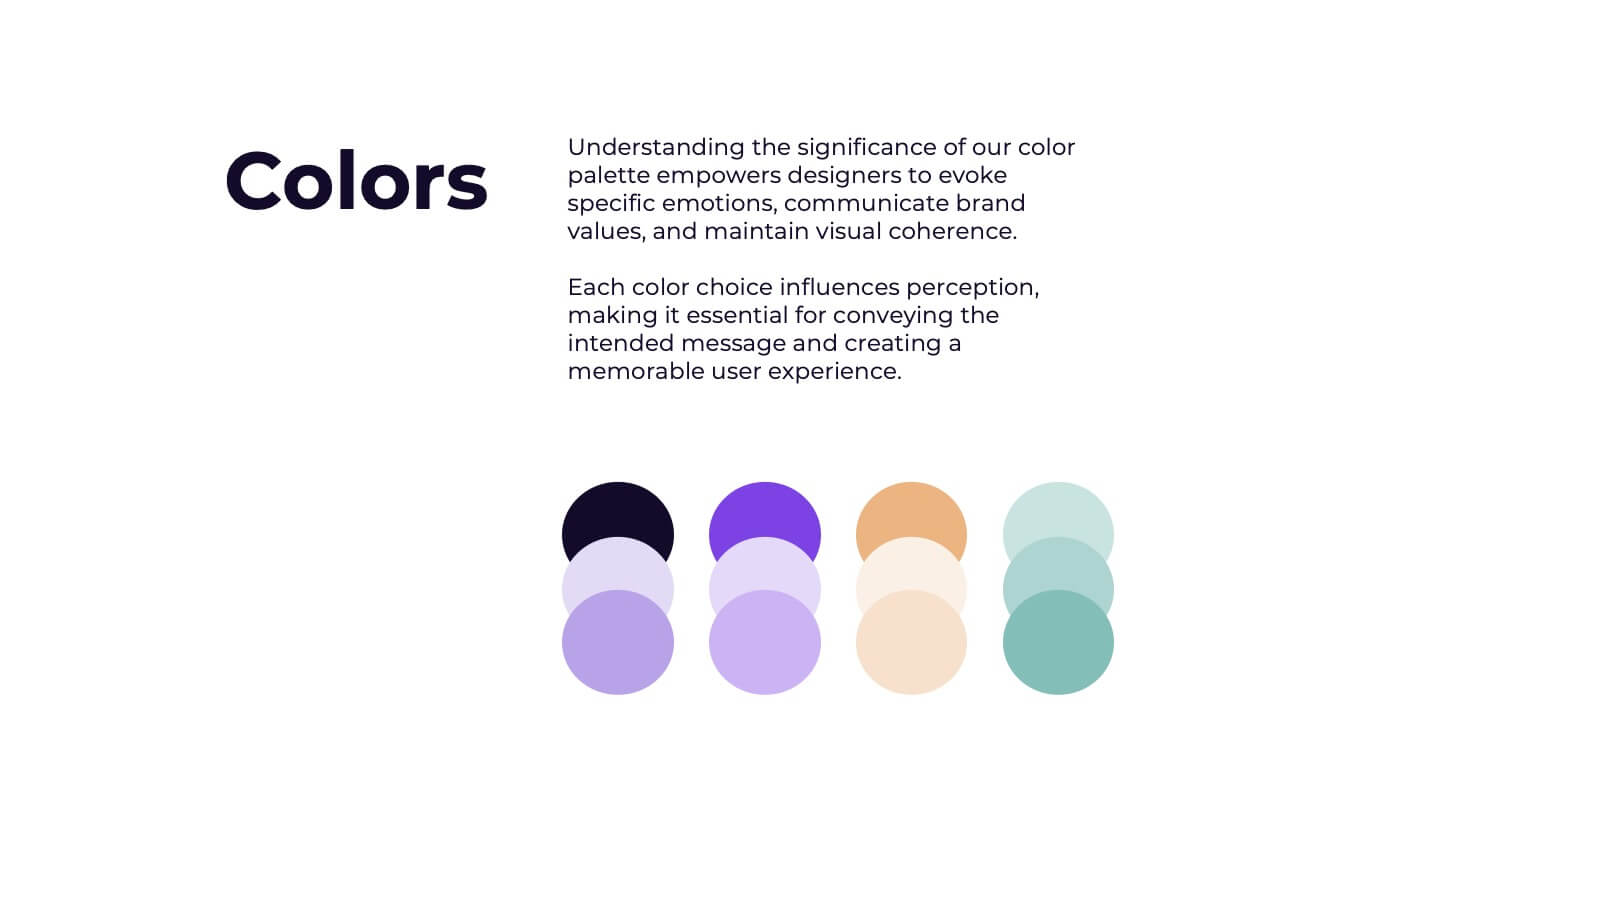
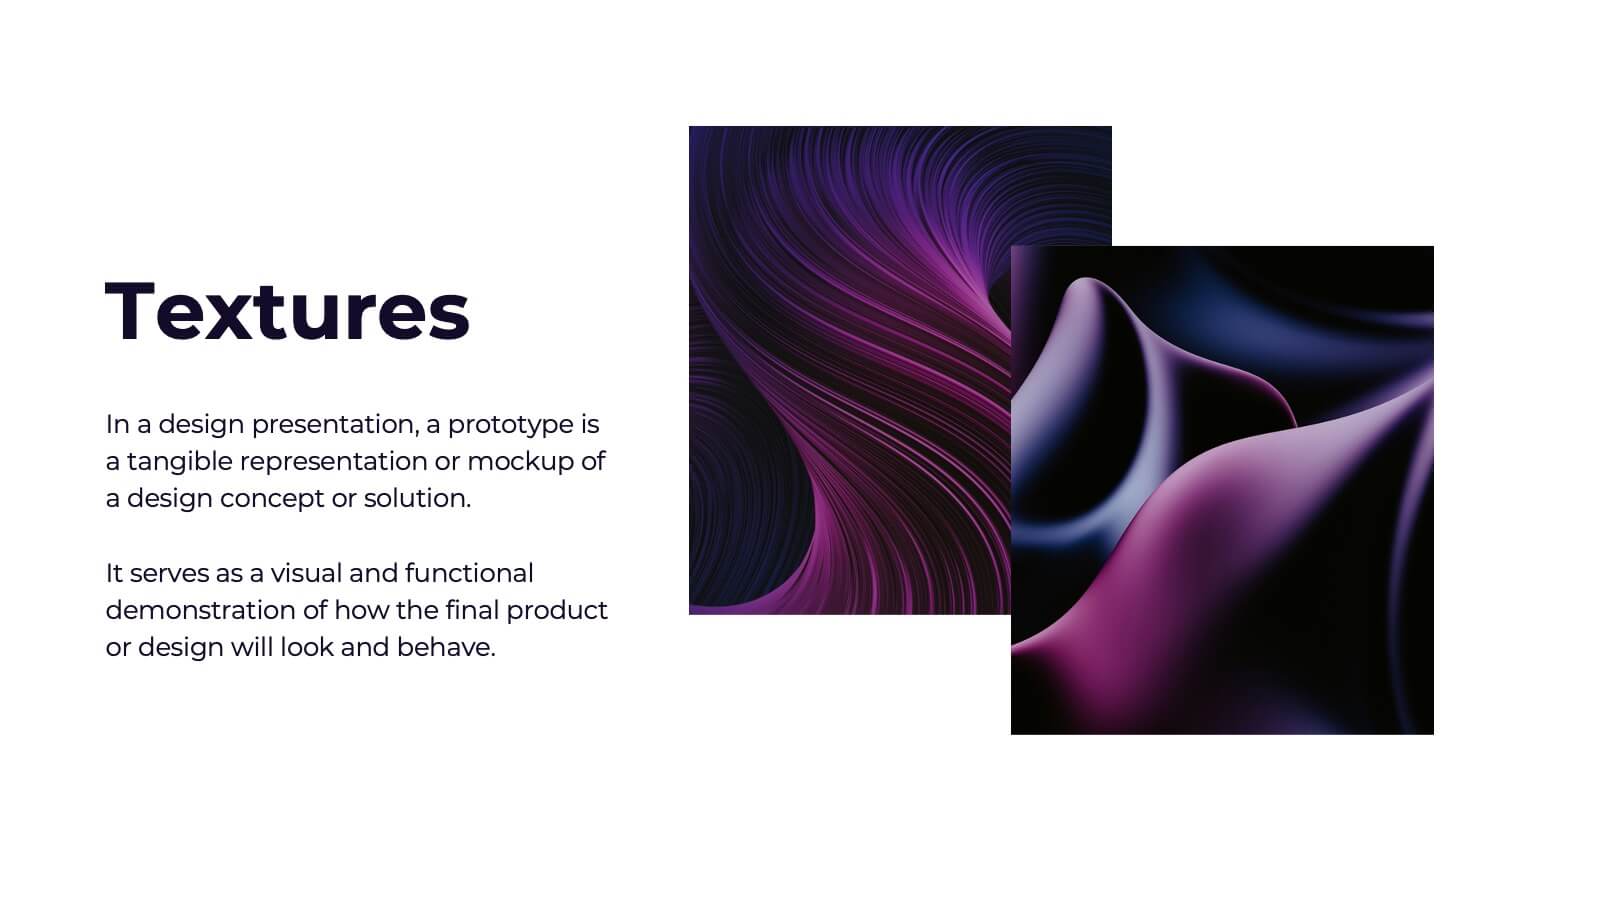
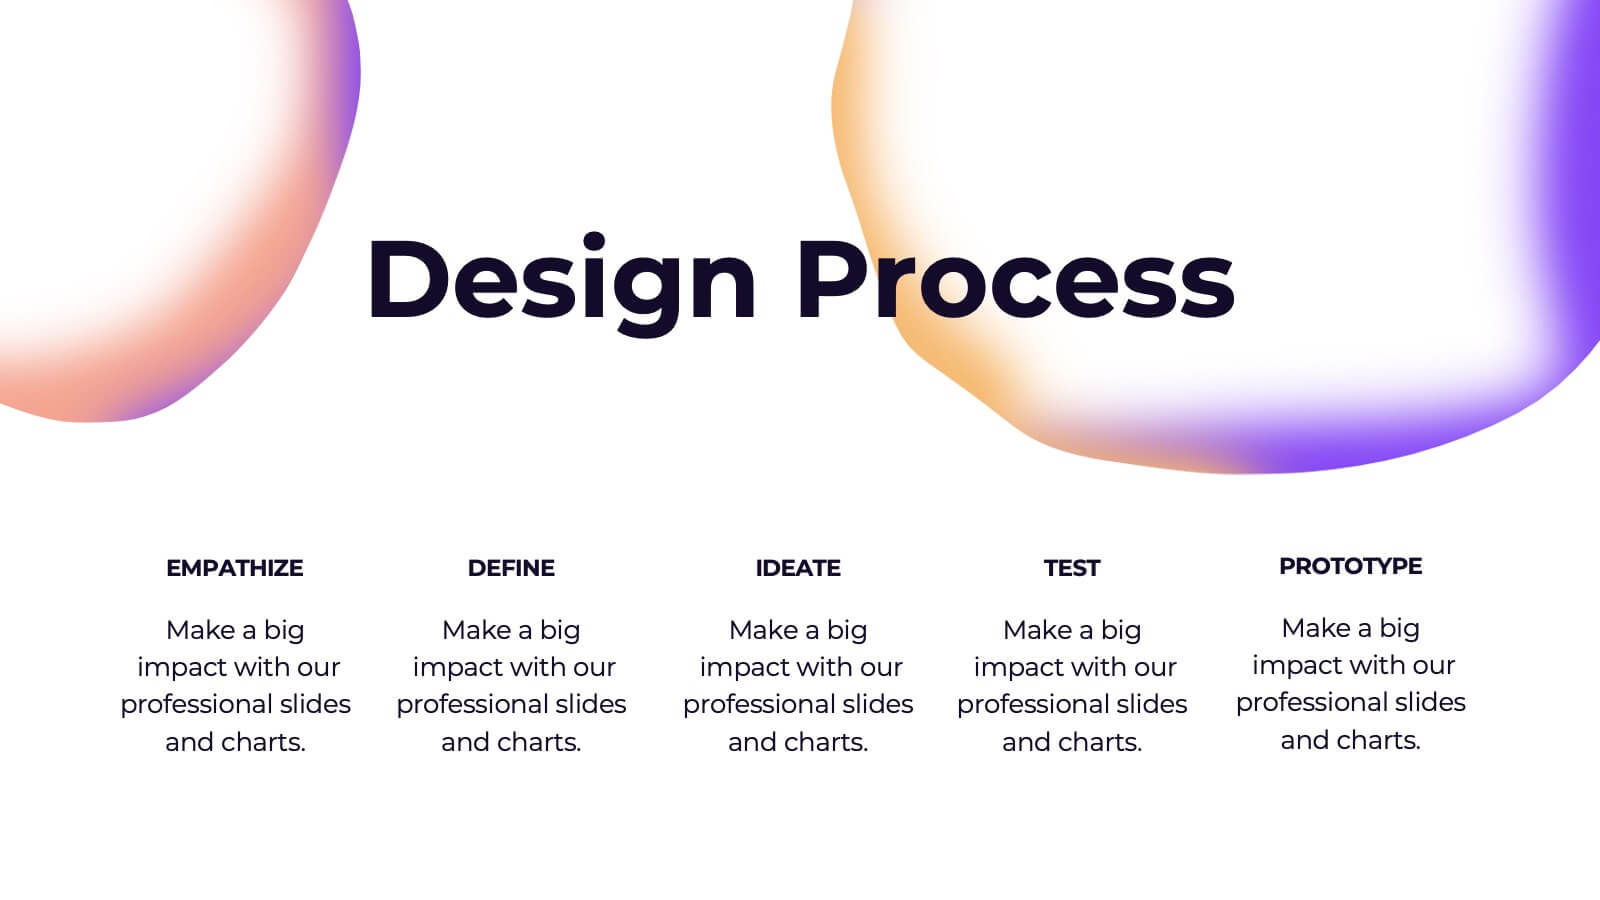
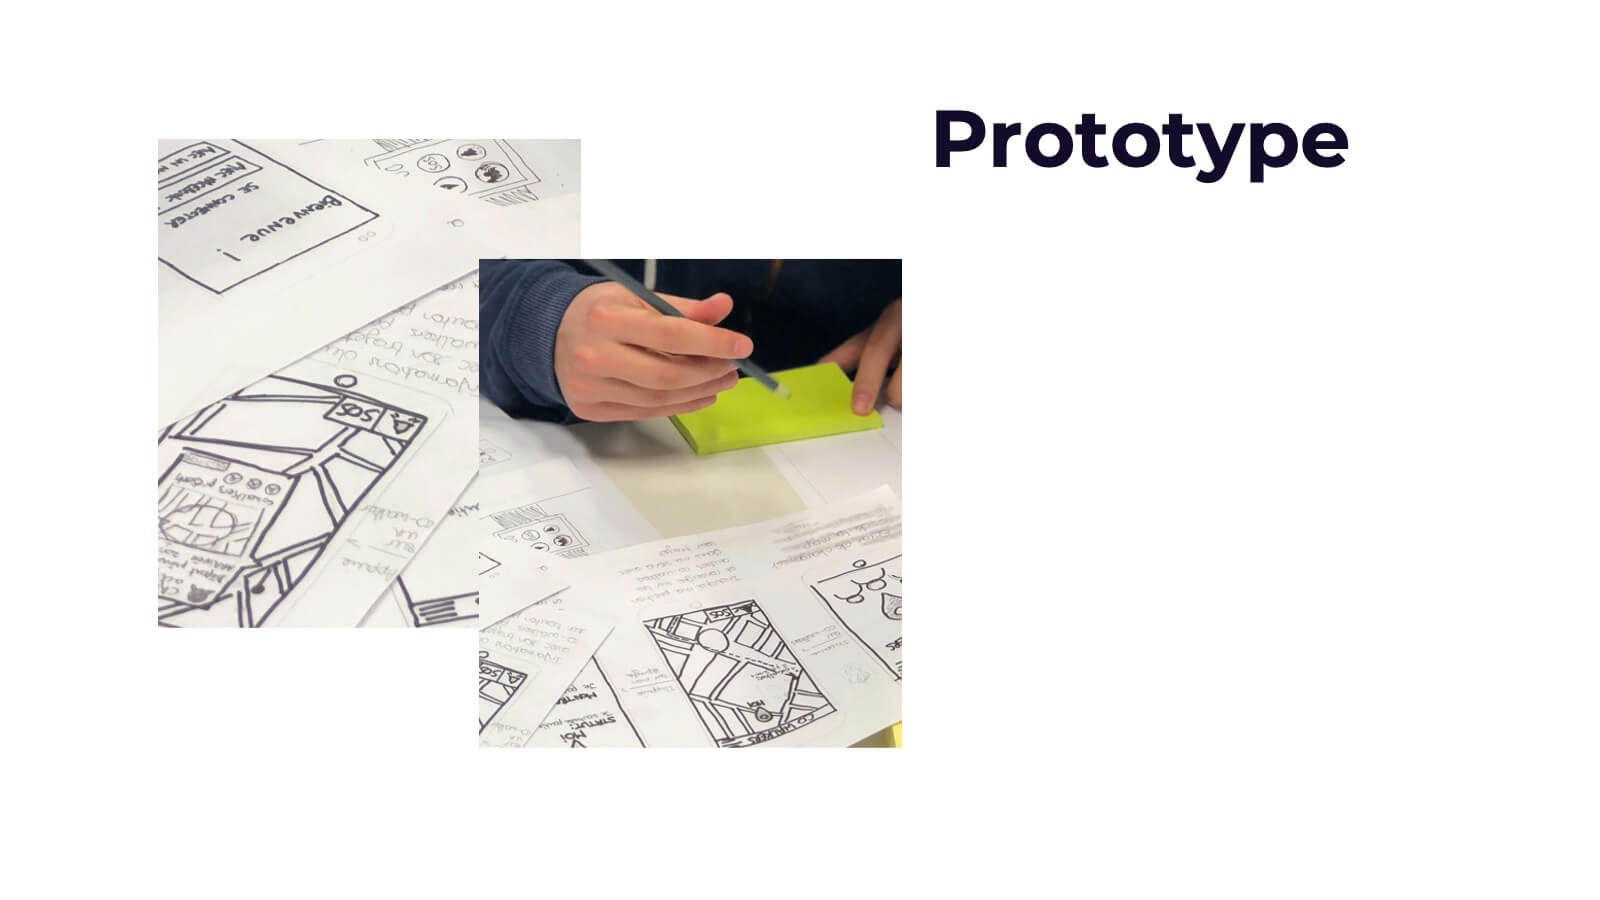
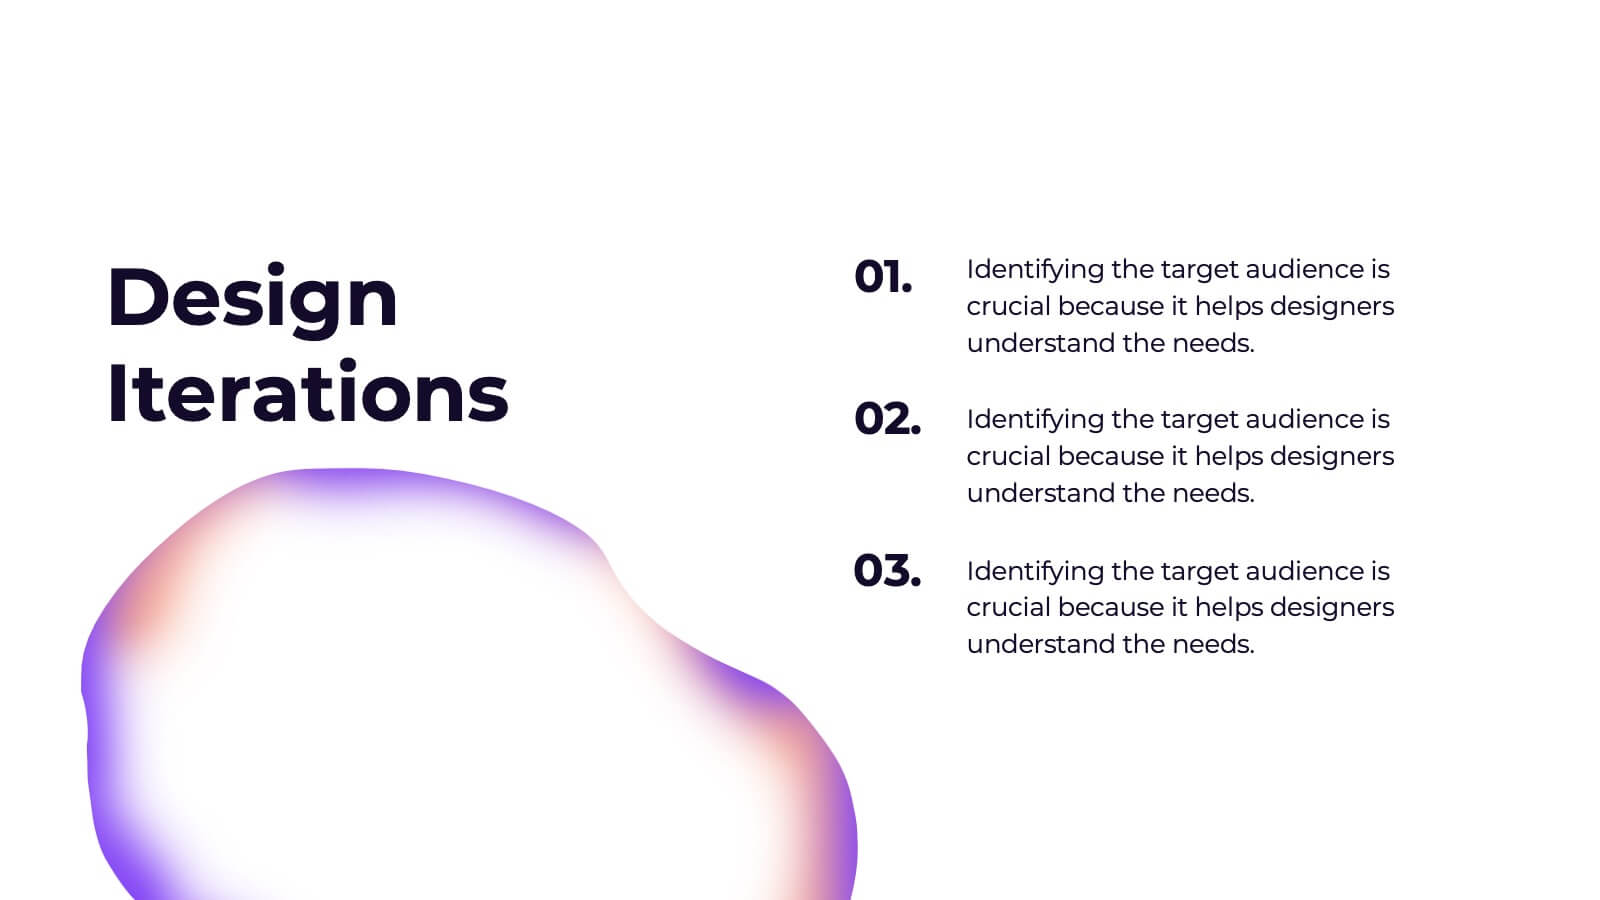
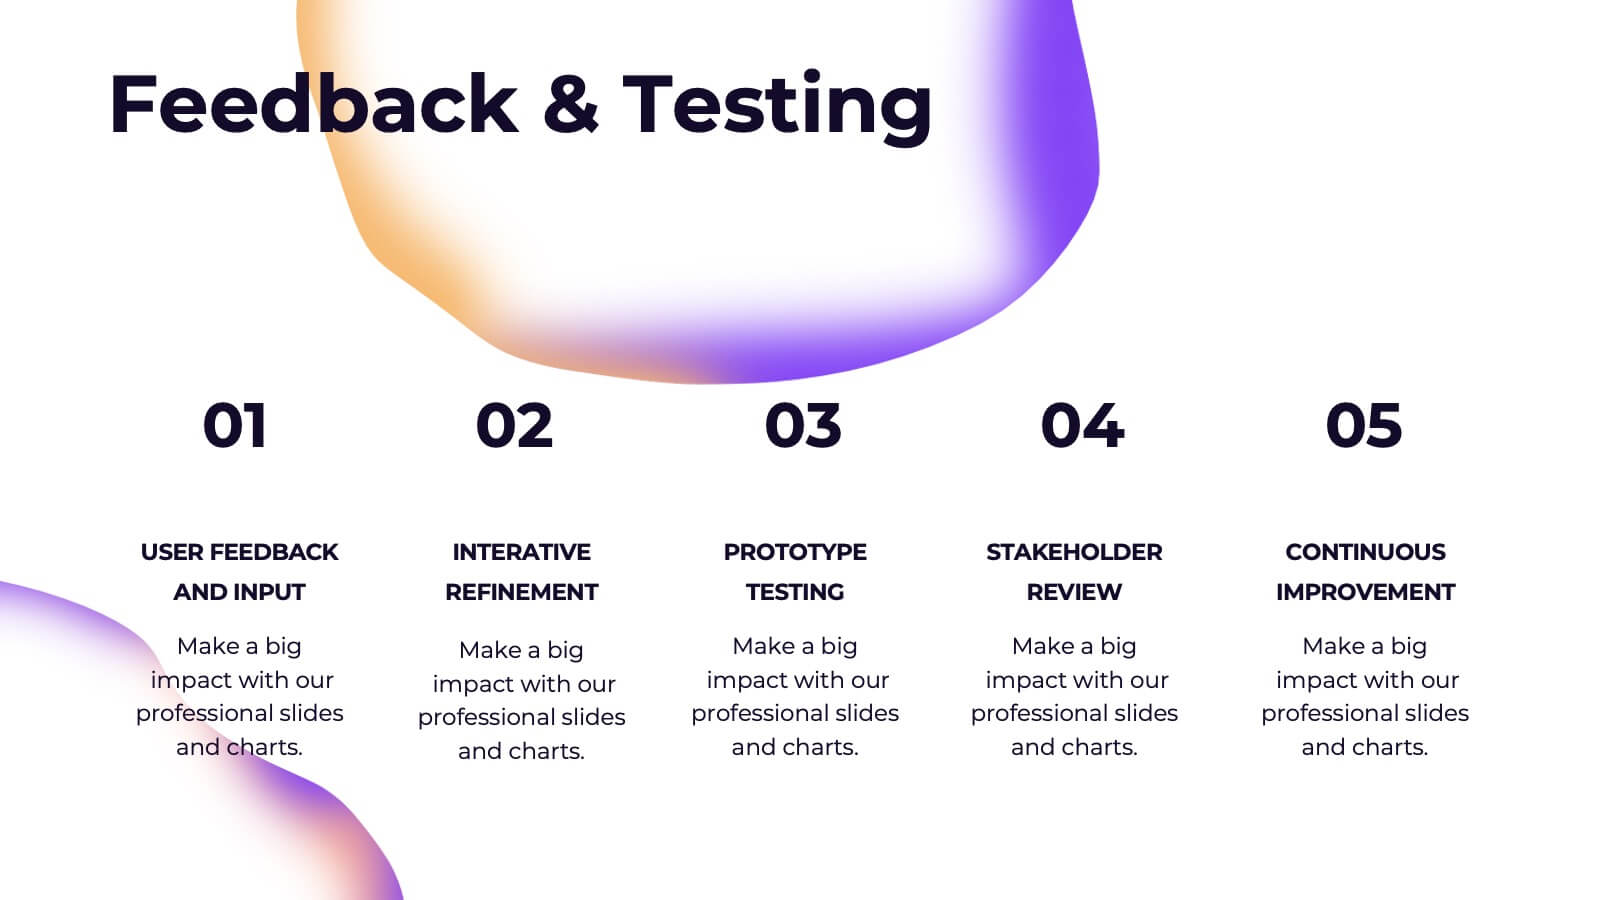
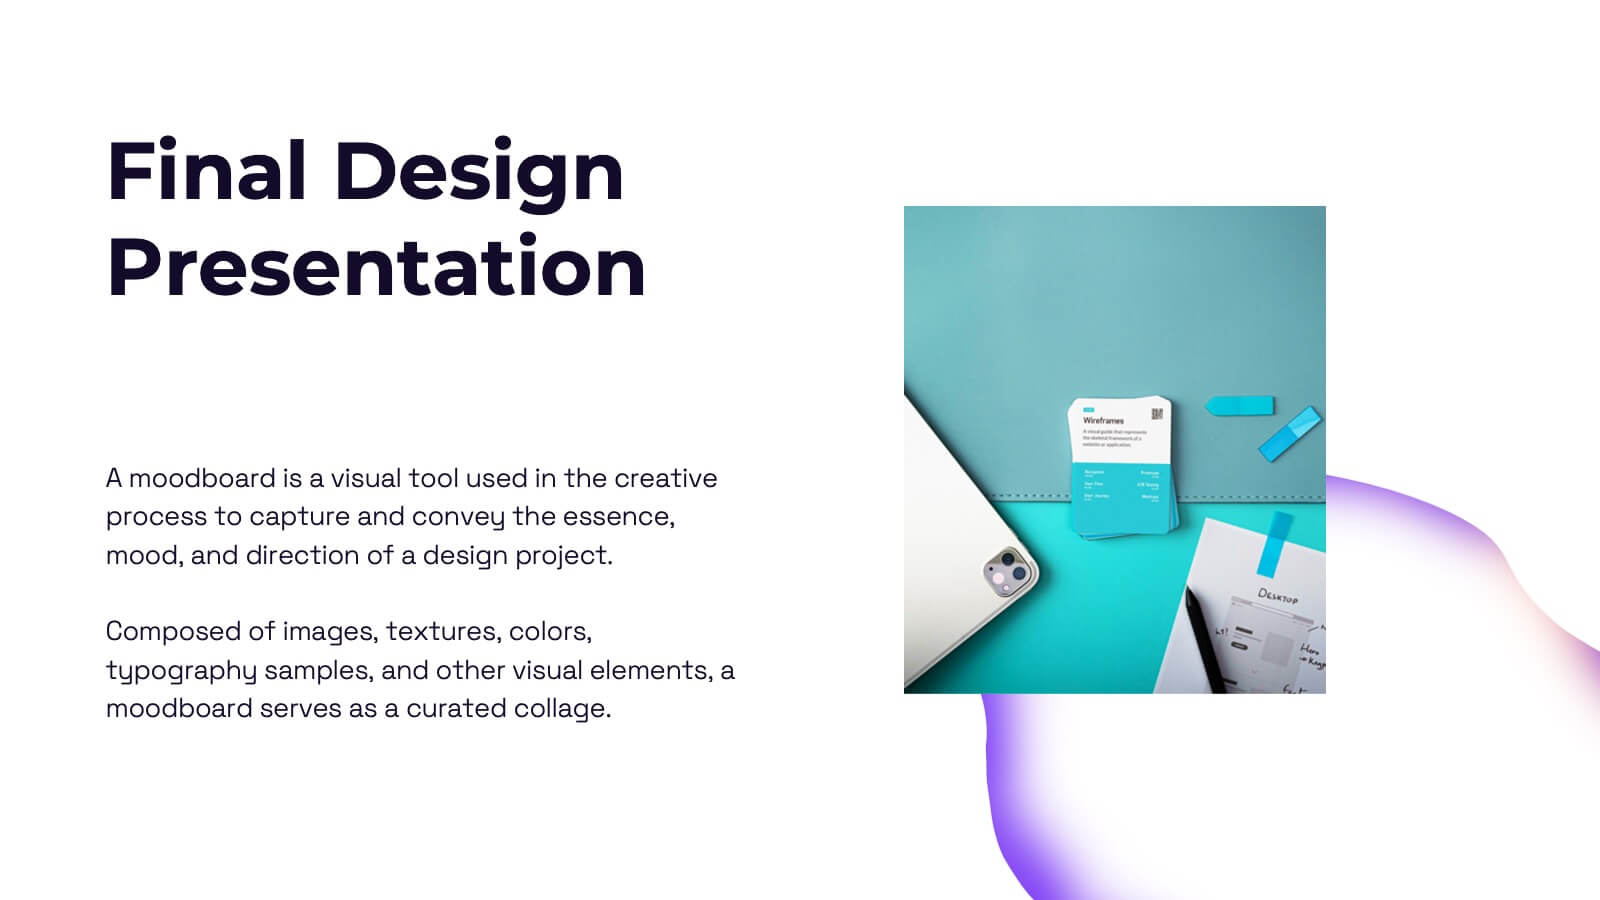
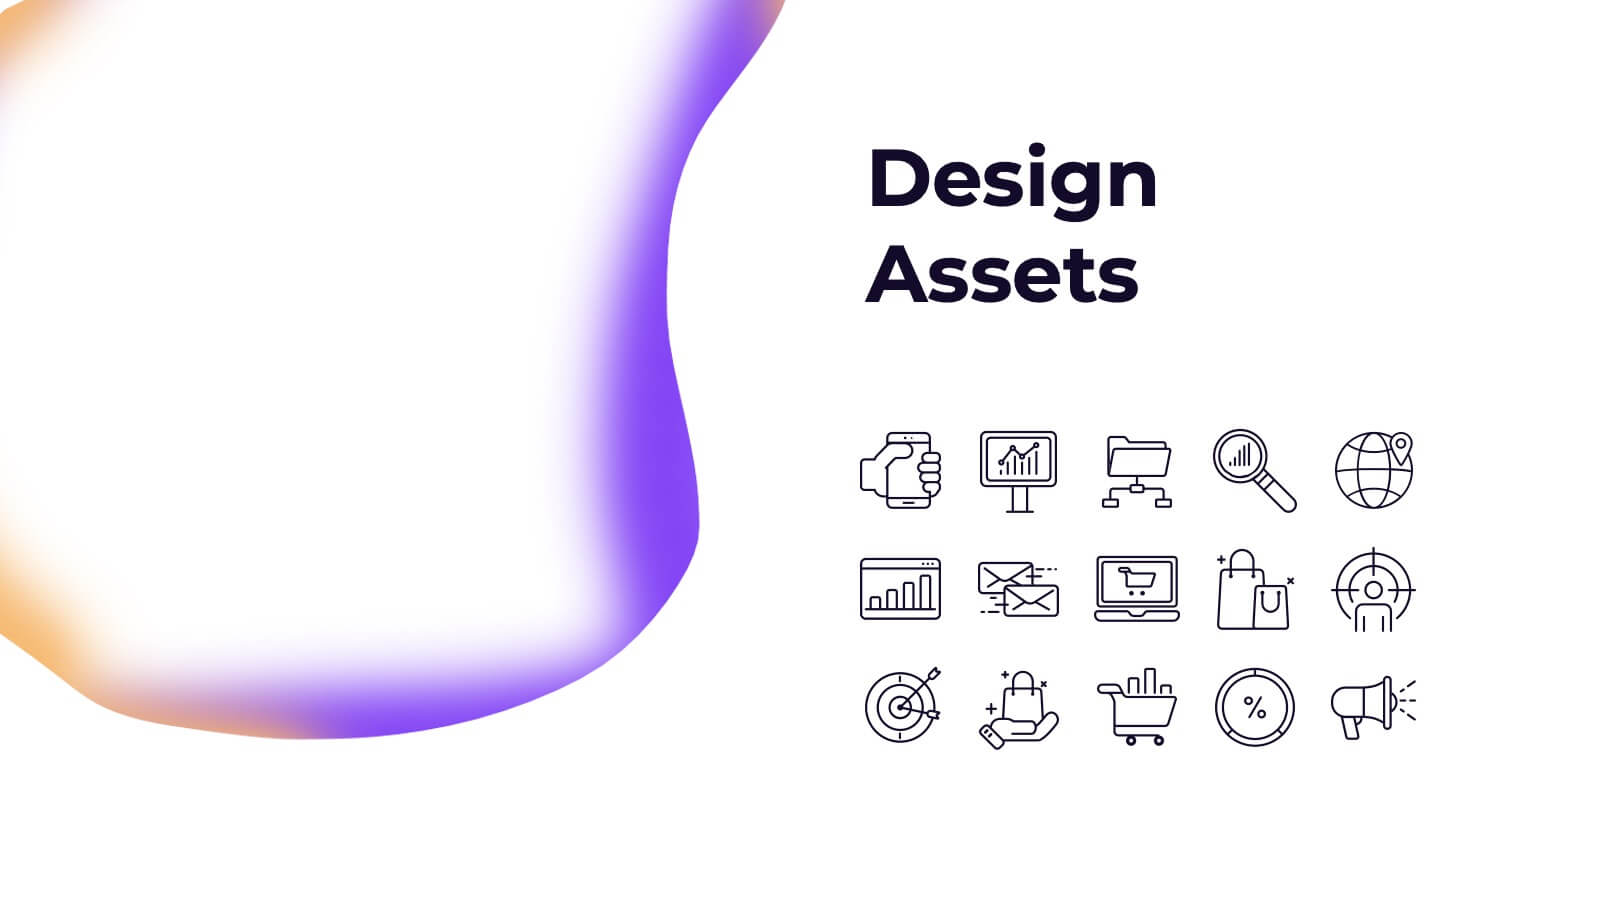
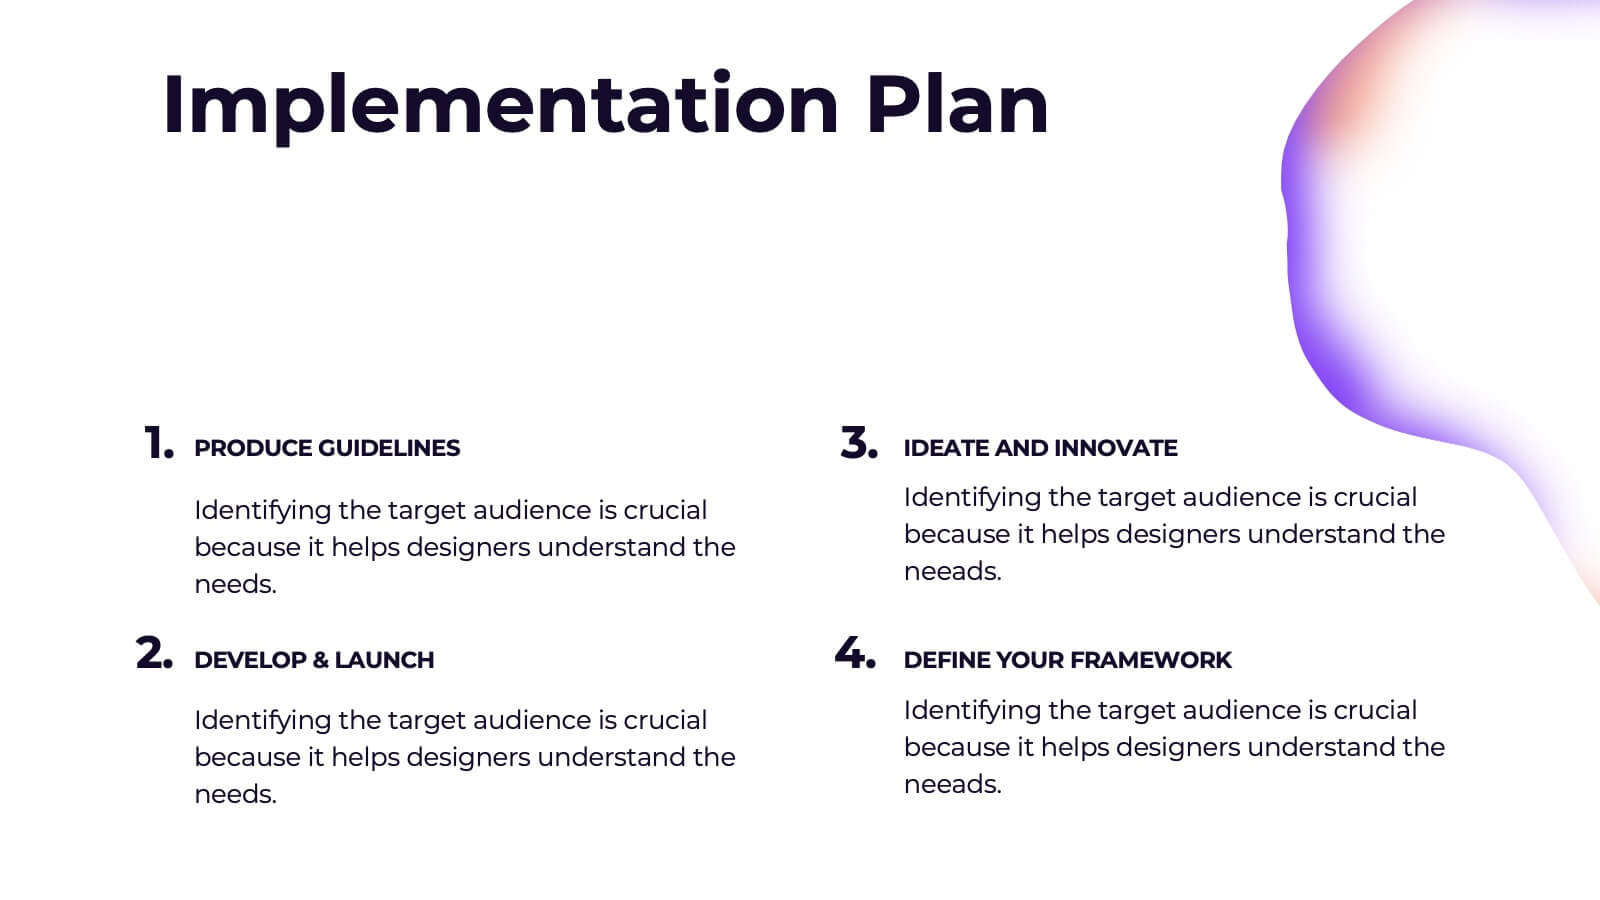
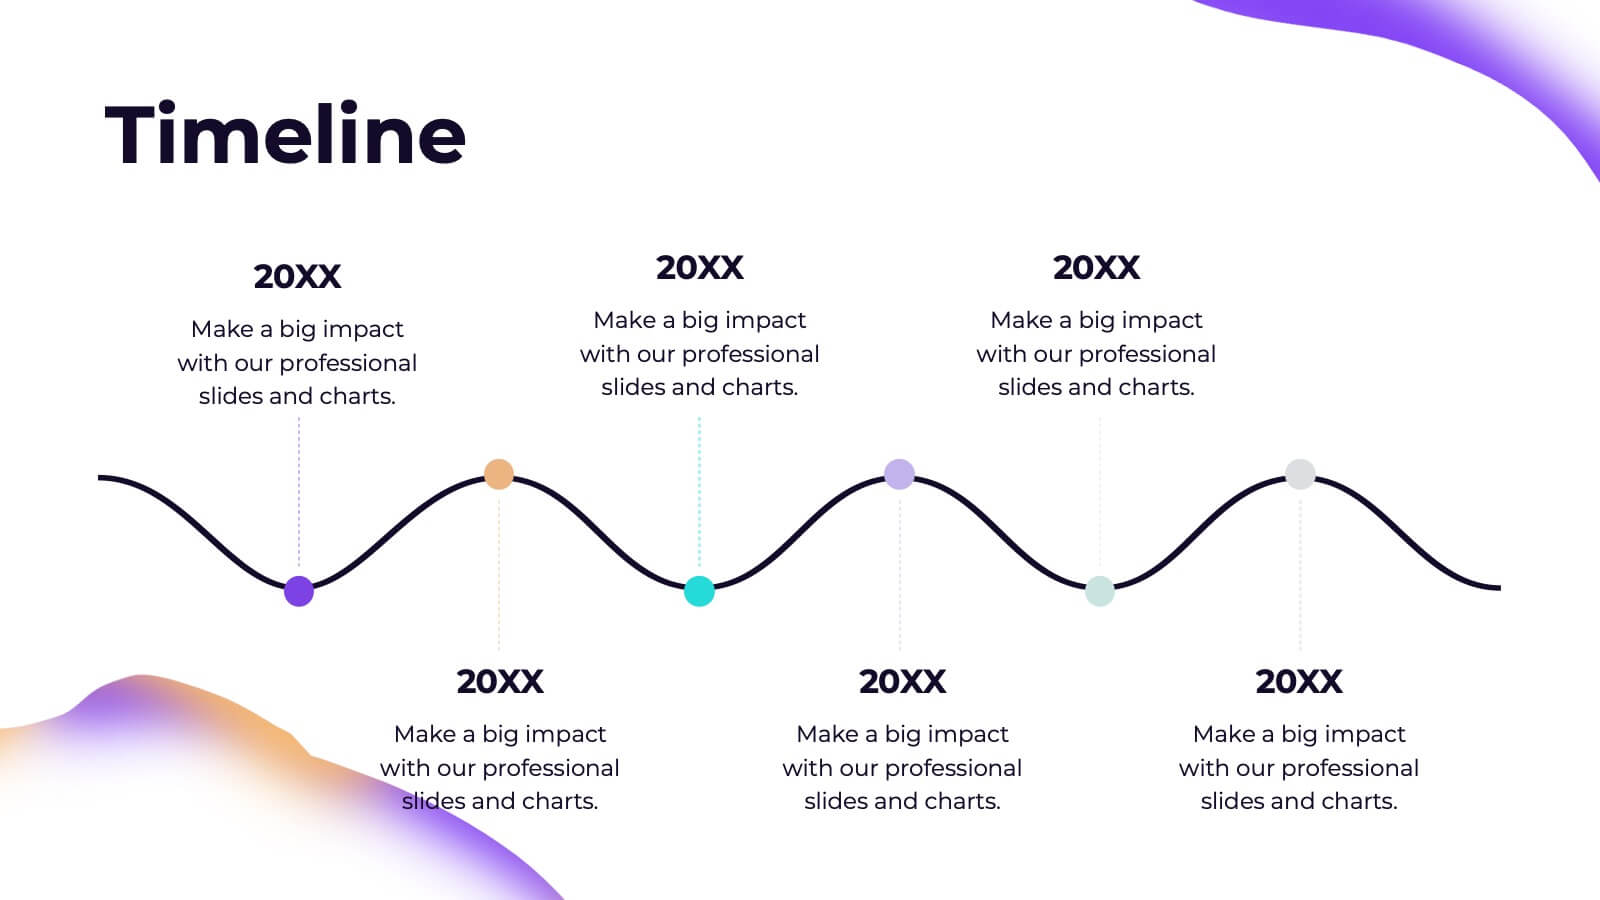
Elevate your design strategy presentations with this visually captivating and modern template! It covers every step of the design process, from concept development and mood boards to prototype iterations and feedback. Ideal for showcasing design elements, textures, and assets, this template is perfect for creative professionals. Compatible with PowerPoint, Keynote, and Google Slides for easy, polished presentations.


7 slides
Harvey Ball Charts Infographic
A Harvey Ball is a simple, round graphic used for visual representation and communication of qualitative information. This infographic template harnesses the power of Harvey Balls, those simple yet potent icons, to convey information and insights in a visually striking manner. Highlight strategies to engage the audience effectively using Harvey Balls. Fully customizable and compatible with Powerpoint, Keynote, and Google Slides. This infographic allows you to explore the ability to customize Harvey Balls, varying in size, color, and style to suit your unique data representation needs.


6 slides
Investment Trust Infographic
An investment trust, also known as a closed-end fund, is a type of collective investment vehicle that pools funds from multiple investors to invest in a diversified portfolio of assets. This Infographic template visually communicates key information about investment trusts, which are financial vehicles from multiple investors to invest in a diversified portfolio of assets. This template highlights different types of investment, such as trusts, fixed-income trusts, or sector-specific trusts. The icons and images are included to represent each type. This infographic is fully customizable and compatible with Powerpoint, Keynote, and Google Slides.


6 slides
Problem Definition and Solution Path
Illuminate your strategy with this lightbulb-themed slide—ideal for mapping out challenges and presenting actionable solutions. Each bulb symbolizes a step on your path from problem to resolution. Fully editable in PowerPoint, Keynote, and Google Slides.


5 slides
Cross-Functional Team Collaboration Presentation
Visualize multi-department synergy with the Cross-Functional Team Collaboration Presentation. Ideal for mapping collaborative structures, workflows, or project roles across divisions. This layout emphasizes alignment and cooperation between teams. Easily customizable in PowerPoint, Keynote, and Google Slides—perfect for strategy sessions, management briefings, or team onboarding presentations.


5 slides
RACI Matrix Responsibility Breakdown Presentation
Visualize roles and responsibilities with this RACI Matrix slide. Clearly assign who is Responsible, Accountable, Consulted, or Informed across key tasks. Ideal for project planning and team alignment, this editable layout helps avoid confusion and ensures accountability. Perfect for PowerPoint, Keynote, or Google Slides in any business context.


5 slides
Business Statistics Infographic Report Presentation
Present data with clarity using the Business Statistics Infographic Report presentation. This layout combines clean bar graphs, donut charts, and legends to showcase KPIs, progress benchmarks, and segmented insights. Ideal for quarterly reviews, executive updates, or client reporting. Fully editable in PowerPoint, Keynote, or Google Slides.