


Features
- 26 Unique slides
- Fully editable and easy to edit in Microsoft Powerpoint, Keynote and Google Slides
- 16:9 widescreen layout
- Clean and professional designs
- Export to JPG, PDF or send by email


Do you have any questions?
Recommend


23 slides
Wendigo Agency Portfolio Presentation
This sleek agency portfolio template showcases your mission, services, and success stories with modern flair. From case studies and strategy development to campaign execution and client testimonials, it’s designed to highlight your agency’s strengths. Perfect for agency presentations across PowerPoint, Keynote, and Google Slides, this template makes your content shine effortlessly.


26 slides
Casey Presentation Template
Casey is a professionally designed modern, clean, and bold PowerPoint template that’s a great way to show off your data or highlight your services. This product is perfect for corporate customers who need an easy-to-edit template with bold colors and clean designs. With its easy to read charts, visible text, and bright colors this template will really captivate your audience. A perfect way to visualize your data and present your company in style to keep your audience engaged. Whether you are trying to get attention or just make your business stand out, this template will help you achieve that.


4 slides
HR Policies and Employee Management Presentation
Clearly outline your workplace strategies with this HR Policies and Employee Management slide. Featuring four color-coded segments alongside an illustration of employee analysis, this layout is ideal for presenting onboarding steps, employee benefits, internal policies, or training procedures. Fully editable and compatible with PowerPoint, Keynote, and Google Slides for seamless customization.


21 slides
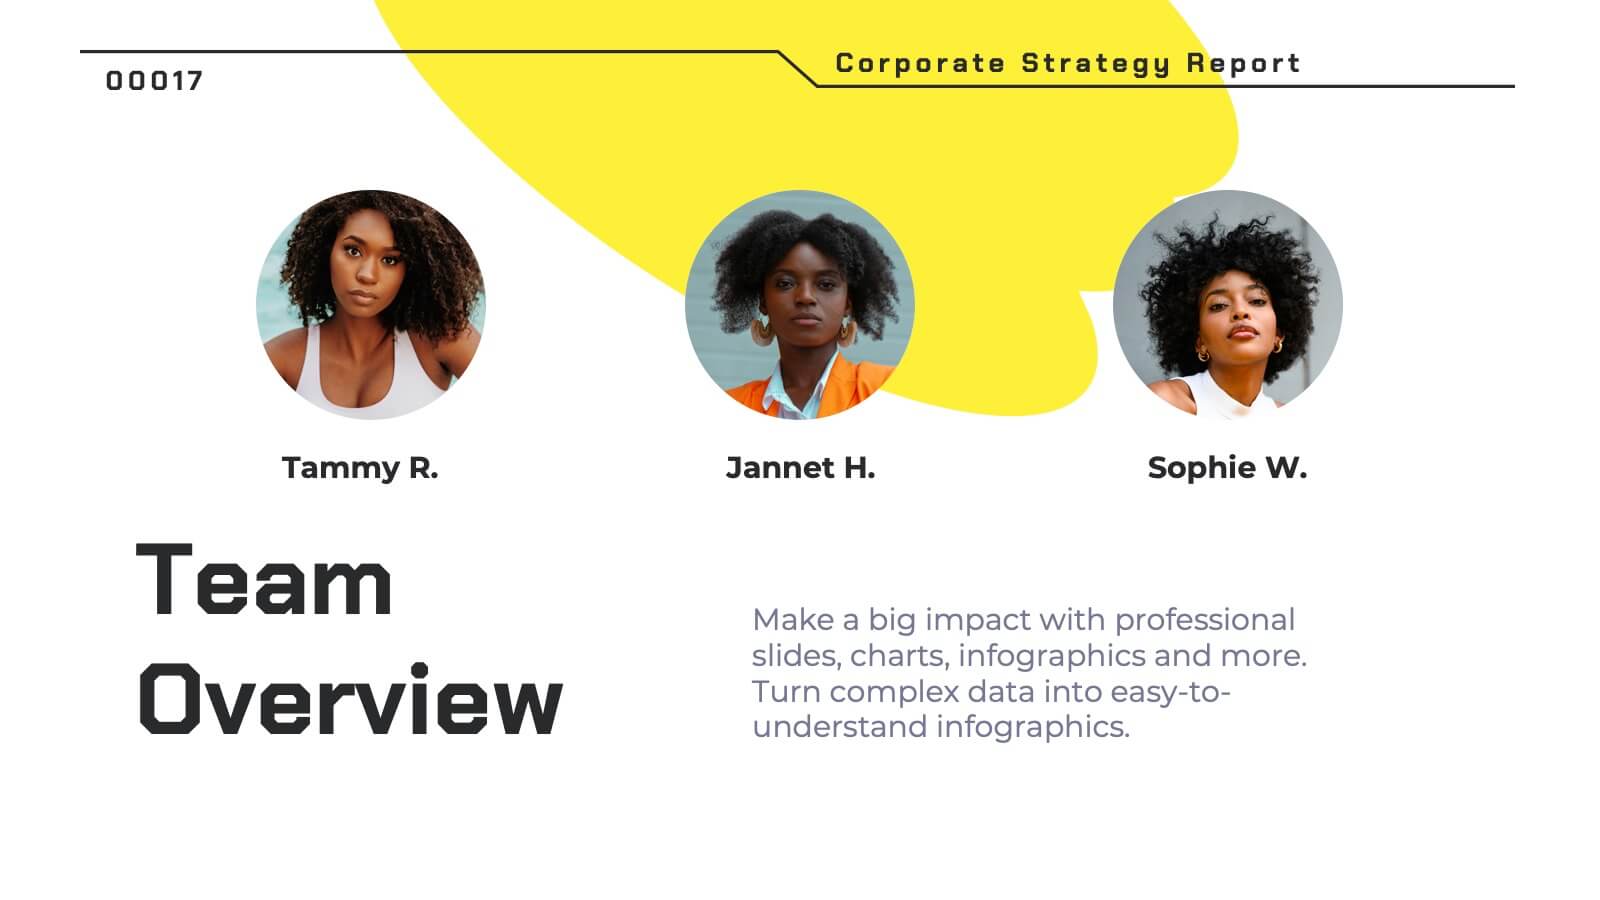
Pyronova Corporate Strategy Report Presentation
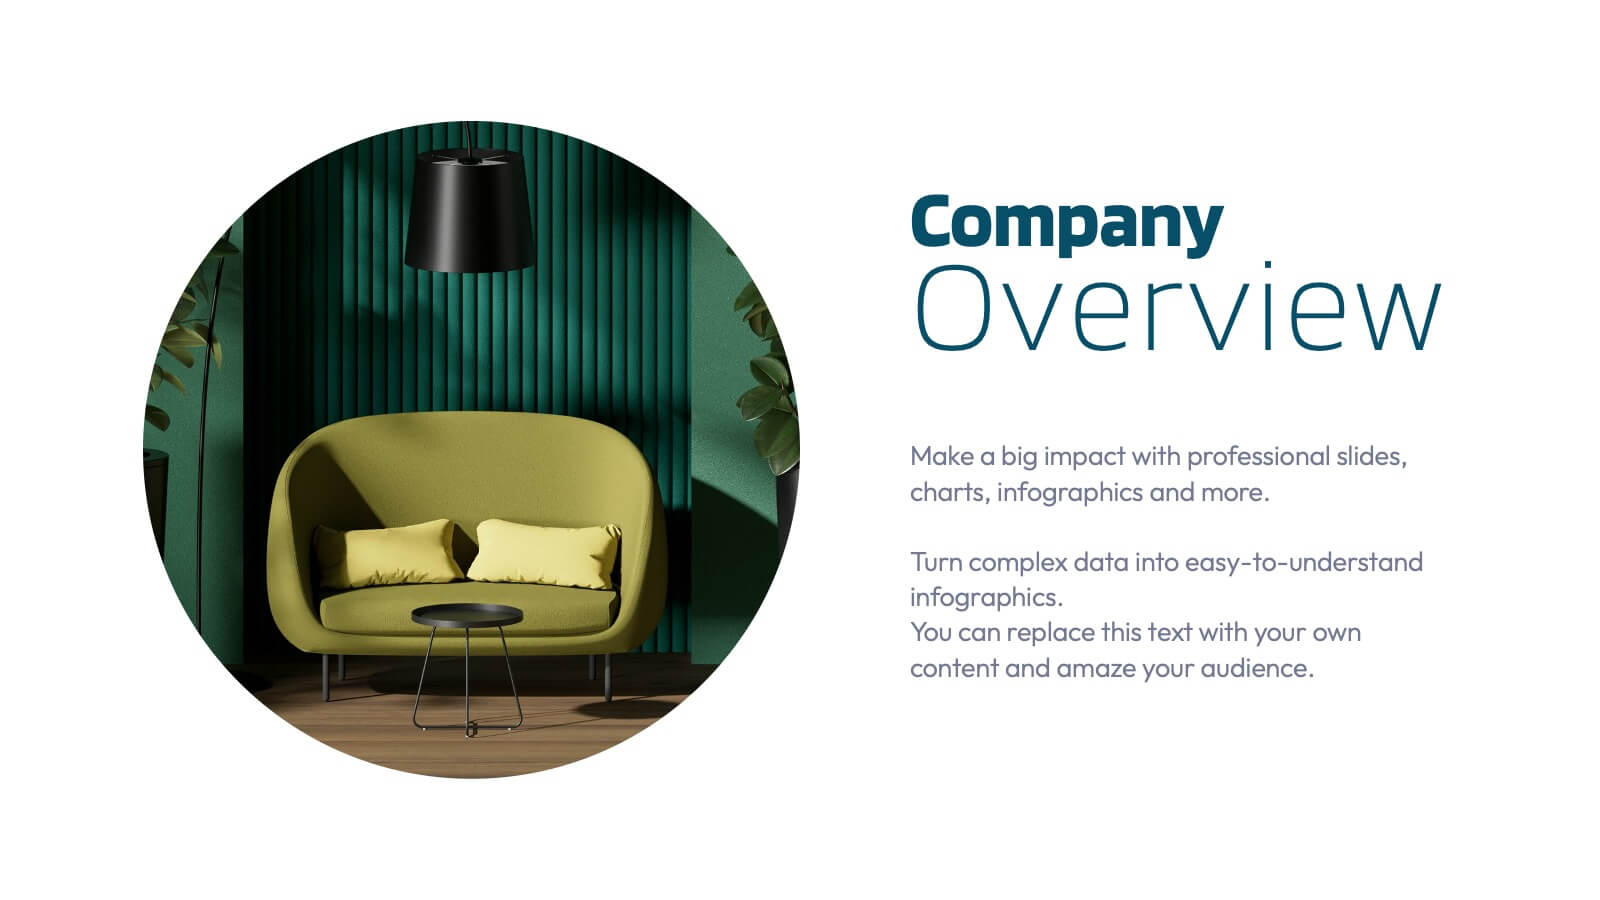
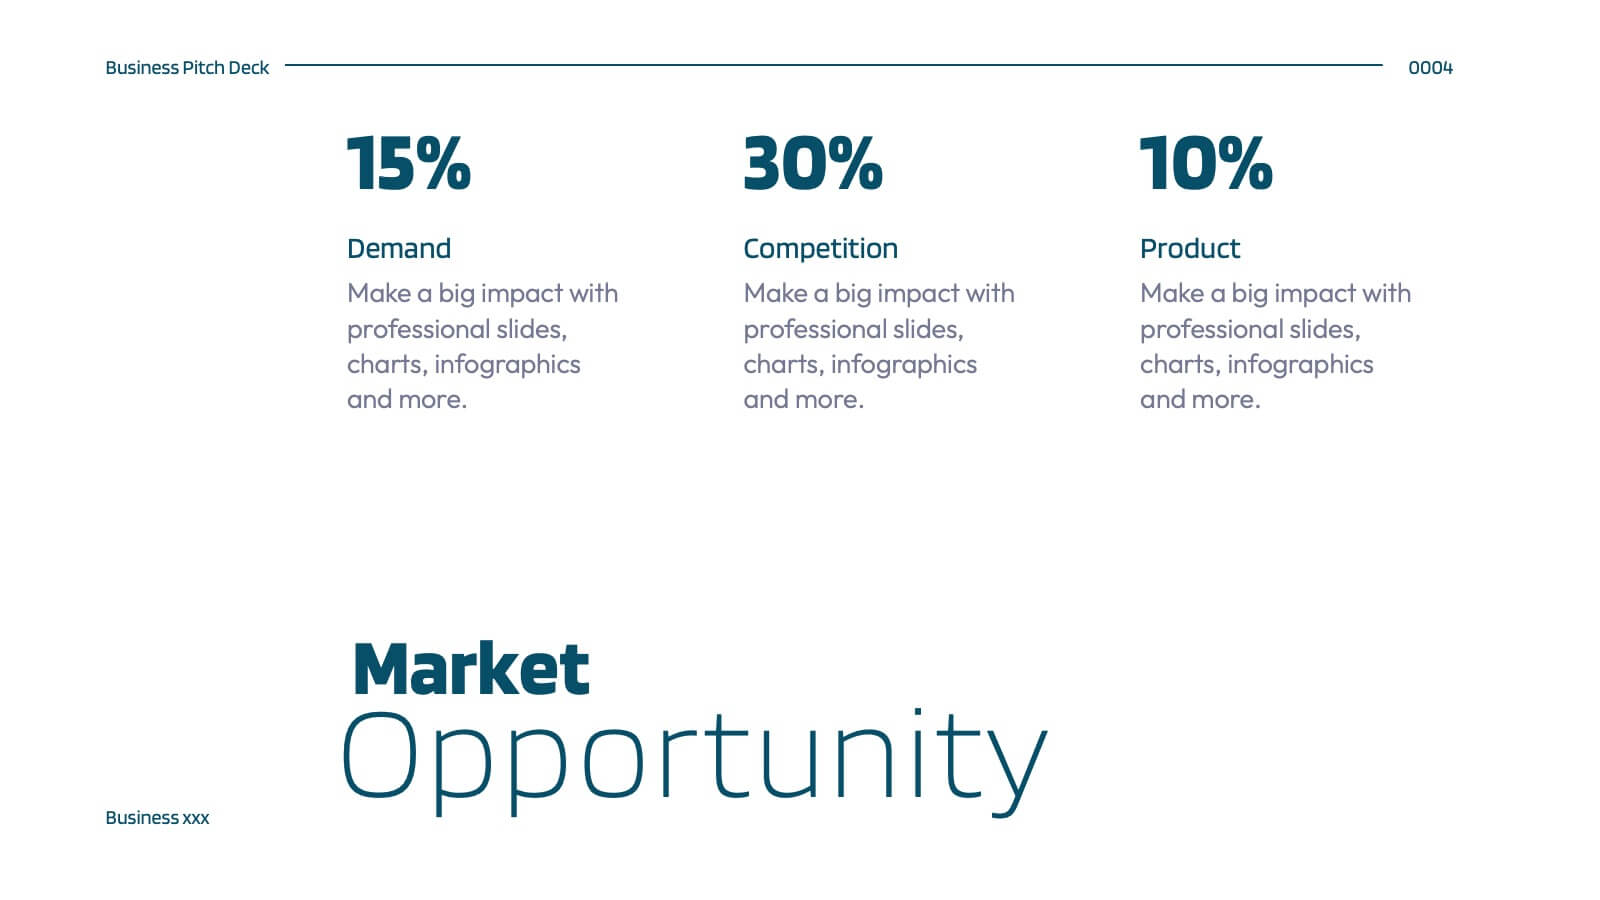
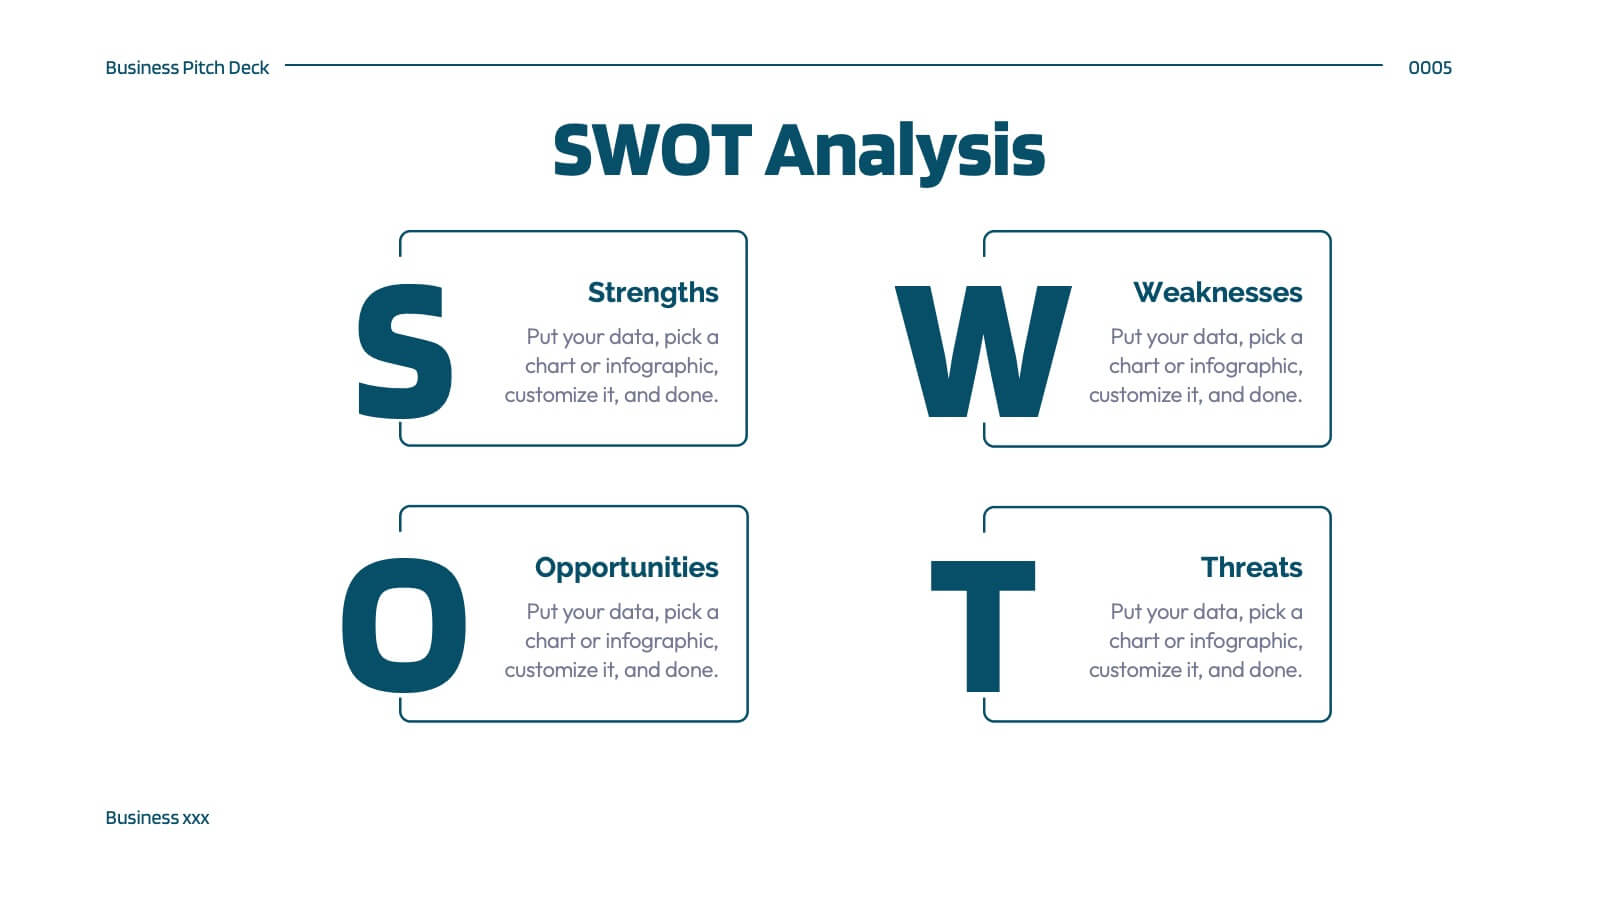
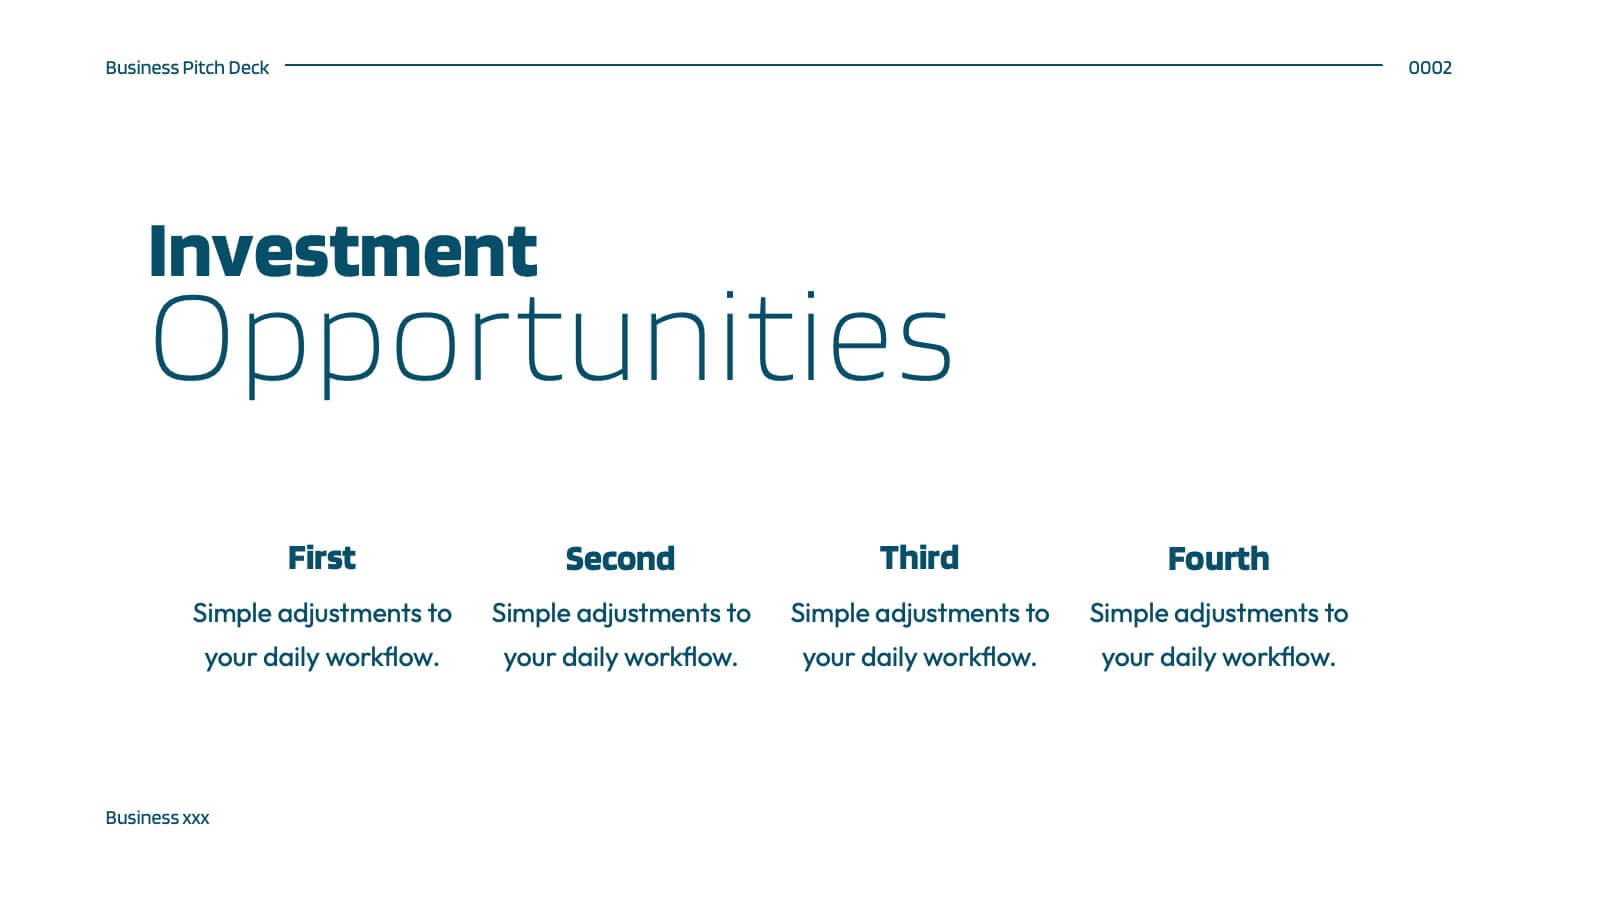
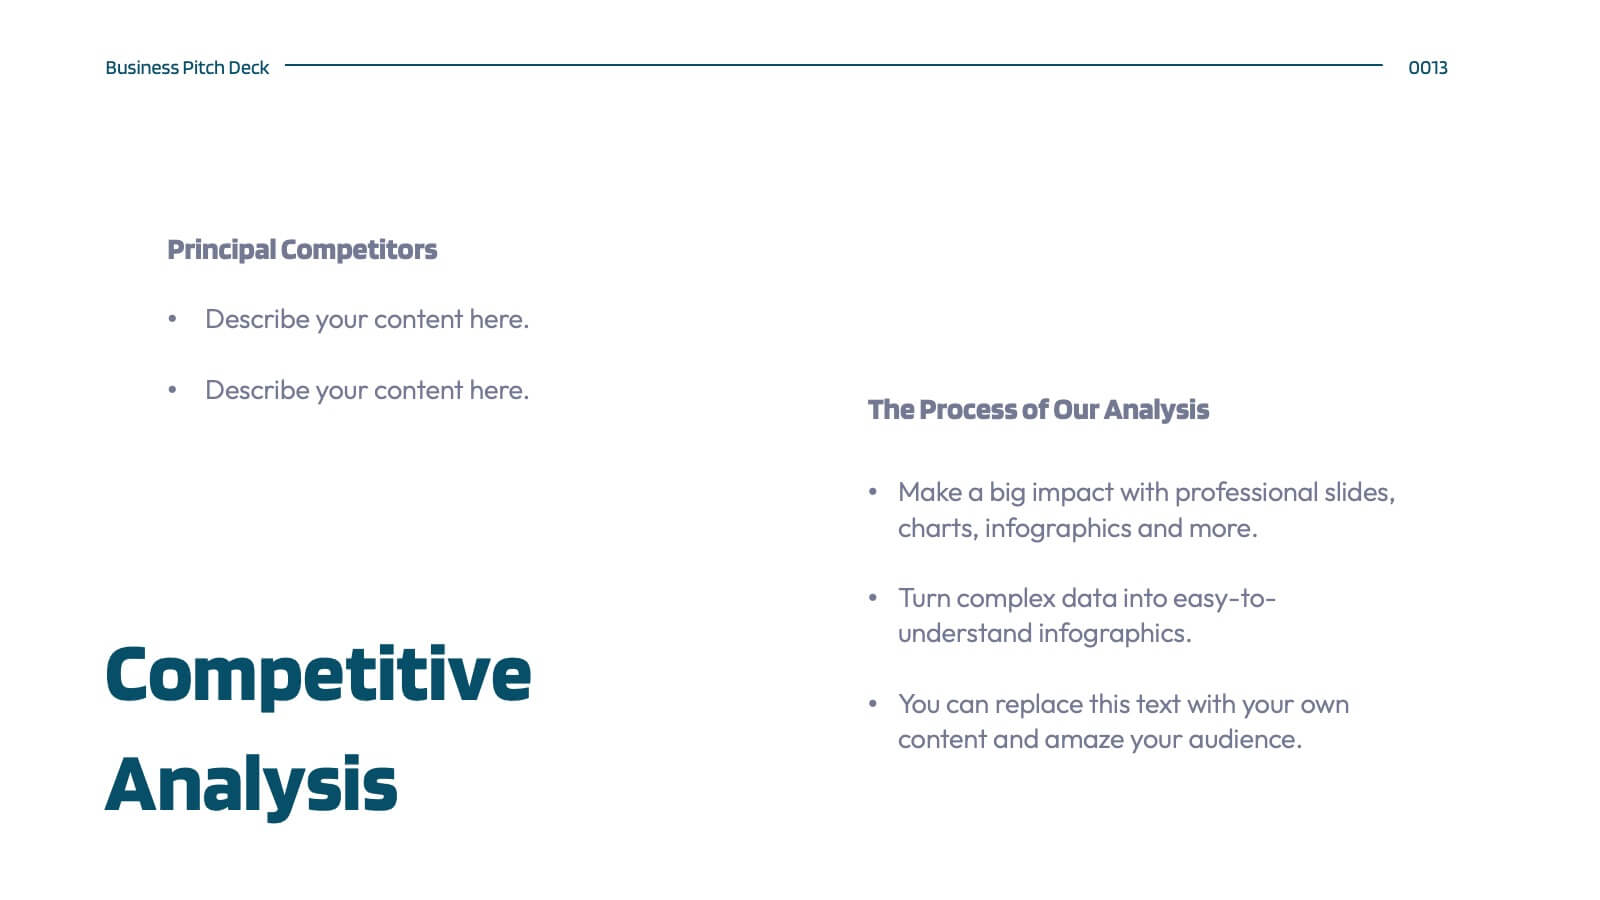
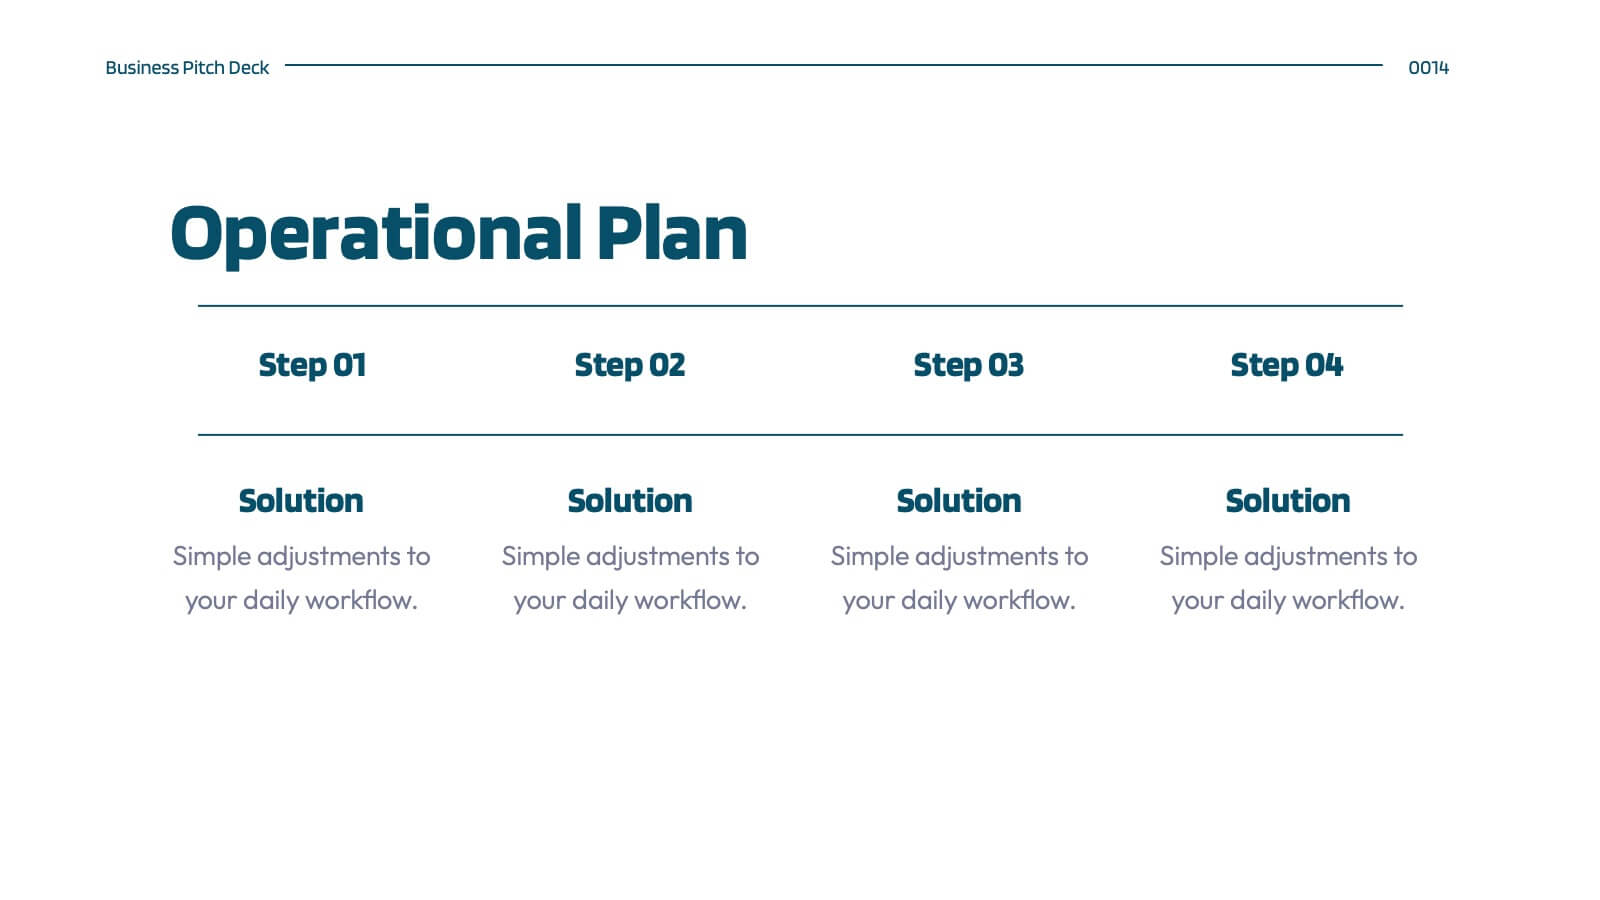
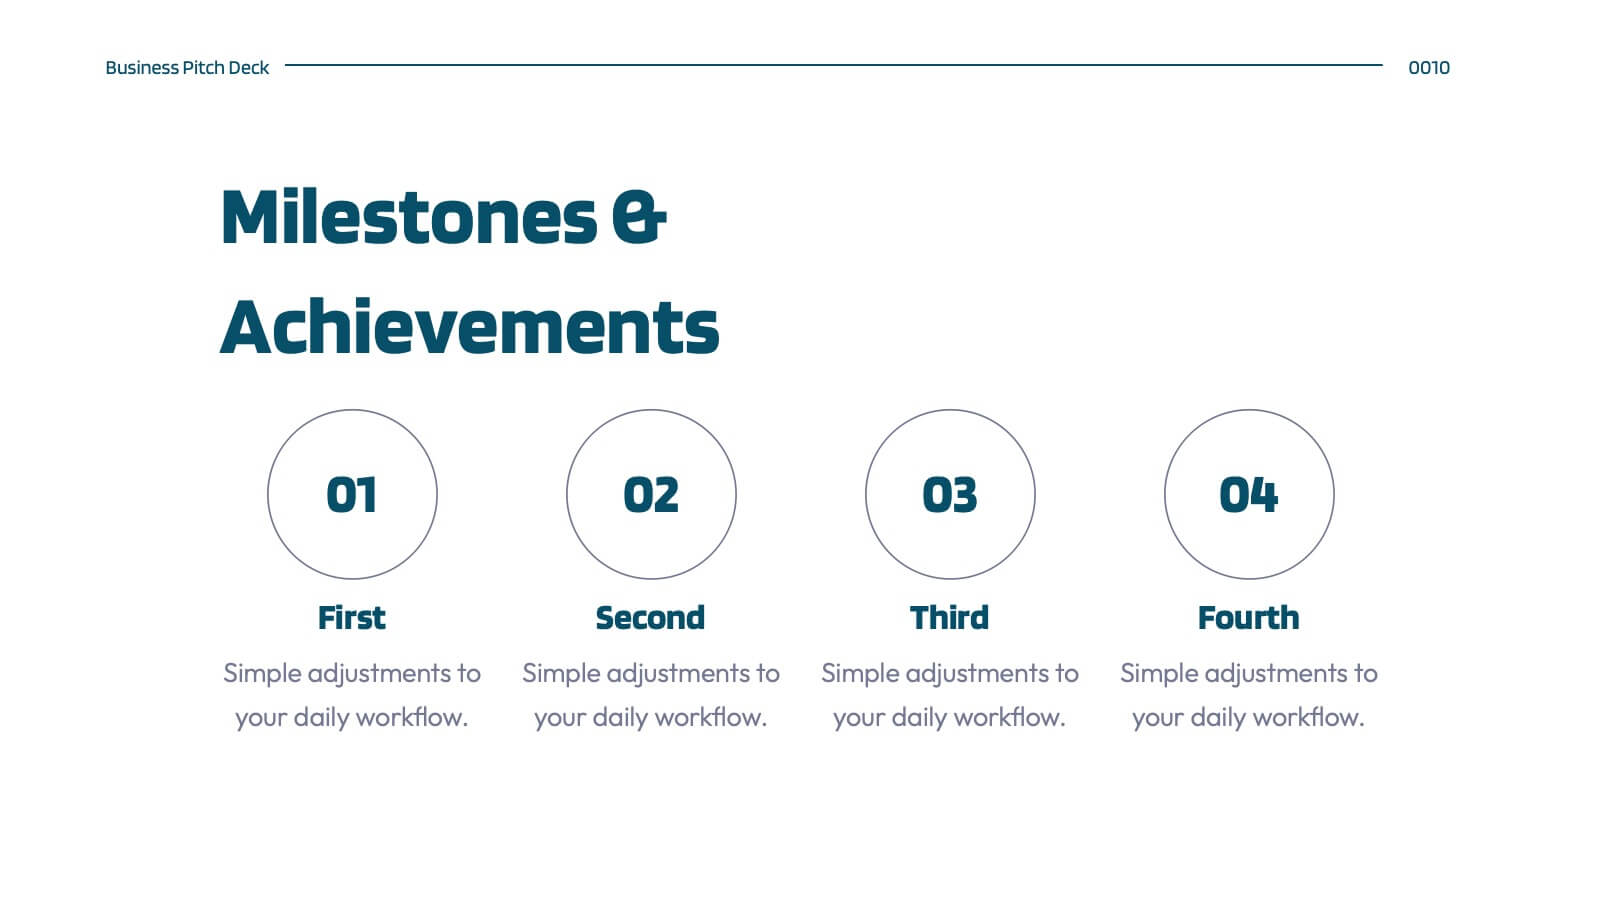
This professional corporate strategy template includes slides for market opportunity, SWOT analysis, objectives, marketing plan, revenue model, and competitive analysis. Designed for impactful presentations, it highlights financial performance, investment opportunities, and operational plans. Fully customizable in PowerPoint, Keynote, and Google Slides to suit diverse business needs.


5 slides
Cognitive Psychology Framework Presentation
Unlock insights in the most visual way possible with this bold, brain-powered slide! This presentation template helps simplify complex ideas behind how we think, reason, and remember—perfect for research, education, or team workshops. Fully customizable and compatible with PowerPoint, Keynote, and Google Slides for seamless editing across platforms.


21 slides
Sol Photography Portfolio Template Presentation
Showcase your creative work with this vibrant photography portfolio presentation template. It features sections for introductions, project descriptions, and accolades, making it perfect for photographers looking to display their style and collaborations. Compatible with PowerPoint, Google Slides, and Keynote, this template is designed to impress viewers with its dynamic layout and bright color scheme.

22 slides
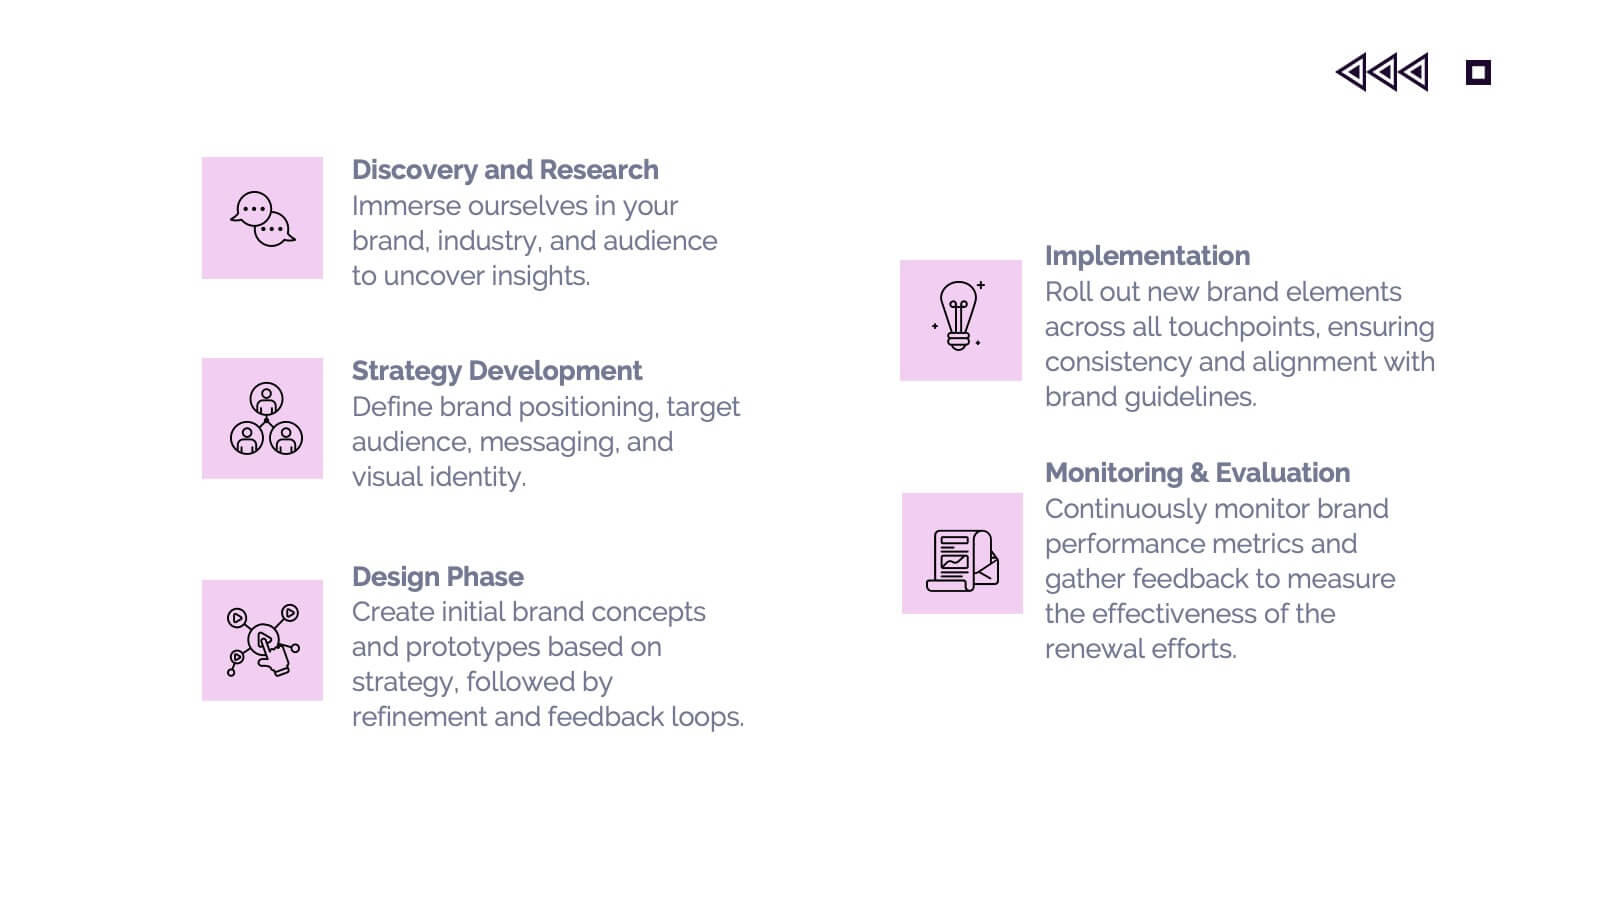
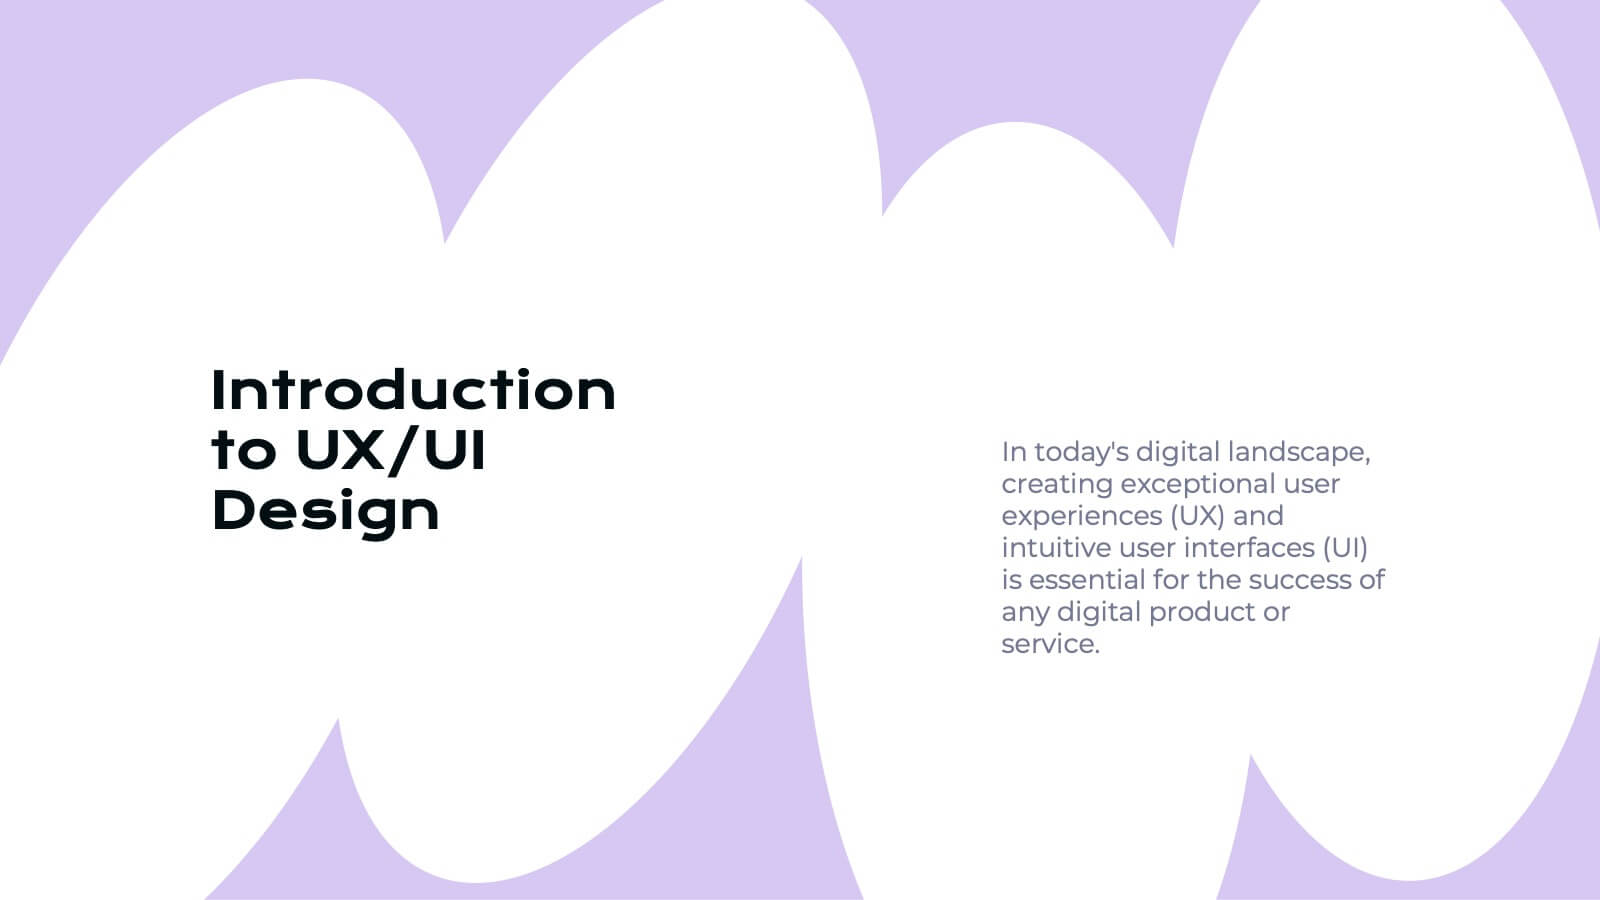
Ifrit User Experience Proposal Presentation
Unleash the power of great design with this fiery Ifrit-inspired presentation, perfect for delivering your user experience proposal! This template lets you showcase your UX strategies, research, and design process in a visually striking and well-organized format. Impress stakeholders with every slide. Compatible with PowerPoint, Keynote, and Google Slides.


6 slides
Simple TOC Layout for Deck Navigation Presentation
Guide your audience effortlessly with this Simple TOC Layout for Deck Navigation template. Featuring a clean, vertical flow with numbered icons and clear section markers, it’s ideal for organizing multi-part presentations. Fully customizable in Canva, PowerPoint, and Google Slides to match your brand colors and ensure professional, seamless navigation.


20 slides
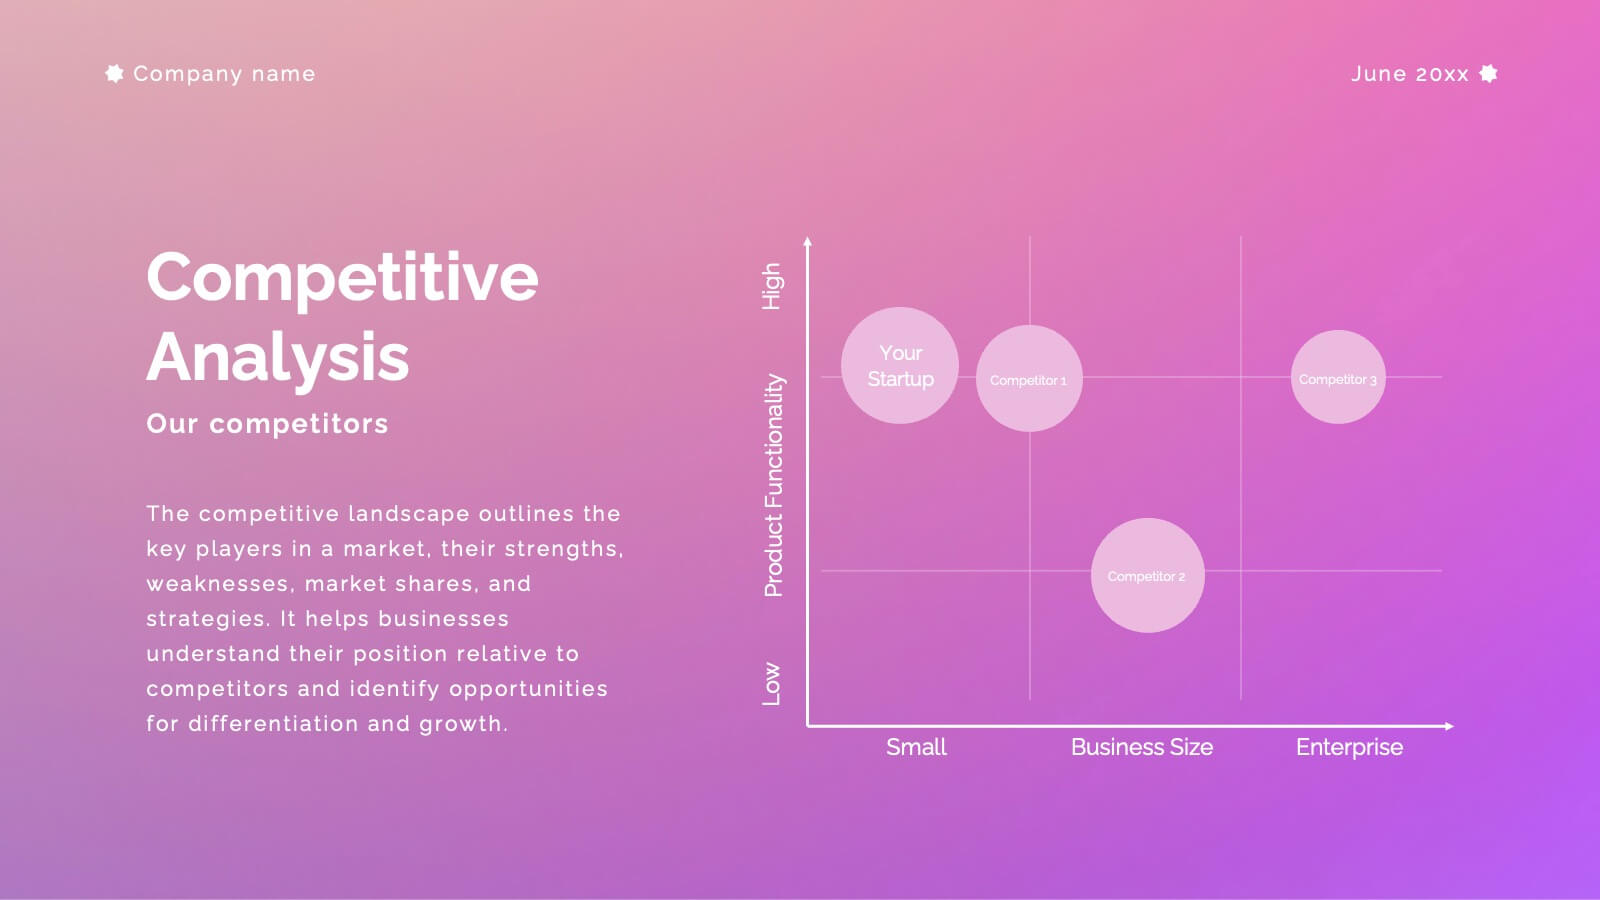
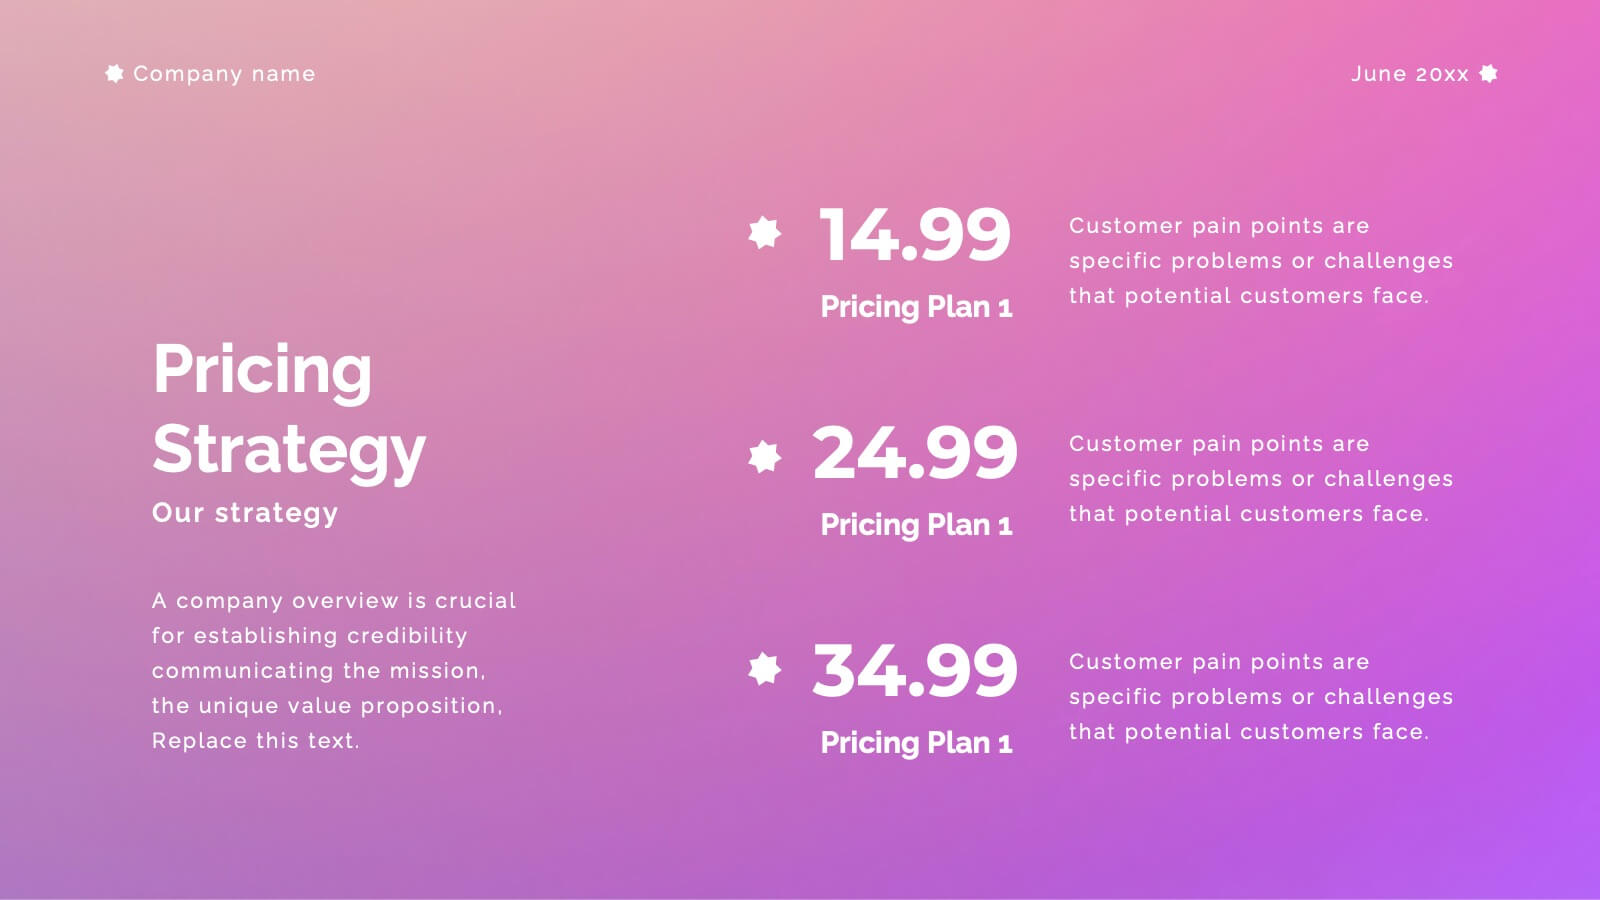
Museara Sales Pitch Deck Presentation
Create a compelling sales pitch with this dynamic and modern presentation template. It includes key sections like company overview, competitive analysis, pricing strategy, and future opportunities to help you showcase your value proposition effectively. Ideal for startups and enterprises alike. Compatible with PowerPoint, Keynote, and Google Slides for easy editing.


22 slides
Hellenic Small Business Pitch Deck Presentation
Unleash the spirit of entrepreneurship with this captivating Hellenic-themed presentation! Designed specifically for small business pitches, this template allows you to showcase your business concept, market analysis, and financial plans with elegance and clarity. Its vibrant visuals will engage your audience and leave a lasting impression. Compatible with PowerPoint, Keynote, and Google Slides.


5 slides
Business Figures and Key Numbers Overview Presentation
Present your data with clarity using this key-themed slide layout. Ideal for outlining five important metrics, business highlights, or strategic figures. The bold numerical format and clean design make your content easy to follow. Fully customizable in Canva, perfect for professional reports, pitches, and data-driven presentations.


4 slides
Business Challenge Overview Presentation
Kick off your message with a dynamic overview that makes complex challenges feel clear, visual, and manageable. This presentation helps you break down obstacles, compare factors, and guide teams toward smarter decisions with an organized, flowing layout. Fully compatible with PowerPoint, Keynote, and Google Slides.


22 slides
Thistlewisp Advertising Agency Proposal Presentation
Win clients and showcase your agency’s capabilities with this sleek and comprehensive proposal presentation! It highlights essential sections like mission and vision, client success stories, case studies, market trends, and creative processes to create a compelling pitch. Ideal for client presentations, this template is fully compatible with PowerPoint, Keynote, and Google Slides.


4 slides
Stock Market Insights and Trends Presentation
Visualize complex financial data with ease using the Stock Market Insights and Trends presentation template. This layout features a bold line chart with labeled milestones to highlight key shifts in performance, market patterns, or strategic indicators. Ideal for investment reports, financial briefings, and economic updates. Perfect for analysts, finance professionals, and business strategists. Fully editable and compatible with PowerPoint, Keynote, and Google Slides.


8 slides
Annual Highlights and Key Achievements Presentation
Showcase your biggest wins with this award-themed highlights slide. Featuring colorful trophy icons, it’s perfect for summarizing yearly accomplishments or milestones. Each section is clearly labeled to spotlight key points. Fully editable and compatible with PowerPoint, Keynote, and Google Slides—ideal for business recaps, team recognition, or performance reviews.


26 slides
Company Profile and Accomplishments Presentation
A company profile is a document that provides an overview of a business entity. This template serves as a company introduction, presenting essential information about company history, products or services, achievements, goals, and other relevant details. This template showcases the milestones and capabilities of a company. This presentation is perfect for businesses, startups, or organizations looking to highlight their success, growth, and overall expertise in their industry. The clean layout, engaging visuals, and comprehensive information, will help your presentation leave a lasting impression on your audience and enhance your company's reputation.


21 slides
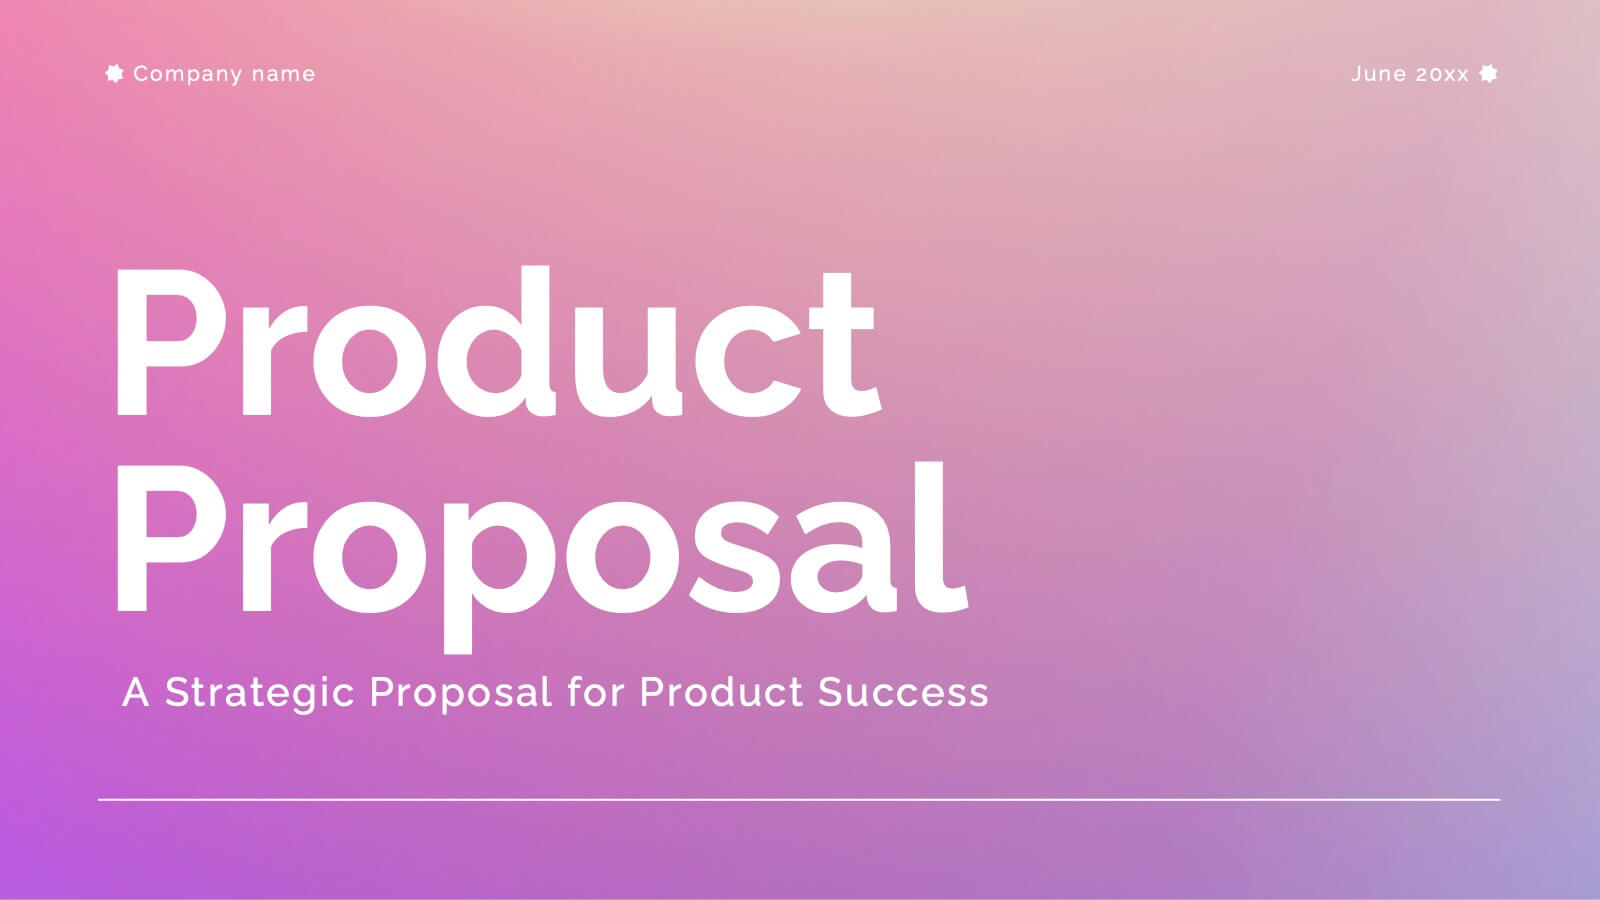
Aventurine New Product Proposal Presentation
Showcase your product in style with this vibrant and modern product proposal template! It covers everything from product features to target market, pricing strategy, and marketing plans. Designed for clarity and impact, it's perfect for pitching your product. Fully customizable, and compatible with PowerPoint, Keynote, and Google Slides for seamless presentations.