


Features
- 6 Unique Slides
- Fully editable and easy to edit in Microsoft Powerpoint, Keynote and Google Slides
- 16:9 widescreen layout
- Clean and professional designs
- Export to JPG, PDF or send by email


Do you have any questions?
Recommend


5 slides
Scientific Research Data Presentation
Bring your research to life with a clean, dynamic layout designed to simplify complex findings and highlight key scientific insights. This presentation offers a structured flow for showcasing data, experiments, or results in a clear and engaging way. Fully compatible with PowerPoint, Keynote, and Google Slides.


4 slides
Crypto Investment Strategies Presentation
Dive into the dynamic world of cryptocurrency with our "Crypto Investment Strategies" presentation templates. These templates provide a structured approach to exploring various investment strategies, perfect for financial advisors and crypto enthusiasts. Easily editable and visually engaging, they're designed to help you present complex information in a clear manner. Compatible with PowerPoint, Keynote, and Google Slides, they offer flexibility across different platforms, ensuring your presentation looks great no matter where you show it.


6 slides
Weekly Task Schedule Presentation
Stay on top of your week with this clean and efficient layout designed to organize daily priorities and action plans. Perfect for tracking goals, meetings, or team deliverables, it keeps productivity front and center. Fully customizable and compatible with PowerPoint, Keynote, and Google Slides for easy professional presentation use.


23 slides
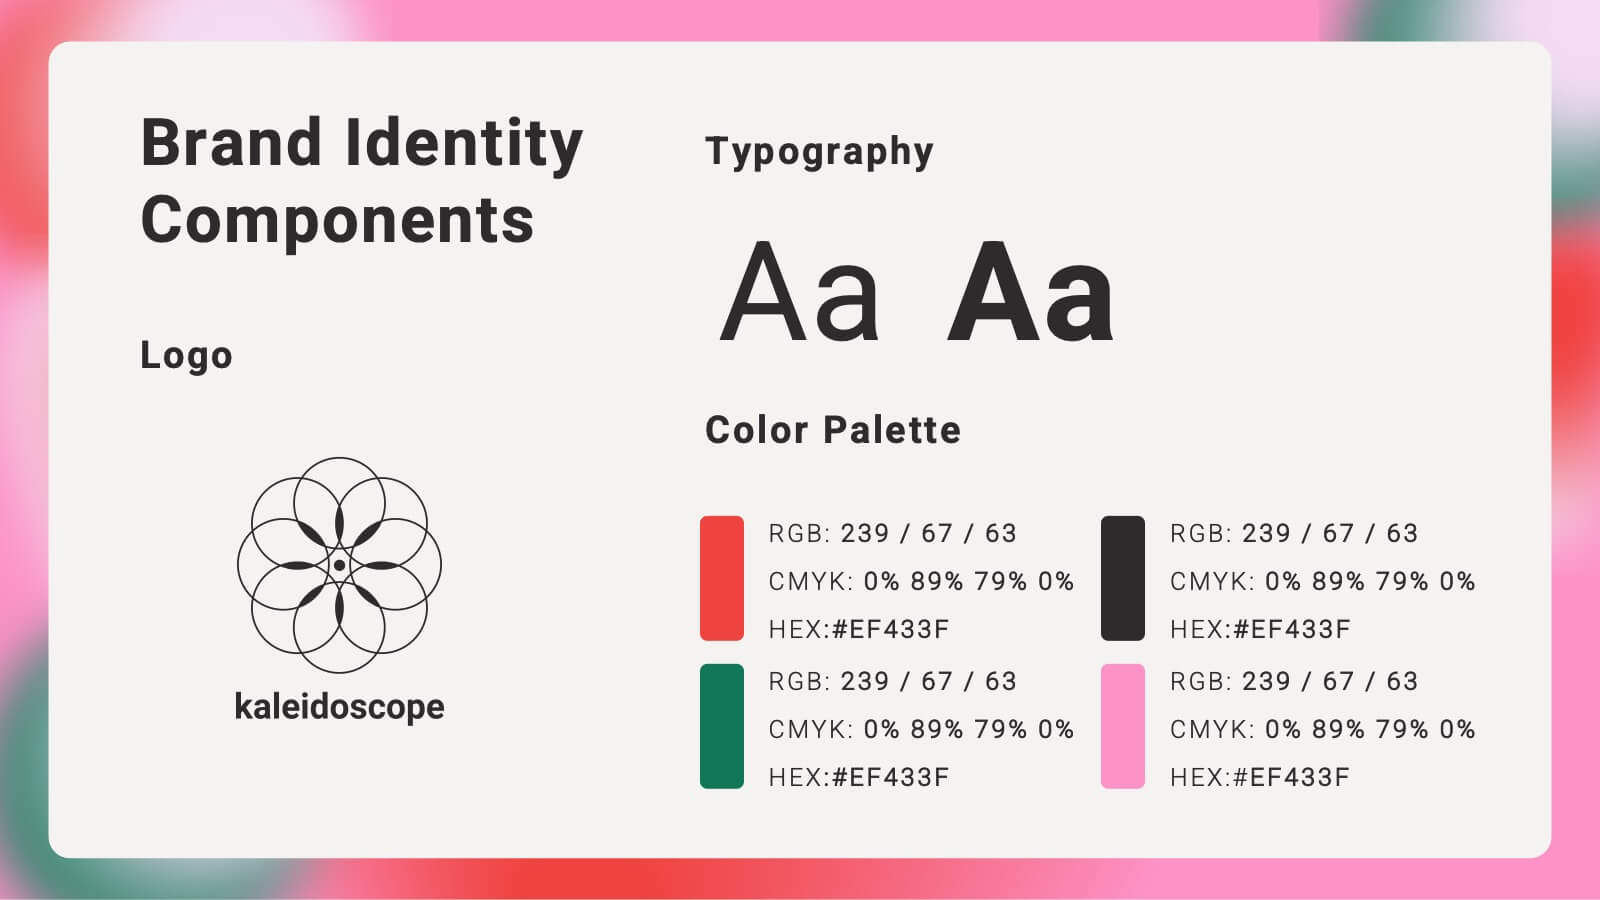
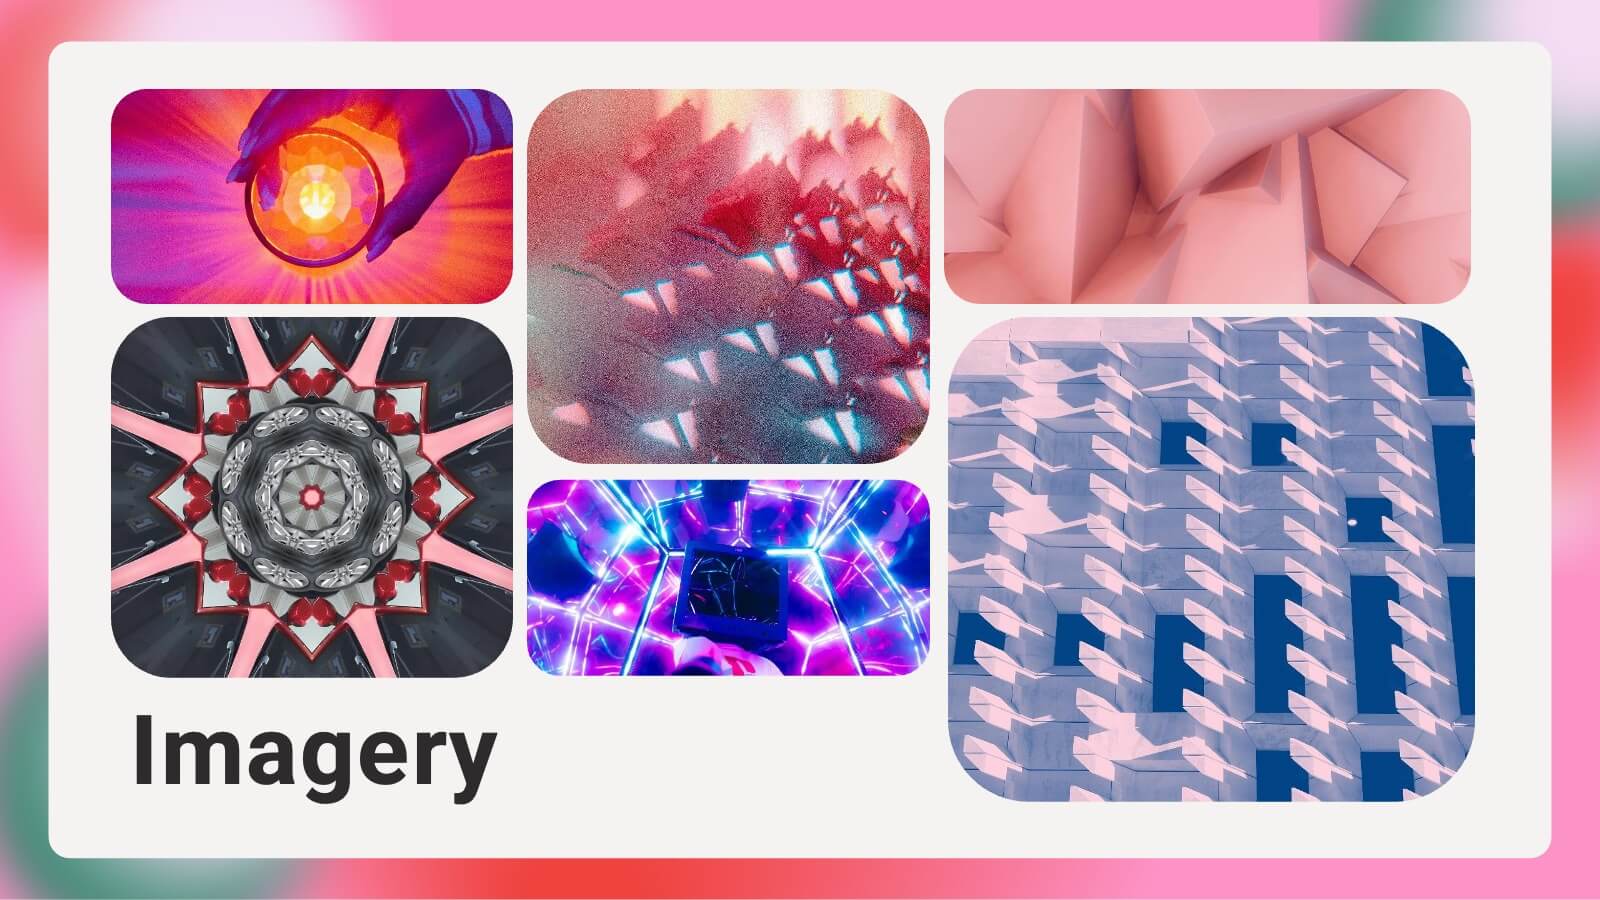
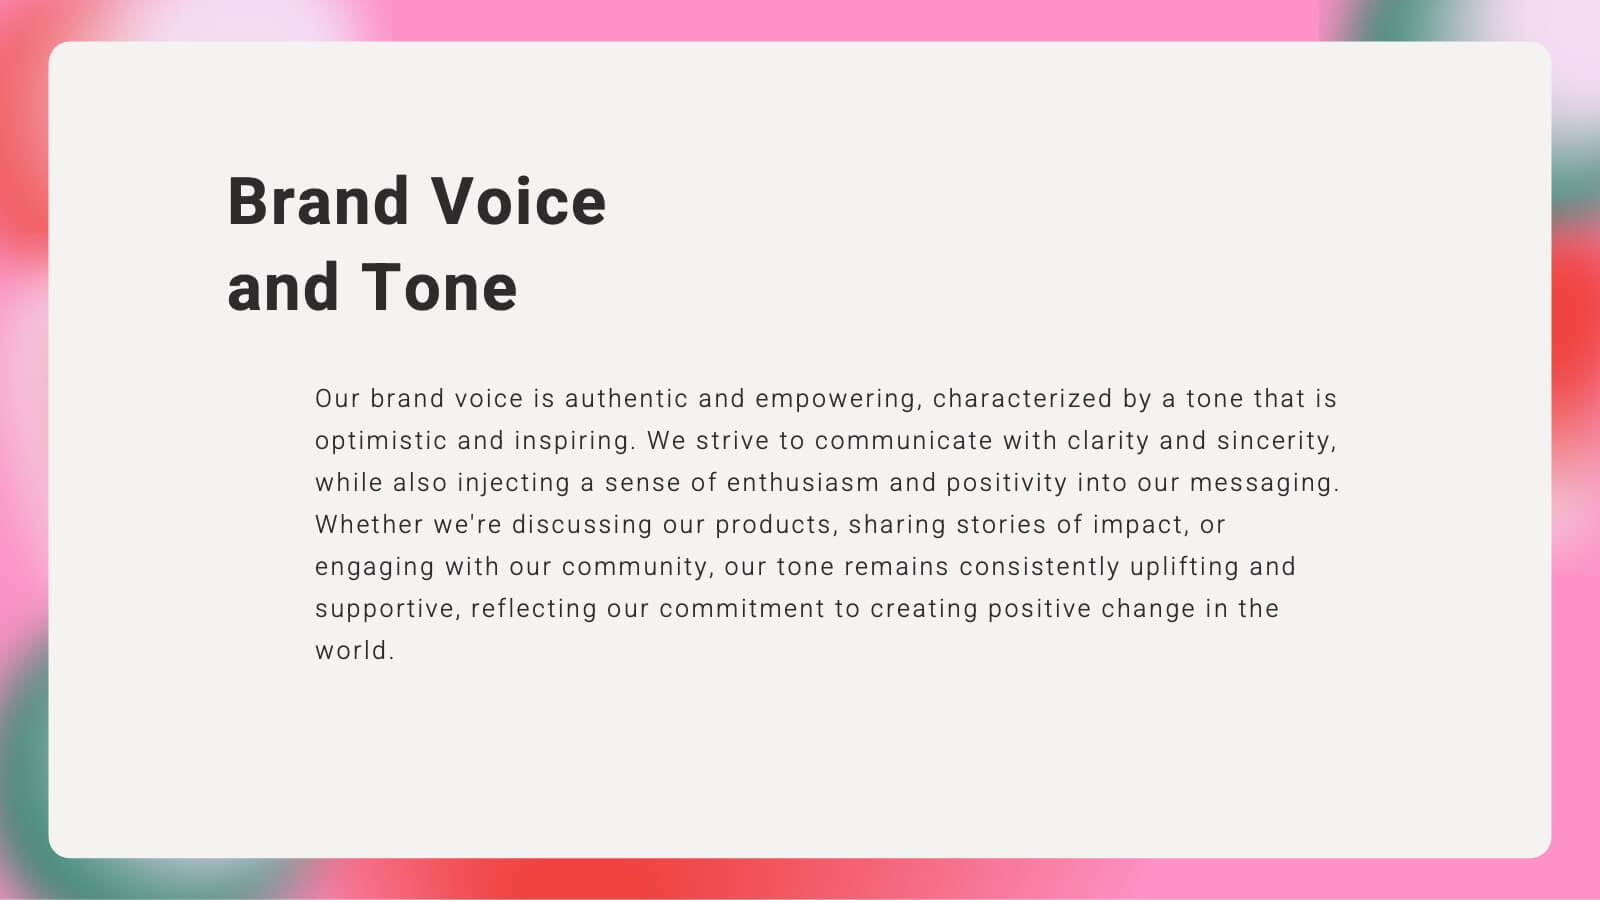
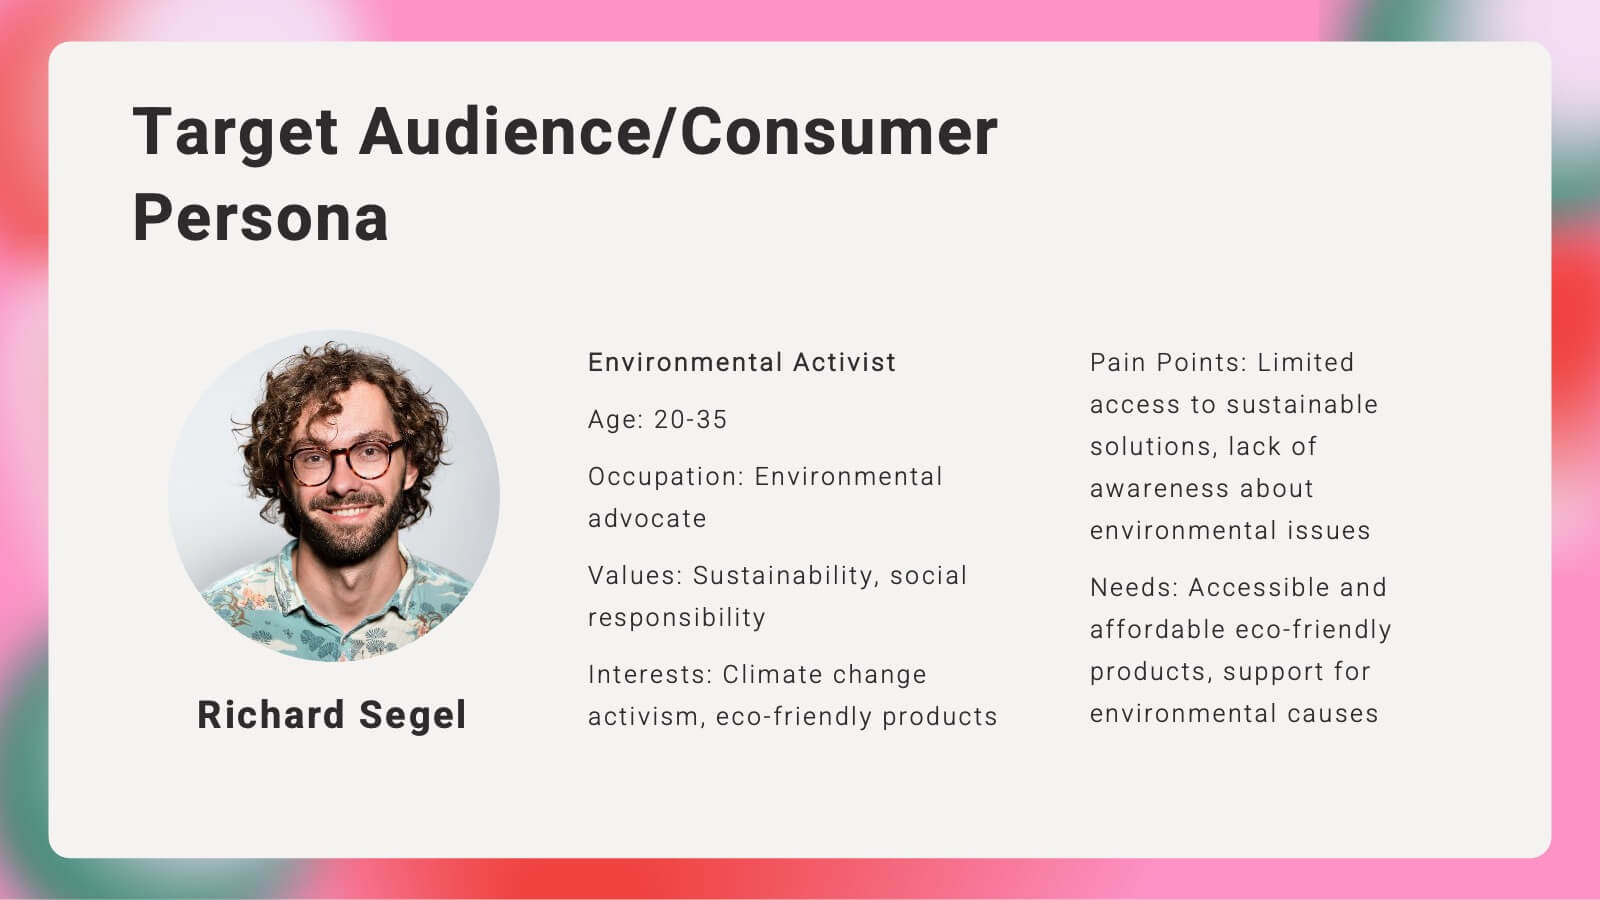
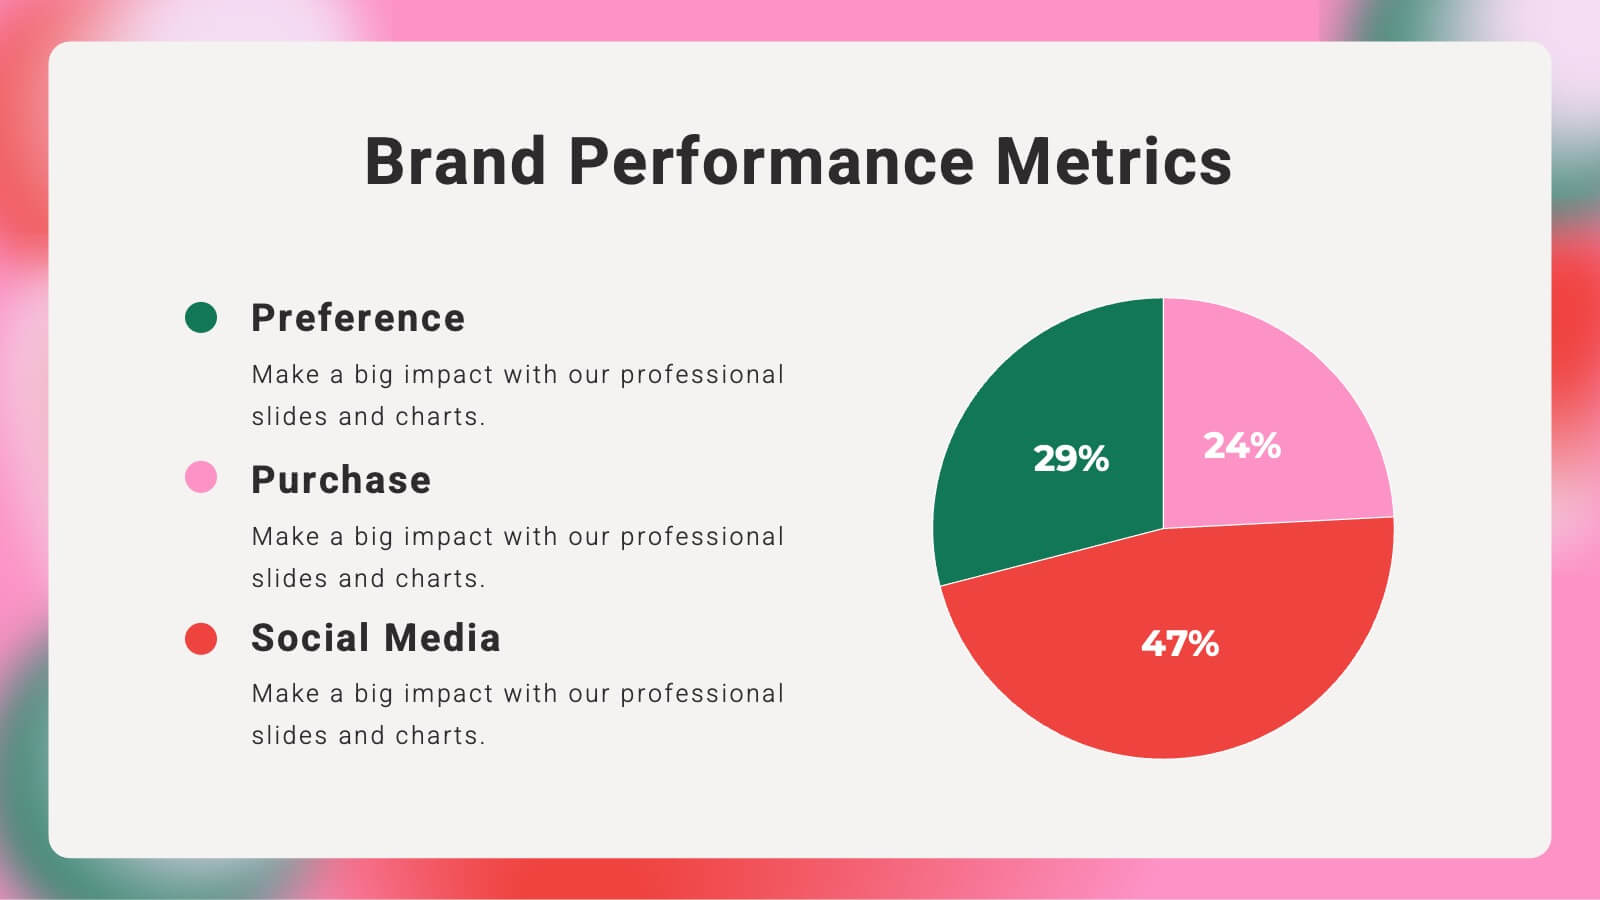
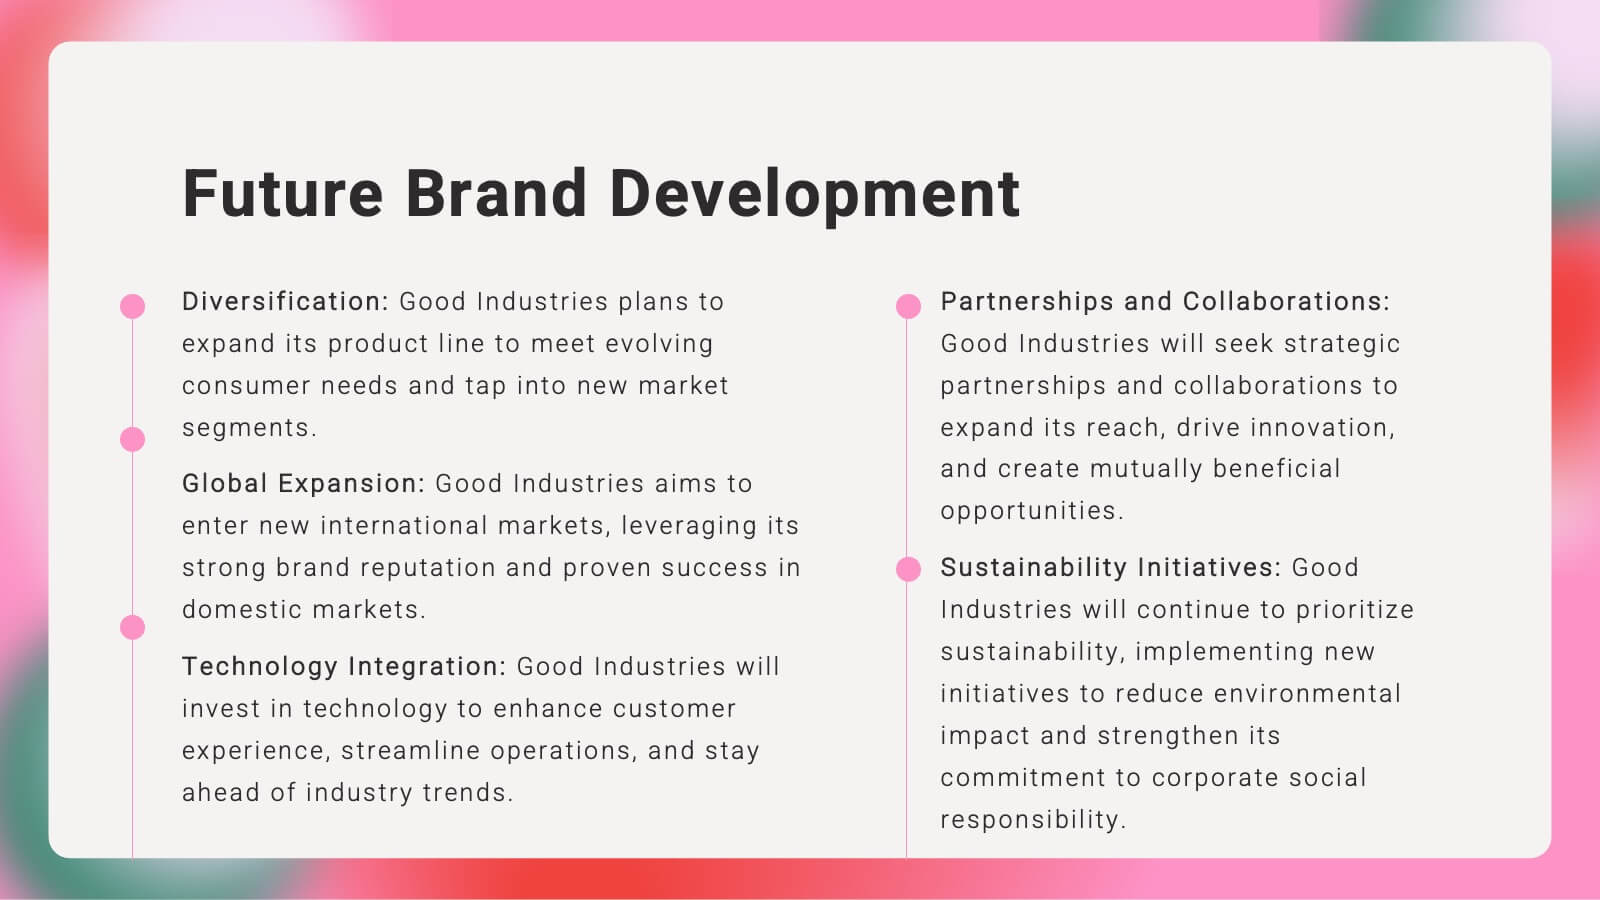
Kaleidoscope Brand Strategy Report Presentation
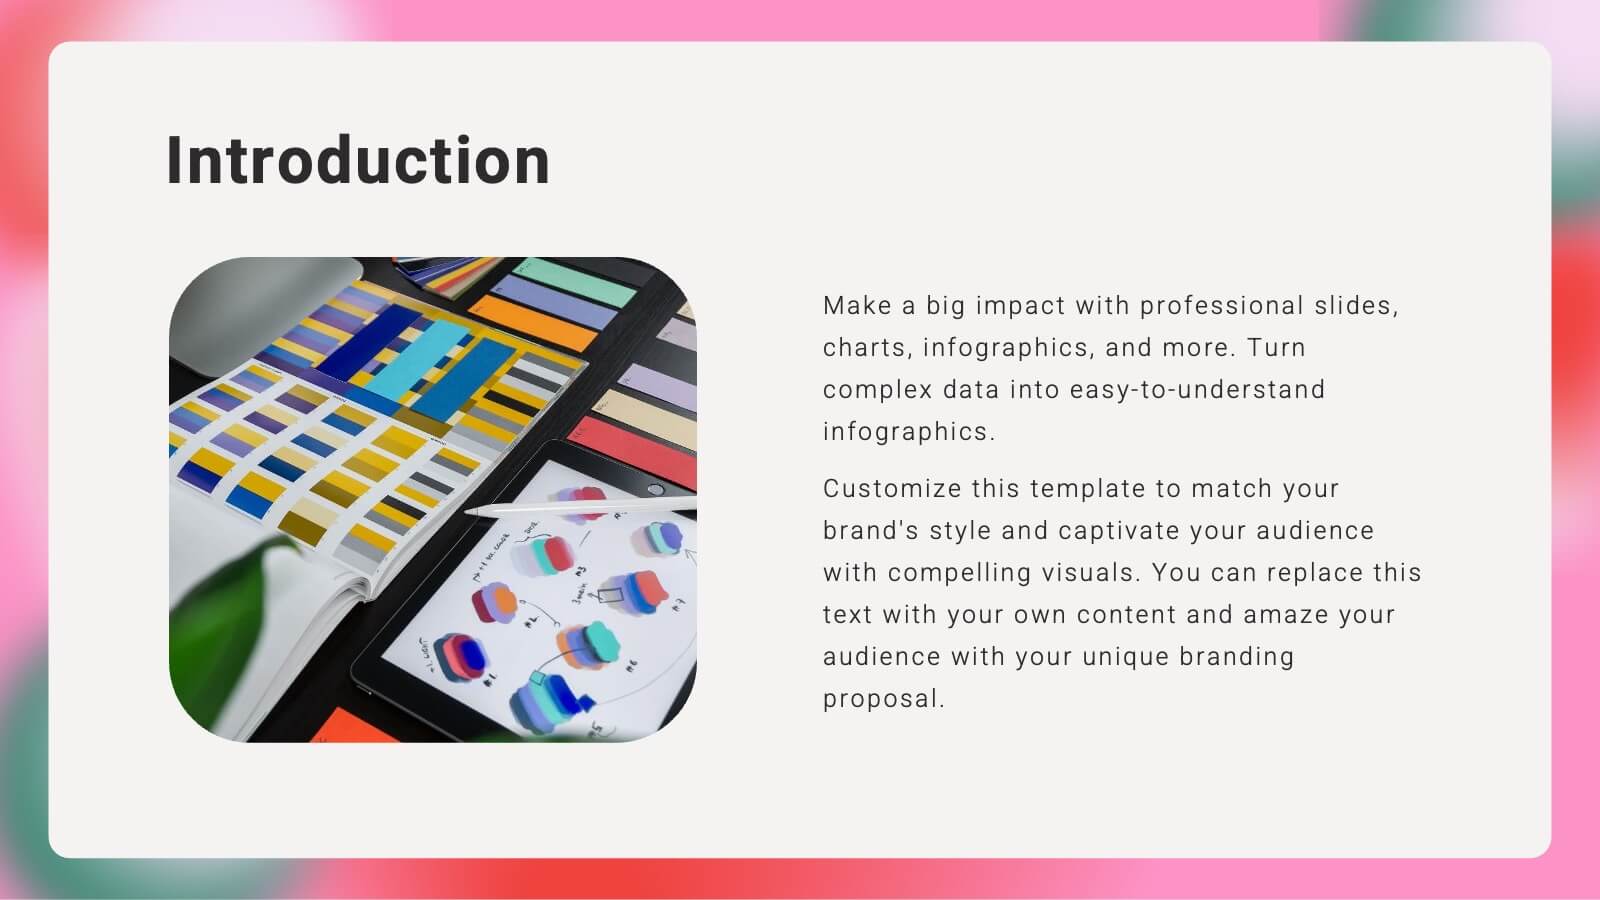
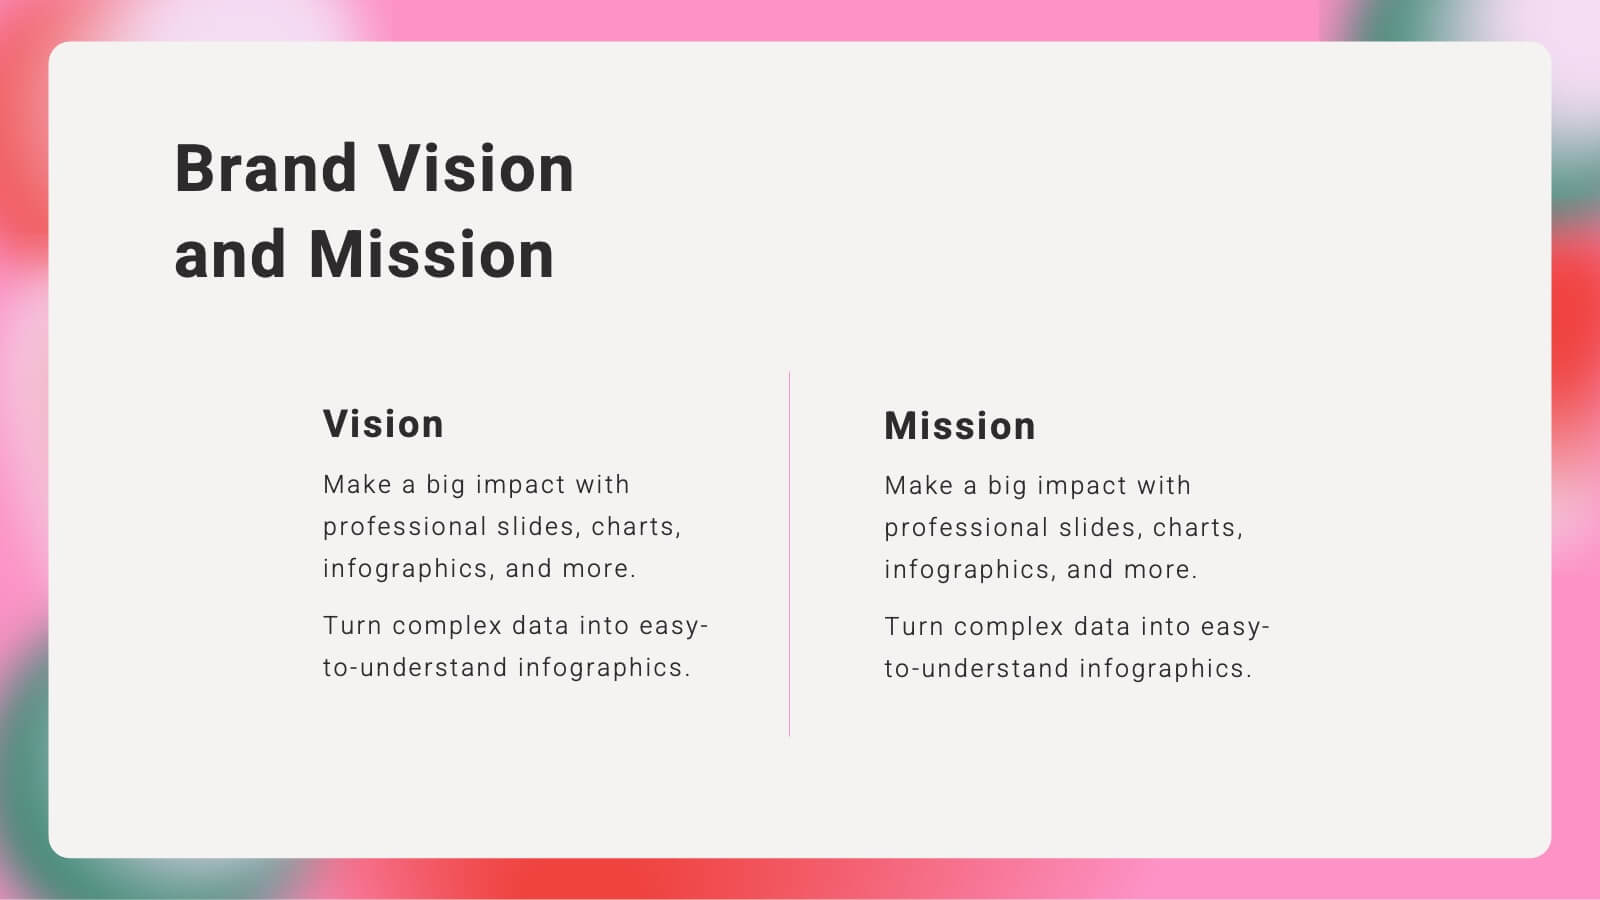
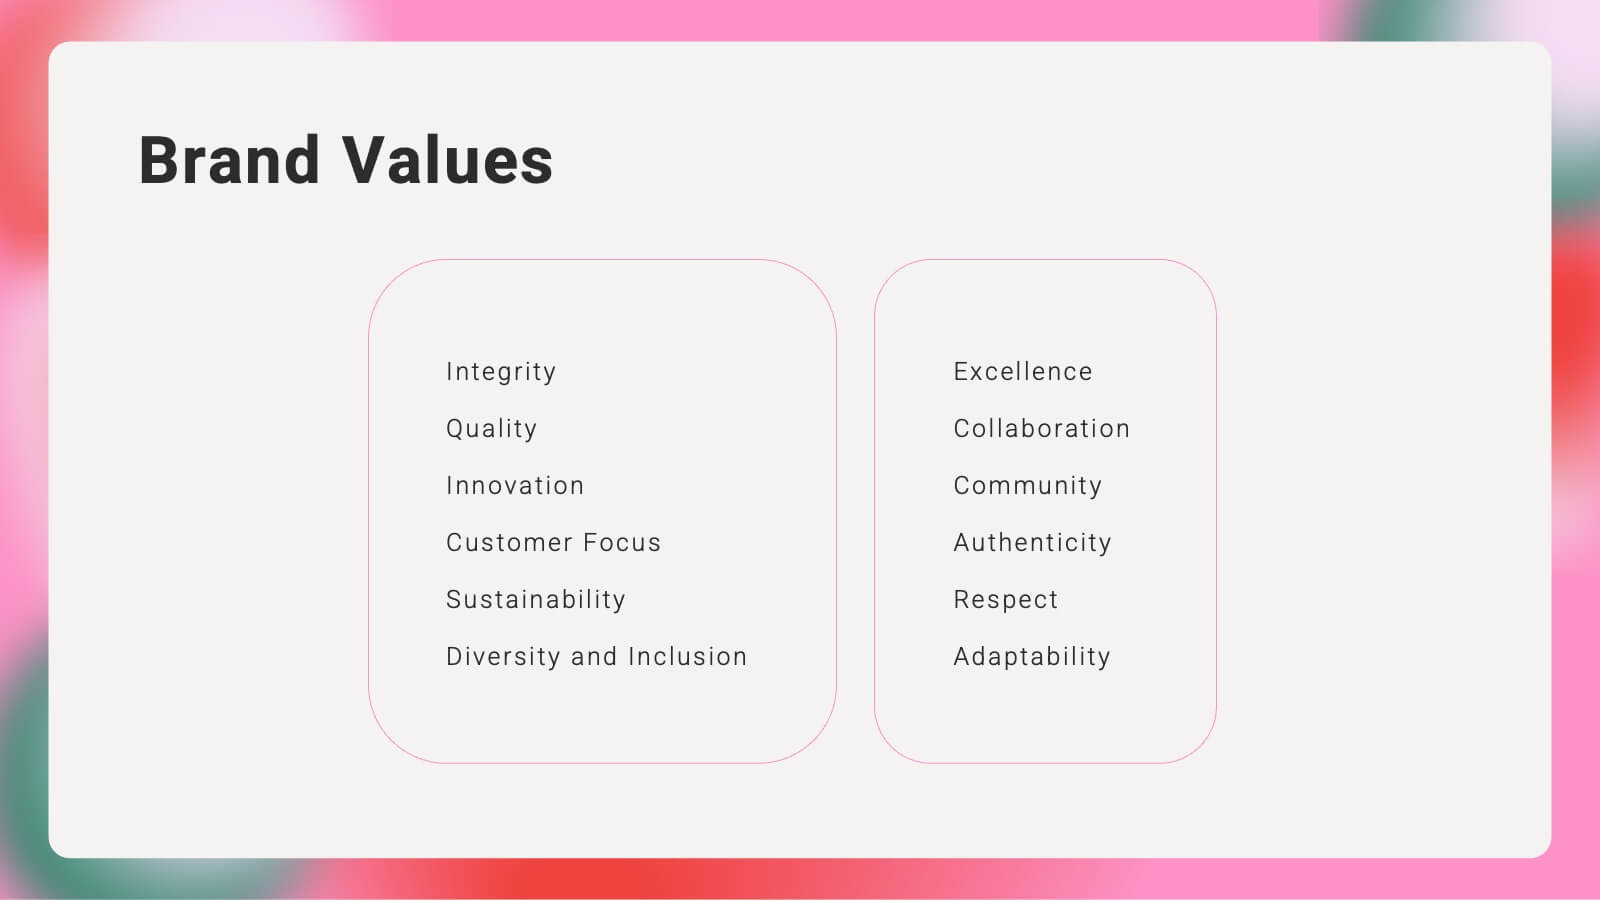
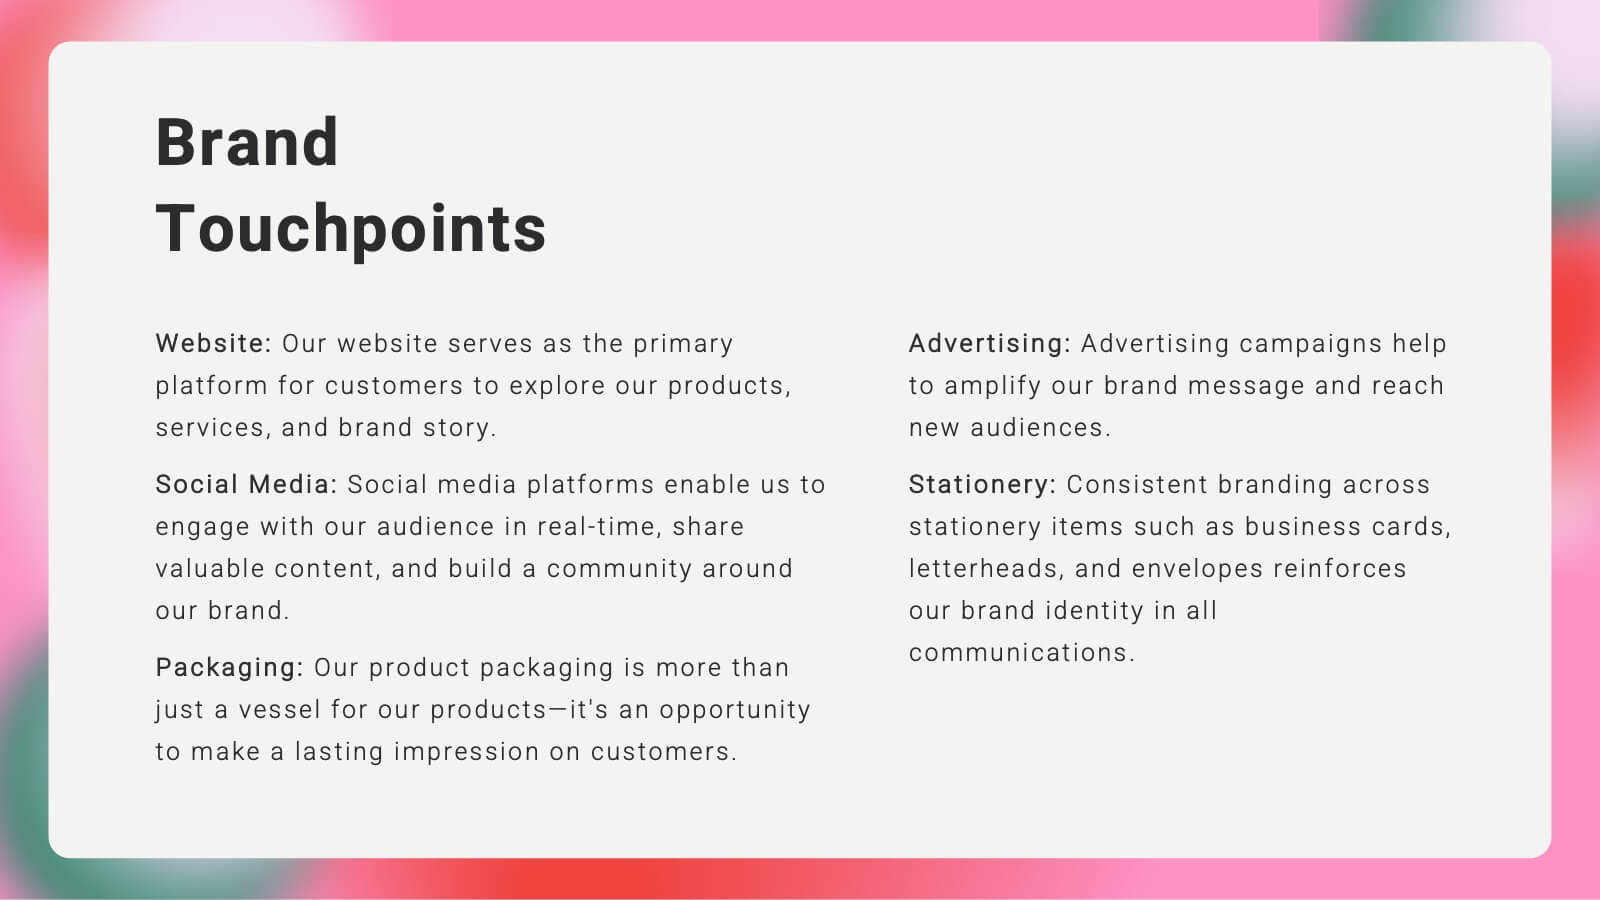
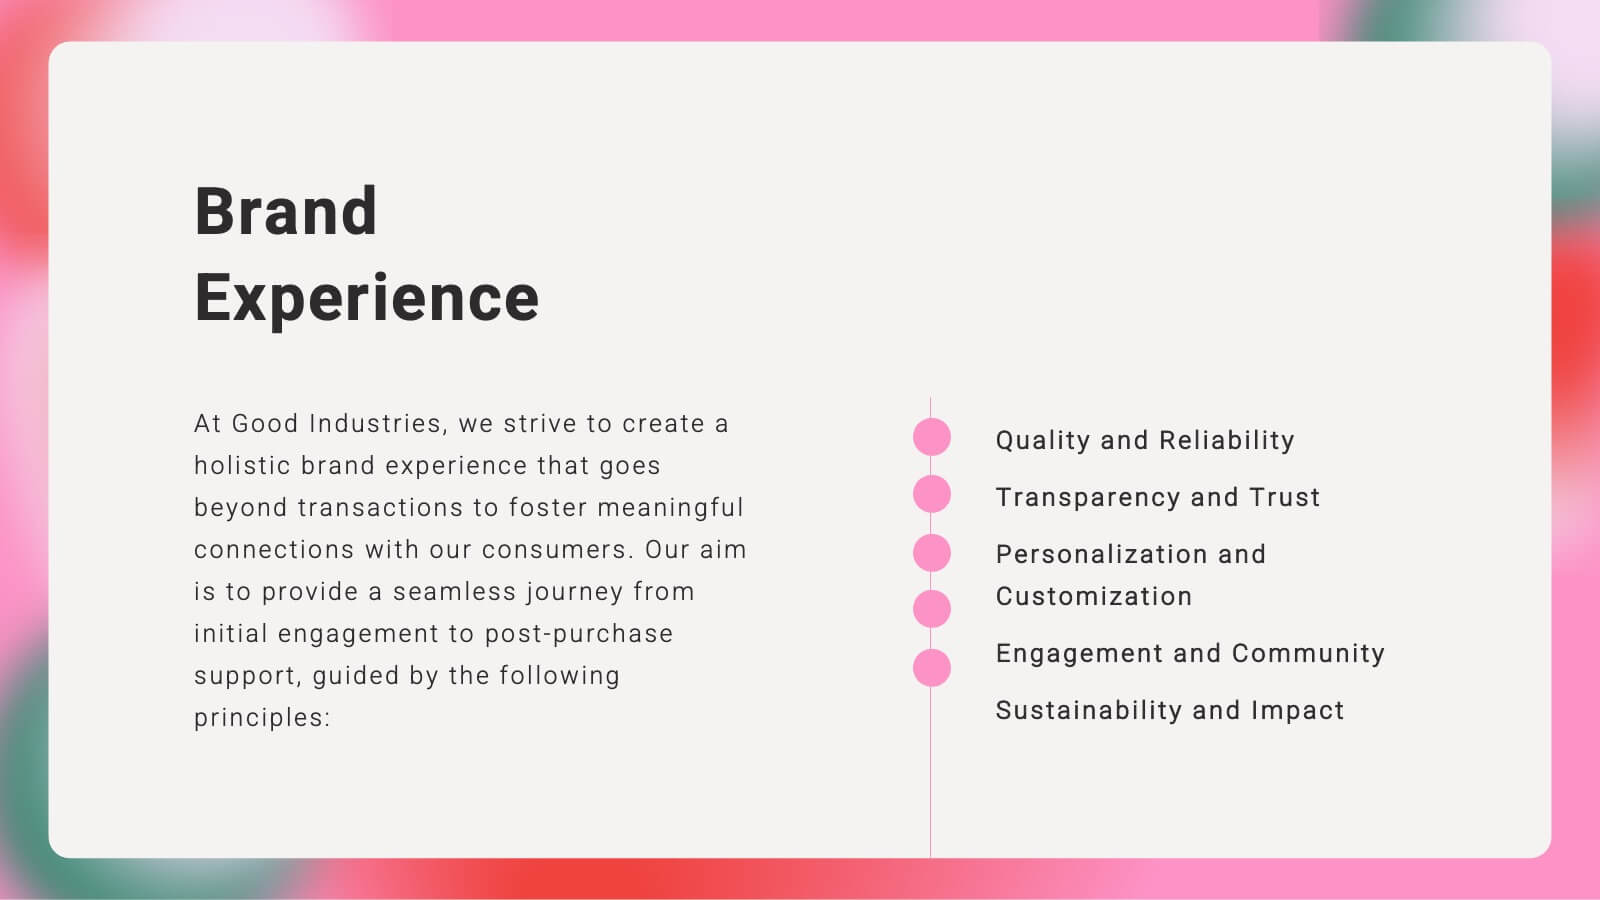
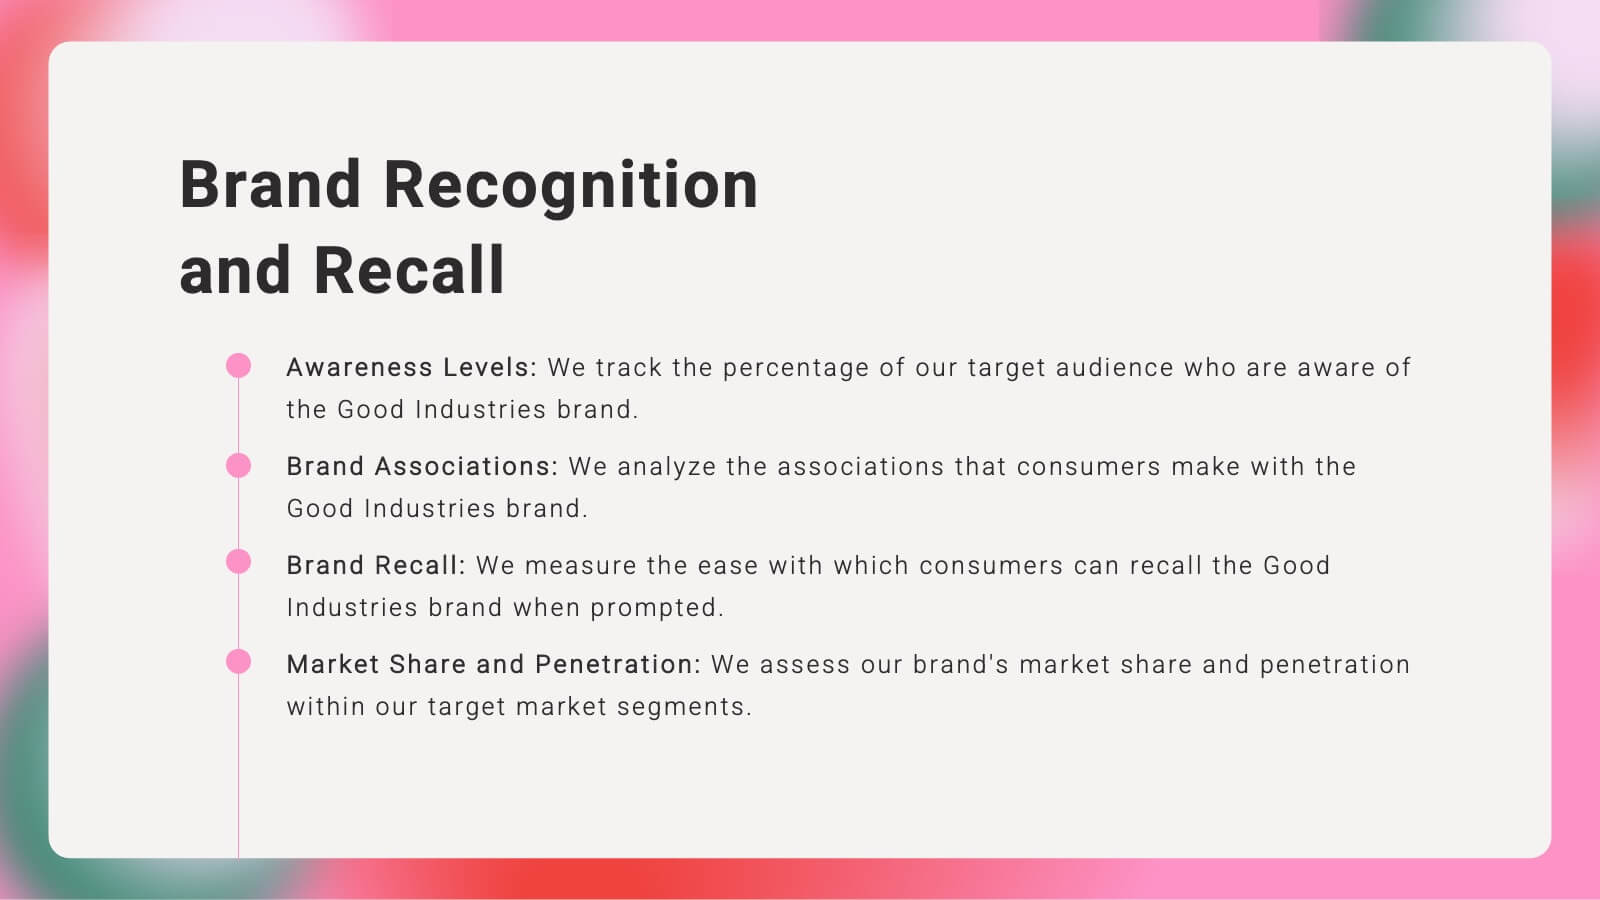
Craft a compelling narrative for your brand with this vibrant brand strategy presentation template. Designed to cover every facet of brand development, from vision and mission to market analysis and consumer personas, this template is an essential tool for businesses looking to establish a strong brand identity. It incorporates visually engaging slides that outline brand voice, values, and touchpoints, facilitating a thorough understanding of strategic branding. Compatible with platforms like PowerPoint, Google Slides, and Keynote, it is accessible across various devices, making it perfect for collaborative planning and presentations.


6 slides
Business People Services Infographic
"Business People Services" refers to a range of professional services and solutions offered to individuals and organizations to help them succeed in the business world. This infographic template is a visual representation of various services tailored to meet the needs of business professionals. This template aims to provide a quick overview of these services and their benefits. The purpose of this infographic is to convey important information in an engaging format. Use concise text, relevant visuals, and a logical structure to make it easy for business professionals to understand and benefit from your data presented.


22 slides
Arachne Digital Marketing Strategy Plan Presentation
Weave a powerful digital marketing strategy with this sleek, Arachne-inspired presentation! Perfect for outlining your digital marketing plans, this template helps you highlight key strategies, analytics, and campaign goals in a structured and visually engaging way. Its modern design keeps your audience focused. Compatible with PowerPoint, Keynote, and Google Slides.


5 slides
Natural Disasters in the World Infographics
Natural Disasters are catastrophic events that occur as a result of natural processes or phenomena, and they can have severe impacts on human life, property, and the environment. These infographics are visually striking presentation templates that highlight various types of natural disasters that occur worldwide. It provides an overview of the most common natural disasters, their causes, and their impact on the environment and human lives. It is suitable for educational presentations, environmental discussions, disaster preparedness campaigns, and any other context where understanding natural disasters is essential.


7 slides
Empathy Map Infographic Presentation Template
An Empathy Map is a collaborative tool organizations can use to gain a deeper insight into their customers. Similar to a user persona, an empathy map can represent a group of users, such as a customer segment. An empathy map helps to map what a design team knows about the potential audience. Use this template to gain a deeper understanding of your target audience. This template comes with many empathy maps you can use to discover how to empathize with your customers. The empathy maps available in this template are designed to give you an avenue into the mind of your target audience.


7 slides
Business Model Canvas Value Infographic
The business model canvas is a strategic management tool that provides a visual framework for developing, describing, and analyzing a business model. Prepare for a dynamic voyage through business success with our business model canvas value infographic. This is not just a blueprint; it's a vivid map to unlock the value potential in your business model. Navigate through the core elements, envision your venture, and redefine success. Compatible with Powerpoint, Keynote, and Google Slides. Showcase how a strong customer relationships is key. With this infographic illustrate the strategies to keep your audience coming back for more!
5 slides
Key Milestone Tracker for Projects Presentation
Track project progress and celebrate wins with the Key Milestone Tracker for Projects Presentation. This template features a vertical flow of trophy icons embedded in hexagons, each representing a major milestone. Ideal for showcasing achievements, timelines, or key phases in a project lifecycle. Fully customizable and compatible with PowerPoint, Keynote, and Google Slides.


7 slides
Professional Goals Infographic
Unfold the pathway to success with our professional goals infographic. Designed to help individuals and organizations visualize and track their aspirations, this infographic offers a comprehensive look at professional milestones and strategies to achieve them. The primary palette revolves around a pristine white backdrop, enhanced by accents of vibrant orange and a mix of complementary colors to distinguish different areas. Its design ensures seamless integration into PowerPoint, Keynote, or Google Slides presentations, transforming your professional goals discourse into a visually engaging experience.


5 slides
Financial Investment Portfolio Presentation
Visualize portfolio distribution like never before. This presentation features glass dome-protected coin stacks to represent diverse asset categories, risk levels, or growth stages. Ideal for financial advisors, investors, or business analysts presenting asset management plans. Fully editable in PowerPoint, Keynote, and Google Slides.


6 slides
Ideal Buyer Persona Customer Profile Presentation
Define your perfect customer with the Ideal Buyer Persona Customer Profile Presentation. This clear and visually structured layout helps you map out key traits, behaviors, and needs of your target audience. Easy to edit in Canva, PowerPoint, or Google Slides—ideal for marketing teams, strategists, and business development presentations.


6 slides
Company Hierarchy Infographics
Effectively illustrate your company's hierarchy with our Company Hierarchy infographic template. This template is fully compatible with popular presentation software like PowerPoint, Keynote, and Google Slides, allowing you to easily customize it to showcase your organization's structure and reporting relationships. The Company Hierarchy infographic template offers a visually engaging platform to depict the different levels of leadership, departments, and roles within your company. Whether you're an HR professional, manager, or business leader, this template provides a user-friendly canvas to create informative presentations and organizational charts. Optimize your communication of your company's hierarchy with this SEO-optimized Company Hierarchy infographic template, thoughtfully designed for clarity and ease of use. Customize it to showcase leadership teams, reporting lines, and the key responsibilities of each role, ensuring that your audience gains a comprehensive understanding of your organization's structure. Start crafting your personalized infographic today to effectively communicate your company's hierarchy.


6 slides
Work From Home Opportunities Infographic
Work-from-home opportunities refer to job positions, projects, or tasks that allow individuals to work remotely from their own homes or any other location outside of a traditional office setting. This infographic template is a visual representation that provides information about different types of remote job opportunities and the benefits of working from home. This template can be divided into sections, to highlight specific categories of remote jobs. The images and icons are included to convey the idea of working from home, such as a home office setup or a person working on a laptop. This is compatible with Powerpoint, Keynote, and Google Slides.


4 slides
Leadership and Team Challenges Presentation
Illustrate your team’s journey with this engaging visual that highlights progress, obstacles, and achievements. Featuring a dynamic leader figure ascending an arrow-shaped path, this template is ideal for showcasing leadership development, team-building stages, or challenge-resolution frameworks. Fully editable and compatible with PowerPoint, Keynote, and Google Slides.


6 slides
Personal and Business Insurance Plans Presentation
Compare and Present Insurance Options effortlessly with this Personal and Business Insurance Plans Presentation template. Designed to clearly illustrate different insurance plans, this slide helps in comparing coverage options, benefits, and key features for both personal and business policies. Ideal for insurance agencies, financial consultants, and corporate presentations, this template is fully customizable and compatible with PowerPoint, Keynote, and Google Slides for seamless editing.