


Features
- 6 Unique slides
- Fully editable and easy to edit in Microsoft Powerpoint, Keynote and Google Slides
- 16:9 widescreen layout
- Clean and professional designs
- Export to JPG, PDF or send by email


Do you have any questions?
Recommend


6 slides
Pyramid-Triangle Visual Logic Presentation
Present interconnected concepts with clarity using the Pyramid-Triangle Visual Logic Presentation. This layout uses a hexagonal pyramid structure to show relationships between six ideas or categories, making it ideal for strategy models, balanced frameworks, or multi-step solutions. Each section includes a title, icon, and editable content block to ensure clarity and customization. Compatible with PowerPoint, Keynote, and Google Slides.


6 slides
Training Jobs Infographics
Explore the dynamic field of Training Jobs with our customizable infographic template. This template is fully compatible with popular presentation software like PowerPoint, Keynote, and Google Slides, allowing you to effortlessly tailor it to highlight specific training job opportunities and information. The Training Jobs infographic template offers a versatile platform for presenting job trends, qualifications, and opportunities within the training industry. Whether you're an HR professional, a job seeker, or involved in talent development, this template provides a user-friendly canvas to create engaging presentations and informative materials. Elevate your understanding of Training Jobs with this SEO-optimized infographic template, designed for clarity and ease of use. Customize it to showcase job roles, required skills, and industry insights, helping both job seekers and employers navigate the training job landscape effectively. Start crafting your personalized infographic today to excel in the world of training employment!


6 slides
Numerical Data Infographic Presentation
Present complex data in a visually engaging way with the Numerical Data Infographic Presentation template. Featuring bar charts, percentage indicators, and segmented data visuals, this template makes statistical analysis clear and digestible. Perfect for business reports, analytics presentations, and performance reviews, this fully editable set is compatible with PowerPoint, Keynote, and Google Slides.


7 slides
Brain Infographic Presentation Template
Brain infographics can be used to communicate your business ideas in a unique way. The images provide a visual explanation of the project breakdown and how every step is important for a successful project execution. This brain infographic template is the perfect visual to show off your critical thinking skills, with a clear focus on planning and execution. Use this infographics template to illustrate the planning of your project, its control and monitoring, as well as its targets and execution. This template is a fun way to shed light on how our brains react to visuals in content.


6 slides
Innovation Ideas Infographics
Energize your presentations with our Innovation Ideas infographic, designed for full compatibility with Powerpoint, Keynote, and Google Slides. This vibrant and insightful infographic is the perfect addition for innovators, entrepreneurs, and educators looking to foster a culture of creativity and ideation. The infographic provides a visual exploration of the innovation process, from ideation to execution. It highlights key concepts and strategies that stimulate creative thinking and drive innovation within teams and organizations. With a focus on collaborative brainstorming and the incubation of ideas, it serves as a guide to developing groundbreaking concepts. Incorporating this infographic into your slides will help you effectively communicate the dynamics of successful innovation strategies. It’s ideal for workshops, team meetings, and academic courses that cover topics such as design thinking, innovation management, and product development. Use it to inspire your audience and to illustrate a roadmap for transforming ideas into tangible innovations.


23 slides
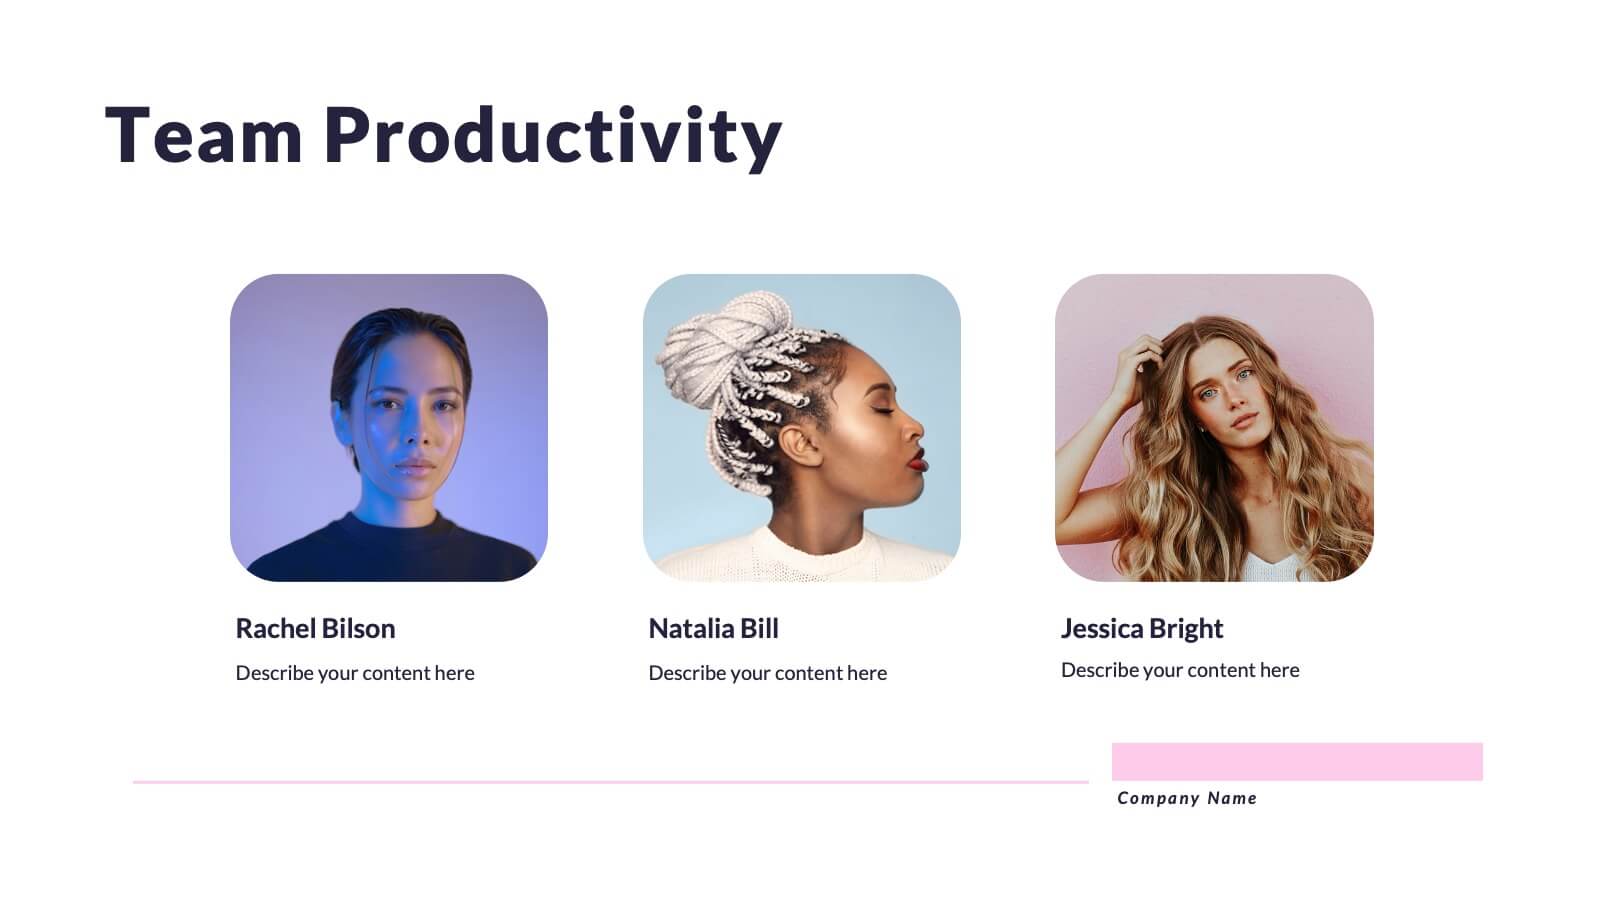
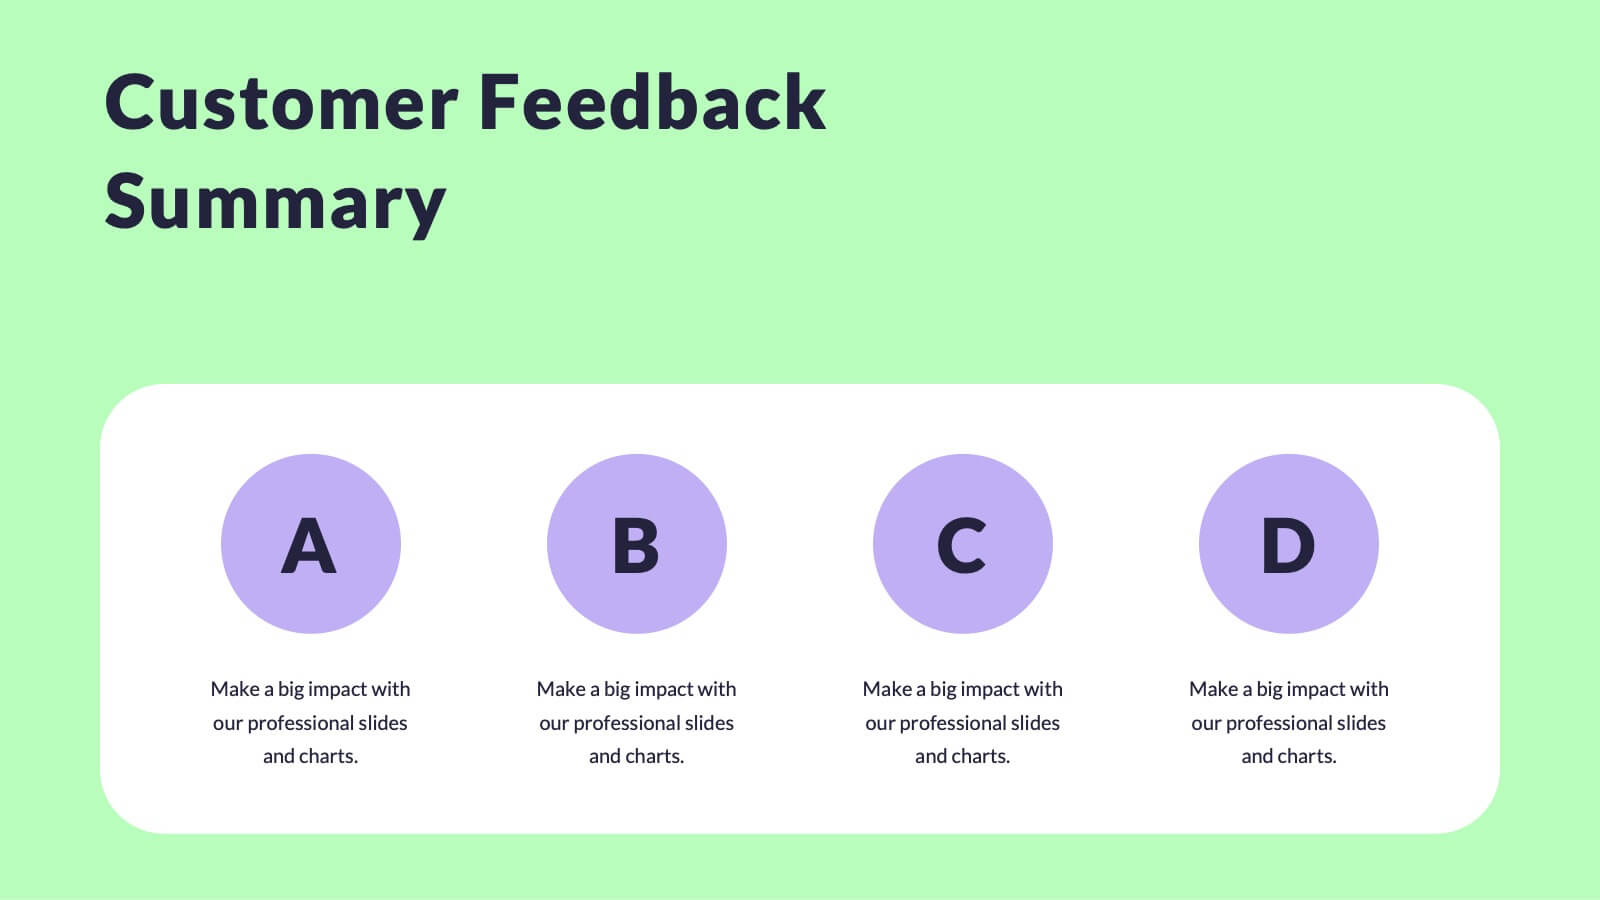
Rainshadow Digital Strategy Presentation
This Digital Strategy Presentation Template is designed to provide a structured approach to planning and implementing digital initiatives. Covering essential elements such as market trends, competitive analysis, value proposition, and risk management, it offers a professional framework to align goals with actionable steps. Fully customizable and compatible with PowerPoint, Keynote, and Google Slides.


4 slides
3-Step Action Plan Next Steps Presentation
Turn your next big idea into a clear, achievable plan with this structured, goal-focused layout. Designed to visualize progress through three defined stages, it’s perfect for strategic planning, project timelines, or team roadmaps. Fully compatible with PowerPoint, Keynote, and Google Slides for smooth editing and professional presentation delivery.


22 slides
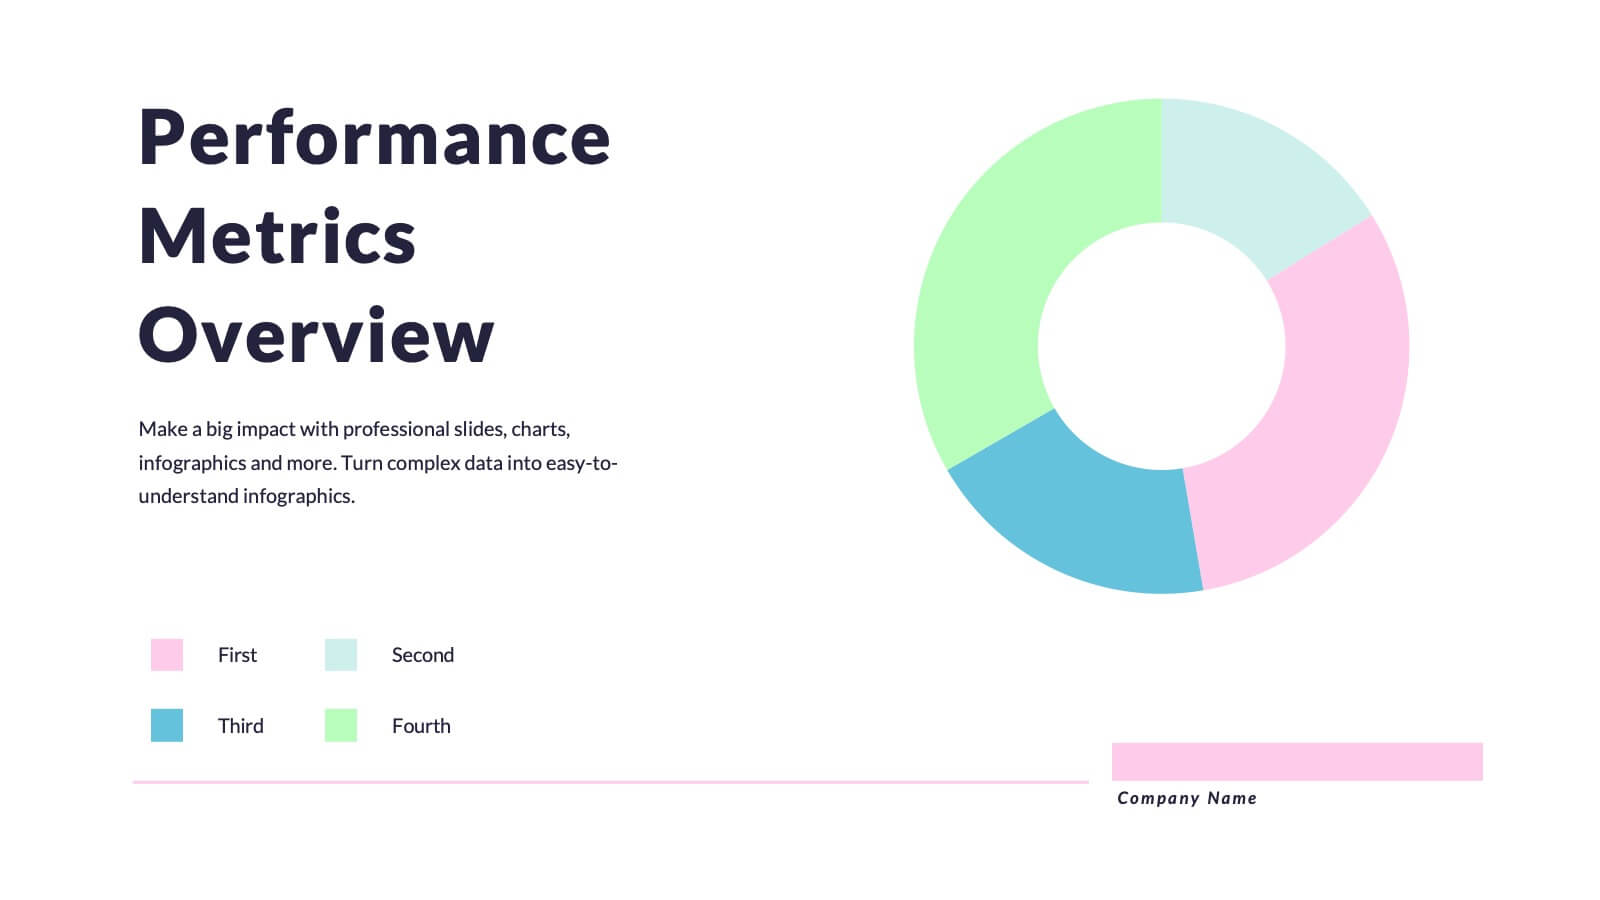
Quantum Research Findings Report Presentation
Discover insights like never before with this vibrant presentation template! Perfect for showcasing research findings, it includes slides for key findings, performance metrics, and market trends. Clearly present data and engage your audience with visually appealing graphics. Compatible with PowerPoint, Keynote, and Google Slides, making it easy to use on any platform.


7 slides
SCRUM Roles Infographic
Dive into the agile world with our SCRUM roles infographic. This template is designed to depict the various roles within the SCRUM framework, offering clarity and insight into the collaborative heart of agile methodologies. With a clean white canvas set against hues of blue, it provides a modern yet comprehensive overview of the roles. Ideal for agile coaches, trainers, and organizations transitioning to agile methodologies, this infographic is tailored to showcase the importance of each role. With its compatibility, spanning PowerPoint, Keynote, and Google Slides, presentations are bound to be a breeze, regardless of the platform you favor.


7 slides
Premium Credit Card Infographic
A premium credit card, is a type of credit card that offers enhanced benefits and exclusive features compared to standard credit cards. This infographic template provides an overview of premium credit cards, showcasing their exclusive benefits and empowering users to make informed financial decisions. Present different types of premium credit cards available, showcasing how each caters to specific needs and preferences. Fully customizable and compatible with Powerpoint, Keynote, and Google Slides. This allows you to easily present financial management tools and features embedded in premium credit cards.


2 slides
Small Business Success Illustrations
Get your business on the right track with our small business success illustrations pack! These illustrations will help you with your next business presentation and make it more engaging and catchy. Fully compatible with Powerpoint, Keynote, and Google Slides. You can use these in your website, blog or social media posts. Turn your vision into a reality—download the small business success illustrations pack today!


8 slides
Company Achievements Year in Review Presentation
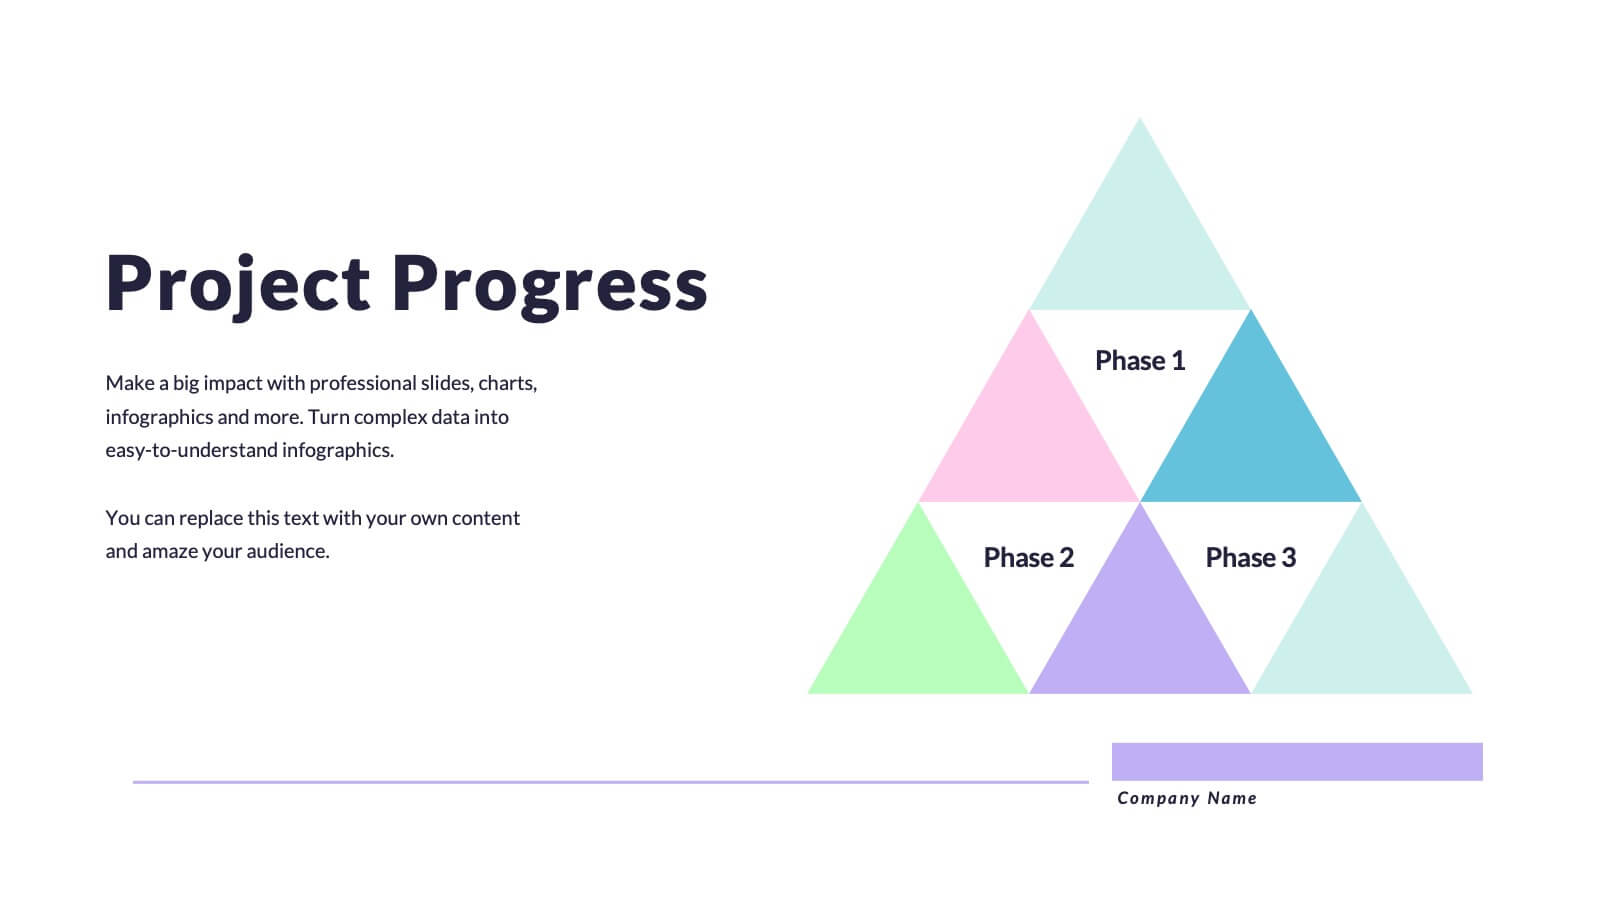
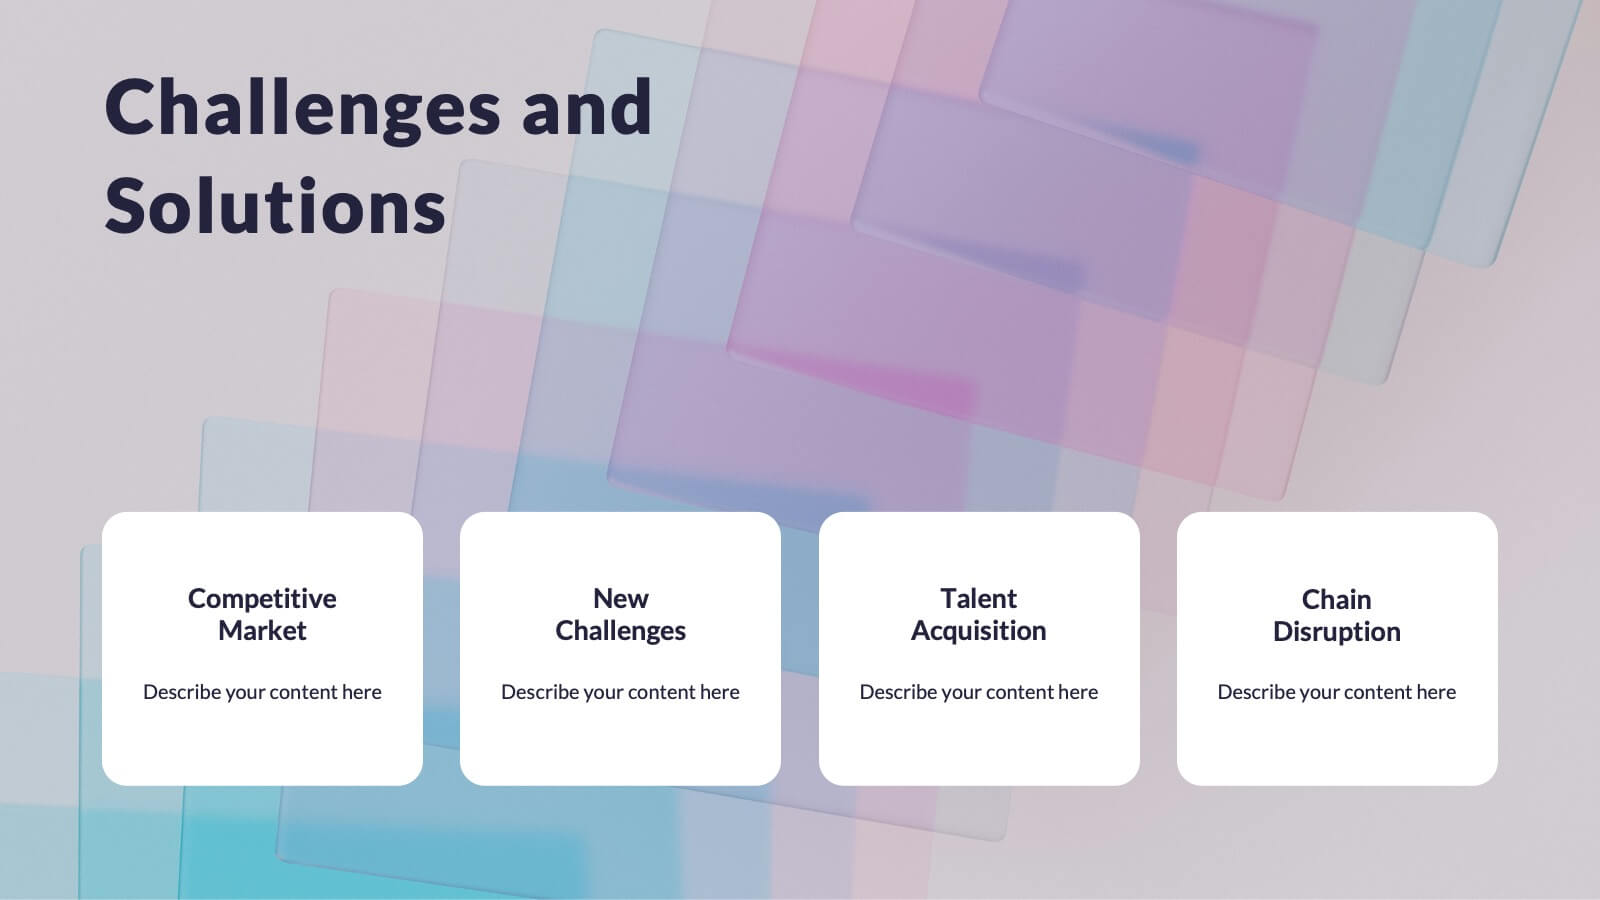
Highlight milestones with impact using the Company Achievements Year in Review Presentation. This dynamic slide uses a multi-layered, pyramid-style layout to showcase your organization’s key wins, progress, and stats throughout the year. Perfect for internal reviews, investor decks, or annual reports. Fully editable and compatible with PowerPoint, Keynote, and Google Slides.


5 slides
Employee Training Roadmap Presentation
Take your team on a visual journey that maps out success, one milestone at a time. This roadmap presentation is perfect for outlining employee training stages in a clear, engaging way. Each point leads naturally to the next. Fully editable and compatible with PowerPoint, Keynote, and Google Slides for seamless use.


5 slides
Scrum Workflow Roles & Sprints Presentation
Simplify your agile presentations with this Scrum Workflow Roles & Sprints Template. Designed to visualize sprint cycles, team roles, and process flow, this layout makes Scrum methodology easy to grasp. Ideal for product managers and agile teams. Fully editable in PowerPoint, Keynote, and Google Slides for seamless customization.


5 slides
Risk Coverage and Claims Process Presentation
Visualize your risk levels and claims procedures with this Risk Coverage and Claims Process slide. The thermometer-style graphic clearly represents stages of coverage or escalation. Ideal for insurance, compliance, or legal teams. Fully editable and compatible with PowerPoint, Keynote, and Google Slides to match your branding and workflow needs.


5 slides
Big Data Analytics Process Presentation
Visualize your data journey with this clean and professional slide layout. Featuring four circular icons around a central cloud graphic, it’s ideal for showcasing data collection, processing, analysis, and storage. Perfect for tech briefings or analytics teams. Fully editable and compatible with PowerPoint, Keynote, and Google Slides.


6 slides
Content Funnel Infographic
The Content Funnel Infographic provides a structured and visual representation of the content marketing funnel. Compatible with PowerPoint, Google Slides, and Keynote. It’s designed to guide viewers through each stage of content creation and distribution, from awareness to conversion. The layers of the funnel are color-coded for easy differentiation, assisting in quick comprehension of the journey a potential customer might take. This infographic is perfect for marketing professionals looking to illustrate the impact of content at each phase of the customer's journey. Each section is fully customizable, allowing the insertion of specific content types or conversion goals relevant to your marketing plan.