


Features
- 4 Unique slides
- Fully editable and easy to edit in Microsoft Powerpoint, Keynote and Google Slides
- 16:9 widescreen layout
- Clean and professional designs
- Export to JPG, PDF or send by email


Do you have any questions?
Recommend


4 slides
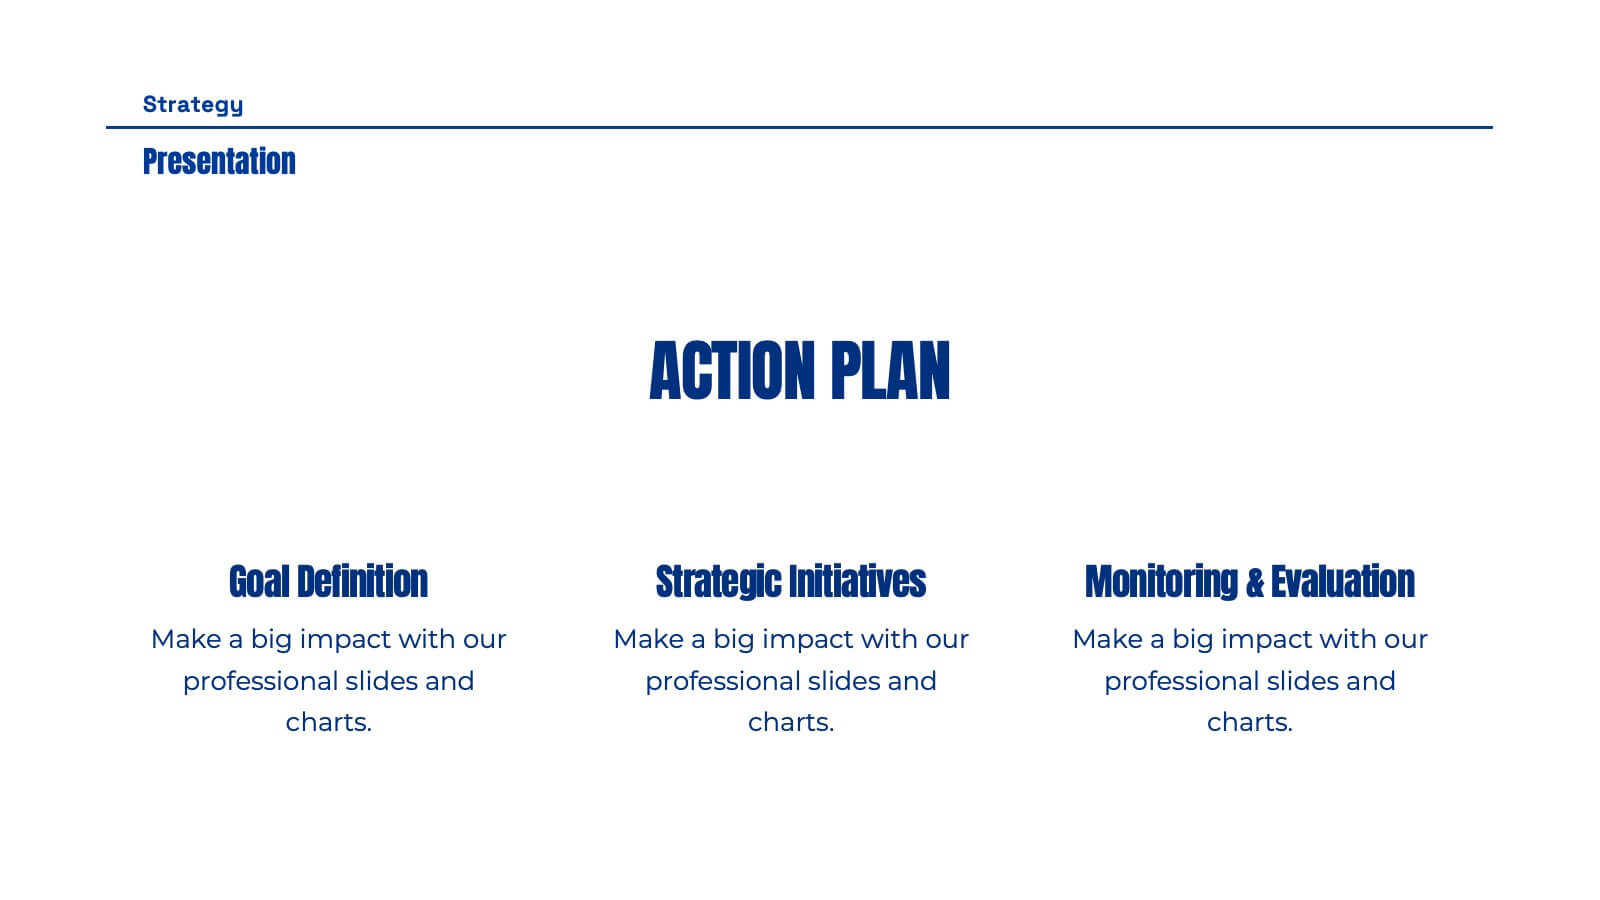
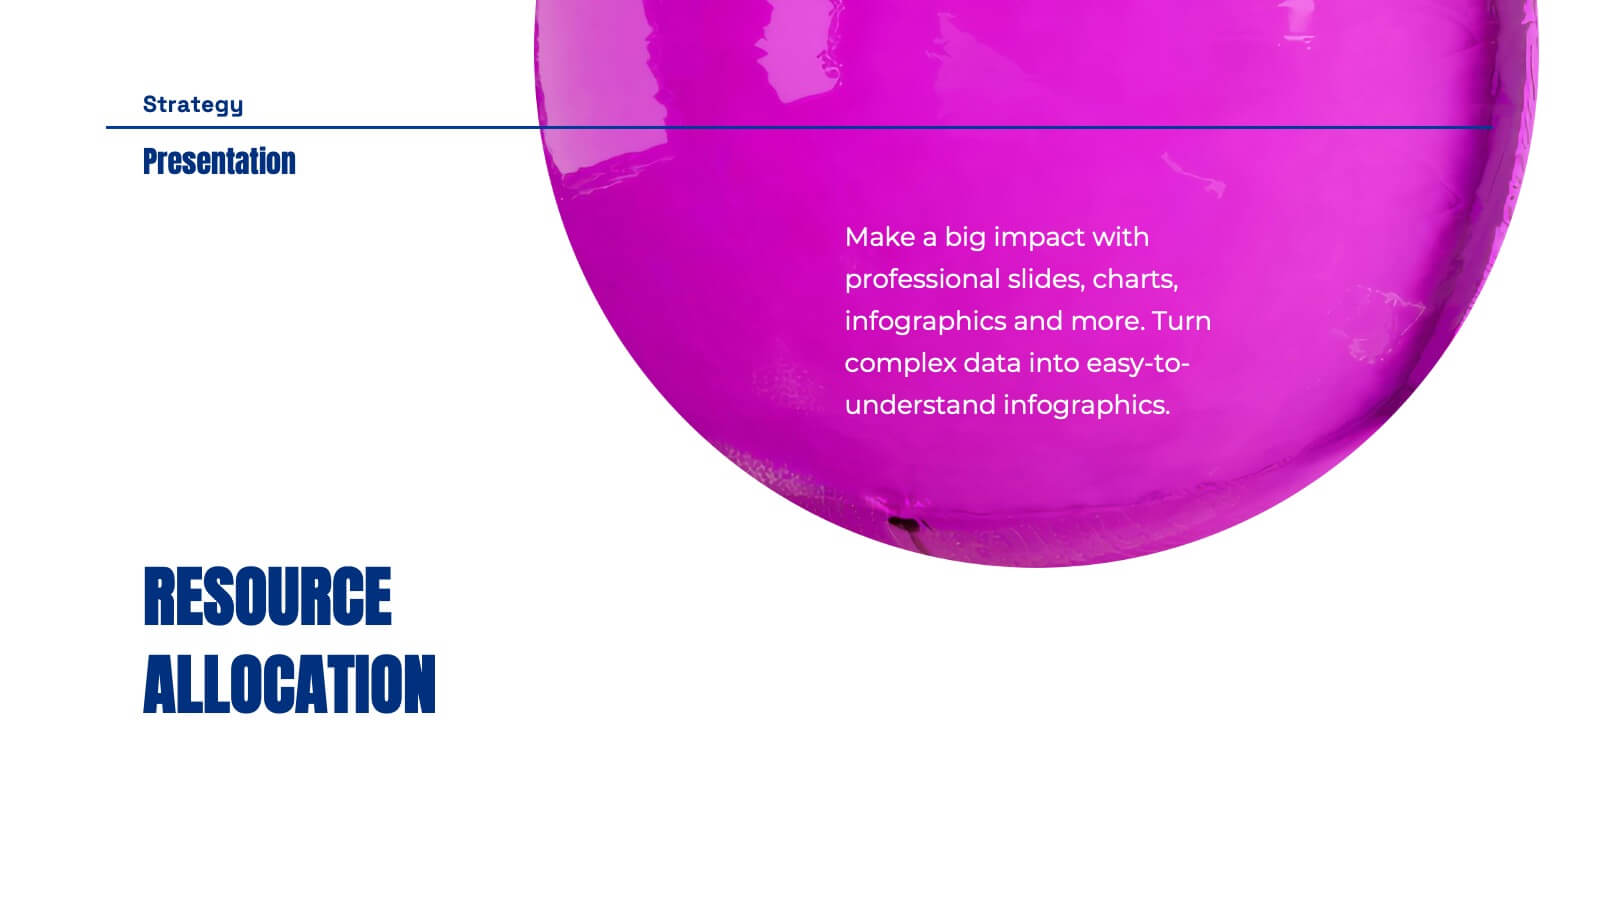
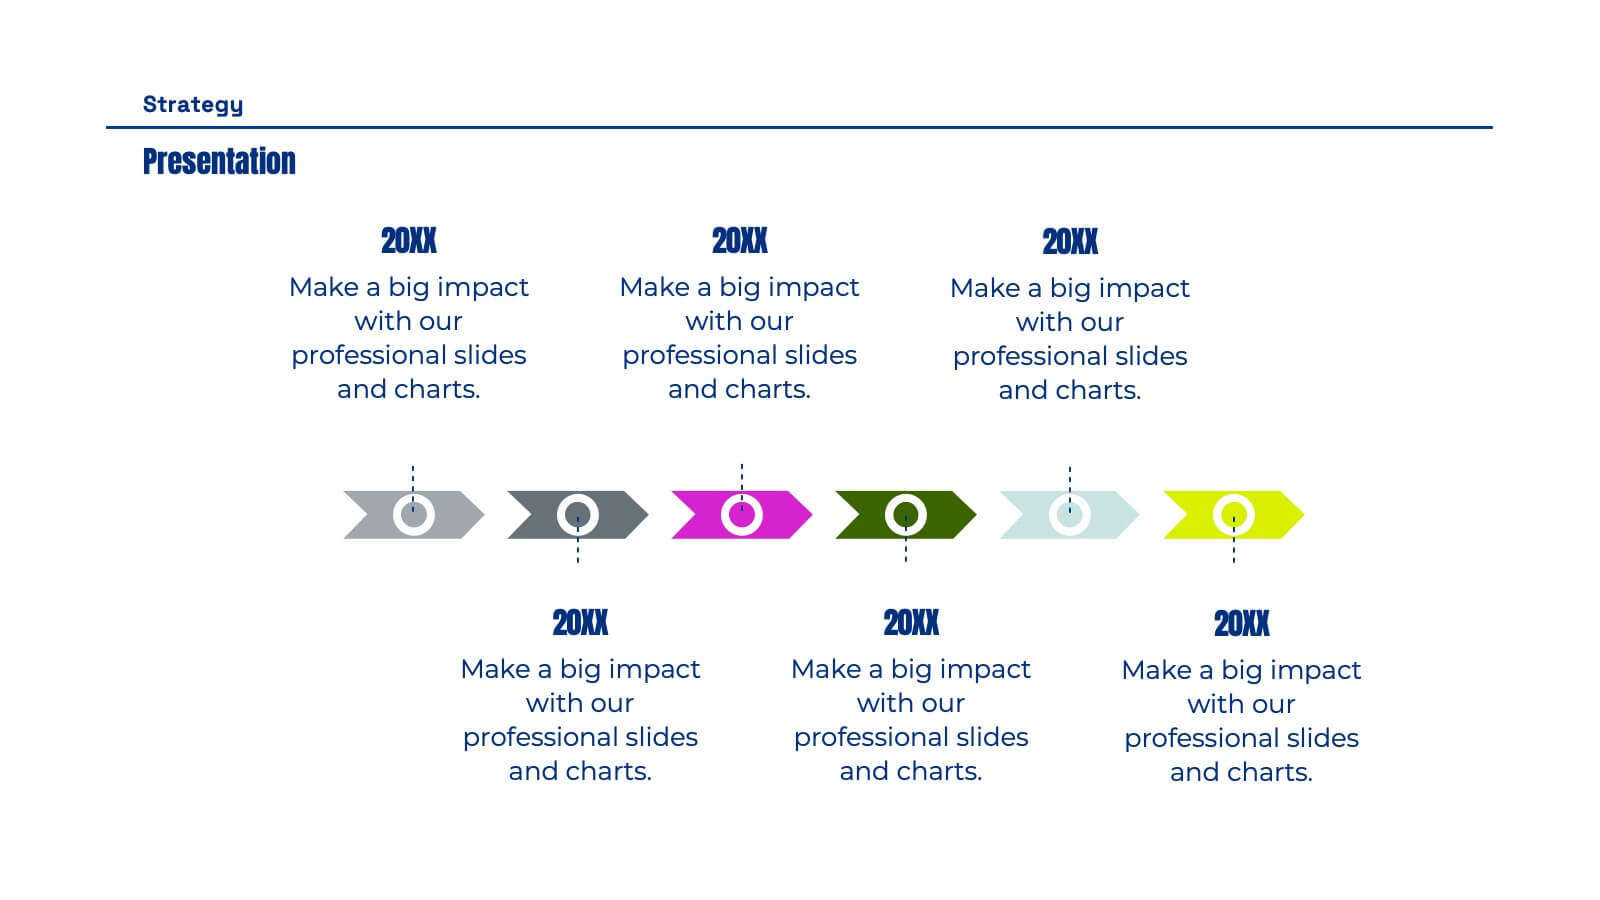
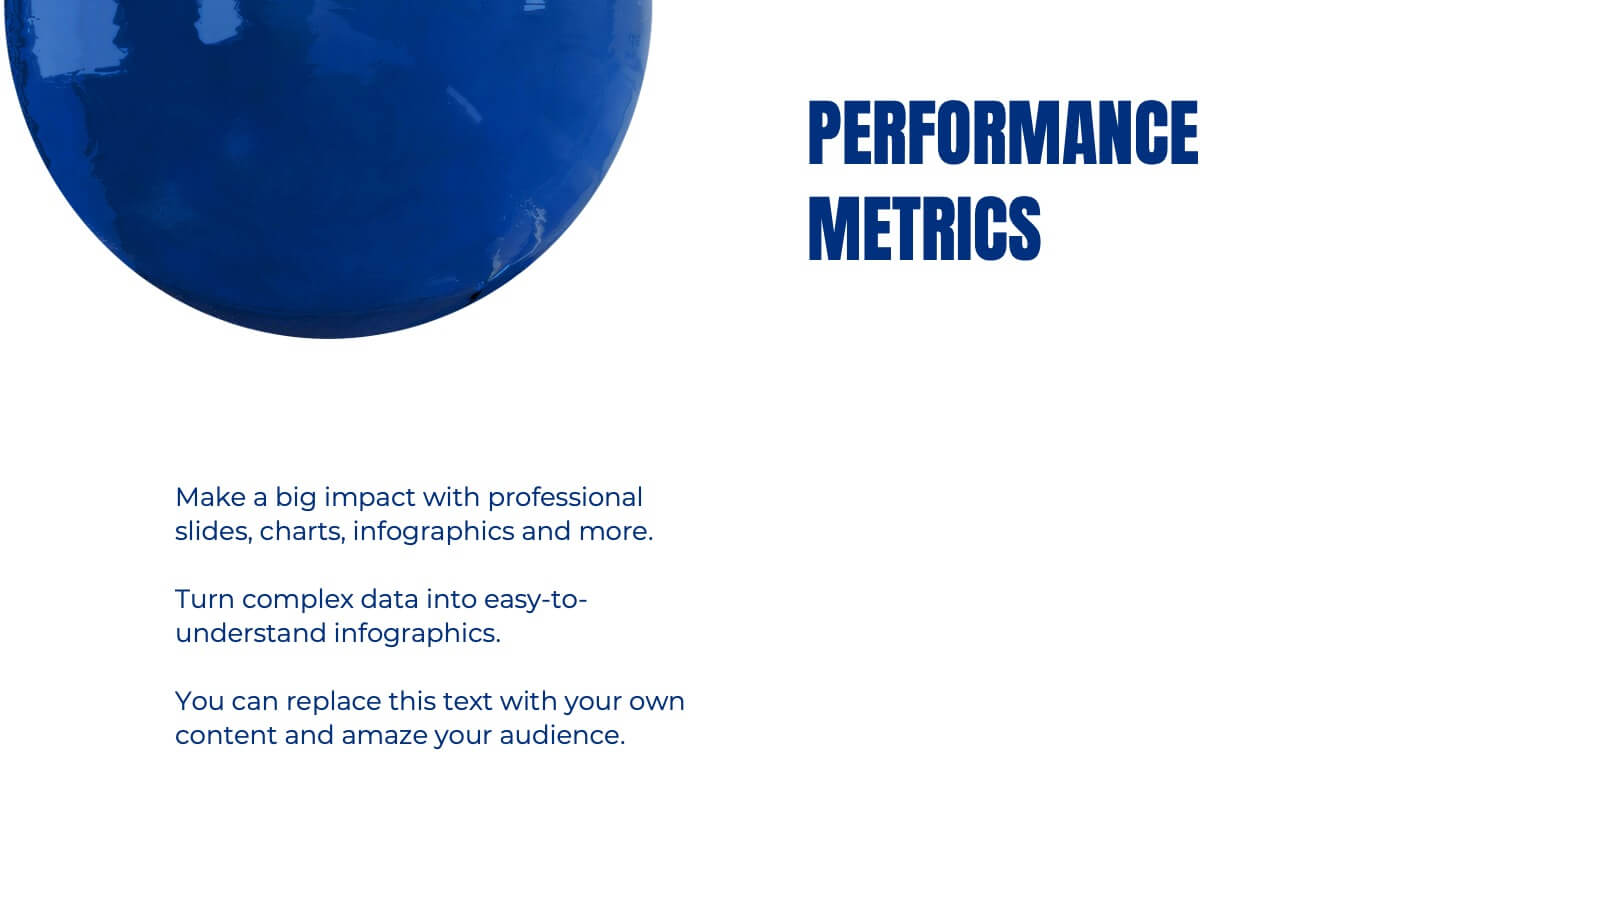
Execution-Based Strategic Action Plan Presentation
Highlight your execution strategy with this visually striking pinwheel diagram. Each blade represents a focused action step, ideal for showcasing implementation plans or performance initiatives. Fully customizable in PowerPoint, Keynote, and Google Slides—perfect for strategic reviews, team briefings, or progress tracking across four critical areas.

21 slides
Ops Business Strategy Presentation
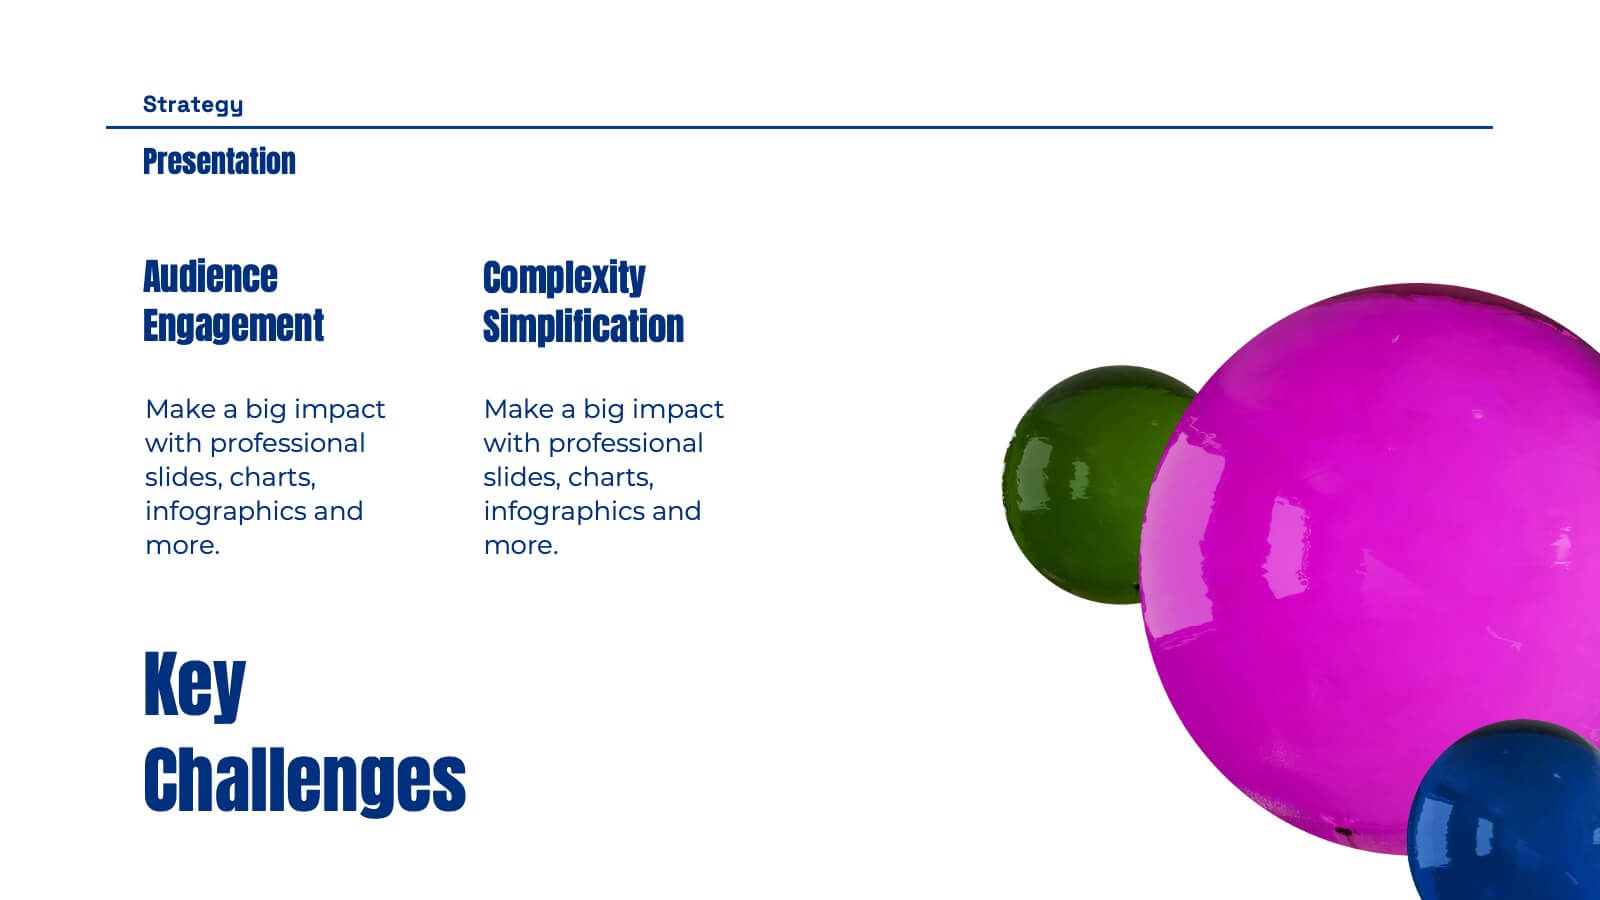
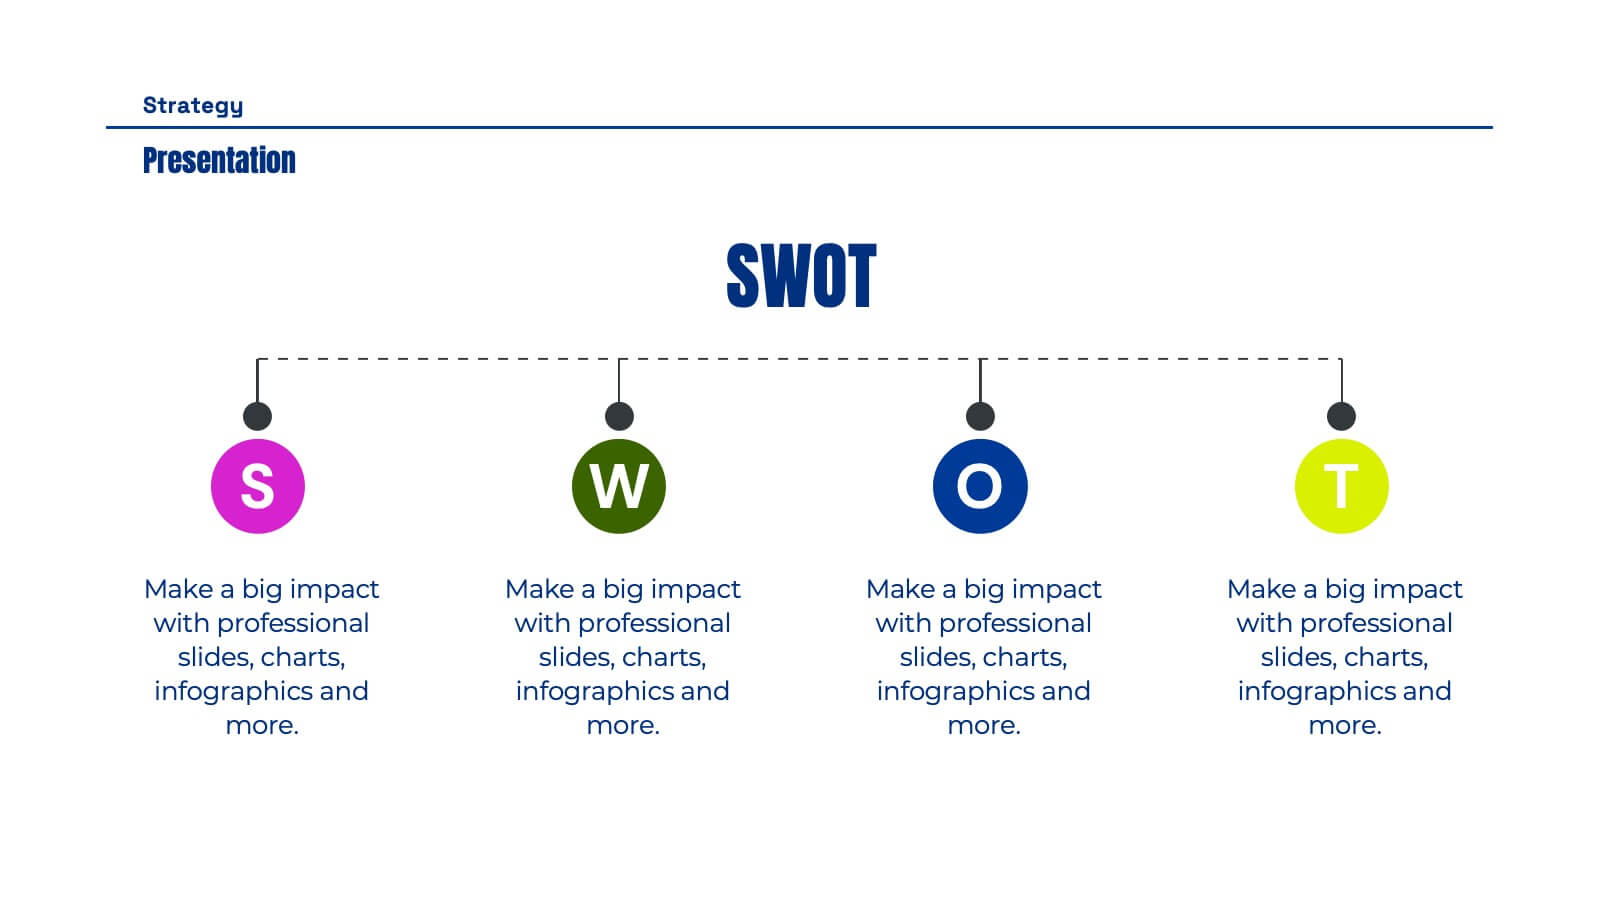
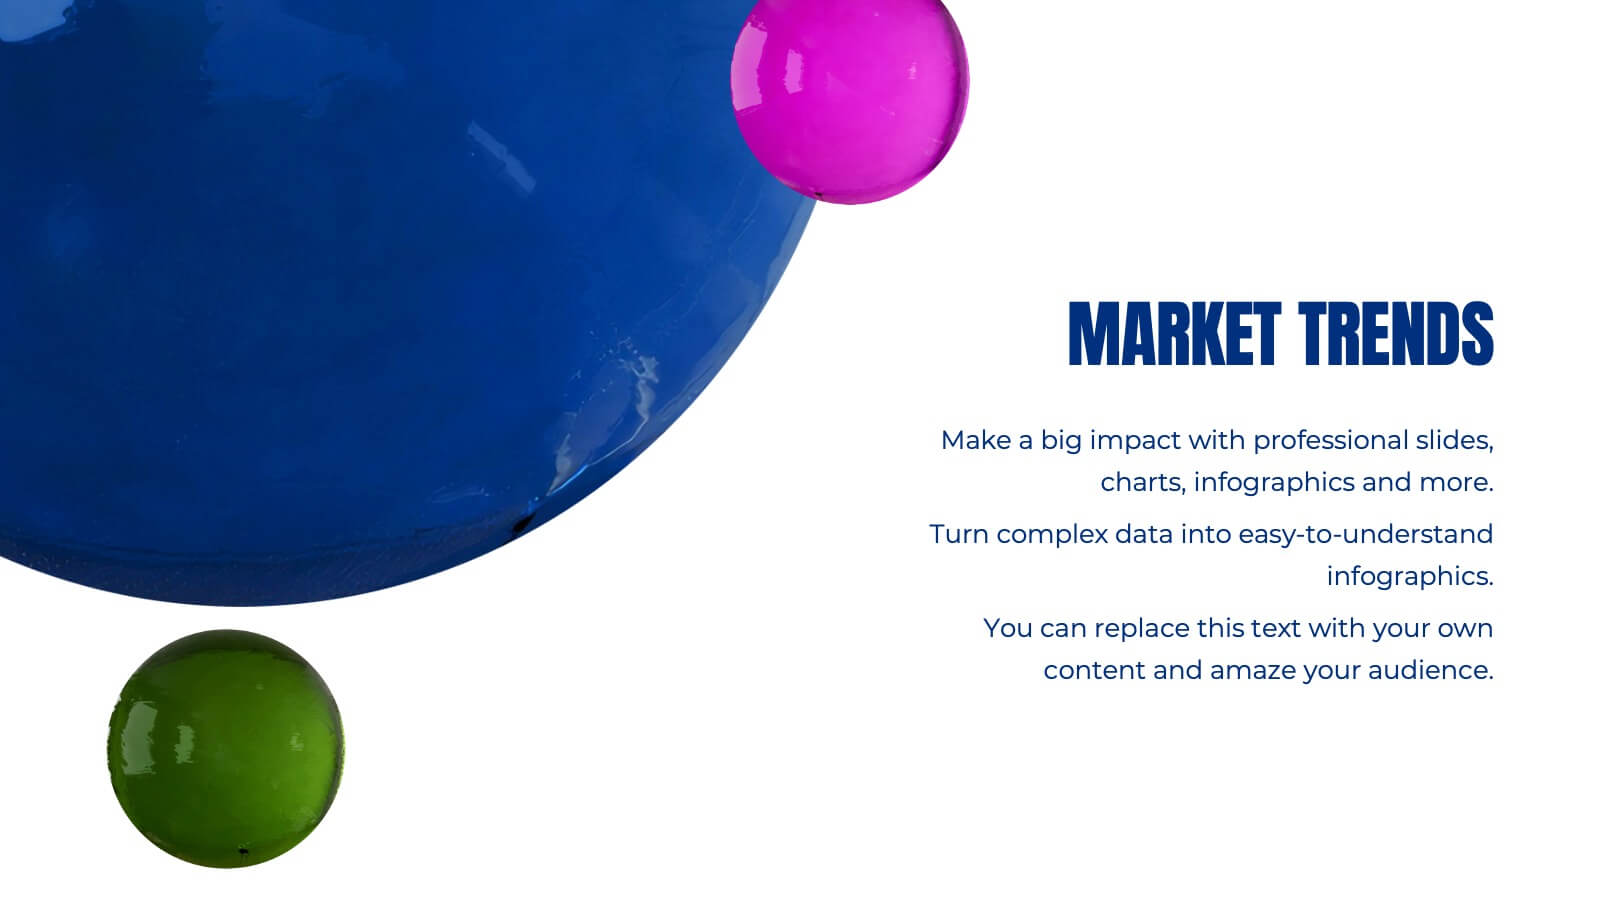
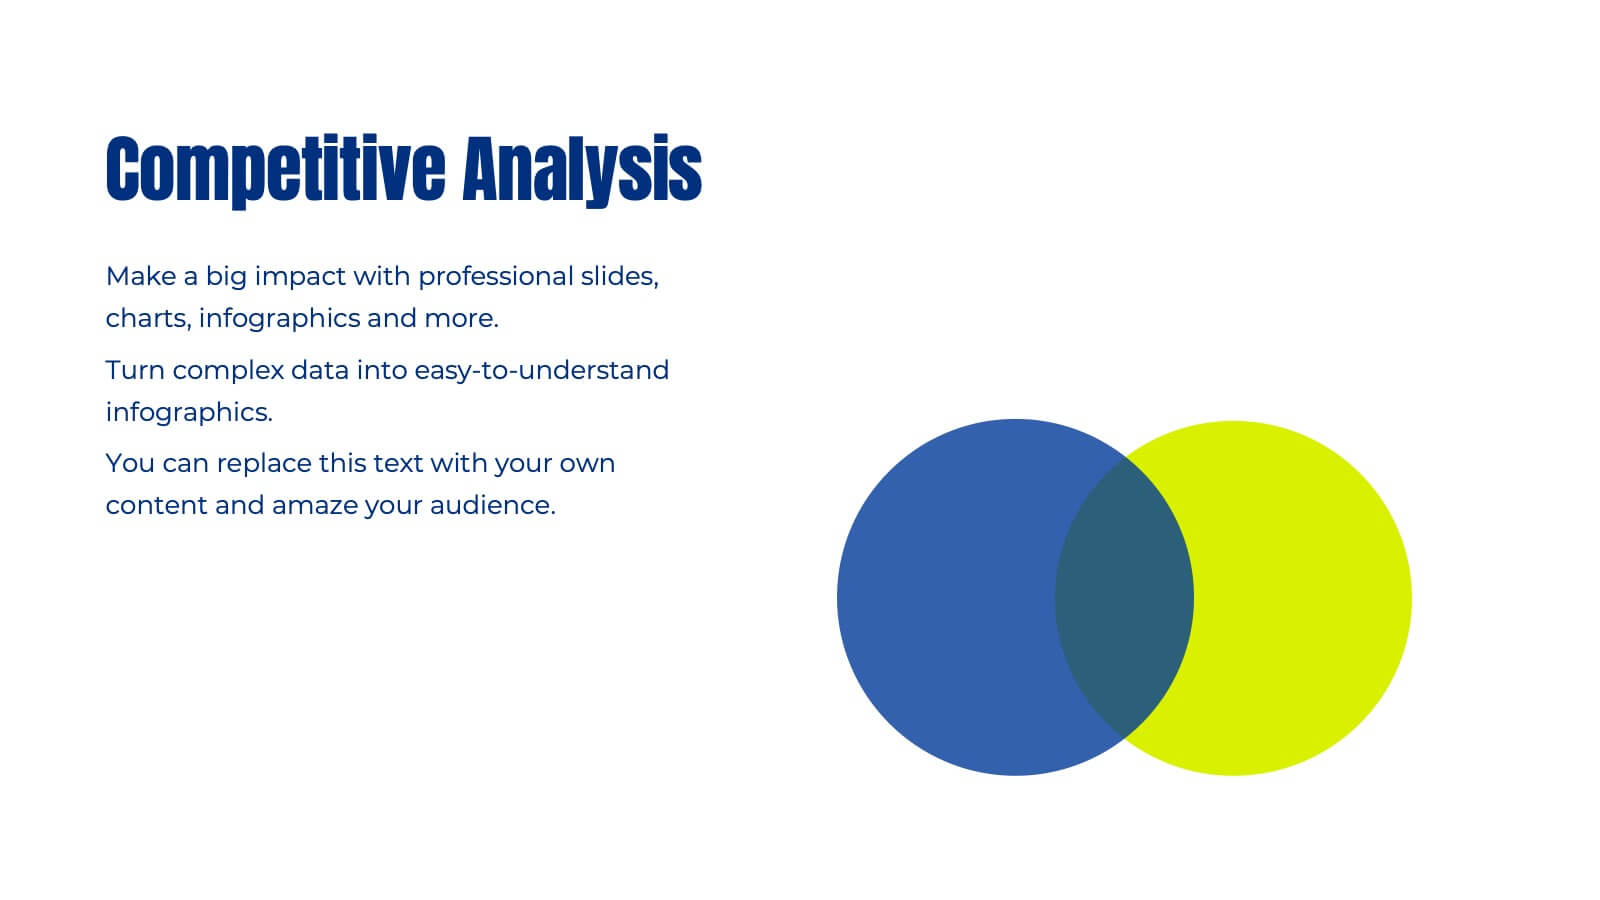
Set your strategy in motion with this dynamic, visually striking presentation template! Perfect for conveying key business insights like competitive analysis, market trends, and strategic objectives, it helps organize your plan for success. Each slide focuses on clarity and effectiveness, making it ideal for impactful presentations. Compatible with PowerPoint, Keynote, and Google Slides for effortless use across platforms.


4 slides
Economic Trends and Analysis of North America Map Presentation
Present key regional insights with this North America economic analysis map. Compare up to four locations using percentage stats and customizable titles. Ideal for showcasing market trends, financial metrics, or growth data. Fully editable in PowerPoint, Keynote, and Google Slides—perfect for economic forecasts, business reports, or strategy meetings.


5 slides
Professional Business Plans Presentation
Bring your ideas to life with a clean, structured slide that simplifies complex planning into an easy-to-follow visual. This presentation highlights key business priorities, long-term strategy, and action steps in a modern layered format that’s clear and practical for any audience. Fully compatible with PowerPoint, Keynote, and Google Slides.


5 slides
Eco-Friendly Practices Implementation Presentation
Brighten your message with a clean, circular design that maps out every green initiative step-by-step. This visual template illustrates key eco-conscious actions, helping you present sustainable practices with ease. Perfect for environmental reports, team strategies, or policy pitches. Fully compatible with PowerPoint, Keynote, and Google Slides for flexible editing.


10 slides
Project Responsibility Chart Presentation
Streamline your project management with our Project Responsibility Chart template. Designed to clarify roles and tasks across your team, this color-coded chart ensures transparency and efficiency. Ideal for project leads to assign duties clearly and effectively. The template supports PowerPoint, Keynote, and Google Slides, making it versatile for any team environment.


21 slides
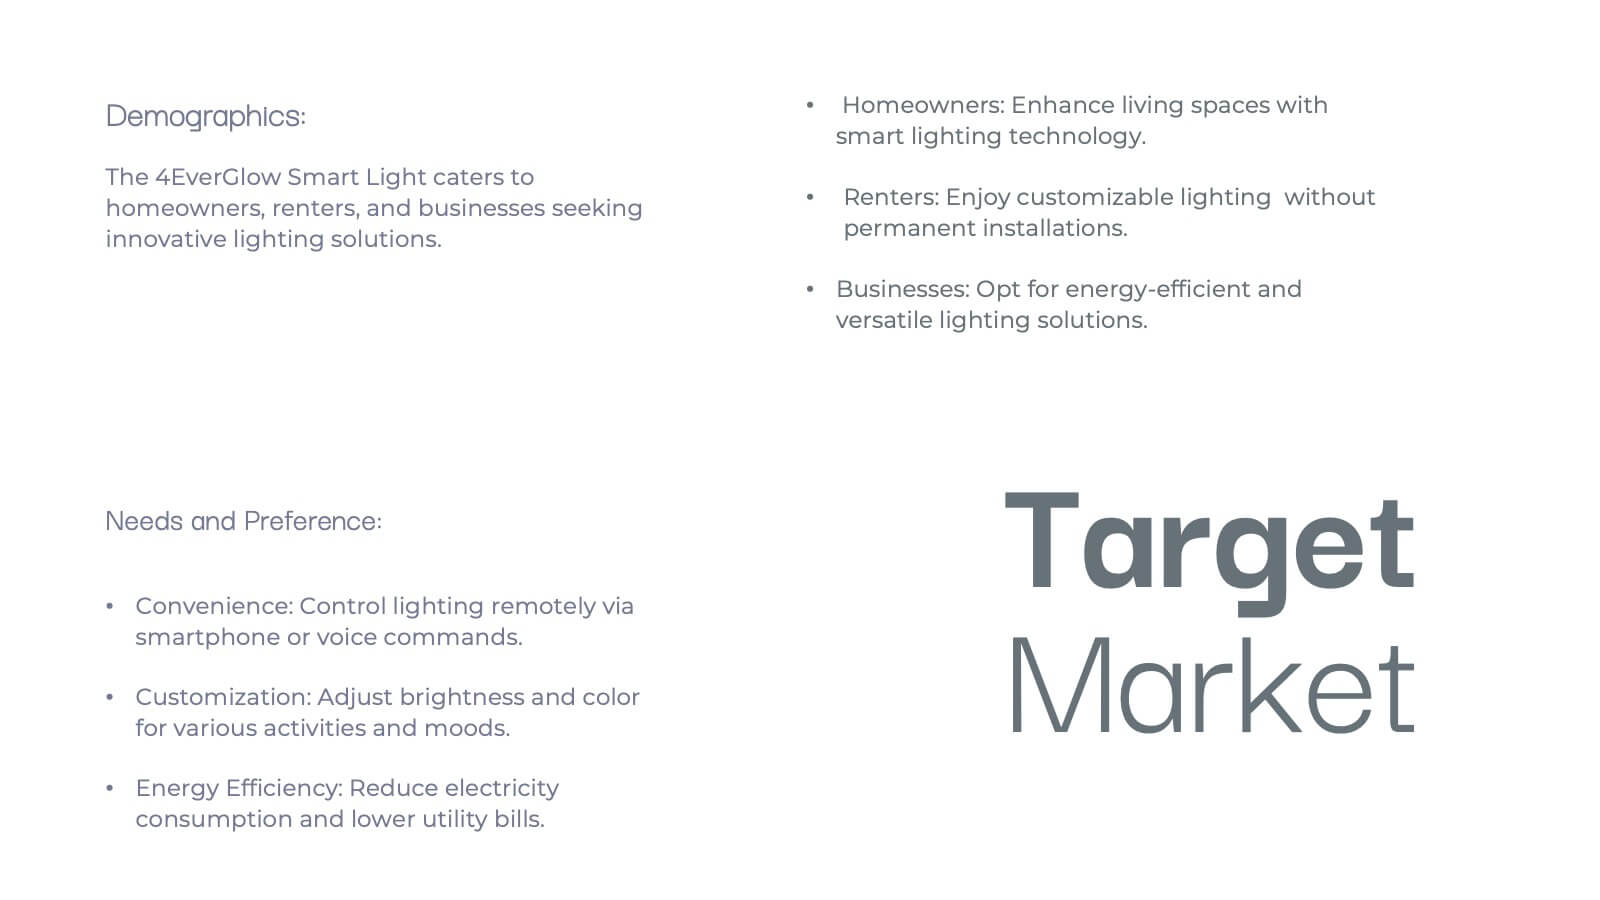
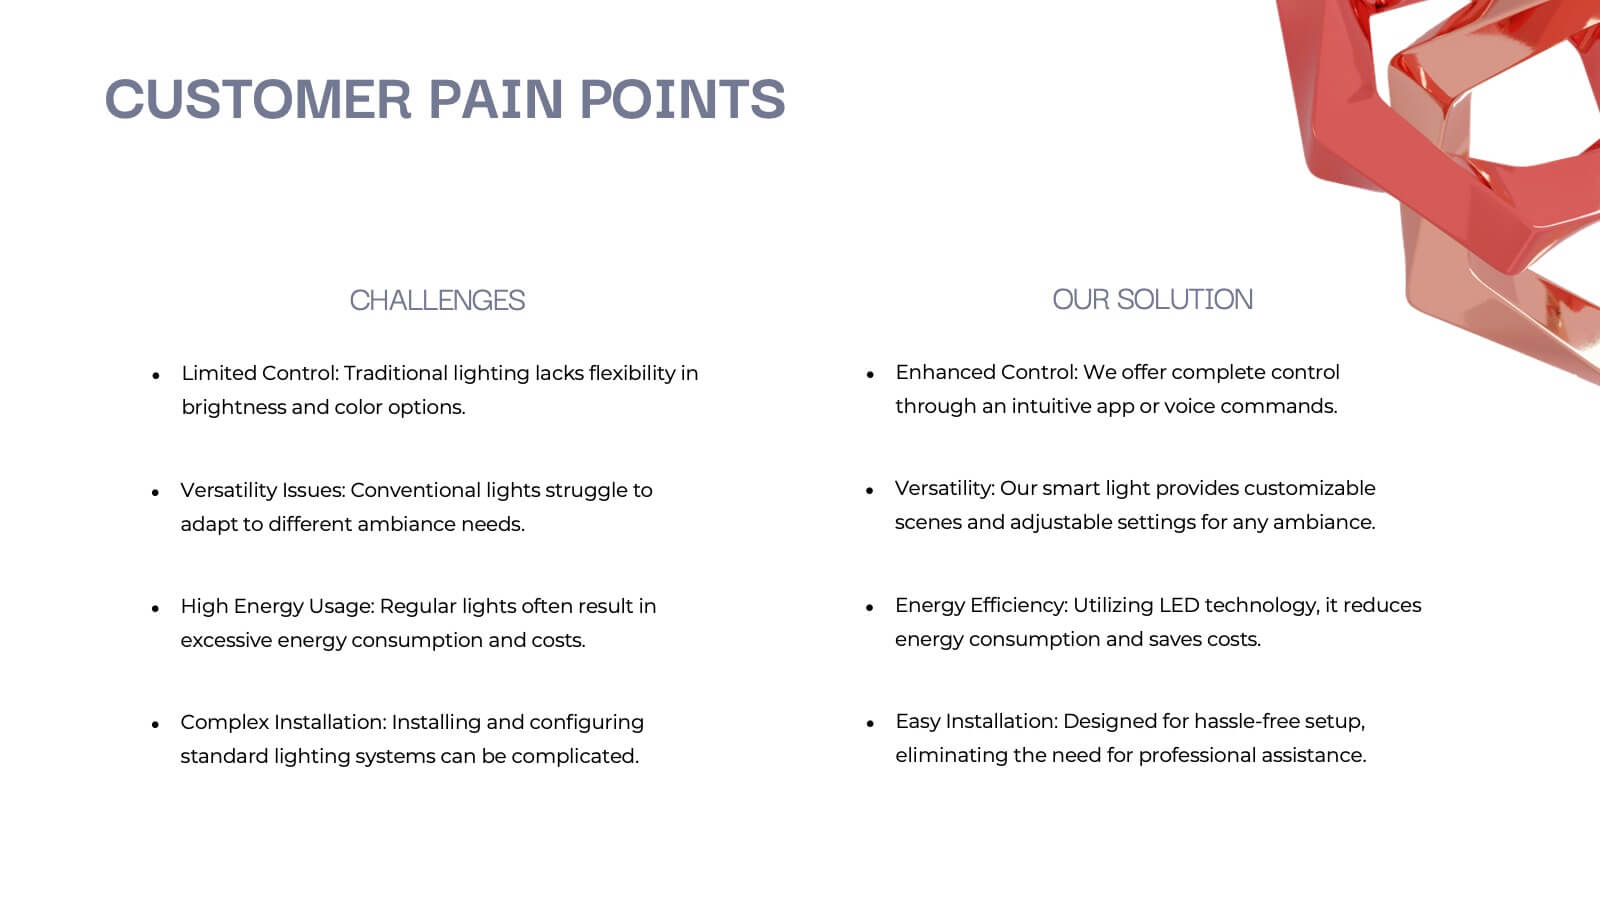
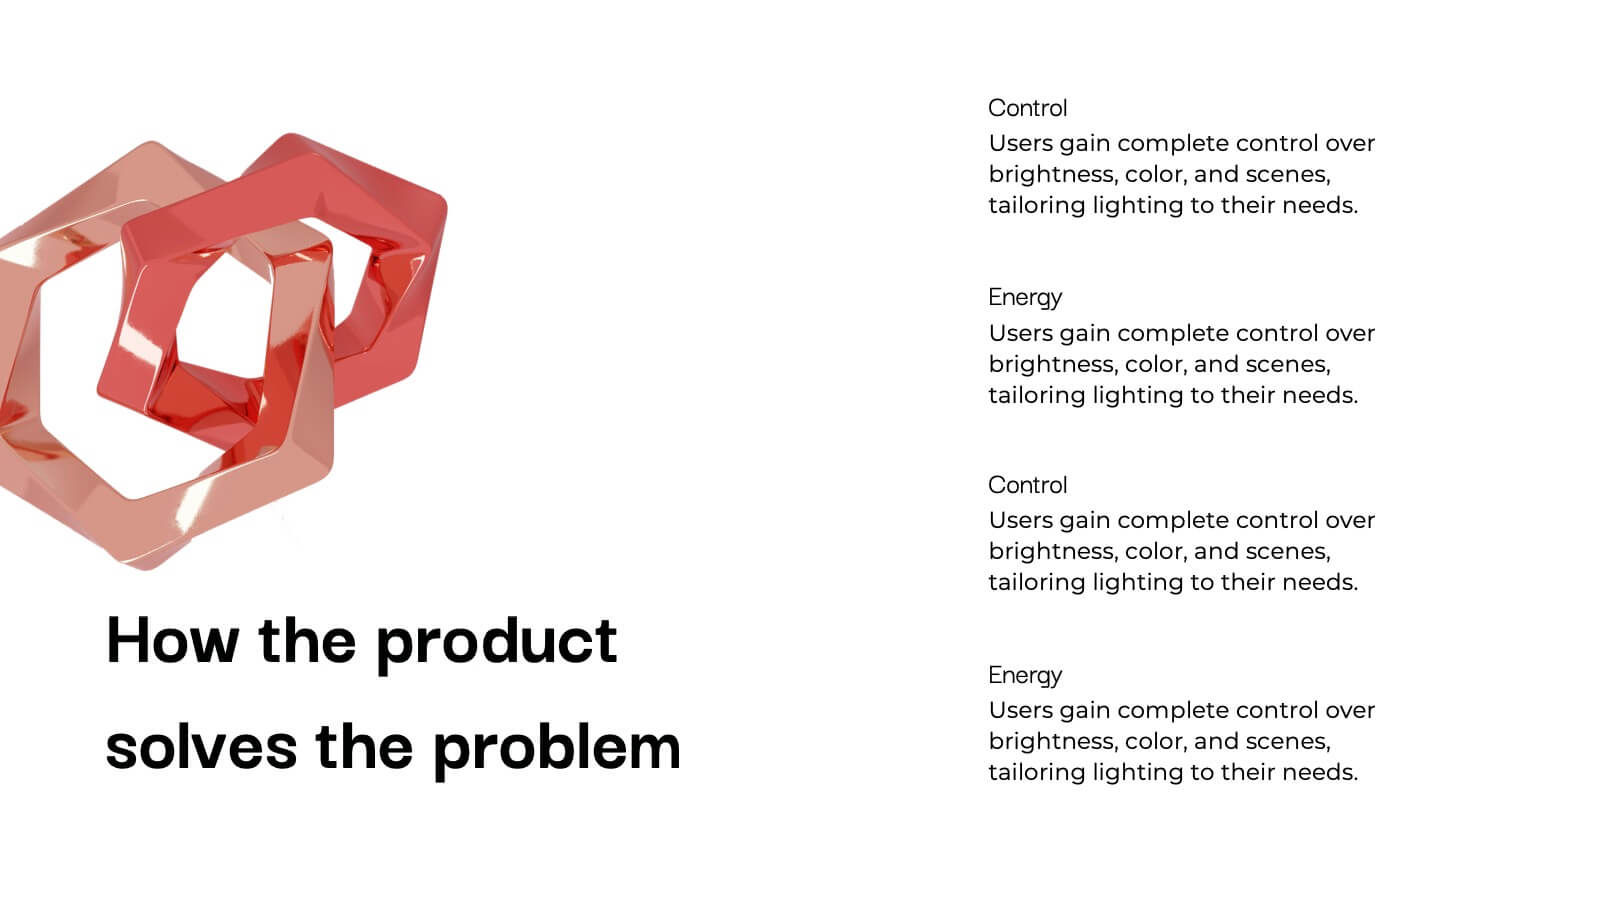
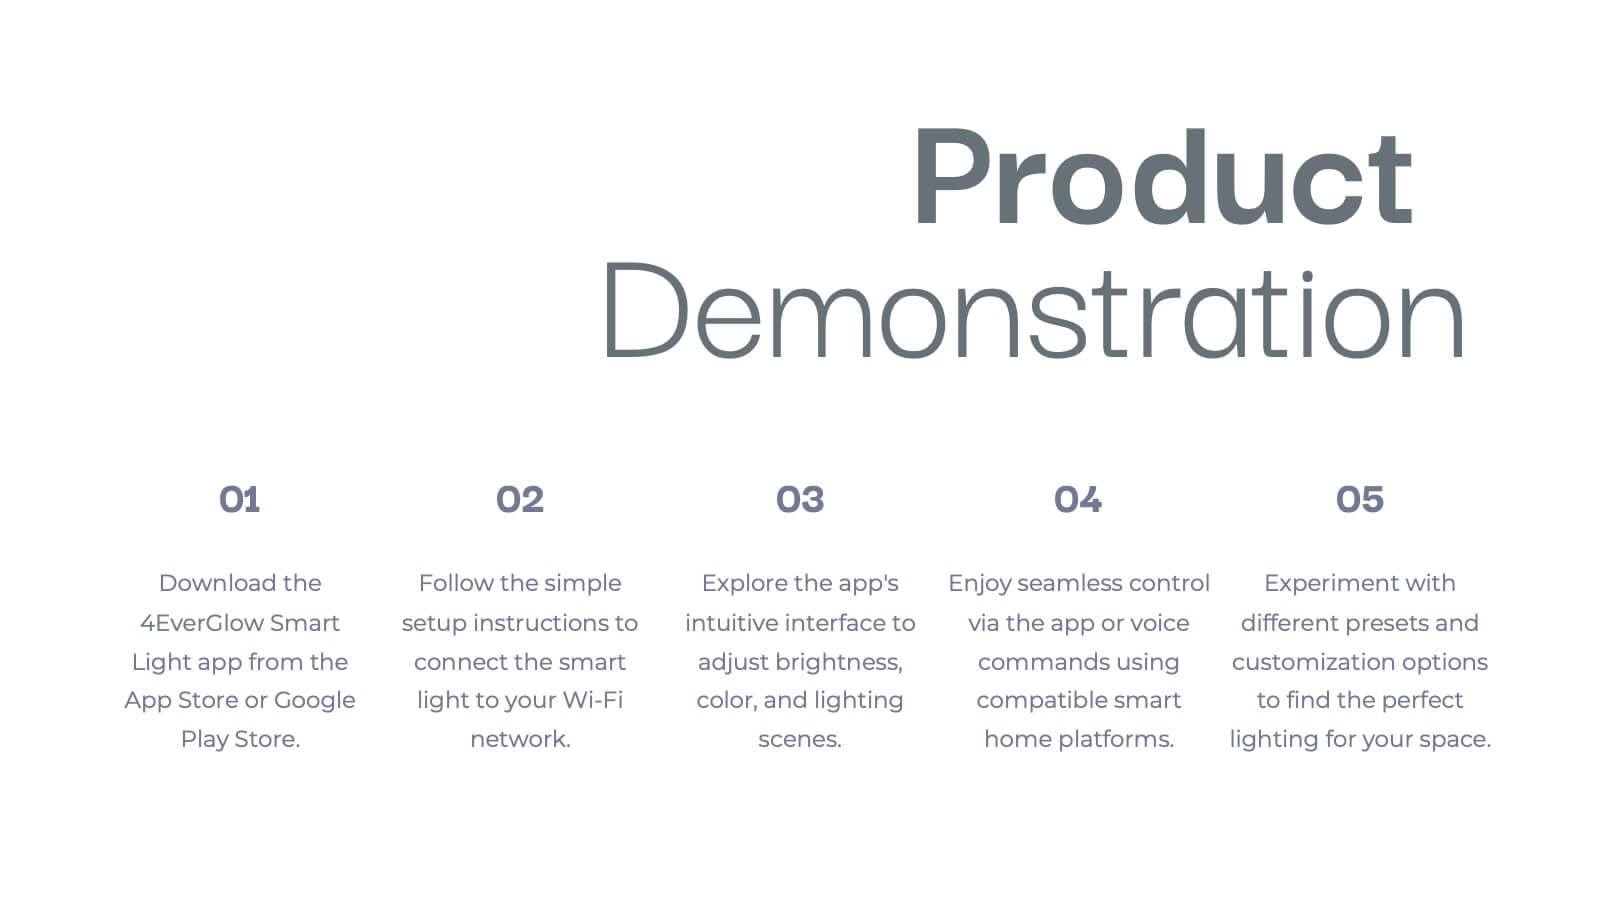
Vulcan New Product Proposal Presentation
Launch your next product with confidence using this comprehensive presentation template! Covering everything from product features and target market to pricing strategy and customer pain points, this template ensures a smooth and engaging flow for your audience. It’s ideal for product proposals, demonstrations, and marketing strategies. Compatible with PowerPoint, Keynote, and Google Slides for seamless presentations.


20 slides
Ascent Design Strategy Proposal Presentation
A minimalist and sleek template ideal for presenting design strategy and development. Includes sections for design brief, audience insights, concept development, design elements, prototyping, and feedback. Suitable for design professionals to showcase visual direction and project timelines. Fully customizable in PowerPoint, Keynote, and Google Slides for versatile presentations.


6 slides
5-Stage Sales Funnel Presentation
Visualize your sales process effortlessly with this 5-Stage Sales Funnel template. Ideal for showcasing lead conversion, customer journey, and sales strategies, this design is fully customizable. Adjust colors, text, and icons to fit your needs. Compatible with PowerPoint, Keynote, and Google Slides for seamless integration into your presentations.


5 slides
Business Innovation Strategy Presentation
Present a compelling Business Innovation Strategy with this modern infographic. Designed to highlight key insights, innovative solutions, and strategic approaches, this template is perfect for business professionals, consultants, and startups. Fully editable and compatible with PowerPoint, Keynote, and Google Slides.


5 slides
Fishbone Diagram for Root Cause Analysis Presentation
Identify and Solve Business Problems with Precision using this Fishbone Diagram for Root Cause Analysis presentation template. Designed to visually map out potential causes, this template enhances problem-solving, decision-making, and process improvement. Featuring a clear fishbone structure, customizable icons, and text placeholders, this template is perfect for business analysts, strategists, and operations teams. Fully editable and compatible with PowerPoint, Keynote, and Google Slides, ensuring a seamless and professional presentation experience.


7 slides
Money Market Infographic
The money market is a sector of the financial market where short-term borrowing and lending occur, typically in the form of highly liquid and low-risk instruments. Navigate the financial landscape with our Money Market Infographic. This colorful and informative template is designed to help you understand the dynamics of the money market, empowering you to make sound financial decisions. Compatible with Powerpoint, Keynote, and Google Slides. This infographic demystifies the money market, offering valuable insights and knowledge to help you navigate the world of investments and financial growth.


7 slides
Watercolor Strategy Infographic
Dive into a cascade of strategic insights with our watercolor strategy infographic. Presented on a crisp white canvas, the splash of yellow, green, and blue emanates a fluidity that mirrors the dynamic nature of business strategies. Each hue merges seamlessly to provide a visual treat while retaining the core informational value. Tailored for Powerpoint, Keynote, and Google Slides, this template is embellished with customizable graphics, intricate icons, and flexible image placeholders, making it an ideal choice for any strategic visualization. Let your strategy flow, vivid and vibrant, just like watercolors on paper.


5 slides
Step-by-Step Flow Diagram Presentation
Bring clarity to every stage of your process with a clean, easy-to-follow visual path that guides your audience step by step. This presentation helps simplify workflows, instructions, and project milestones in a structured, approachable layout. Fully compatible with PowerPoint, Keynote, and Google Slides.


5 slides
Business Growth and Expansion
Visually communicate each stage of business development with this Business Growth and Expansion diagram. Featuring a dynamic circular flow, this editable slide is perfect for showcasing progress, scaling strategies, or roadmap milestones. Fully compatible with PowerPoint, Keynote, and Google Slides—ideal for business plans and strategic presentations.
4 slides
Growth Path Arrow Design Presentation
Rise with momentum as you visualize progress in a clean, modern layout built for showcasing goals, achievements, and forward movement. This presentation highlights each stage in a clear upward path, helping audiences follow your narrative with ease. Fully editable and compatible with PowerPoint, Keynote, and Google Slides.


5 slides
Visual Decision-Making with Harvey Balls Presentation
Simplify complex evaluations with this Harvey Ball comparison chart. Ideal for product comparisons, feature assessments, or decision-making matrices, this slide presents up to 6 items and 4 features with intuitive visual cues. Fully editable in PowerPoint, Keynote, or Google Slides, it’s perfect for business, marketing, and strategy teams seeking clear and compelling insights.