


Features
- 5 Unique slides
- Fully editable and easy to edit in Microsoft Powerpoint, Keynote and Google Slides
- 16:9 widescreen layout
- Clean and professional designs
- Export to JPG, PDF or send by email


Do you have any questions?
Recommend


5 slides
Food Industry Trends Presentation
Stay ahead of the curve with this visual presentation designed to spotlight key developments in the food industry. Featuring a creative pie chart integrated with food icons and utensils, this layout is perfect for data storytelling, market insights, or trend analysis. Fully editable in PowerPoint, Keynote, and Google Slides.


7 slides
McKinsey 7S Management Infographic Presentation
The McKinsey 7S model is designed to help organizations understand the various components that need to be aligned for effective performance. This Infographic is a visually engaging way to describe the 7S framework. Use it to deliver an informative message and get your ideas across clearly using the well designed graphics. This template is fully customizable to portray your company's key points and challenges in your specific business domain. It has all the elements to make a powerful business presentation and can create engaging templates with Powerpoint, Keynote, Google Slides and more.


5 slides
4-Level Hierarchy Tree Presentation
Bring your ideas to life with a smooth, layered flow that feels modern and engaging from the very first glance. This presentation helps you break down complex structures into four clear levels, making information easy to follow and visually compelling. Perfect for explaining processes, roles, or systems with clarity. Fully compatible with PowerPoint, Keynote, and Google Slides.


7 slides
Business Networking Strategy Presentation
Build strong business connections with this Business Networking Strategy template. Featuring a circular segmented diagram, this slide helps illustrate key networking approaches, strategic partnerships, and relationship-building techniques in an easy-to-understand format. Ideal for entrepreneurs, business developers, and corporate leaders, this fully editable slide is compatible with PowerPoint, Keynote, and Google Slides.


6 slides
Project Timeline Calendar Presentation
Kick your planning into high gear with a clean, colorful layout that makes tracking progress feel effortless. This presentation helps you map tasks across the week, visualize timelines, and communicate project schedules with absolute clarity. It’s fully editable and works seamlessly in PowerPoint, Keynote, and Google Slides.


6 slides
Porter's Five Forces Management Infographic
Porter's Five Forces is a framework, that helps businesses understand the attractiveness and profitability of an industry by examining five key forces that shape its competitive landscape. These infographic templates provide a visually appealing and concise overview of Porter's Five Forces framework. They are designed to help businesses and professionals analyze the competitive dynamics of an industry and make informed strategic decisions. By using this to help your audience understand the forces that shape industry competitiveness, they can identify potential threats and opportunities to make informed decisions, and gain a competitive edge.


22 slides
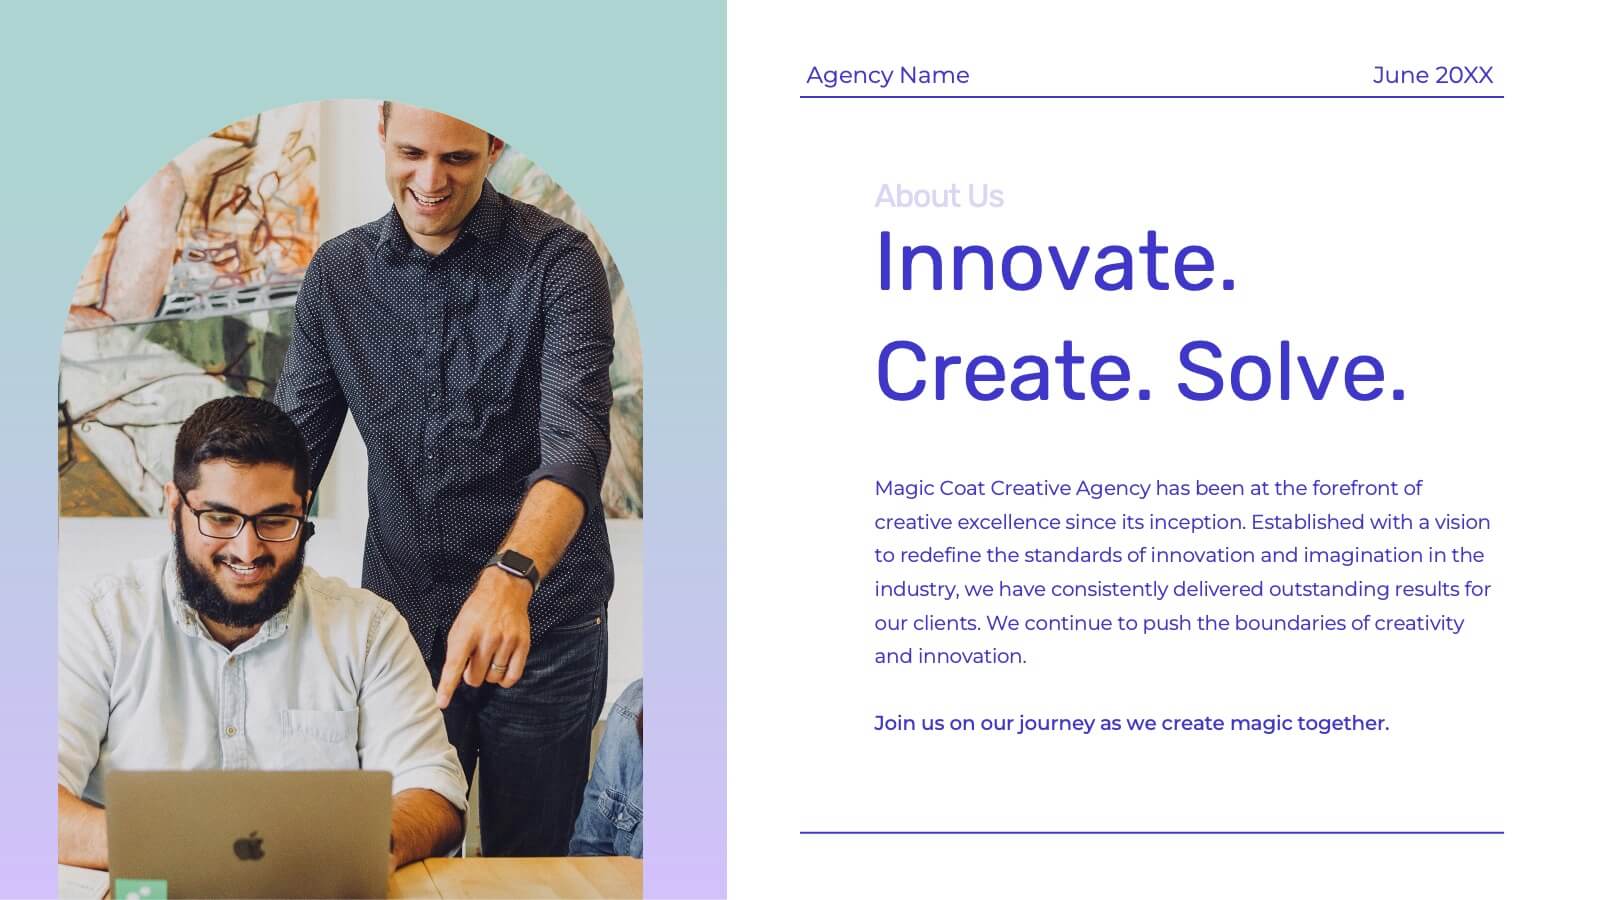
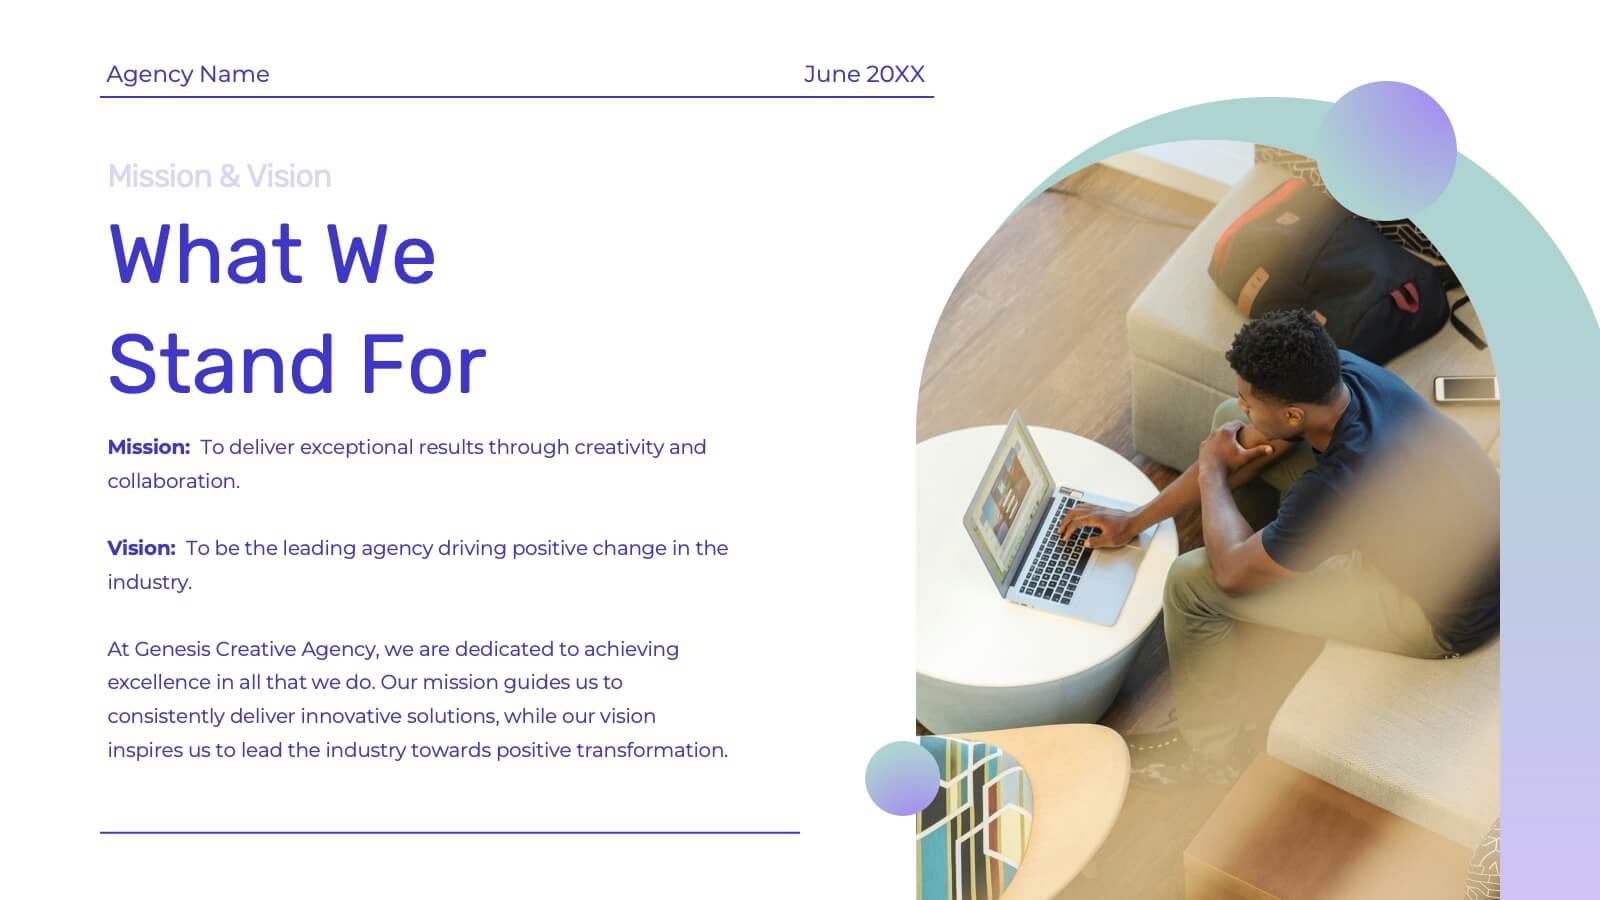
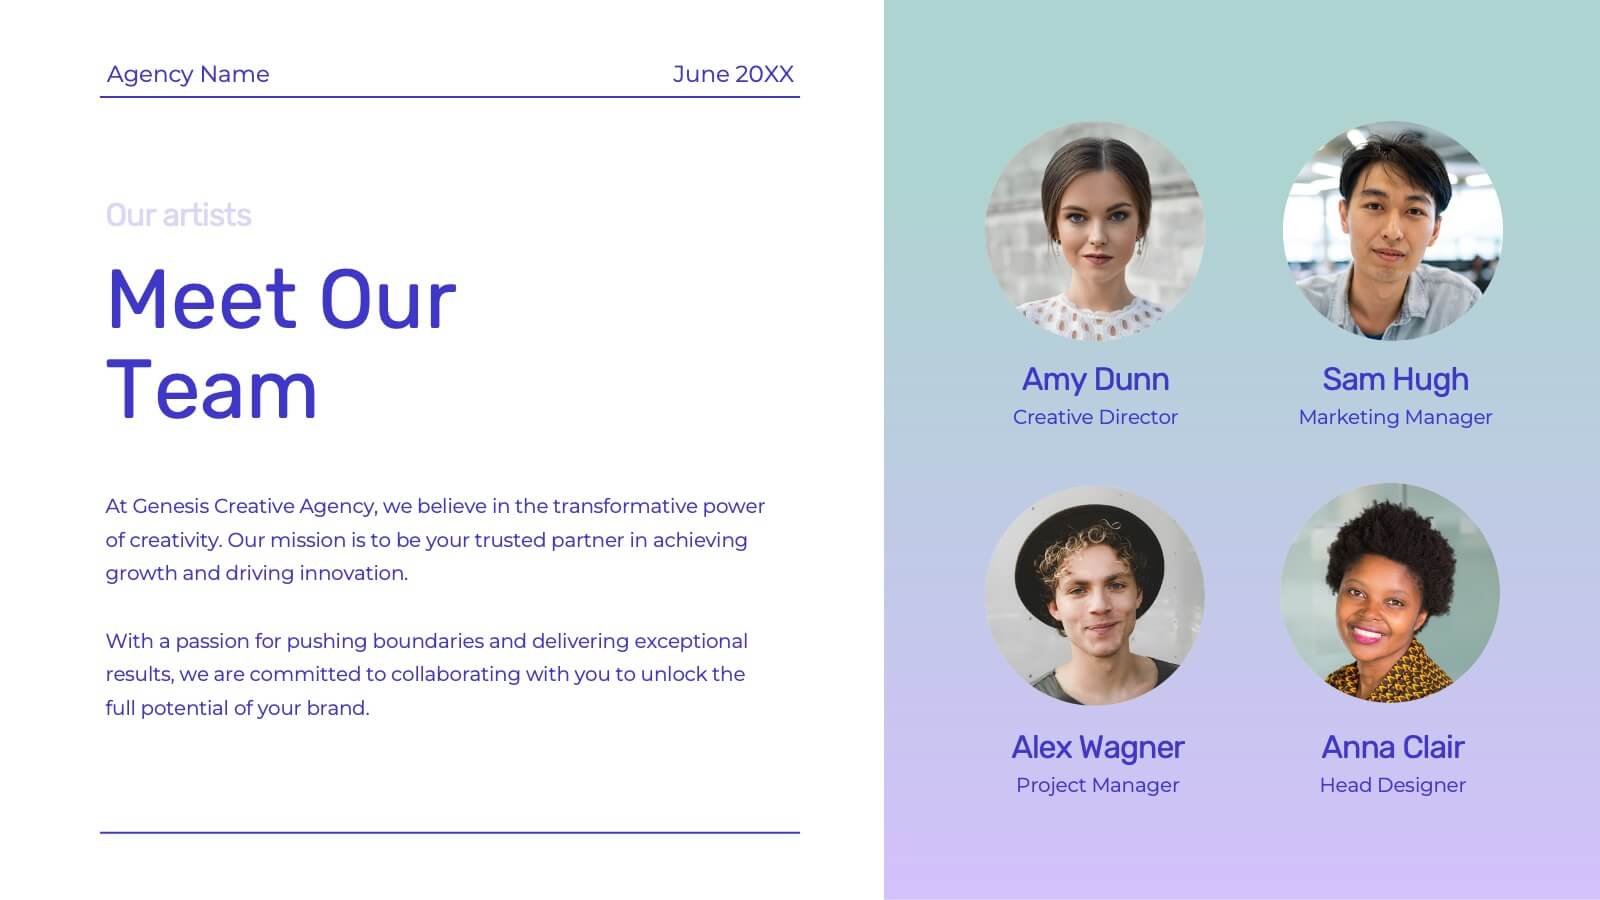
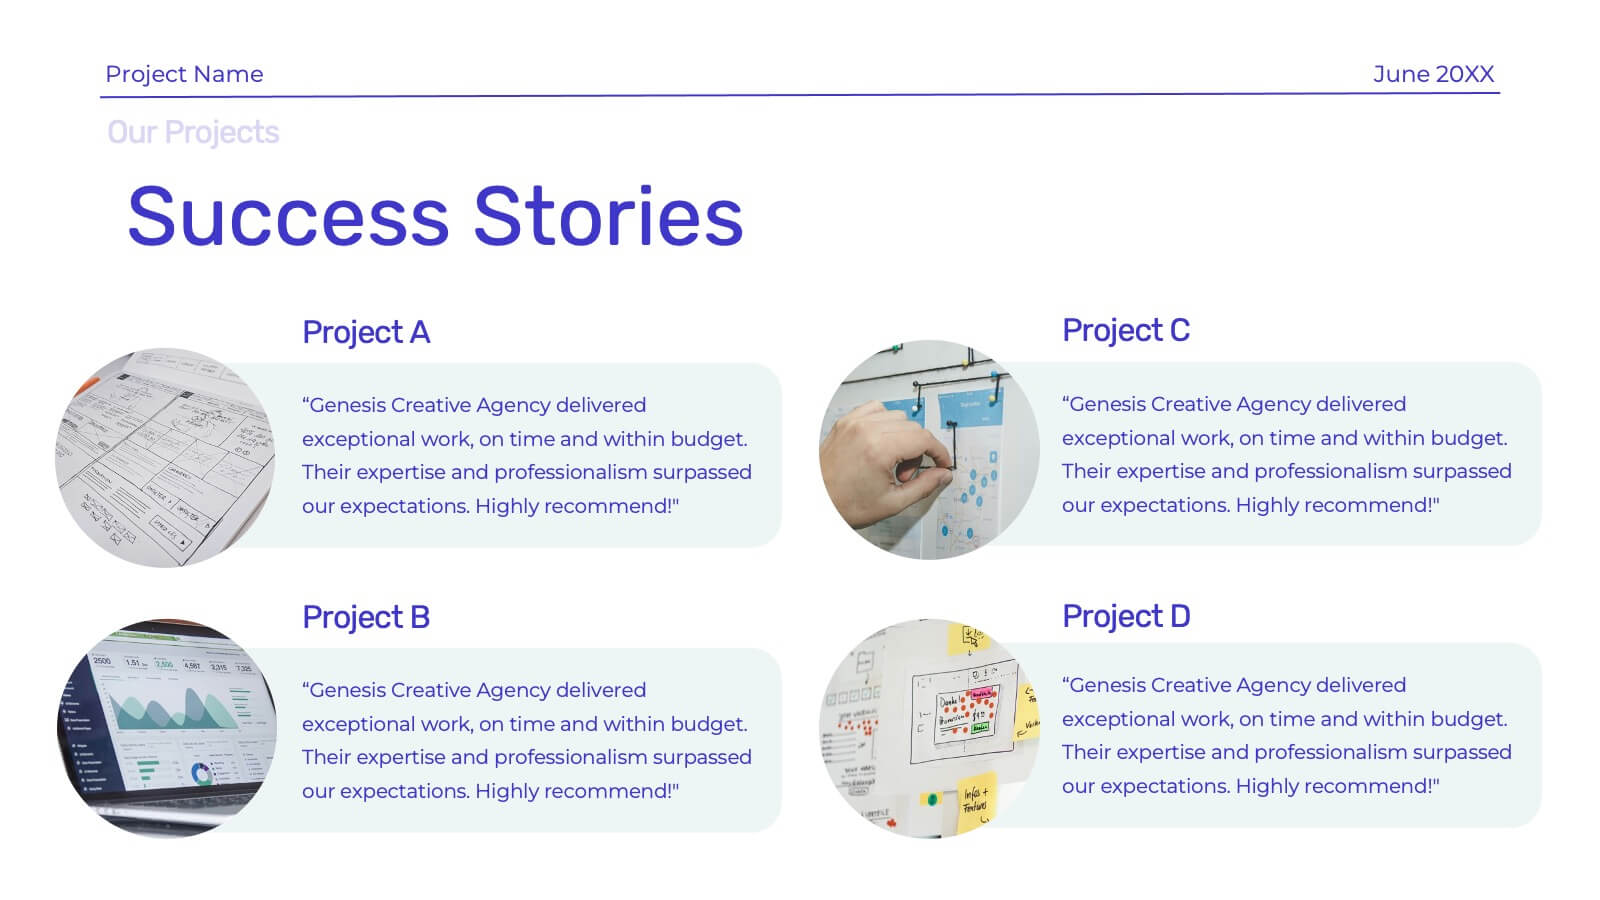
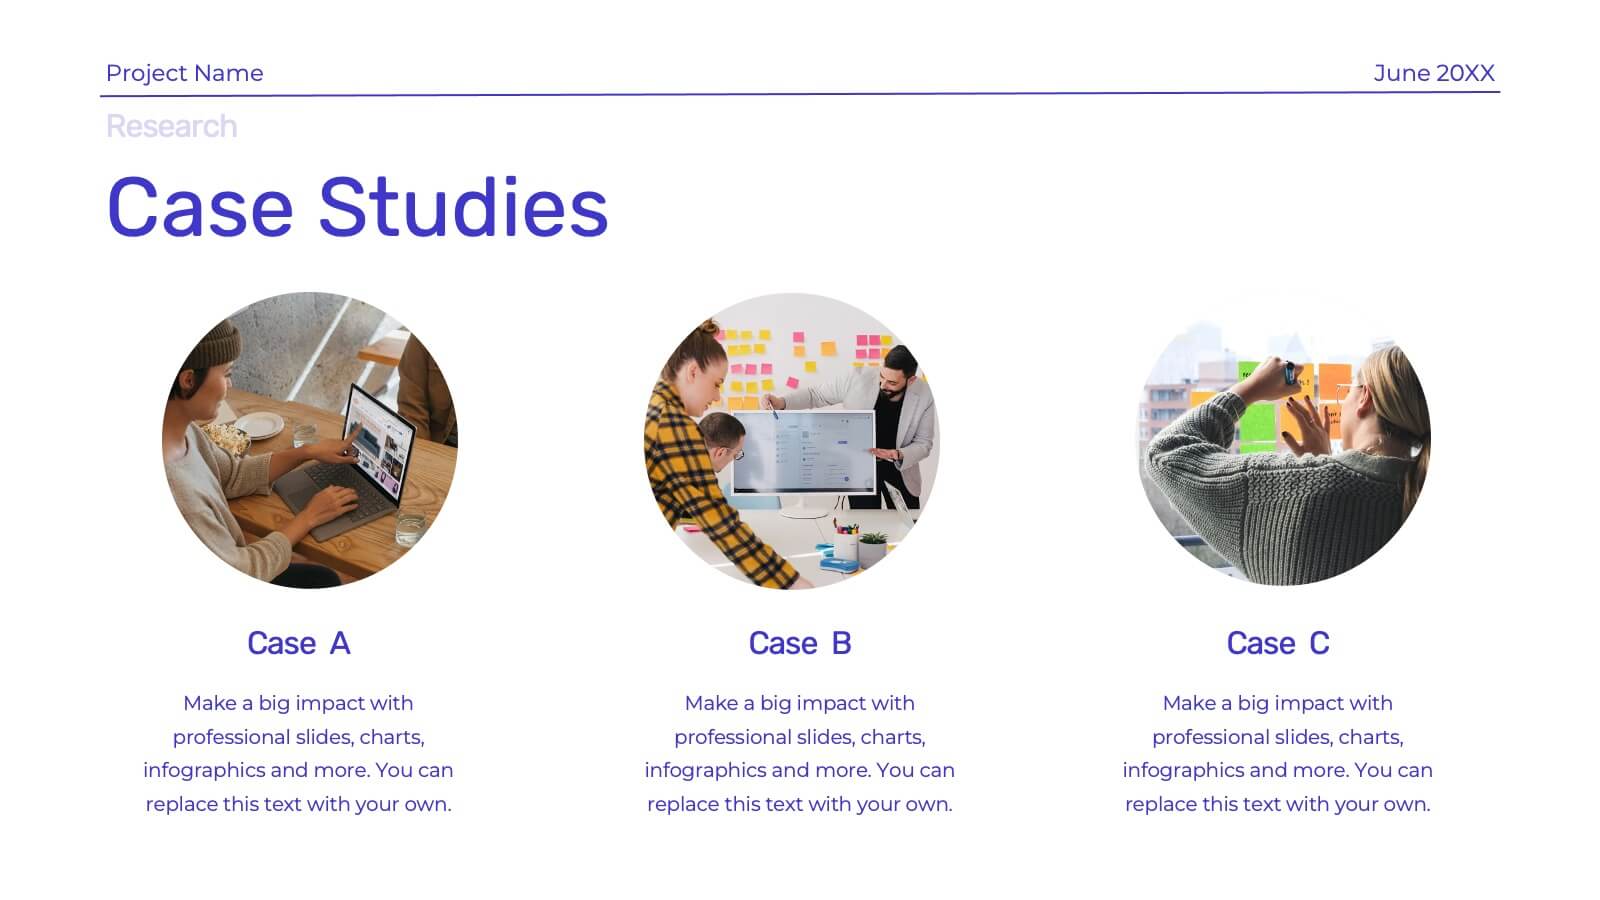
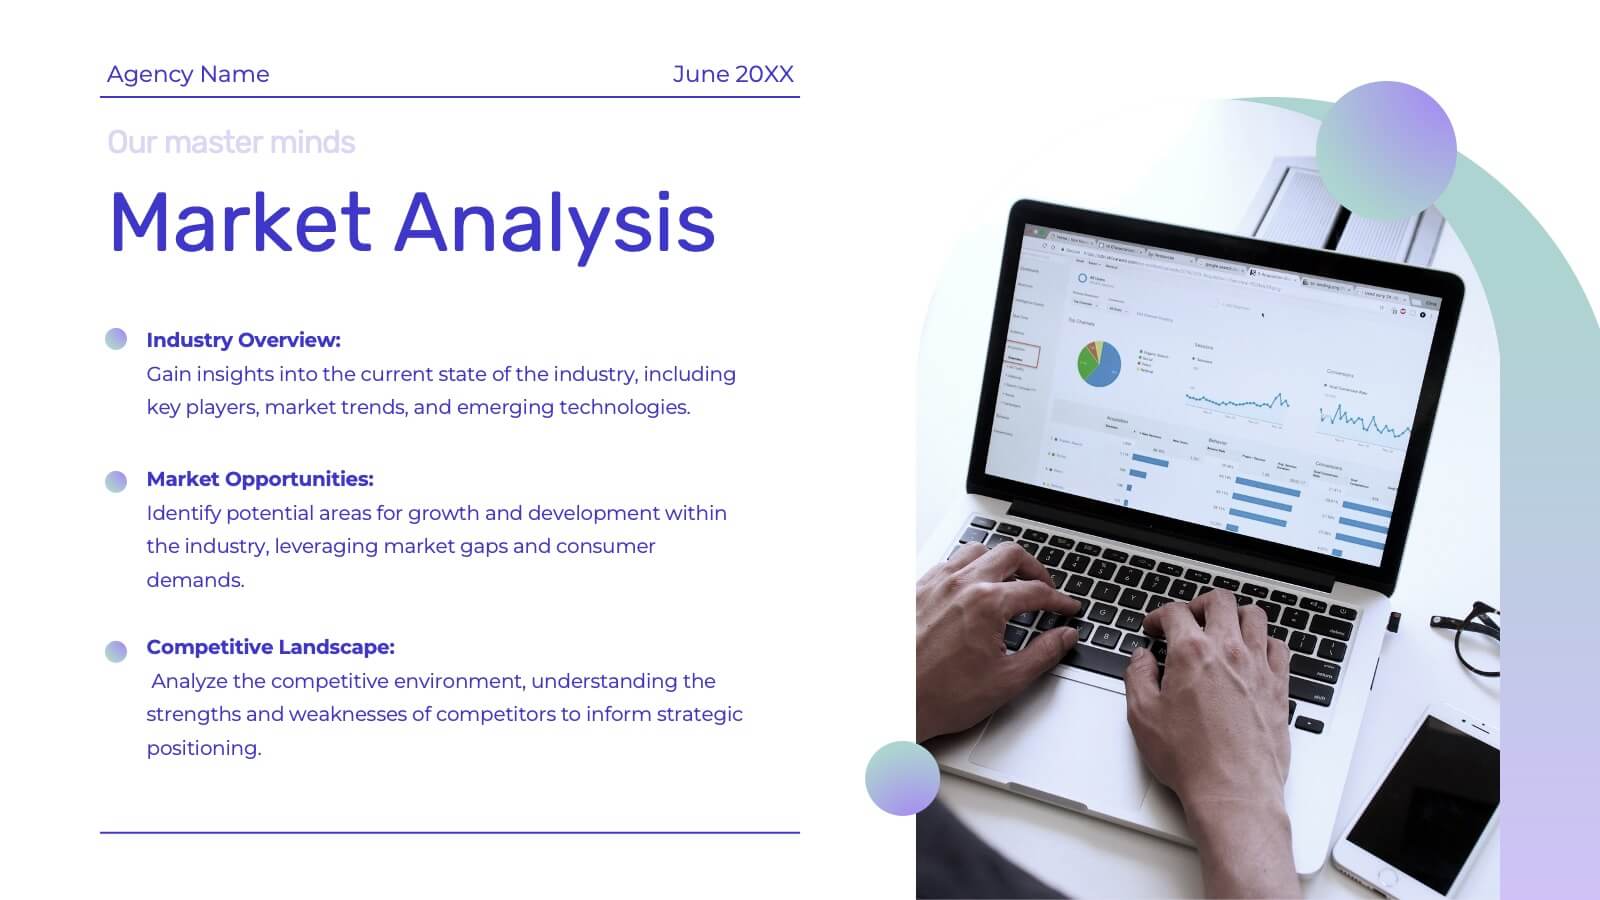
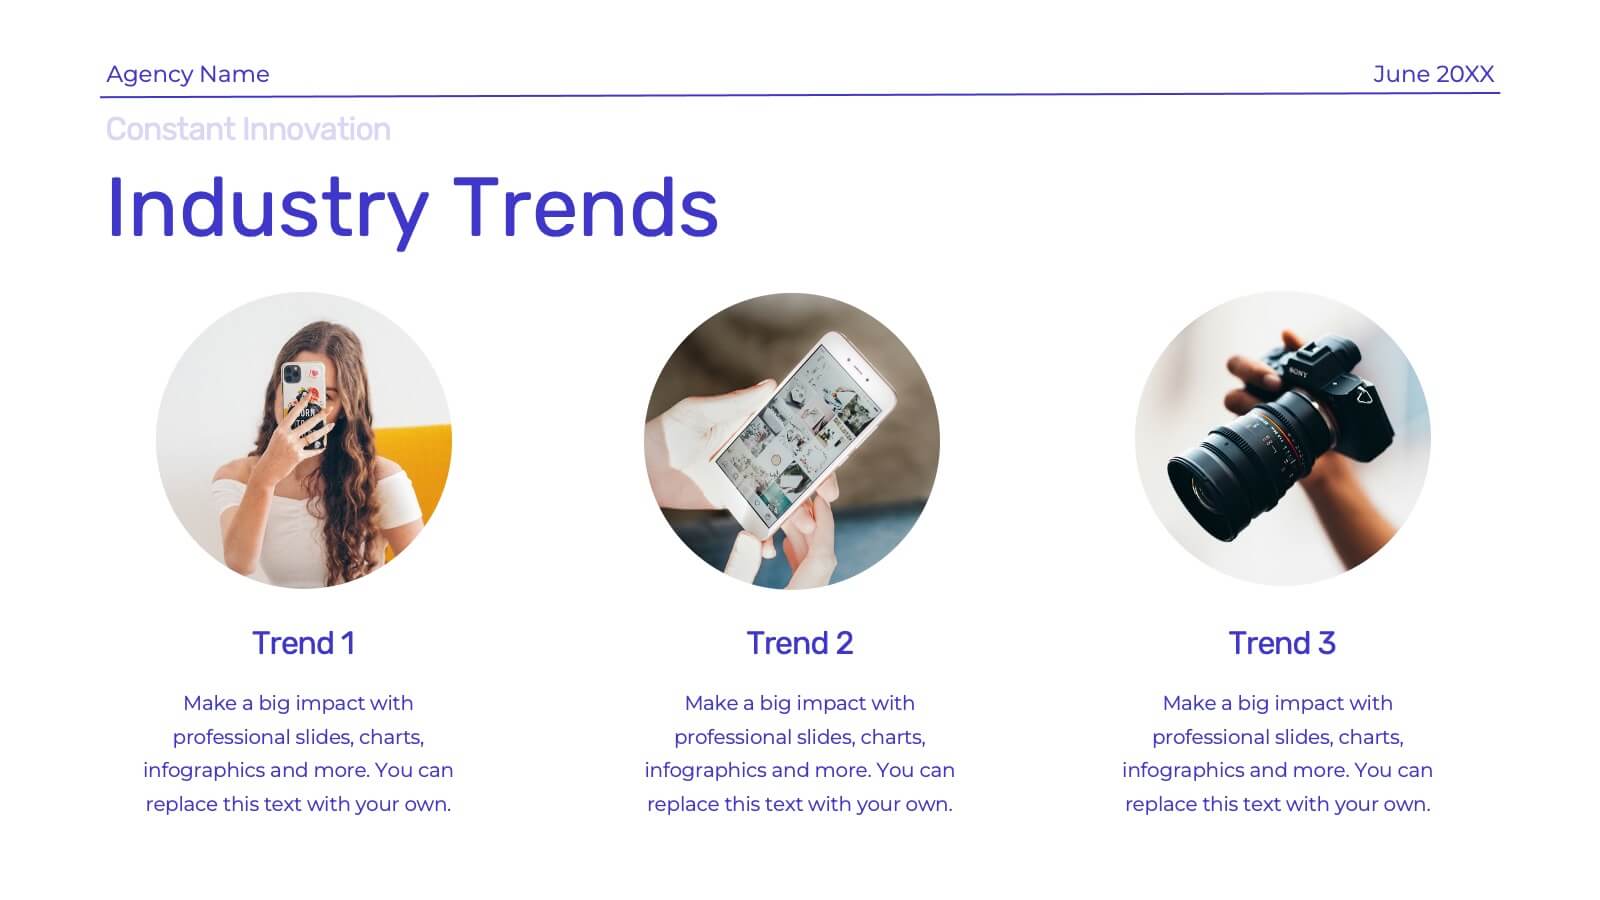
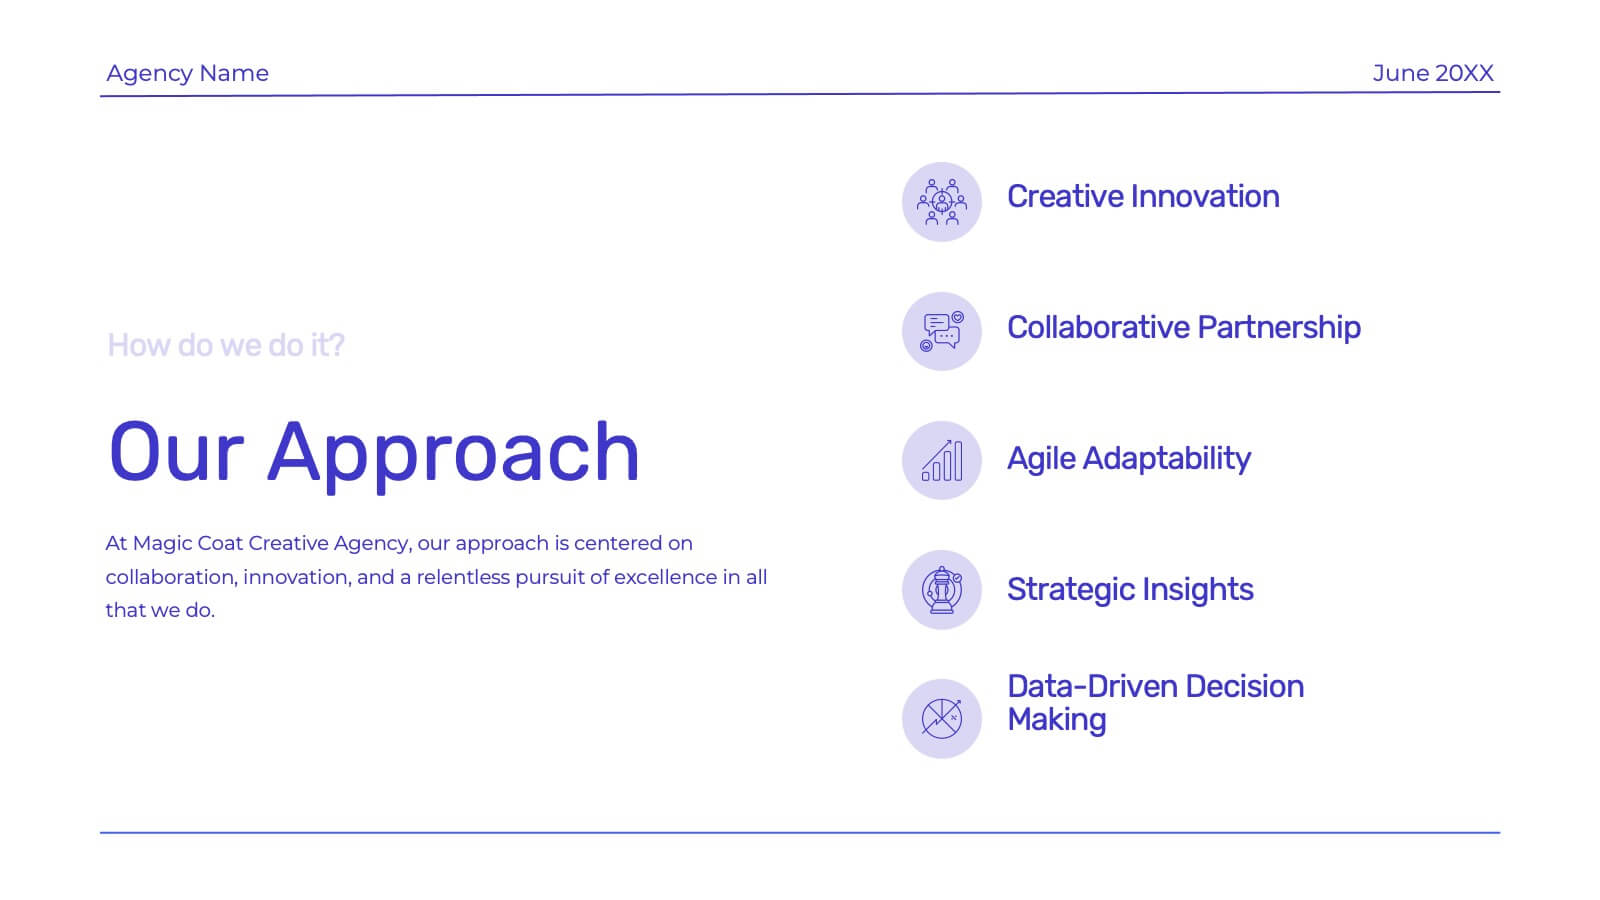
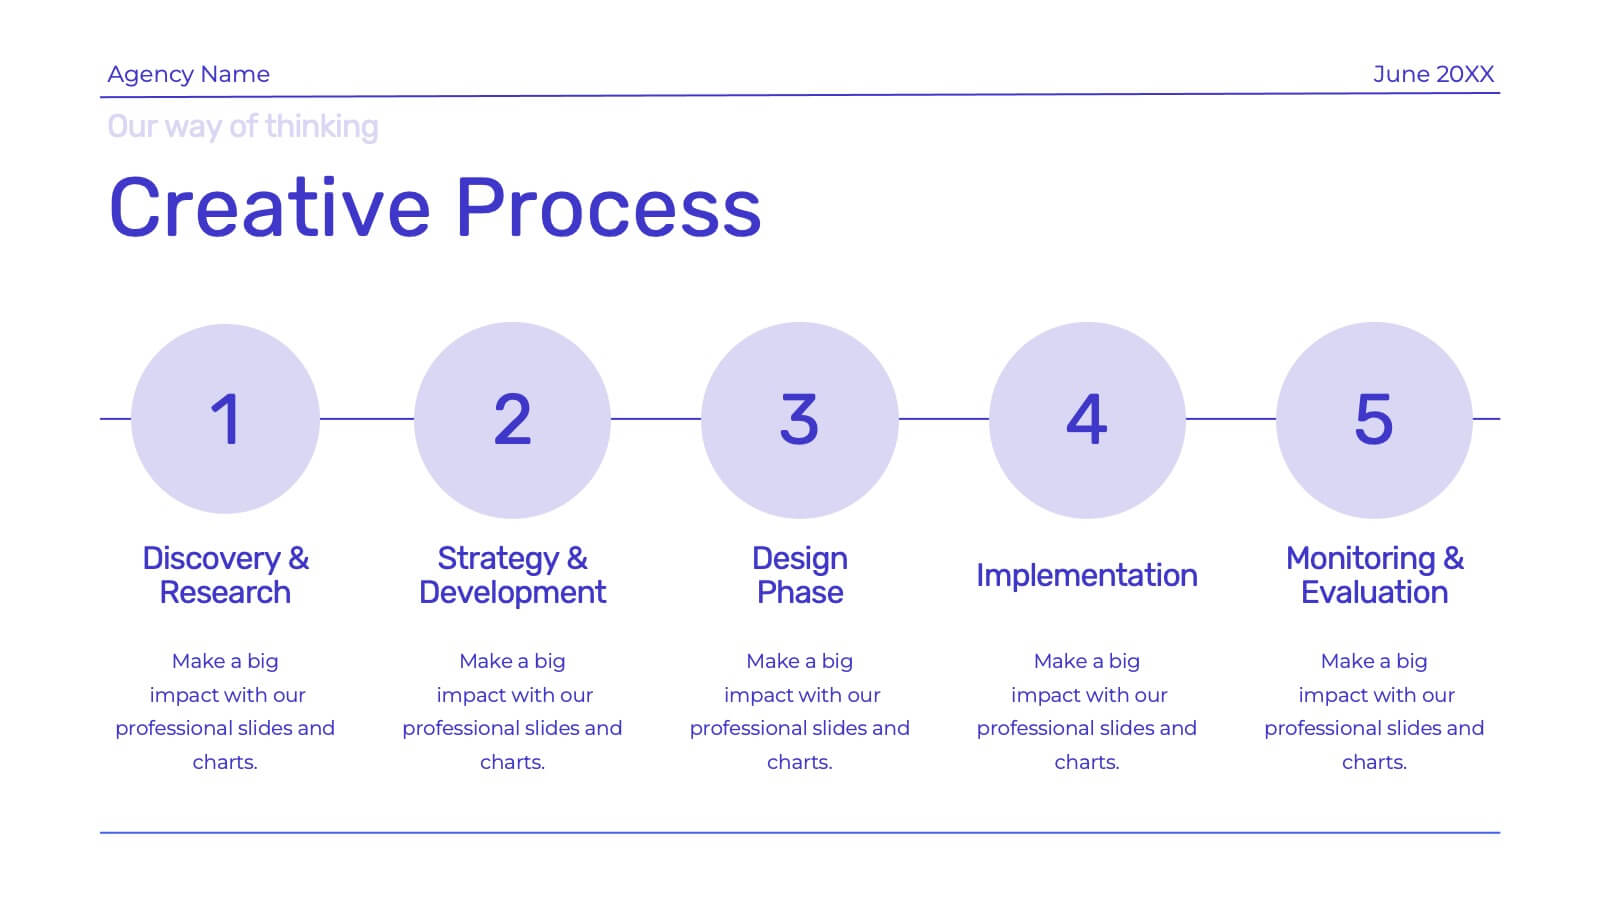
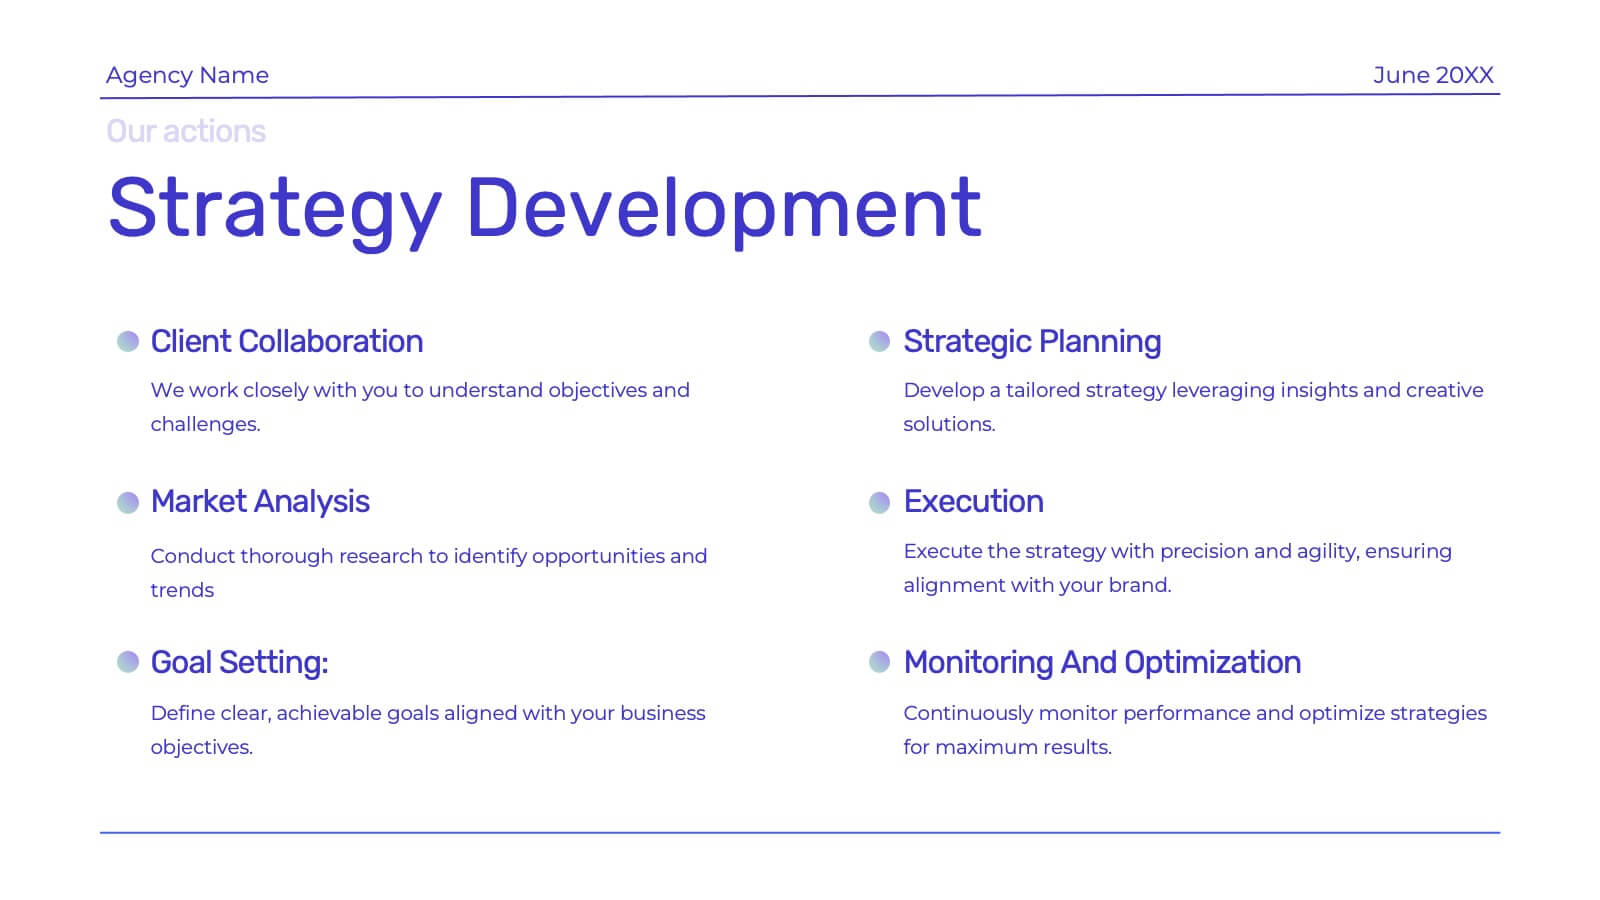
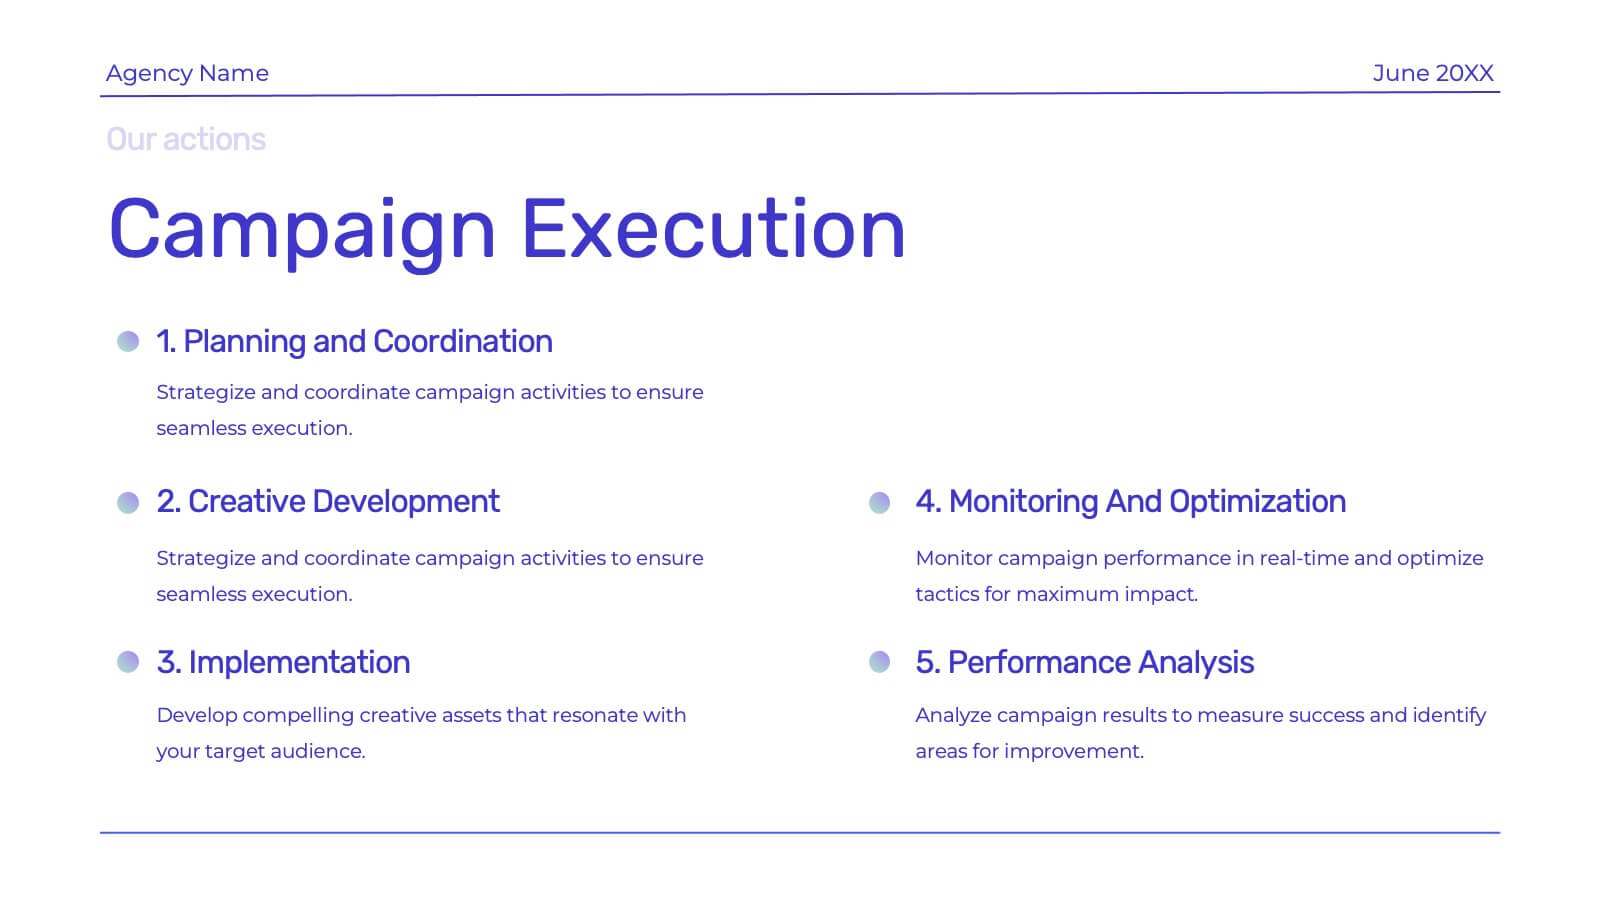
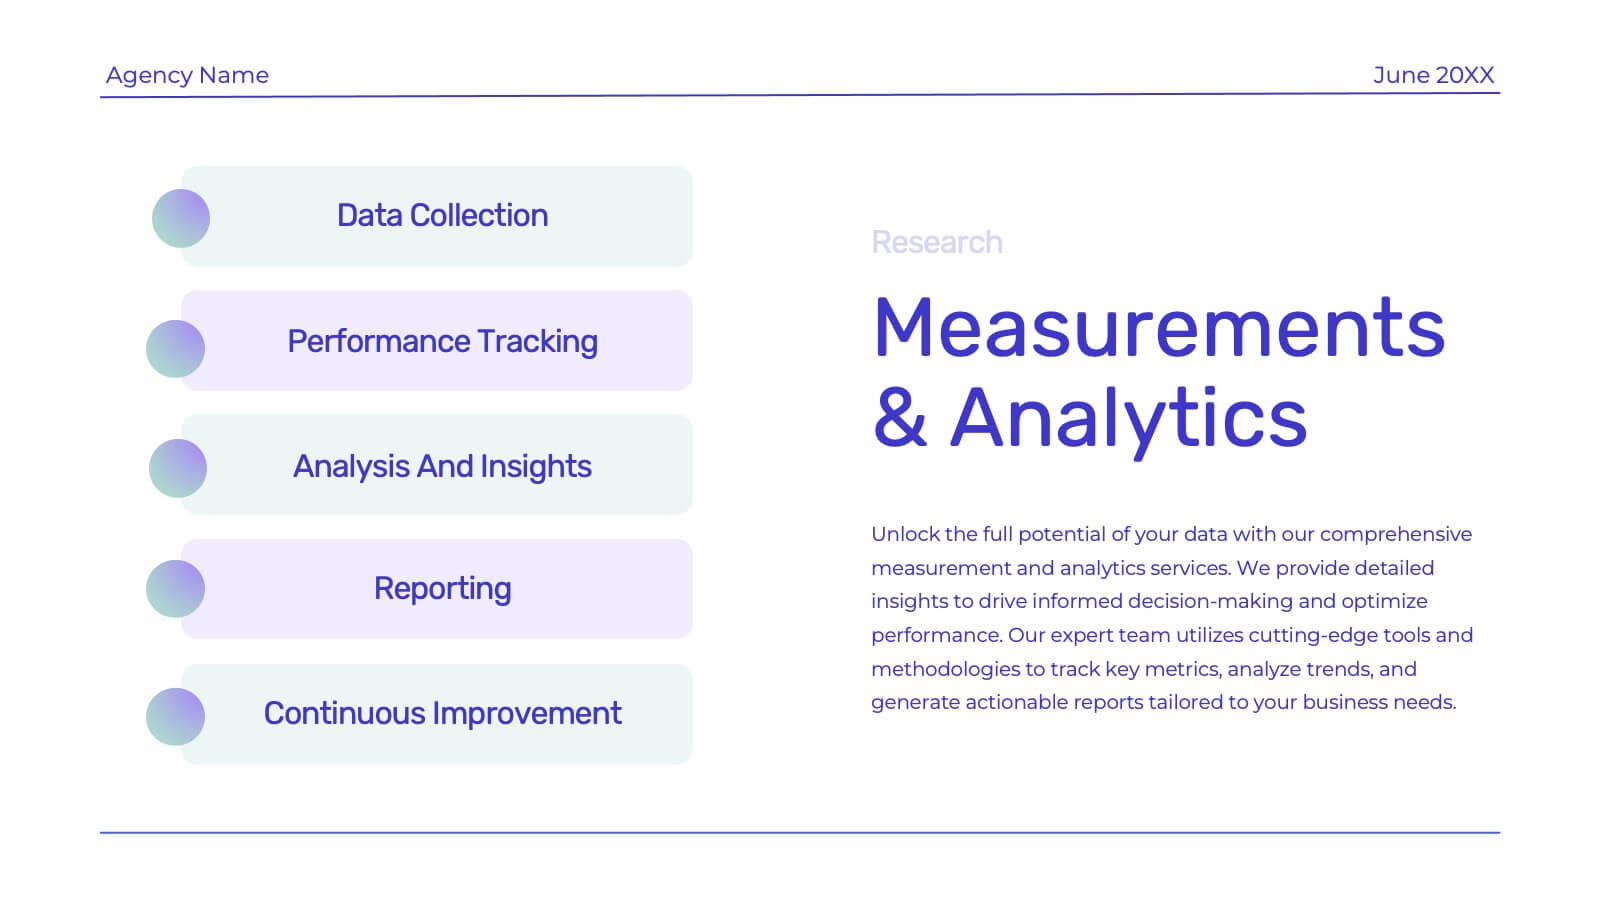
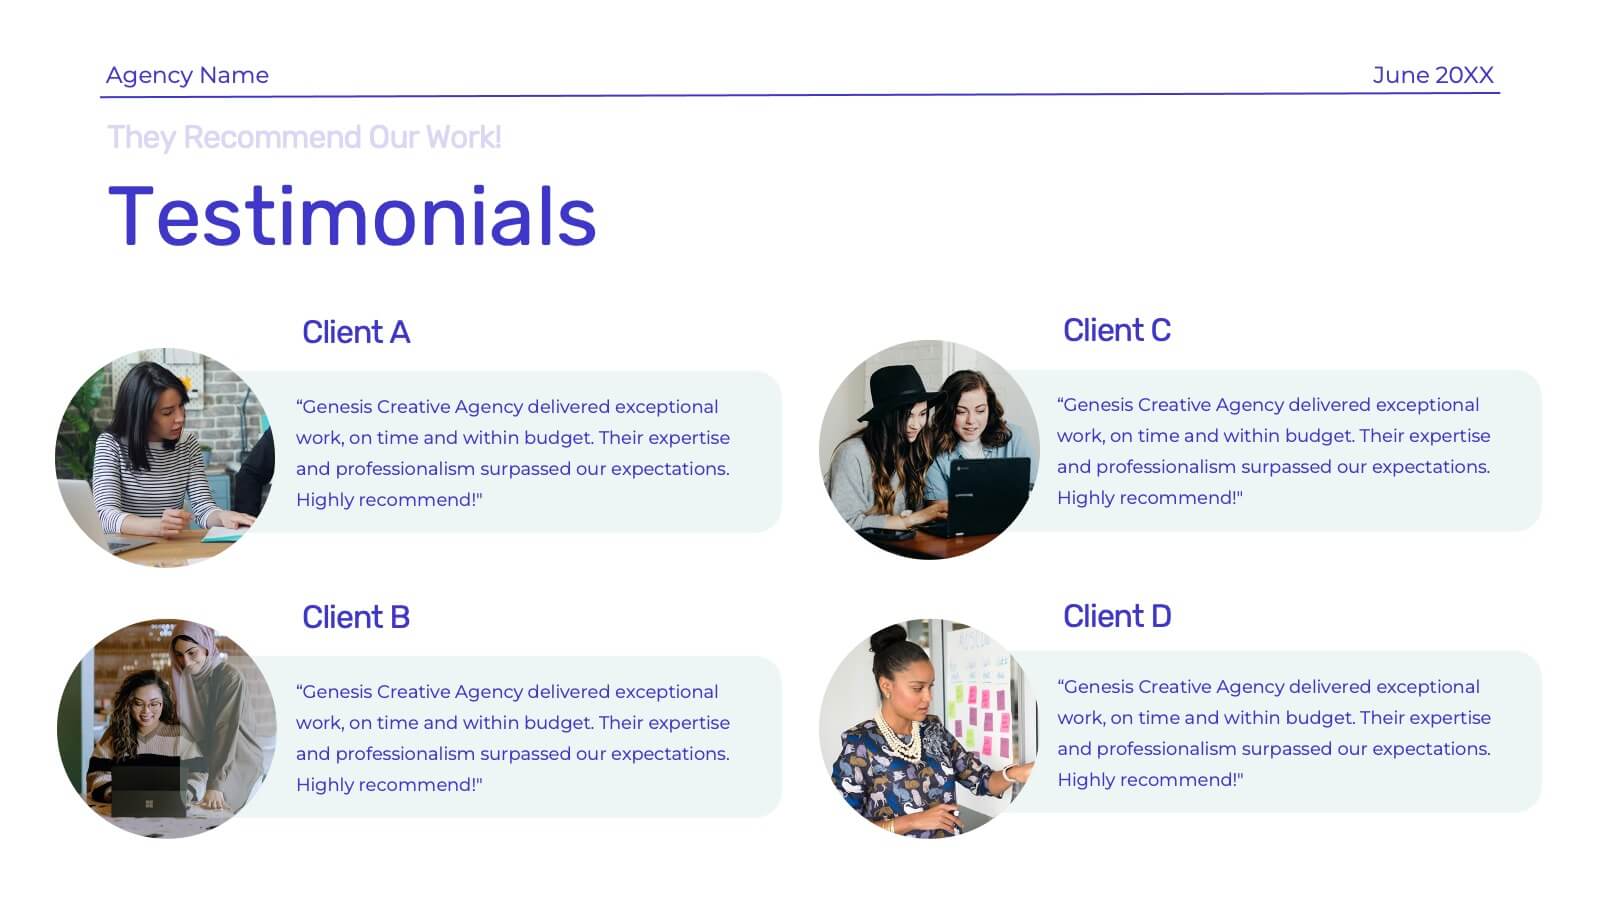
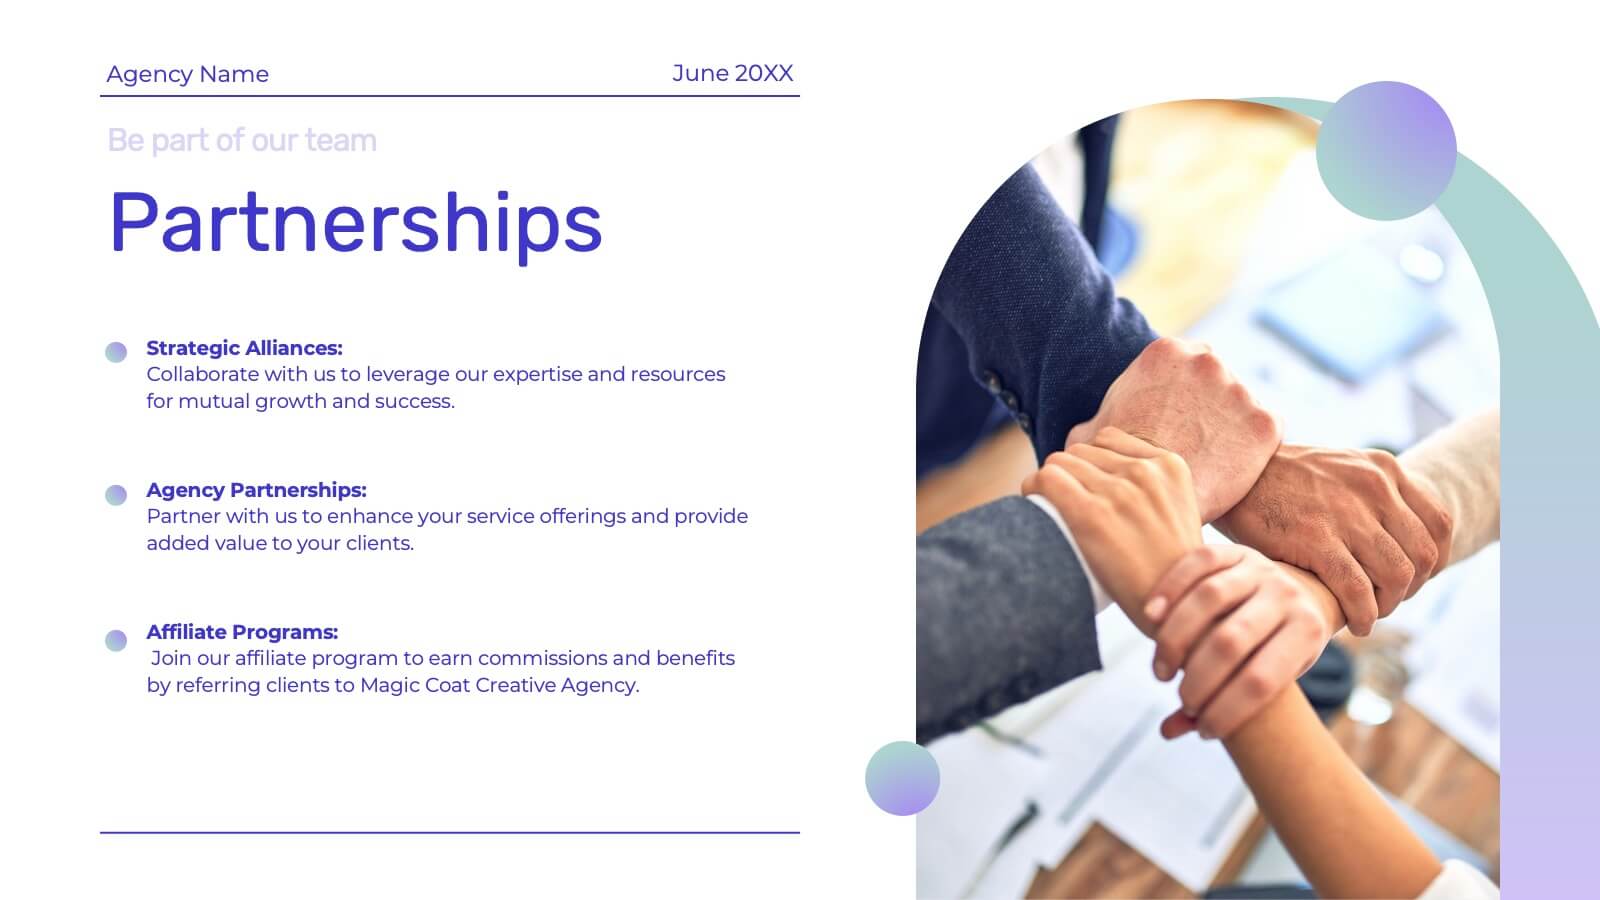
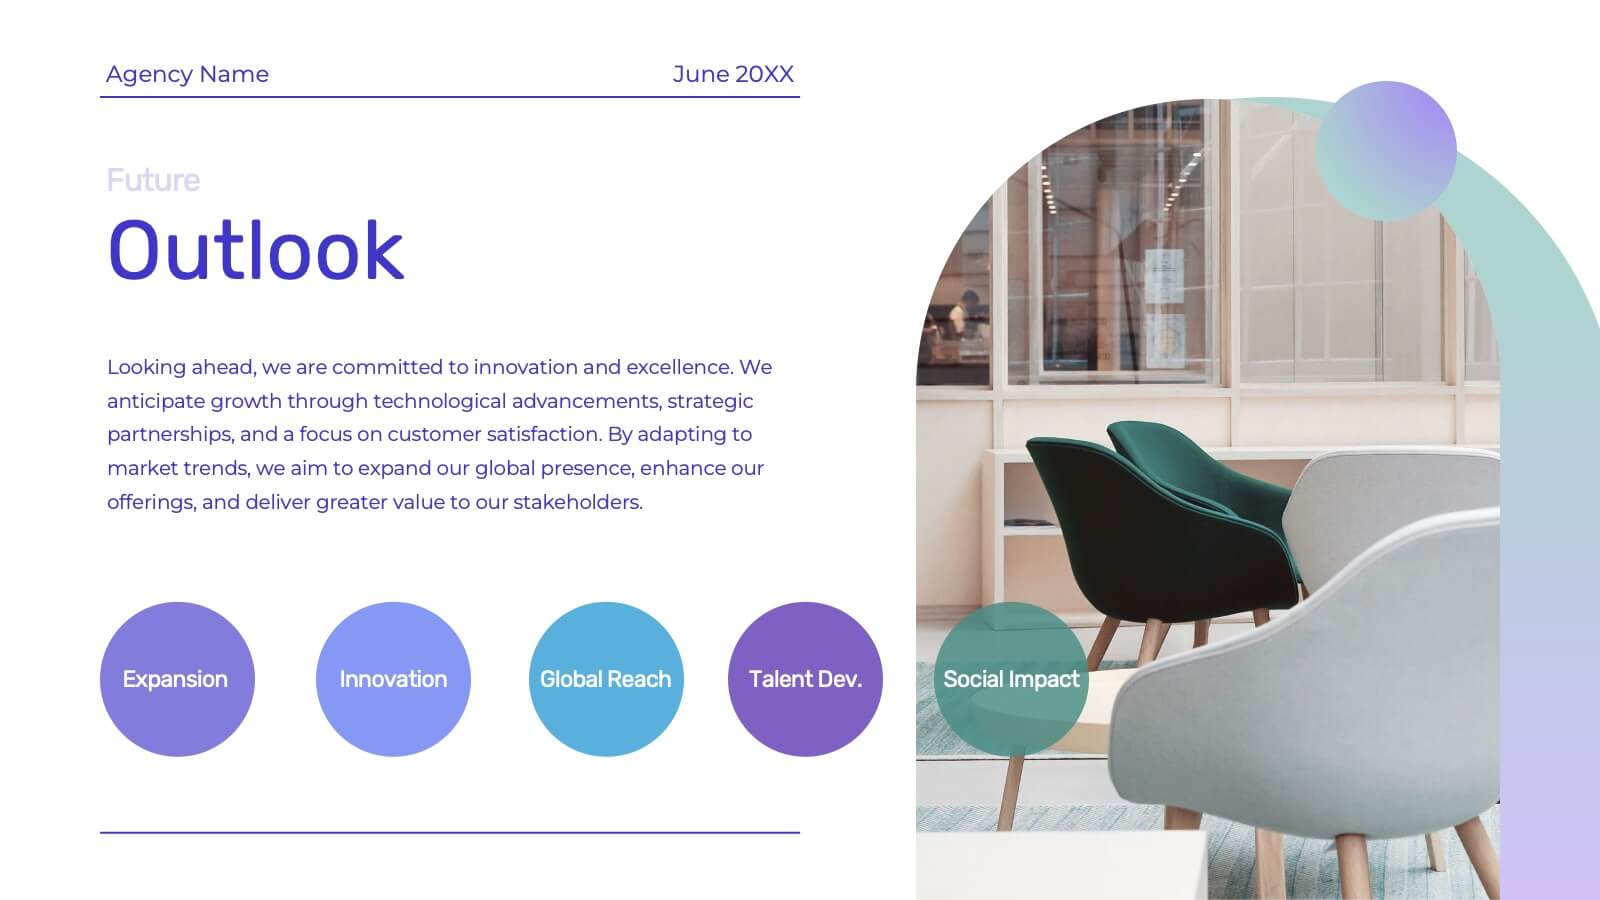
Genesis Creative Agency Pitch Deck Presentation
Showcase your creative agency’s strengths with this vibrant template. Highlight your team, services, success stories, and unique approach. Ideal for case studies, market analysis, and campaign execution. Fully compatible with PowerPoint, Keynote, and Google Slides.


5 slides
Porter's Model of Competitive Strategy Presentation
The Porter's Model of Competitive Strategy Presentation offers a unique and modern take on the classic 5 Forces framework. Each force—Buyers, Suppliers, Competitors, Substitutions, and New Entry—is visually represented in a pentagonal arrangement, making it easy to see how each element interacts. With customizable sections for text and icons, this layout is perfect for strategic analysis, consulting reports, or business planning. Compatible with PowerPoint, Keynote, and Google Slides.


5 slides
Business Process Workflow Presentation
Make your business processes crystal clear with this streamlined, modern layout. Designed to visualize every stage from start to success, this presentation helps communicate progress, efficiency, and key actions with precision. Perfect for business planning or reporting, it’s fully compatible with PowerPoint, Keynote, and Google Slides for easy customization.


21 slides
Talestra Startup Pitch Deck Presentation
Make a strong first impression with this clean and modern startup pitch deck. Covering key areas such as mission and vision, market analysis, business model, growth plan, and financial overview, it's designed to captivate investors and stakeholders. Fully customizable and compatible with PowerPoint, Keynote, and Google Slides.


10 slides
Customer Satisfaction and Smile Rating Presentation
Visualize customer experience in a clear and engaging way with this Customer Satisfaction and Smile Rating slide. Featuring a vertical feedback meter and 5 customizable rating levels, this template is ideal for highlighting user sentiment, service evaluations, or feedback summaries. Perfect for performance reviews, UX reports, or NPS breakdowns. Compatible with PowerPoint, Keynote, and Google Slides.


5 slides
Agile Project Roadmap Presentation
Visualize your quarterly project plans with clarity using this Agile roadmap slide. Designed with a horizontal layout for Q1 to Q4, this infographic includes three workstreams and color-coded bars to represent initiatives or sprints. Icons provide quick visual cues for different teams or objectives. Ideal for agile teams, product managers, or project leads who need a clean, editable layout. Compatible with PowerPoint, Keynote, and Google Slides.


5 slides
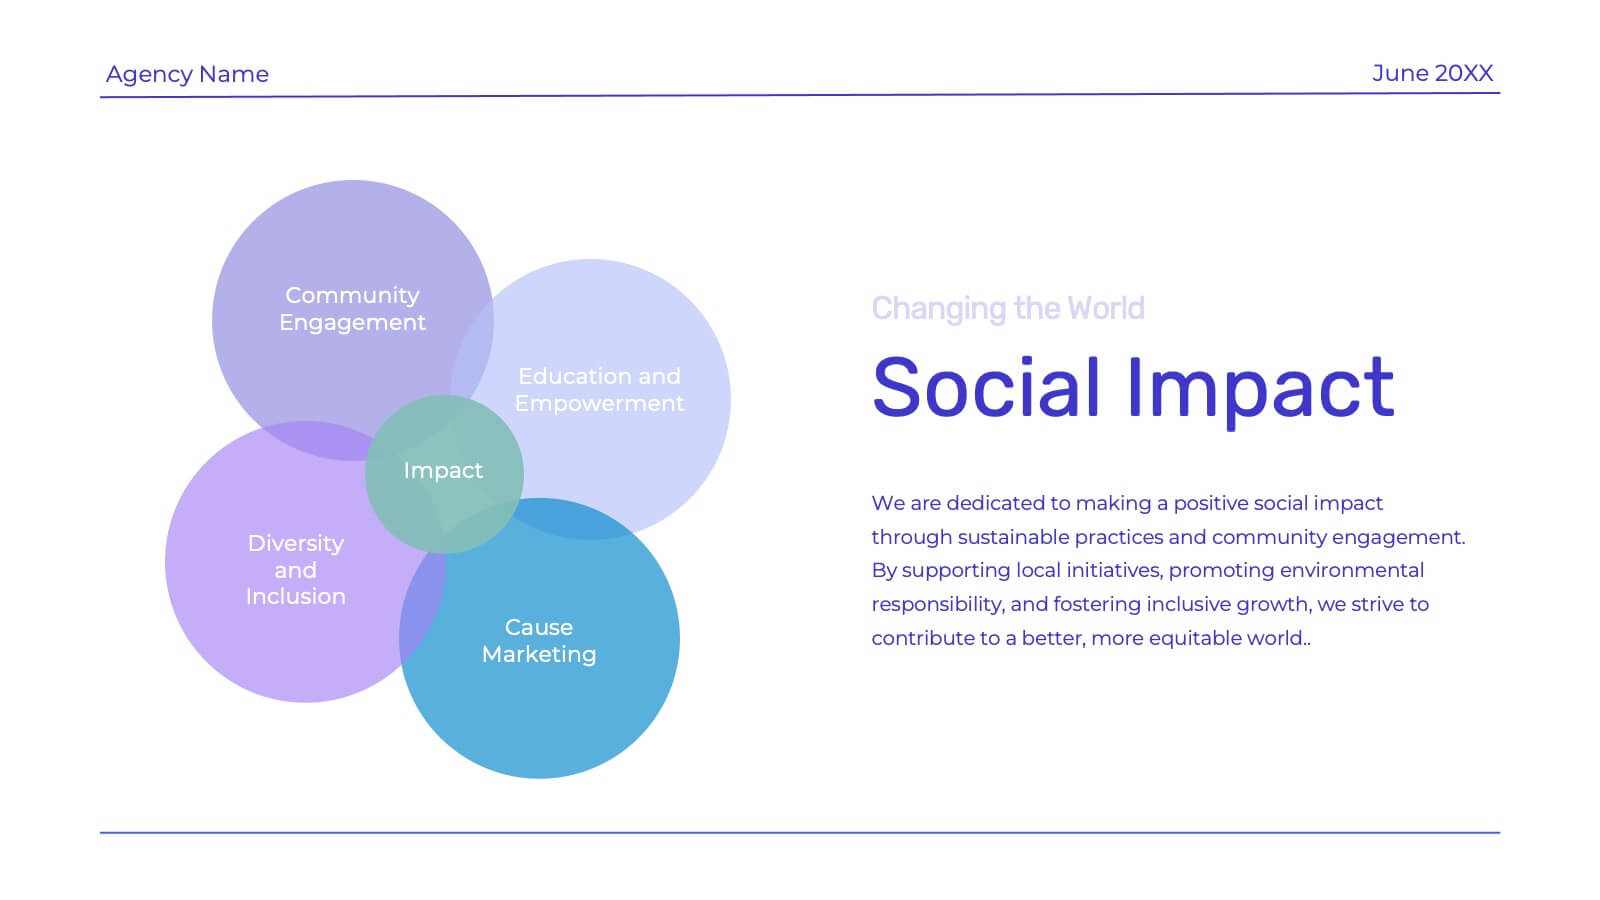
Innovative Strategic SWOT Layout
Visualize your strategic edge with the Innovative Strategic SWOT Layout Presentation. This clean, overlapping-circle design brings attention to the interconnection between Strengths, Weaknesses, Opportunities, and Threats while maintaining a minimal, modern look. Each element is paired with space for concise insights, making it perfect for leadership briefings, planning sessions, or team reviews. Fully editable in PowerPoint, Keynote, and Google Slides.


12 slides
Milestone Achievement Progress Map Presentation
Visualize progress with clarity using this dynamic Milestone Achievement Progress Map. Each slide combines bar charts and upward arrows to showcase key accomplishments, performance phases, or goal tracking. With three customizable titles and color-coded segments, this layout is perfect for project updates, strategy reviews, or performance recaps. Fully editable in PowerPoint, Keynote, and Google Slides.


26 slides
Mazen Presentation Template
Mazen is a multi-purpose template that’s perfect for any business. The colors and layout are clean and chic, and it’s suitable for all types of businesses, from small business accounts to large corporate companies. It also has a hip aesthetic with nude warm tones, while pictures and charts are easy to edit and easy to read so users can easily understand the information in them. Easy to use, high quality and many features make this template suitable for all kinds of businesses. Pictures and charts are also made for easy editing as well as easy readability without too much confusion on reading.


5 slides
Interlocking Puzzle Infographic Presentation
Visually connect ideas with the Interlocking Puzzle Infographic. This design is perfect for illustrating processes, relationships, and key concepts that fit together seamlessly. Whether you're presenting business strategies, project workflows, or educational content, this template enhances clarity and engagement. Fully customizable and compatible with PowerPoint, Keynote, and Google Slides.


6 slides
Mind Map Ideas Infographic
A Mind Map is a visual representation of ideas, concepts, and relationships, often created around a central topic or theme. This infographic mind map template offer a versatile and effective method for organizing, analyzing, and visualizing information, making them valuable tools for learning, problem-solving, and creative exploration. The structure of this template consists of the central idea or topic placed at the center of the map. This template provides a structured way to showcase and organize ideas using the mind mapping technique. Compatible with Powerpoint, Keynote, and Google Slides.