


Features
- 8 Unique slides
- Fully editable and easy to edit in Microsoft Powerpoint, Keynote and Google Slides
- 16:9 widescreen layout
- Clean and professional designs
- Export to JPG, PDF or send by email


Do you have any questions?
Recommend


26 slides
AIl for Social Good Presentation
Harness the power of technology for positive change with this inspiring presentation on AI for social good. Covering topics like ethical AI, humanitarian applications, sustainability, and global impact, this template helps showcase how artificial intelligence can drive meaningful progress. Fully customizable and compatible with PowerPoint, Keynote, and Google Slides for a seamless experience.


22 slides
Jolt Business Idea Pitch Deck Presentation
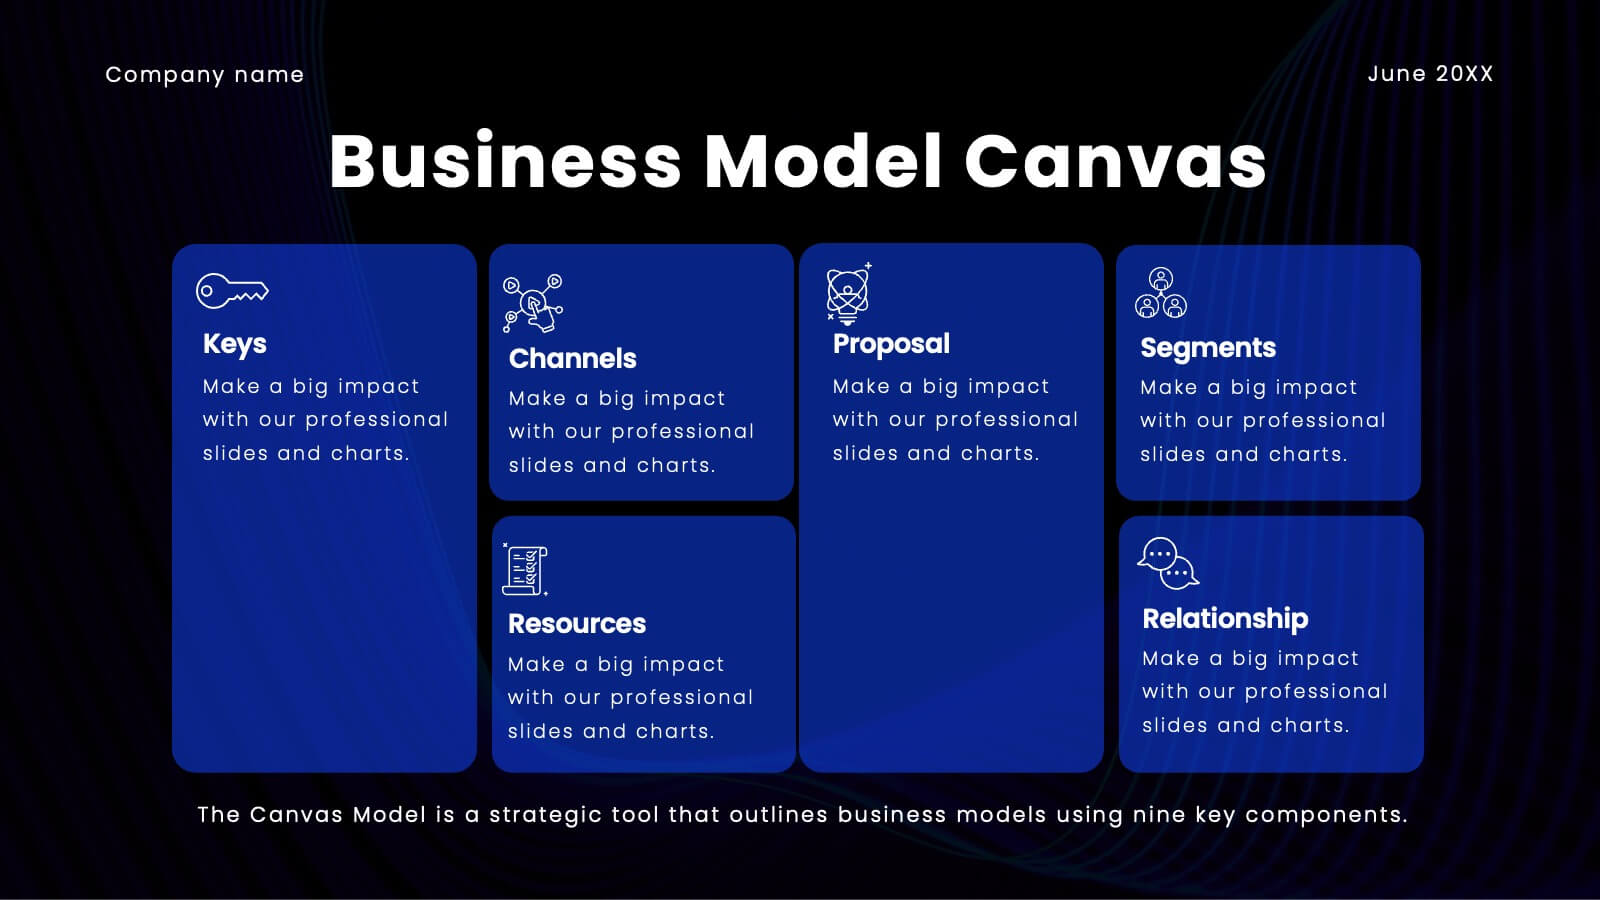
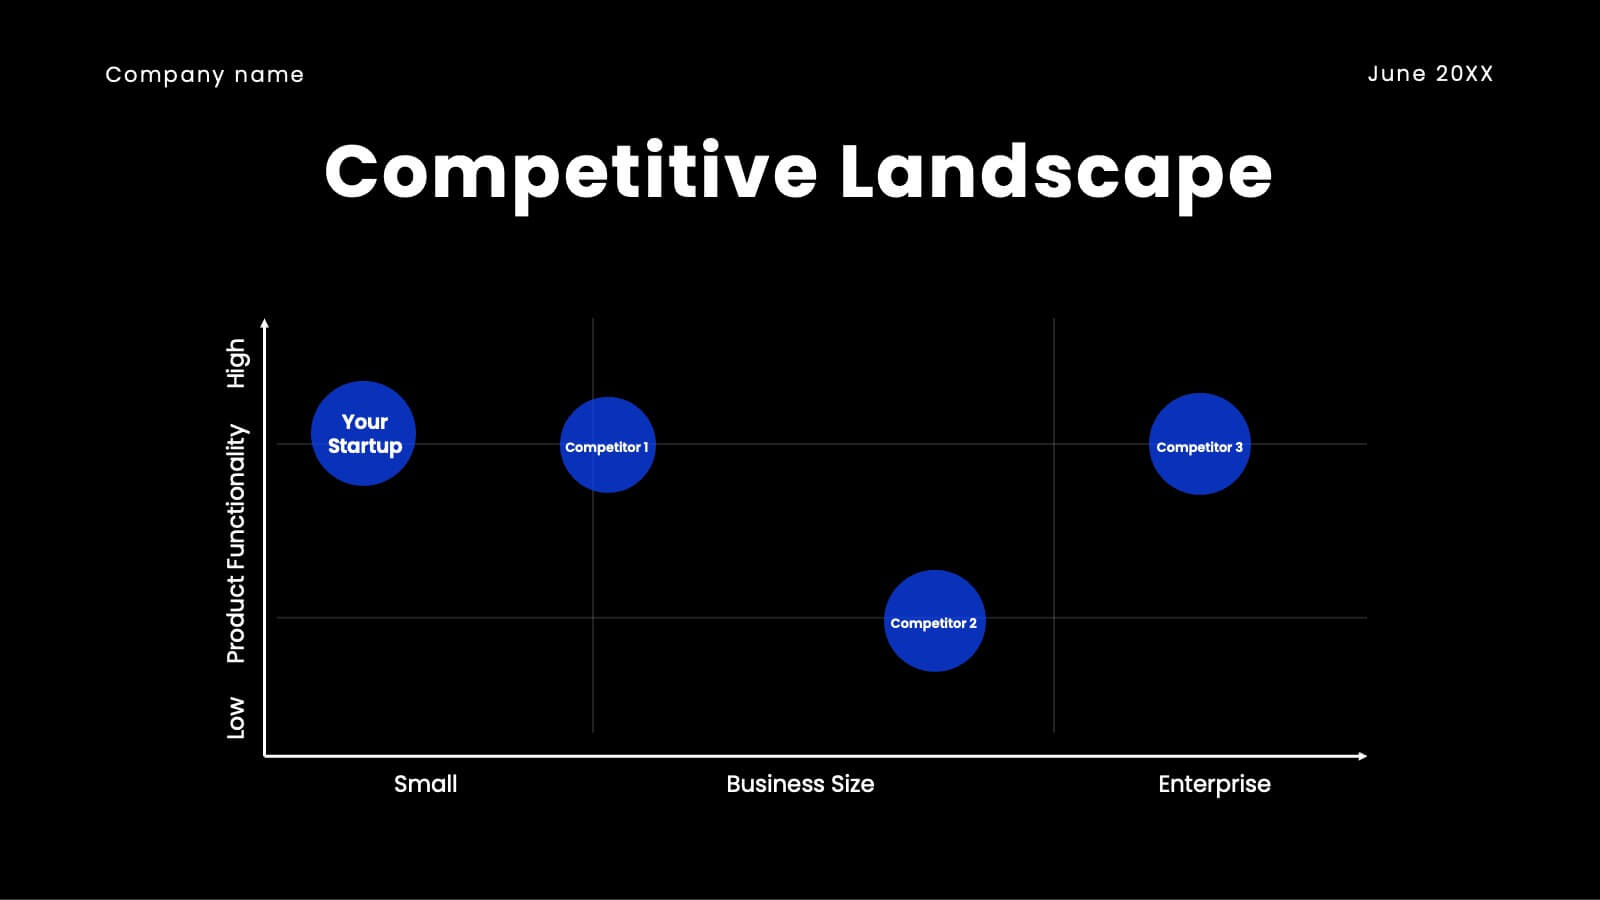
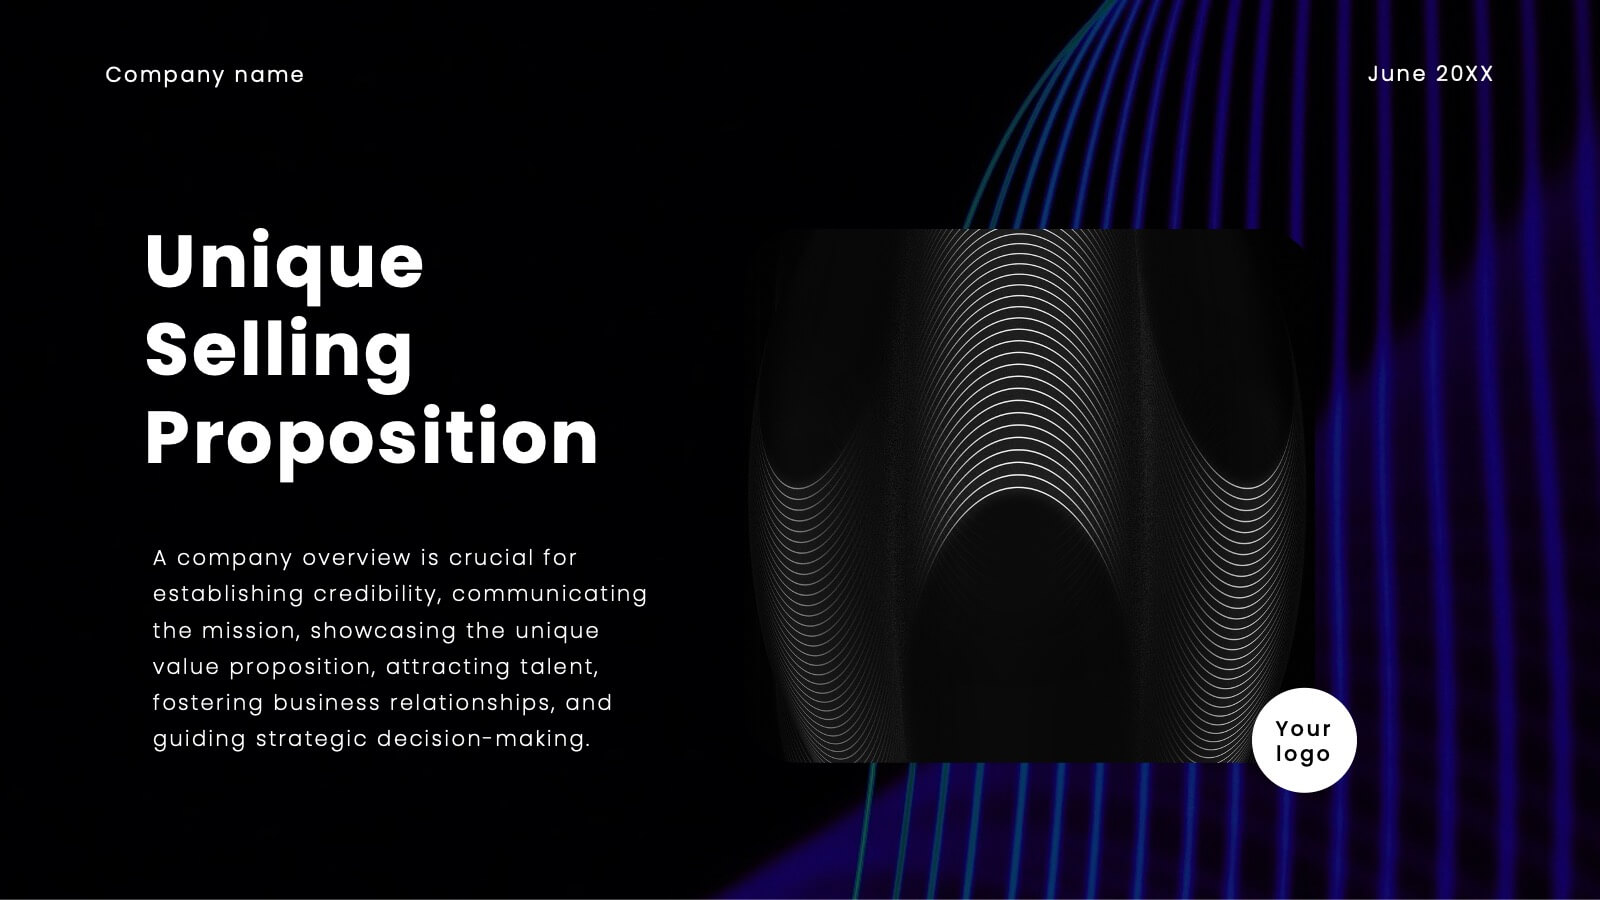
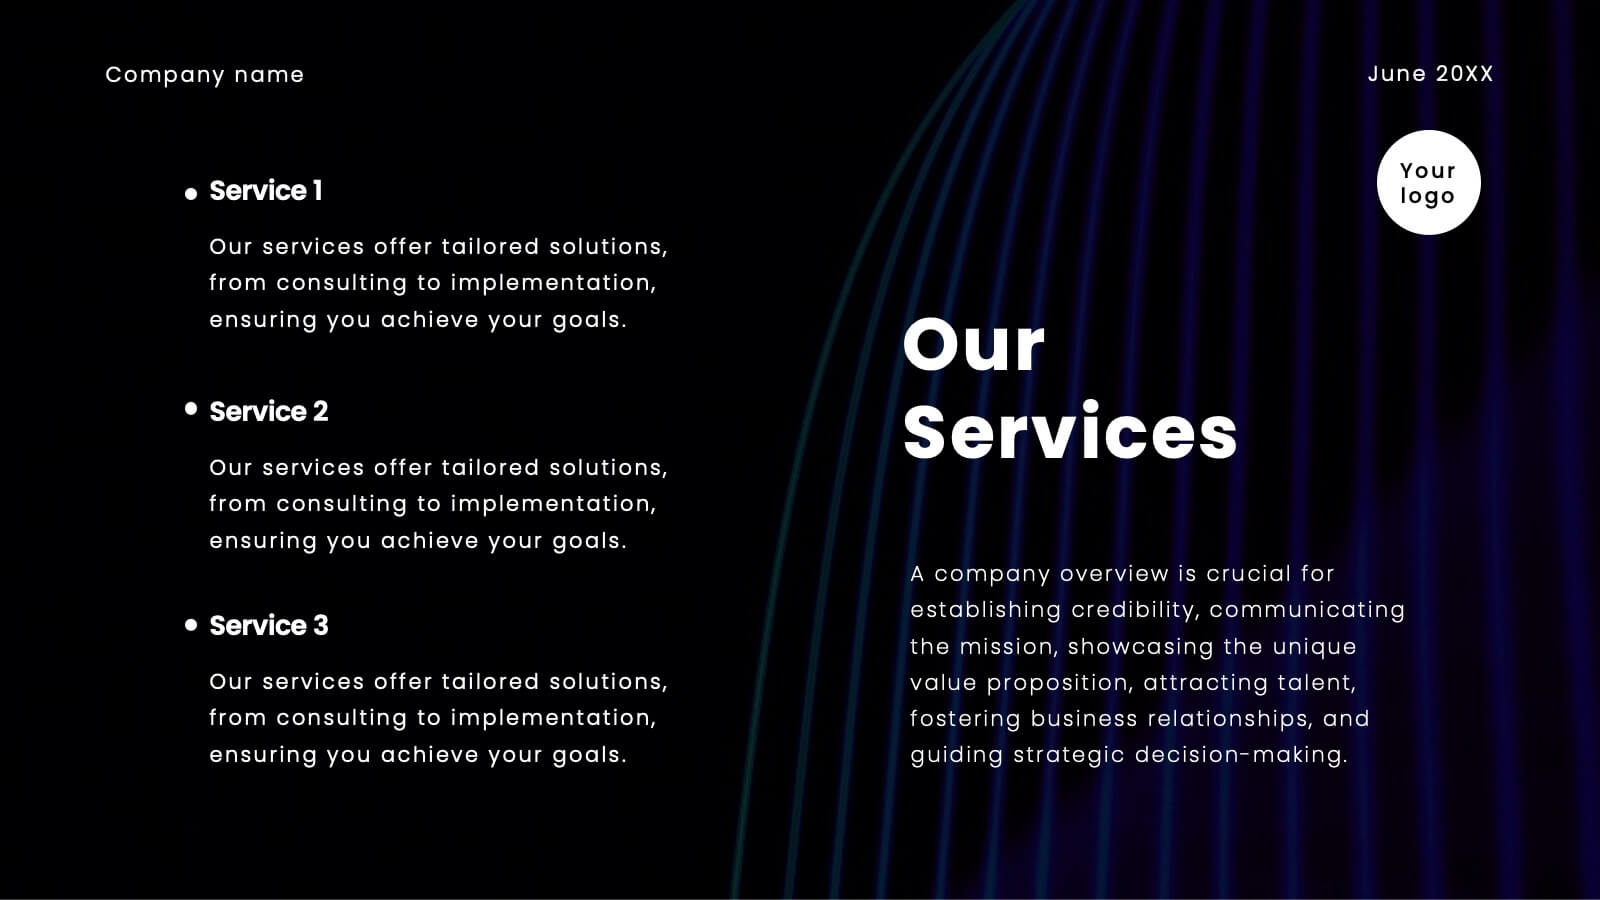
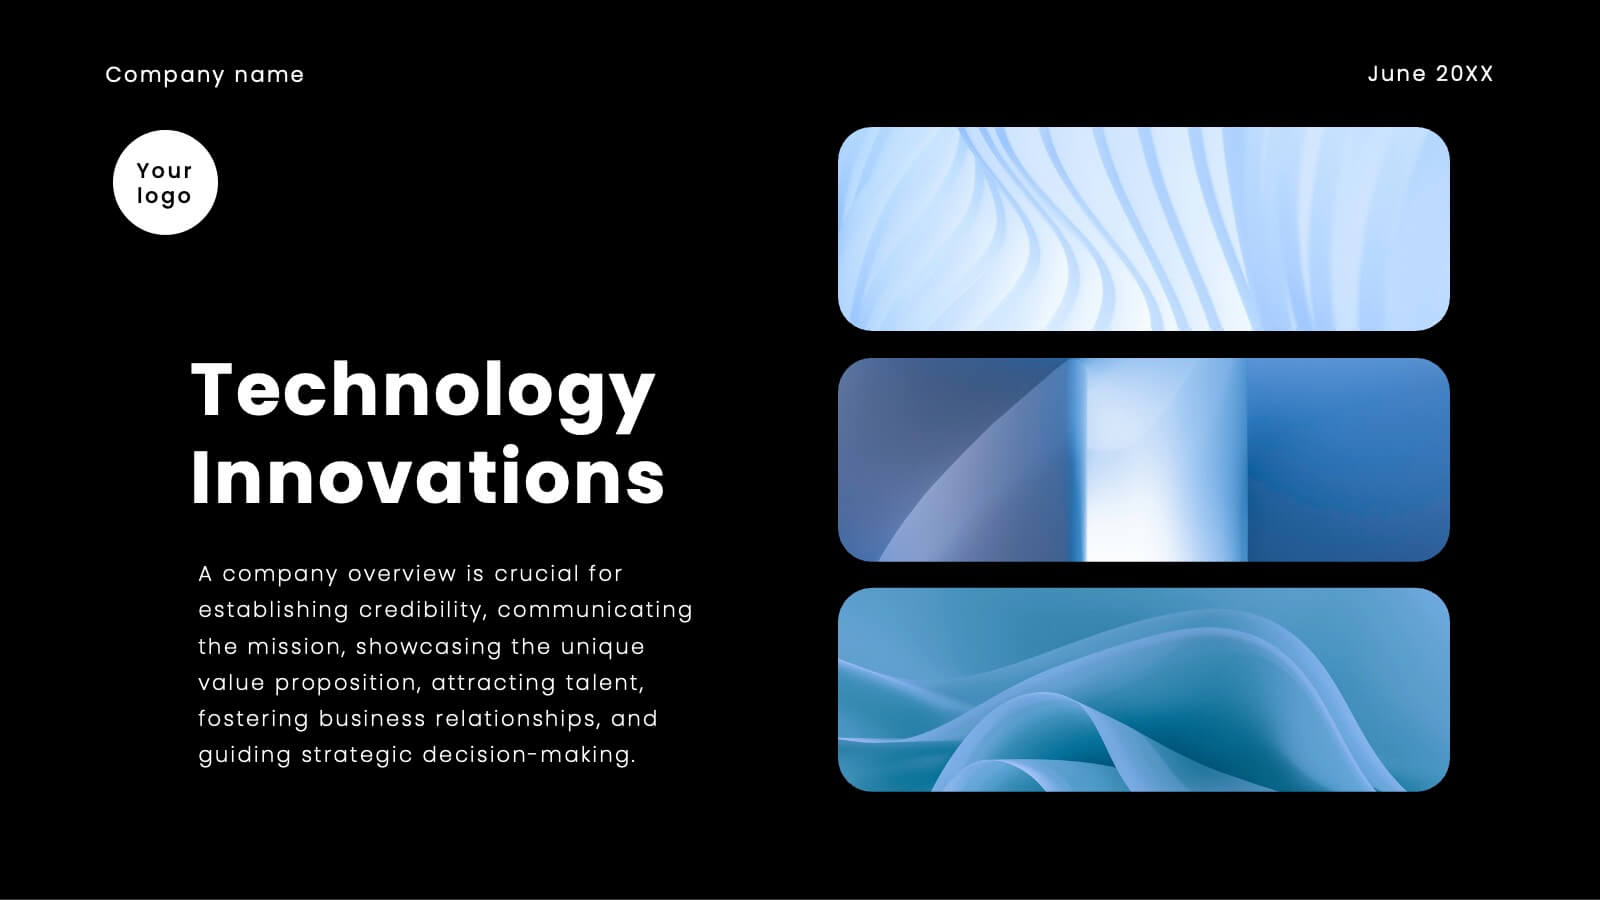
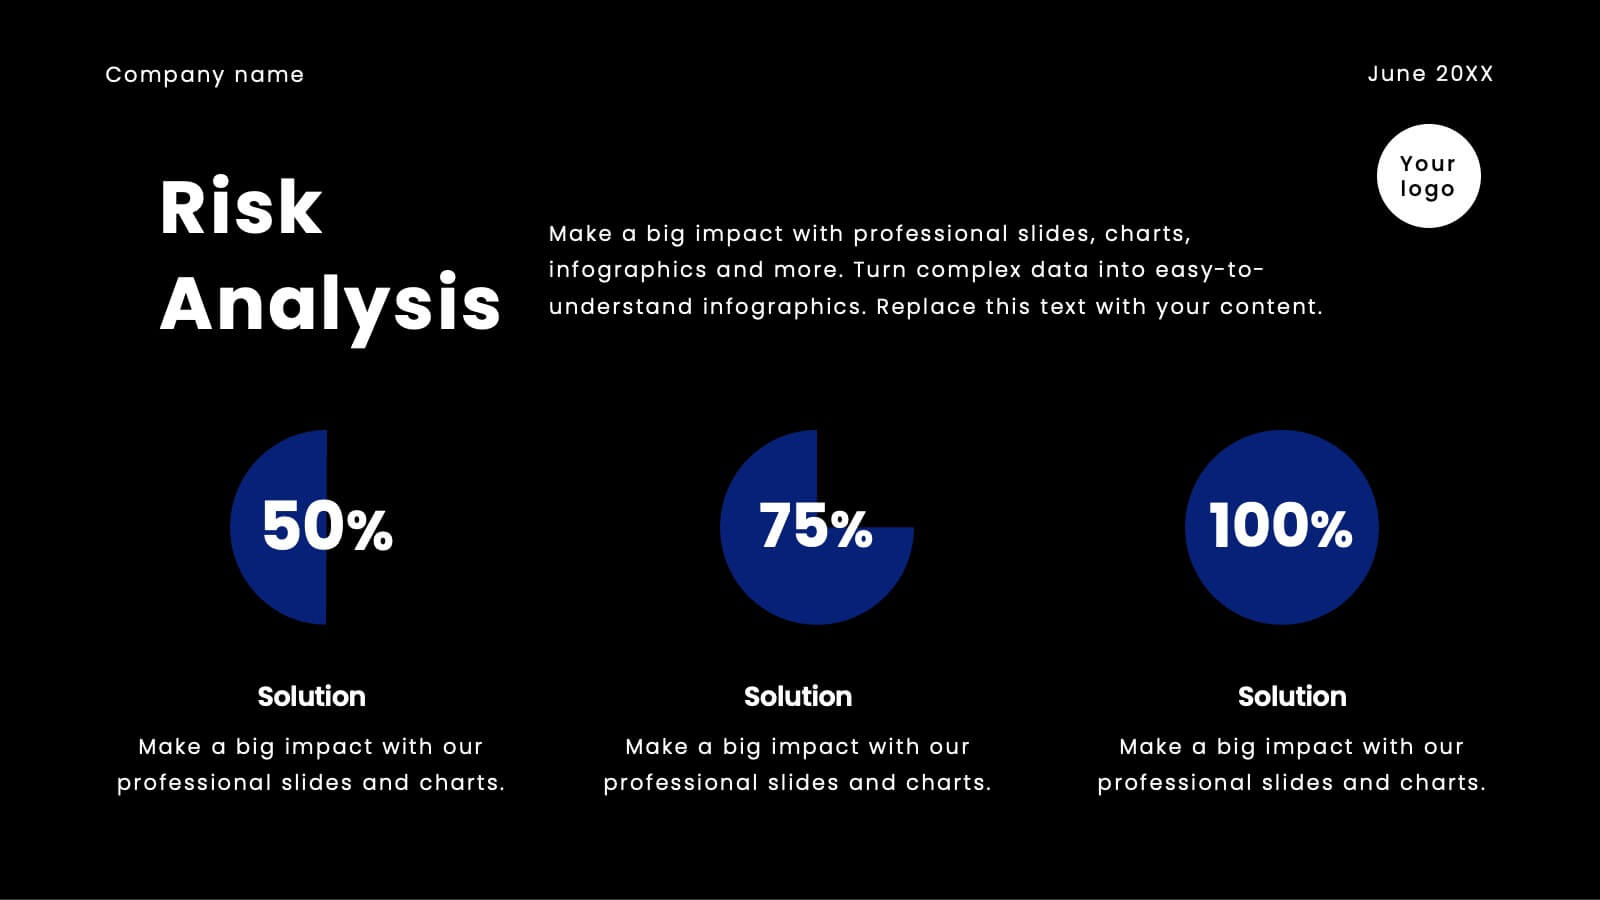
Prepare to electrify your audience with a pitch deck that’s nothing short of spectacular! This high-impact template is designed to captivate, engage, and persuade your stakeholders with every slide. It’s more than just a presentation; it’s your gateway to showcasing your company’s unique value proposition, innovative solutions, and future growth potential in a way that’s visually stunning and incredibly compelling. From the moment you unveil your company overview to the final slide on financials and funding requirements, this template ensures your pitch is memorable, powerful, and impossible to ignore. The sleek, modern design highlights your strategic vision, competitive advantages, and market opportunities, making a bold statement that you’re ready to lead the future. Compatible with PowerPoint, Keynote, and Google Slides, this pitch deck template is your ultimate tool for turning heads and securing buy-in from investors, partners, and clients alike!


7 slides
Empathy Map Marketing Infographics
Gain deeper customer insights with our Empathy Map Marketing Infographic, ideal for marketing teams, product developers, and customer experience strategists. This infographic is a visual tool designed to help you understand your customers' experiences and perspectives. Our Empathy Map Marketing Infographic outlines a clear framework to map out what customers say, think, do, and feel. It's crafted to assist teams in building a customer-centric approach by examining various aspects of the customer journey. With sections dedicated to customer thoughts, emotions, actions, and pain points, you can tailor your marketing strategies to better address customer needs and enhance engagement. This SEO-optimized infographic ensures your marketing plans resonate with your target audience. Implement our infographic in your marketing workshops to foster an empathetic understanding of your customers, driving more personalized and effective marketing campaigns.


22 slides
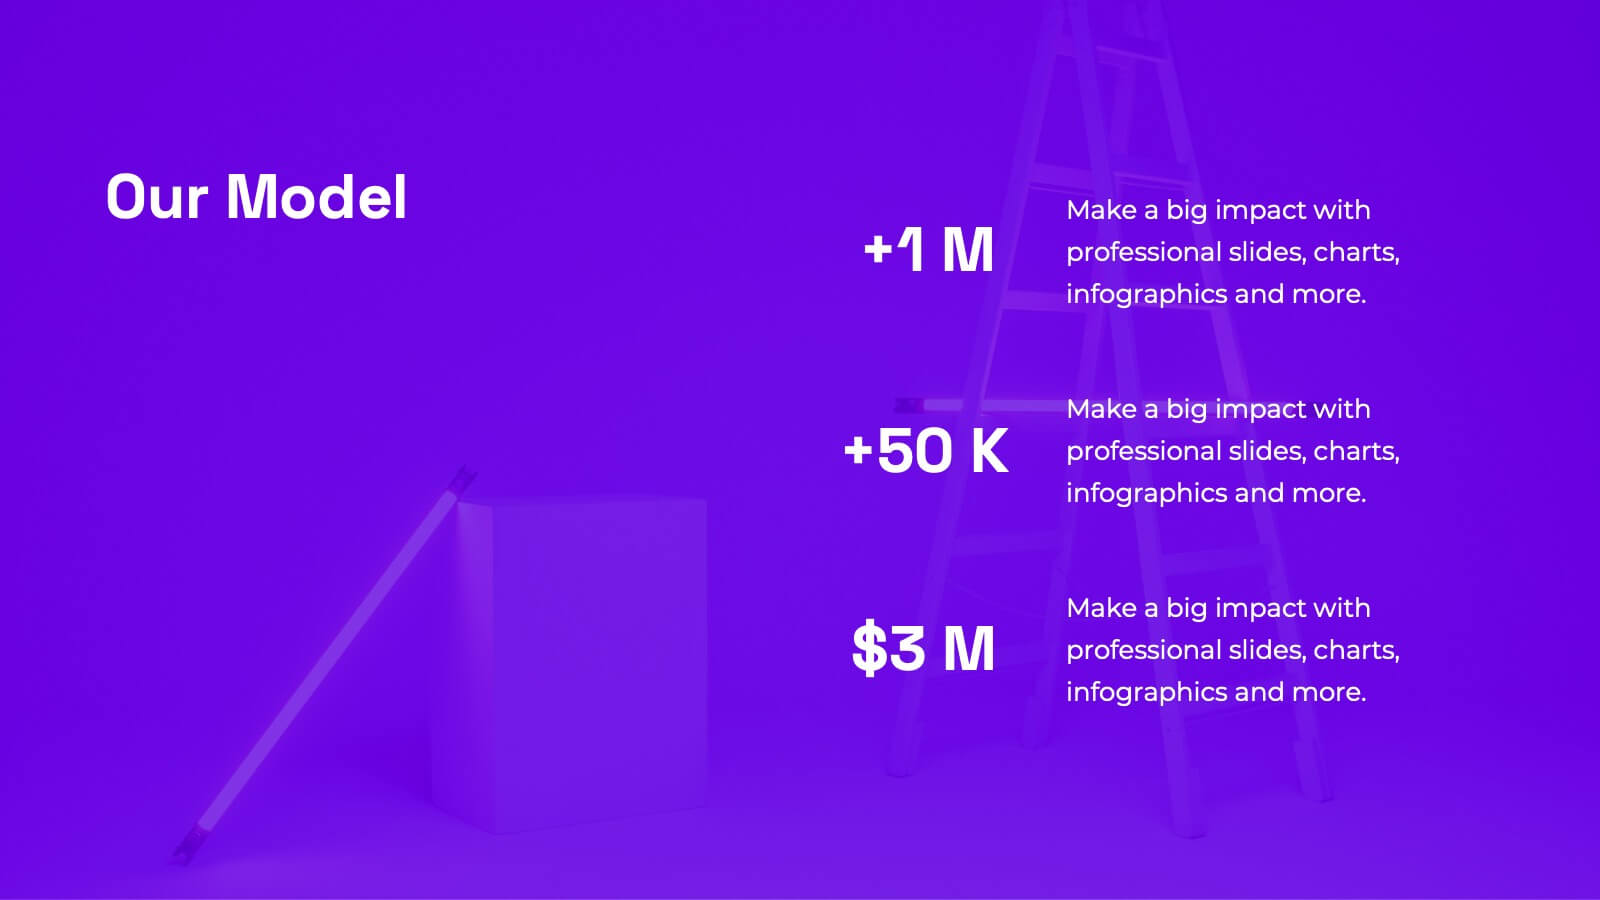
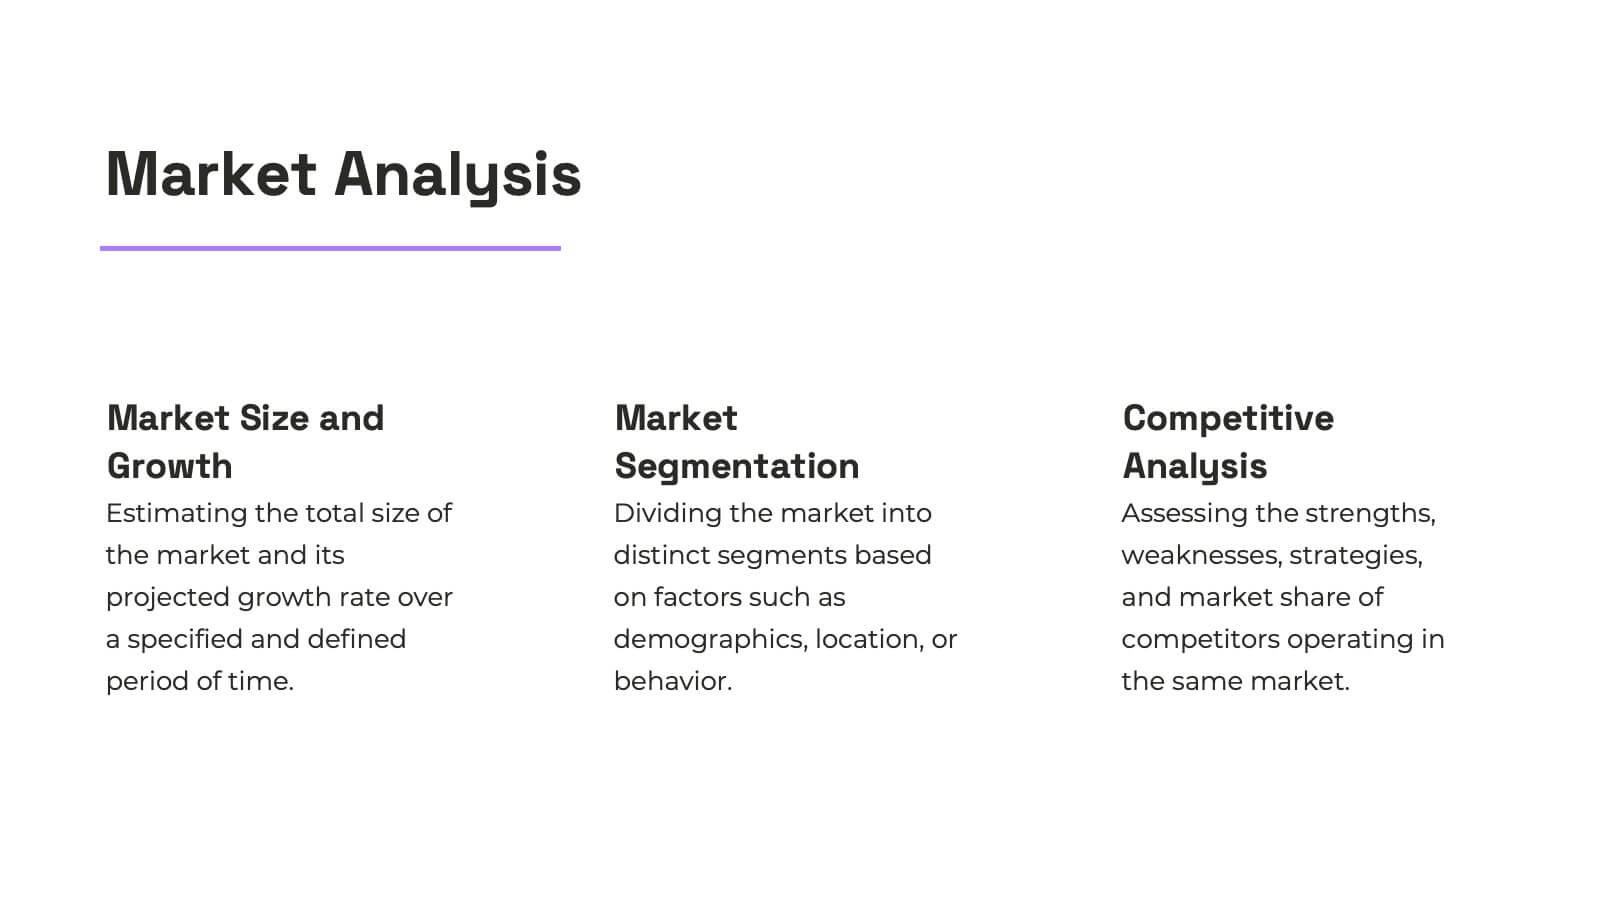
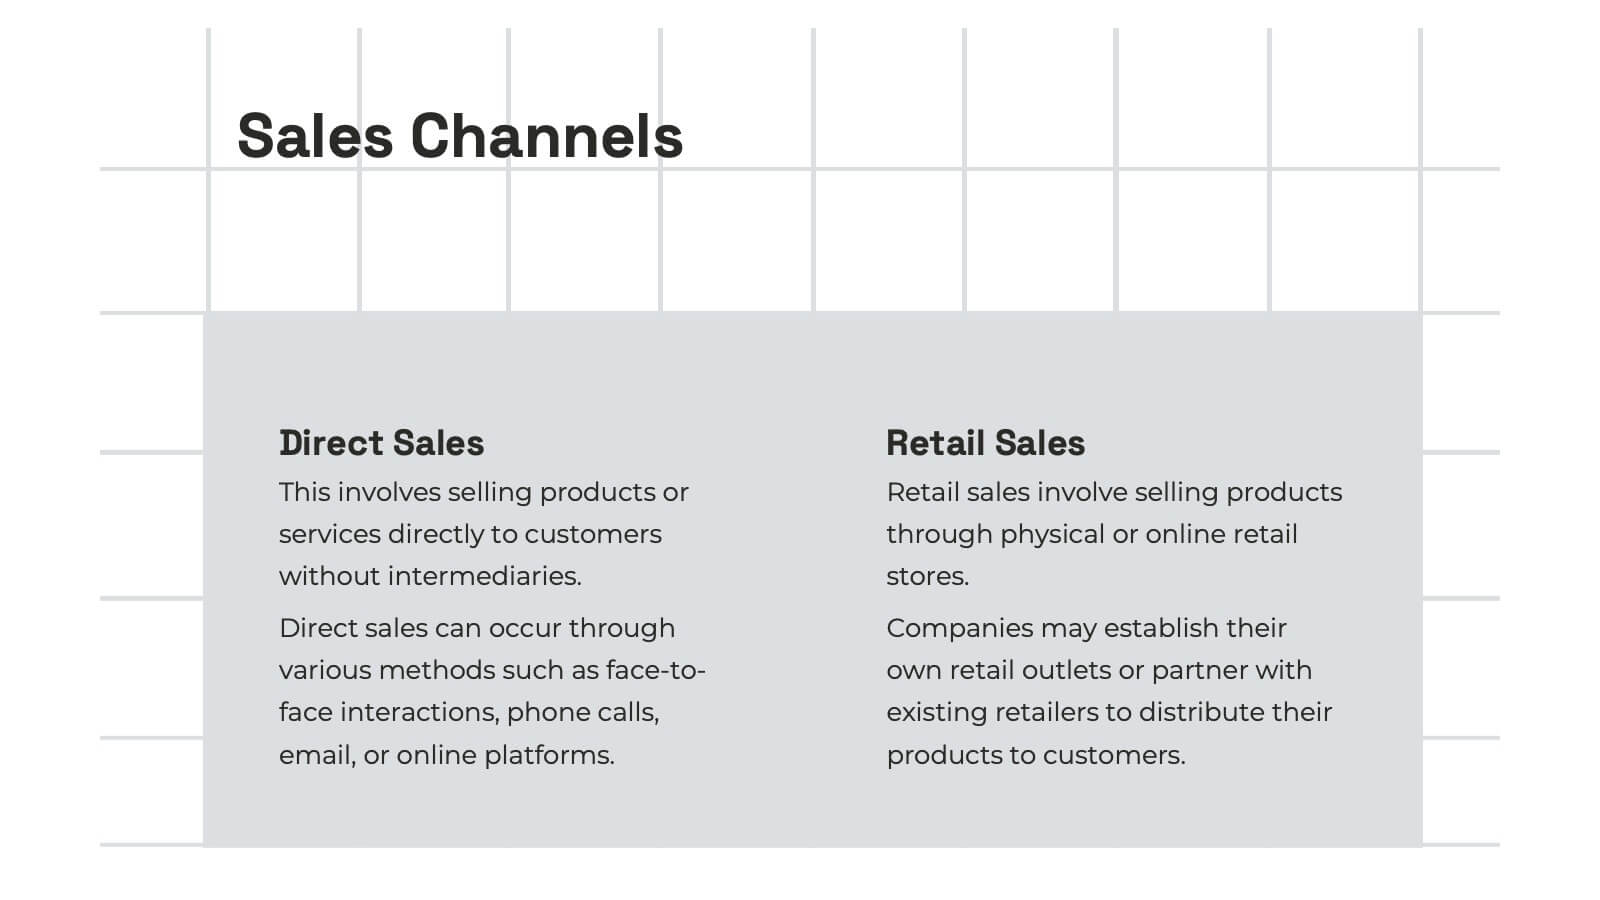
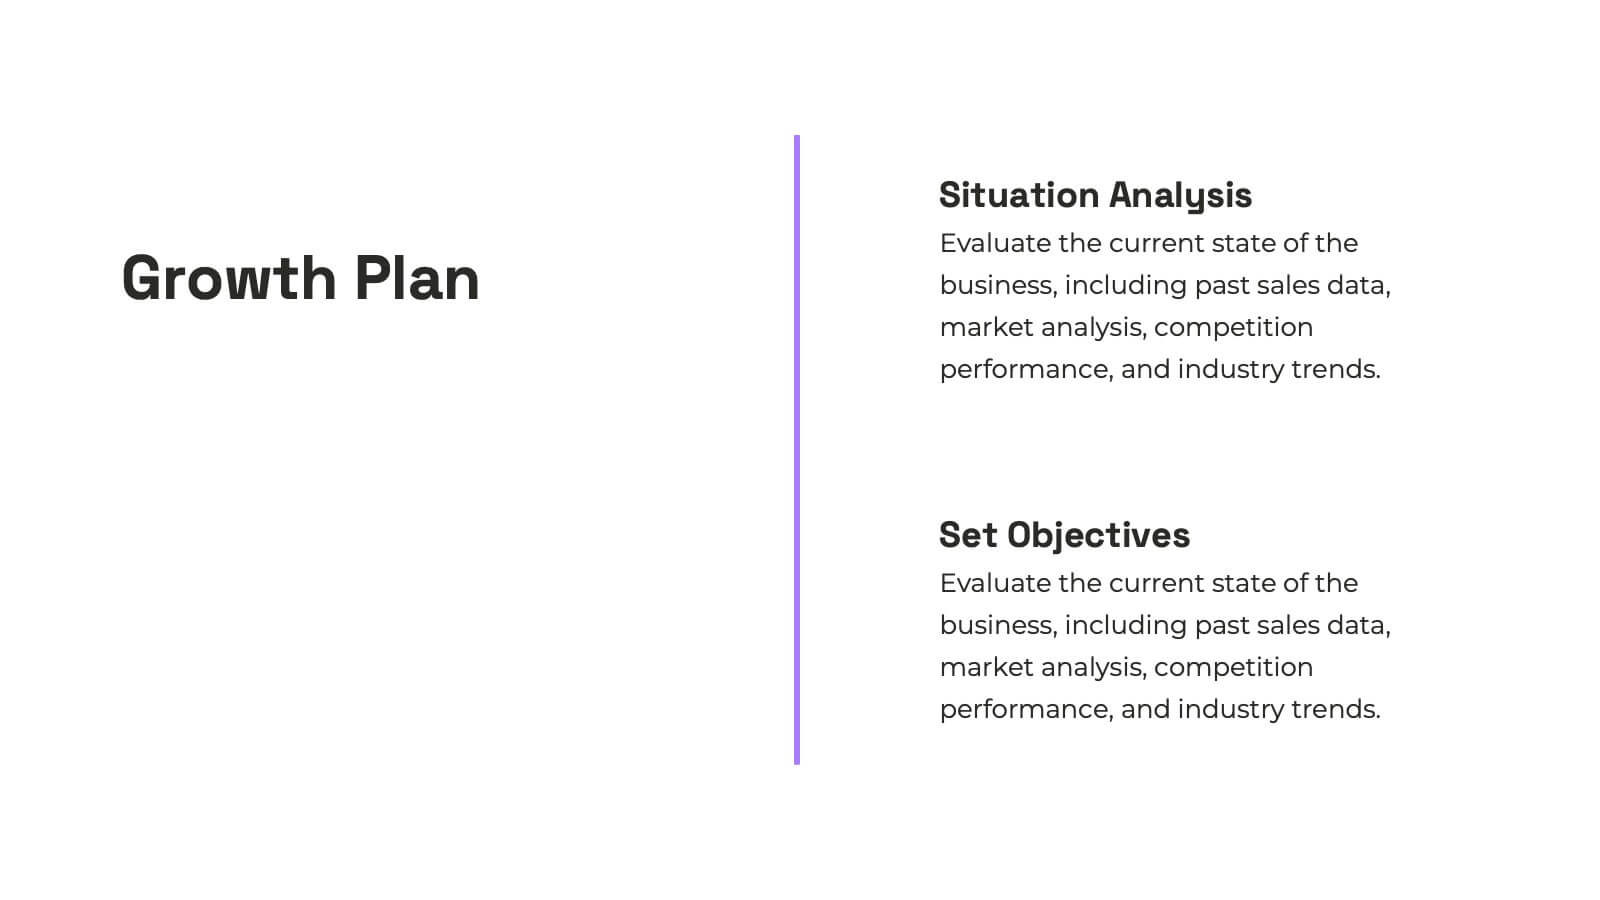
Nexus Startup Growth Plan Presentation
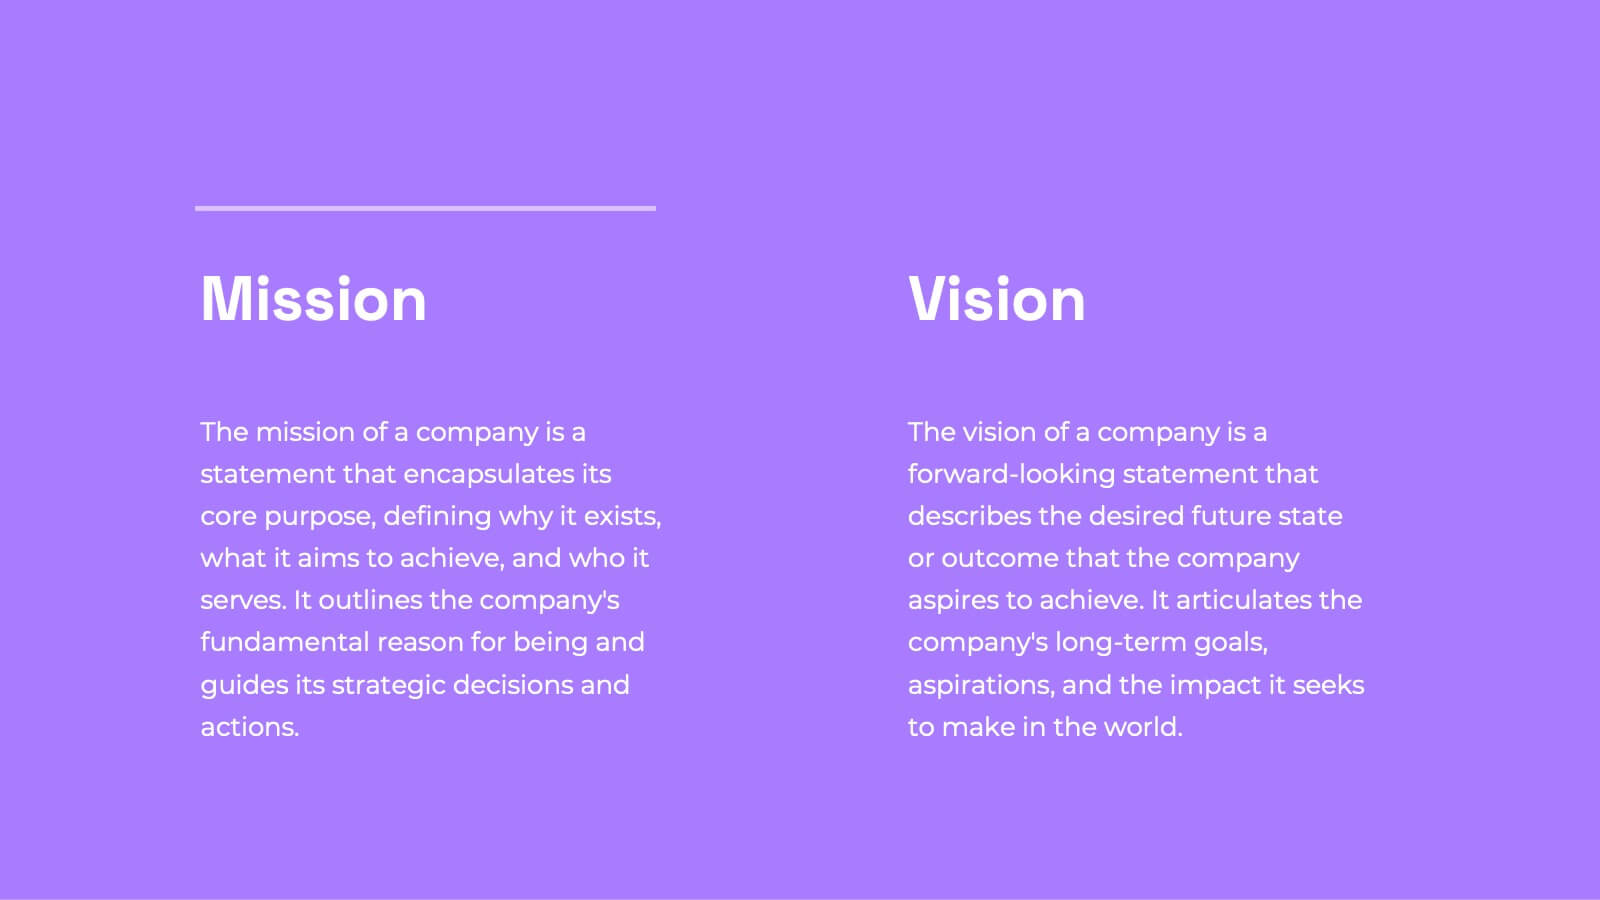
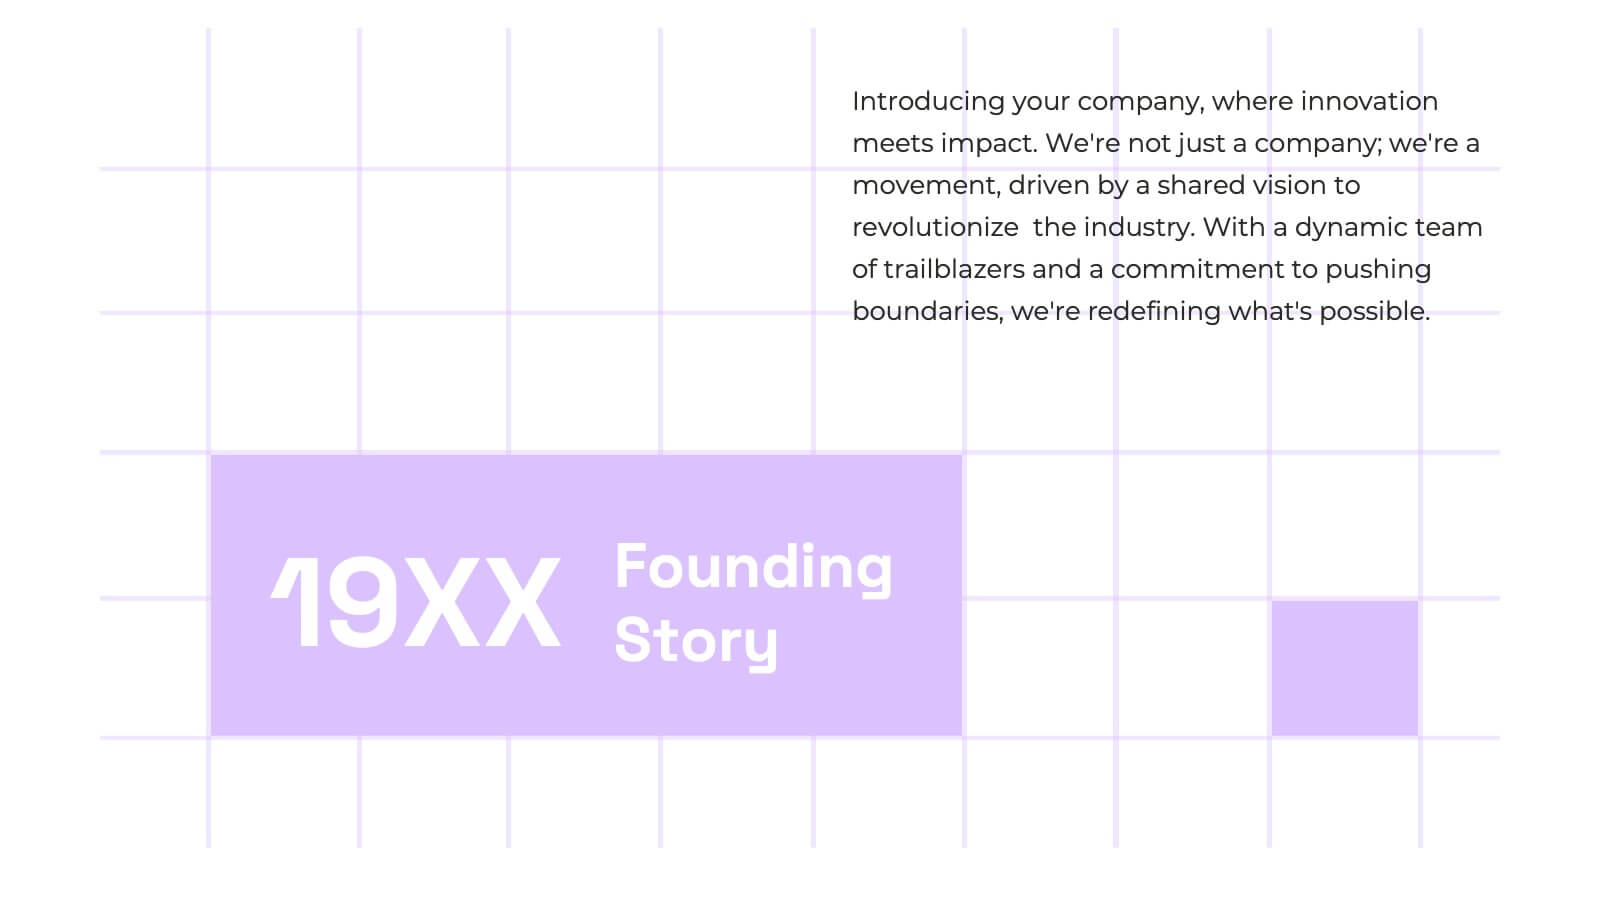
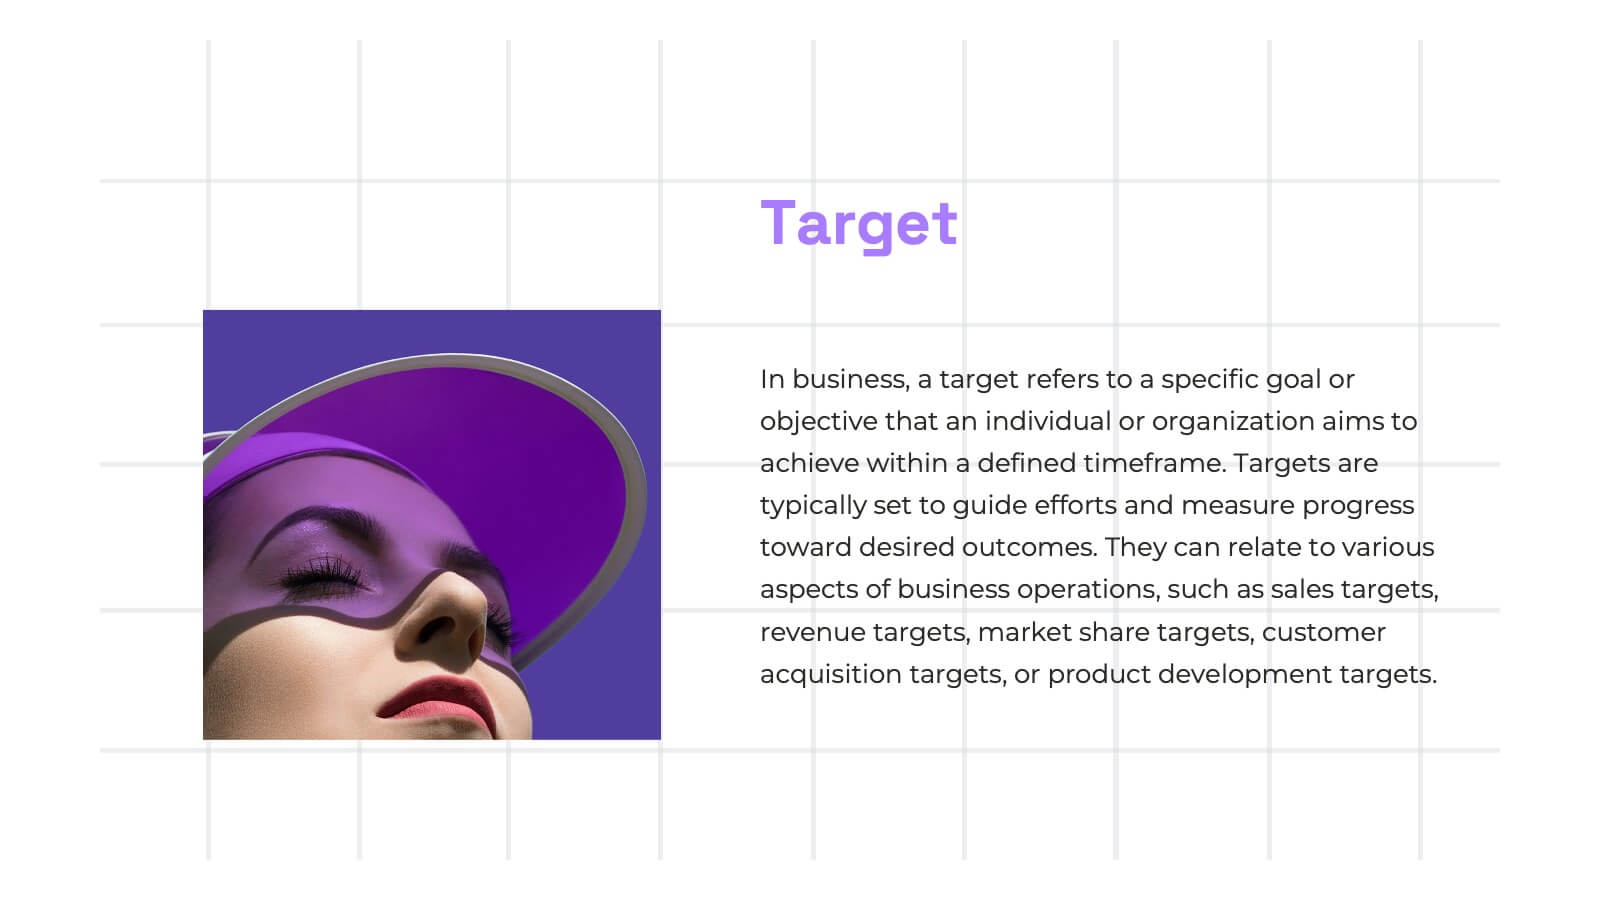
Jumpstart your business journey with this dynamic presentation template! Ideal for outlining your startup growth plan, it covers mission, vision, market analysis, and financial projections with sleek, professional slides. Capture investor interest and articulate your strategy effortlessly. Compatible with PowerPoint, Keynote, and Google Slides, ensuring seamless presentation across all platforms.


6 slides
Health Insurance Infographic
Health insurance is a type of insurance coverage that helps individuals and families manage the costs of medical expenses. This informative infographic template provides an overview of health insurance and its key aspects. This template is designed to help individuals, employers, and healthcare professionals understand the importance of health insurance and make informed decisions regarding coverage options. This template presents essential information in a visually engaging and easy-to-understand format, helping individuals and employers navigate the complex world of health insurance.


6 slides
Executive Summary Research Infographics
Efficiently convey key research findings with our Executive Summary Research infographic template. This template is fully compatible with popular presentation software like PowerPoint, Keynote, and Google Slides, allowing you to effortlessly customize it to encapsulate essential research insights. The Executive Summary Research infographic template serves as a concise and visually engaging platform for summarizing research objectives, methodologies, and critical findings. Whether you're a researcher, project manager, or involved in data analysis, this template provides a user-friendly canvas to create compelling executive summaries for your research projects. Optimize your research communication with this SEO-optimized Executive Summary Research infographic template, thoughtfully designed for clarity and ease of use. Customize it to highlight key data points, conclusions, and recommendations, ensuring your audience grasps the essence of your research quickly and effectively. Start crafting your personalized infographic today to make your research stand out.


6 slides
Break Even Analysis Rate Infographics
Analyze your business's break-even point effectively with our Break-Even Analysis Rate infographic template. This template is fully compatible with popular presentation software like PowerPoint, Keynote, and Google Slides, allowing you to easily customize it to illustrate and communicate critical break-even analysis concepts. The Break-Even Analysis Rate infographic template offers a visually engaging platform to calculate and display the point at which your business covers all its costs and begins to generate a profit. Whether you're an entrepreneur, financial analyst, or business owner, this template provides a user-friendly canvas to create informative presentations and reports on your break-even analysis. Optimize your financial decision-making with this SEO-optimized Break-Even Analysis Rate infographic template, thoughtfully designed for clarity and ease of use. Customize it to showcase your break-even calculations, assumptions, and scenarios, helping you make informed decisions about pricing, costs, and profitability. Start crafting your personalized infographic today to enhance your break-even analysis skills and strategies.


8 slides
Business Challenge & Solution Presentation
Address complex issues with clarity using this business challenges and solutions presentation. Featuring a chess knight visual, it helps outline problems and corresponding strategies. Ideal for strategic planning, risk management, and executive briefings. Fully customizable in PowerPoint, Keynote, and Google Slides to fit your corporate or consulting presentation needs.


6 slides
Professional Title Infographic
This collection of professional presentation templates is meticulously designed to meet a variety of business needs, blending visual appeal with practical functionality. The templates are versatile, allowing professionals to effectively communicate complex data, strategic insights, and operational updates. One template is perfect for detailed data visualization, helping to highlight trends and insights that are crucial for data-driven decision-making. Another template focuses on team introductions, ideal for building a connection between your team and the audience, whether in stakeholder meetings or internal briefings. For marketing strategies, there's a template designed to outline customer demographics and behaviors, which is essential for tailoring marketing campaigns and product development. The collection also includes templates for financial reporting and pricing strategies, ensuring that financial data is communicated clearly and efficiently. Additionally, a strategic analysis template aids in outlining key business strengths, weaknesses, opportunities, and threats, supporting strategic planning and risk management. Overall, these templates are a valuable tool for any professional looking to present information clearly and compellingly in various business contexts.


21 slides
Sonata Product Roadmap Presentation
Navigate the future of your product with a structured and compelling roadmap presentation template. Designed for product managers, entrepreneurs, and teams, this layout provides a clear framework to outline product goals, strategies, and timelines effectively. The template includes sections for product overviews, customer pain points, unique value propositions, competitive analysis, pricing strategies, and user experience mapping. It also features slides for stakeholder communication, marketing rollouts, and technical specifications to ensure every aspect of your product journey is covered. Fully compatible with PowerPoint, Google Slides, and Keynote, this template is easy to customize with your brand’s colors, fonts, and visuals. Present your product's roadmap confidently, engaging stakeholders and aligning your team towards success.


7 slides
Money Value Infographic
The value of money refers to its purchasing power or what it can buy in goods, services, or investments. Creating an infographic about the value of money can help people understand various aspects of finance, investment, and wealth. This template is compatible with Powerpoint, Keynote, and Google Slides. Customize the content, design, and visuals to create an engaging and informative infographic that helps people better understand the value of money and how to manage it wisely. Financial literacy is a valuable skill, and your infographic can empower individuals to make sound financial decisions.


7 slides
Project Management Process Infographic
Navigate the vast arena of project management with our project management infographic. Anchored on a clear white base, the design is adorned with the calm of green, the trustworthiness of blue, and the innovative spirit of purple. Engage with meticulously designed infographics, tailored icons, and flexible image placeholders, providing a comprehensive visual guide to the realms of project planning, execution, and evaluation. Perfectly sculpted for Powerpoint, Keynote, or Google Slides. An invaluable asset for project managers, team leaders, consultants, or anyone in the corporate landscape wanting to visualize and optimize project stages.


7 slides
Construction Site Infographic
Elevate your project presentations with our Construction Site Infographic, an essential tool for construction managers, engineers, and stakeholders. This infographic offers a visual breakdown of the construction process, stages, and key tasks, ensuring a comprehensive understanding of project progression and components. Our Construction Site Infographic is designed to detail various phases such as planning, foundation work, structural development, and finishing touches. It helps in communicating the complexity and sequence of construction activities, making it easier to track milestones and manage resources effectively. With customizable elements, you can represent specific site operations, timelines, and the deployment of labor and materials. This SEO-optimized infographic is crafted to aid in reporting, project tracking, and stakeholder briefings, making it a valuable asset for any construction-related project. Utilize this infographic to provide a clear and structured overview of your construction project, promoting transparency and aiding in the efficient management of your site operations.


8 slides
International Data Visualization Map Presentation
Present global data with clarity using this International Data Visualization Map. Highlight regional performance, market share, or user distribution through clean, infographic-style visuals. Ideal for business reports, global strategy updates, or research findings. Fully editable in PowerPoint, Keynote, and Google Slides—designed for sleek, professional storytelling across international audiences.


4 slides
Progress Indicators with Harvey Visuals Presentation
Track multiple projects at a glance with the Progress Indicators with Harvey Visuals Presentation. This slide design uses Harvey balls and icons to clearly communicate status across key metrics such as schedule, budget, risk, and issues. Ideal for PMOs, stakeholder updates, or cross-functional reviews. Fully editable and compatible with PowerPoint, Keynote, and Google Slides.


5 slides
Project Efficiency with RAPID Matrix Presentation
Clarify project responsibilities with the Project Efficiency with RAPID Matrix Presentation. This visually engaging layout highlights each role in the RAPID framework—Recommend, Agree, Perform, Input, Decide—making team alignment fast and effective. Perfect for decision-making workflows and execution plans. Fully editable in PowerPoint, Google Slides, Keynote, and Canva.


7 slides
Asia Map Infographic Presentation Template
Asia is the largest, most populous, and most culturally diverse continent. Asia constitutes of nearly one-third of Earth's landmass and is lying entirely north of the equator. The continent is home to a variety of cultures, ethnic groups, and religions. This Asian map template includes the different labeled countries, and graphs with statistics. This can be used to show your audience the geographical layout of Asia, or as an example of what a modern, professional presentation should look like. This template is a great resource for students, teachers and people who want to learn more about Asia.