


Features
- 4 Unique slides
- Fully editable and easy to edit in Microsoft Powerpoint, Keynote and Google Slides
- 16:9 widescreen layout
- Clean and professional designs
- Export to JPG, PDF or send by email


Do you have any questions?
Recommend


7 slides
Organizational Change with 7S Framework Presentation
Visualize organizational transformation with the Organizational Change with 7S Framework Presentation. This slide highlights each element of the McKinsey 7S model—Structure, Strategy, Systems, Shared Values, Skills, Style, and Staff—along an S-shaped flow. Ideal for consulting, internal alignment, and strategic planning discussions. Fully editable in Canva, PowerPoint, Keynote, and Google Slides.


4 slides
Artificial Intelligence Use Cases Overview Presentation
Navigate a maze of insights with this creative template designed to showcase real-world tech applications in a visually engaging way. Whether you're covering machine learning in healthcare or automation in customer service, this AI use case infographic keeps your points clear and organized. Works seamlessly in PowerPoint, Keynote, and Google Slides.


4 slides
Cost Breakdown Table Presentation
Make your numbers speak with style using a clean, structured layout that simplifies pricing and cost analysis. This presentation is perfect for comparing plans, budgets, or expenses in a clear and visually engaging way. Fully editable and compatible with PowerPoint, Keynote, and Google Slides.


5 slides
Body System Overview Presentation
Visually explain key human body systems with this clean and modern slide. Each section highlights a different organ with labeled points (A–D) for easy reference. Ideal for health education, medical briefings, or anatomy lessons. Fully editable in PowerPoint, Keynote, or Google Slides to suit any professional or academic need.


8 slides
International Data Visualization Map Presentation
Present global data with clarity using this International Data Visualization Map. Highlight regional performance, market share, or user distribution through clean, infographic-style visuals. Ideal for business reports, global strategy updates, or research findings. Fully editable in PowerPoint, Keynote, and Google Slides—designed for sleek, professional storytelling across international audiences.


21 slides
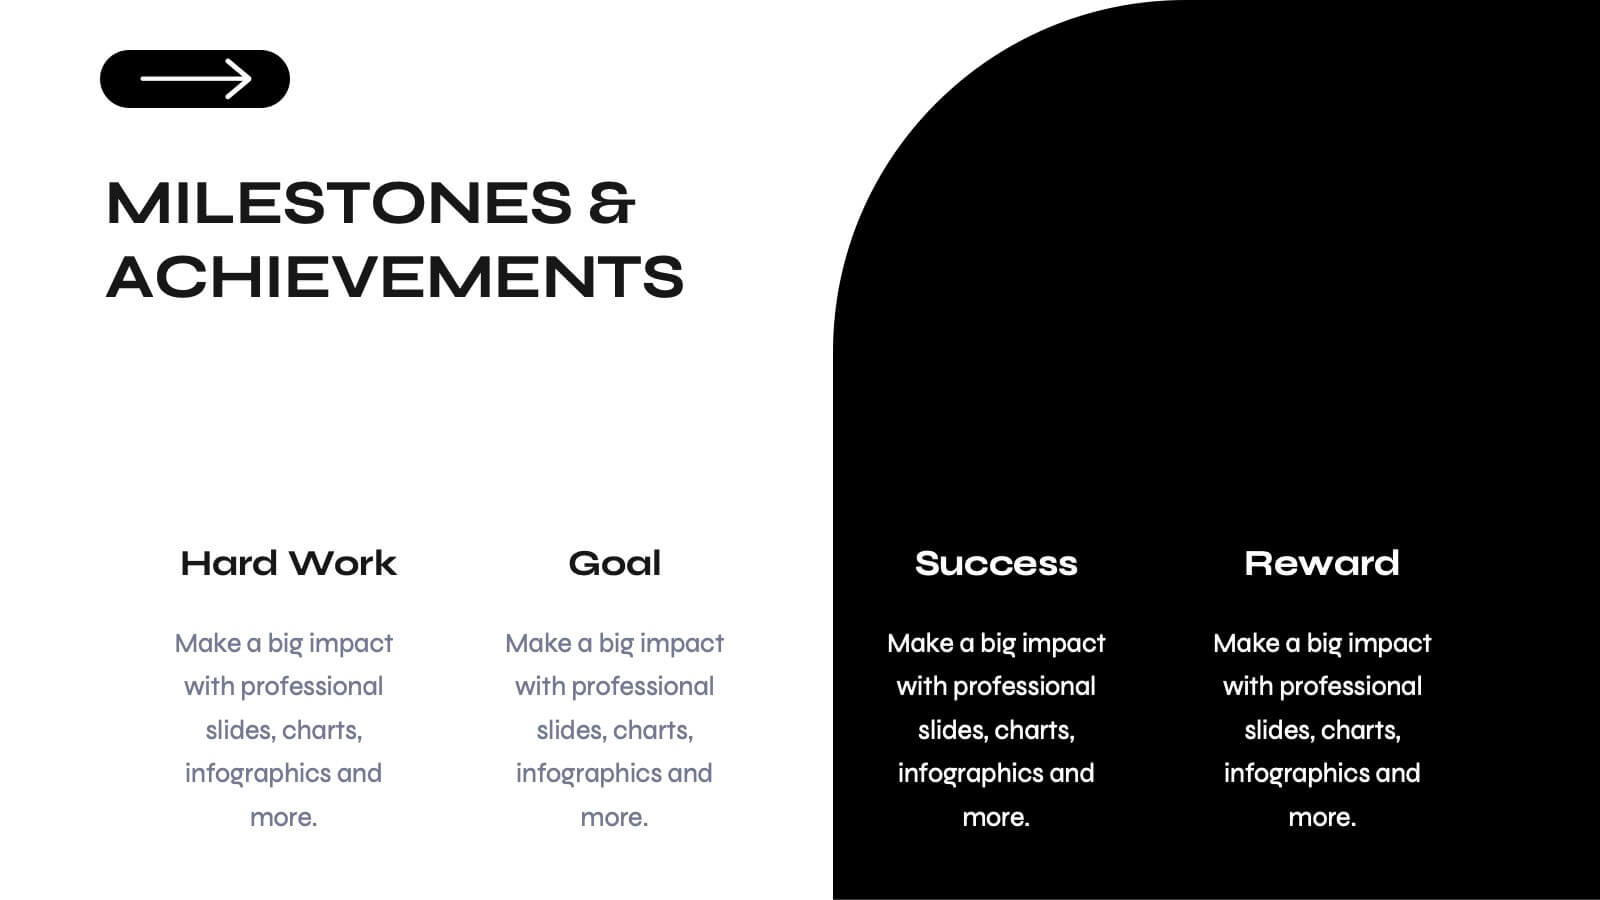
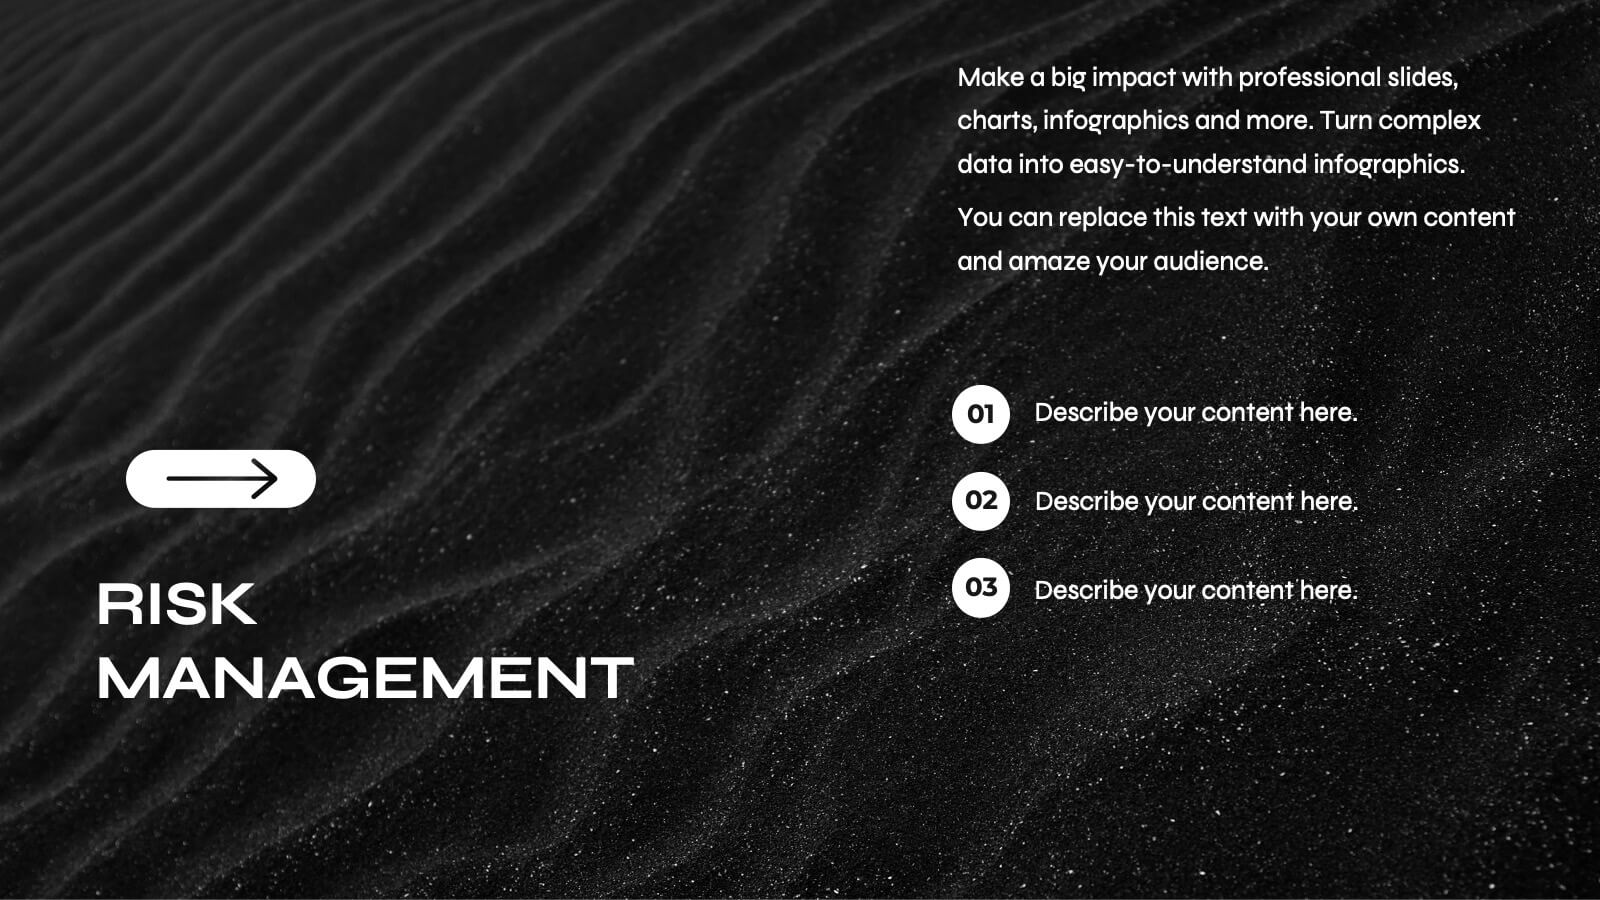
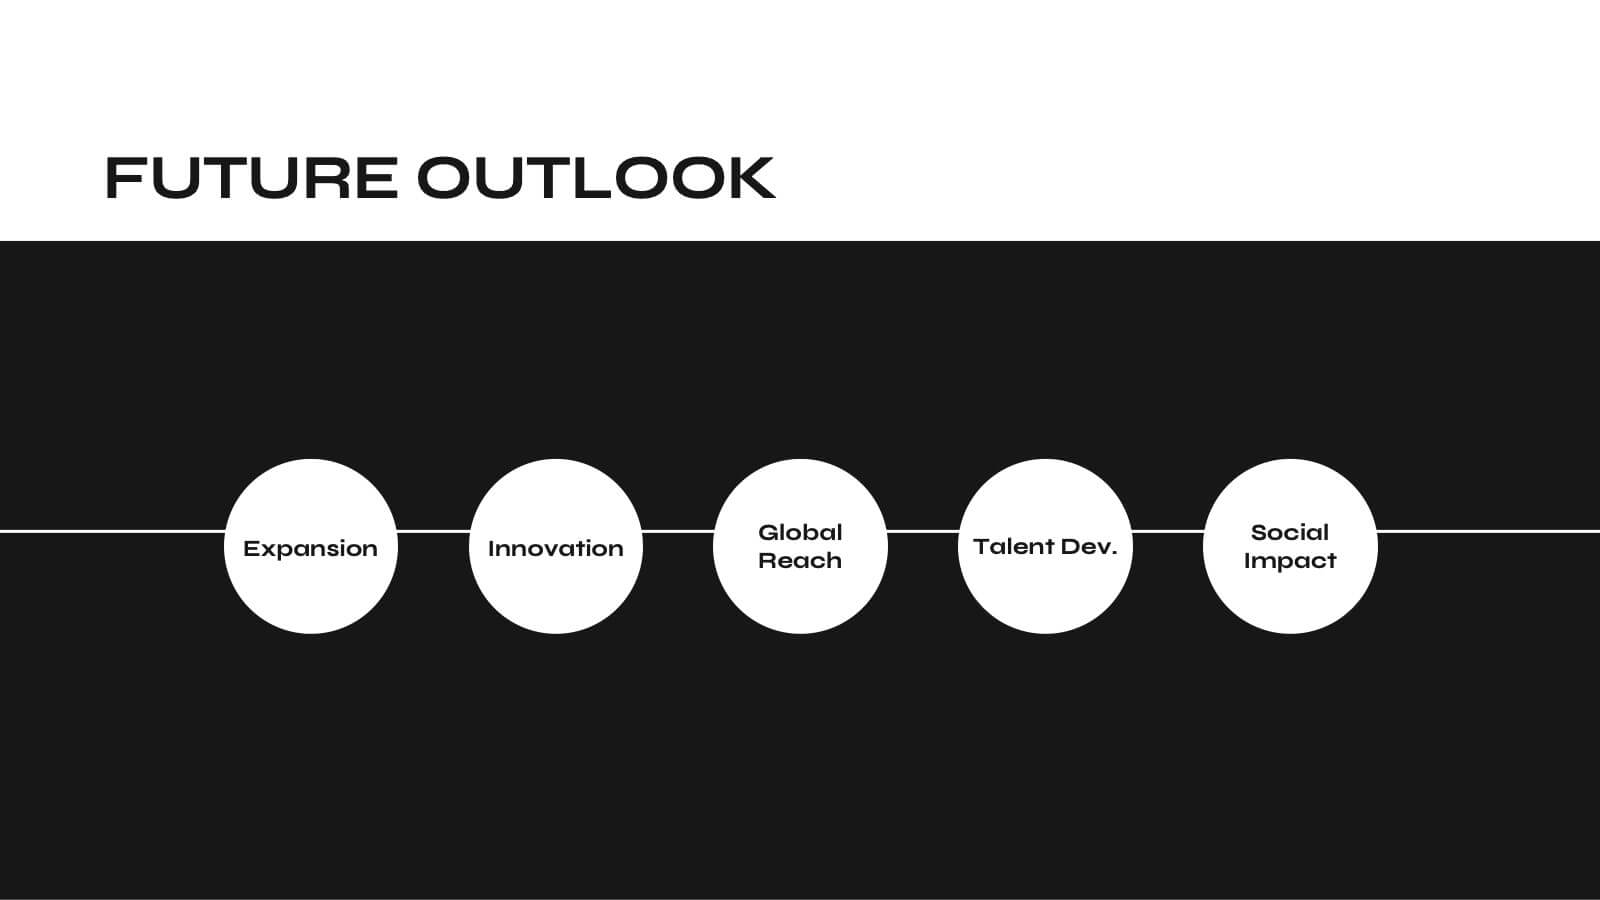
Fablelight Digital Agency Strategy Plan Presentation
This sleek and modern presentation template is designed to effectively communicate a strategic plan for any professional agency. It includes sections for mission and vision, team structure, services offered, and a detailed creative process. Dive into market analysis, industry trends, and case studies to showcase expertise and success stories. Strategy development, campaign execution, and measurement analytics are highlighted to demonstrate goal-oriented planning. Client testimonials, partnerships, social impact initiatives, and awards provide credibility and enhance trust. Fully customizable and compatible with PowerPoint, Keynote, and Google Slides.


7 slides
Idea Clustering Mind Map Presentation
Great ideas become clearer when you can see how everything connects, and this presentation makes that process effortless. It helps you organize thoughts, group related concepts, and visually map creative themes for planning or strategy discussions. Clean, modern, and easy to customize. Fully compatible with PowerPoint, Keynote, and Google Slides.


5 slides
Elegant Abstract Watercolor Layout Presentation
Add artistic flair to your message with the Elegant Abstract Watercolor Layout Presentation. Featuring hand-drawn brush elements and delicate color drops, this design blends creativity with clarity. Ideal for storytelling, brand values, or conceptual visuals. Fully editable in PowerPoint, Keynote, and Google Slides for stylish and customizable presentations.


23 slides
Odyssey Small Business Pitch Deck Presentation
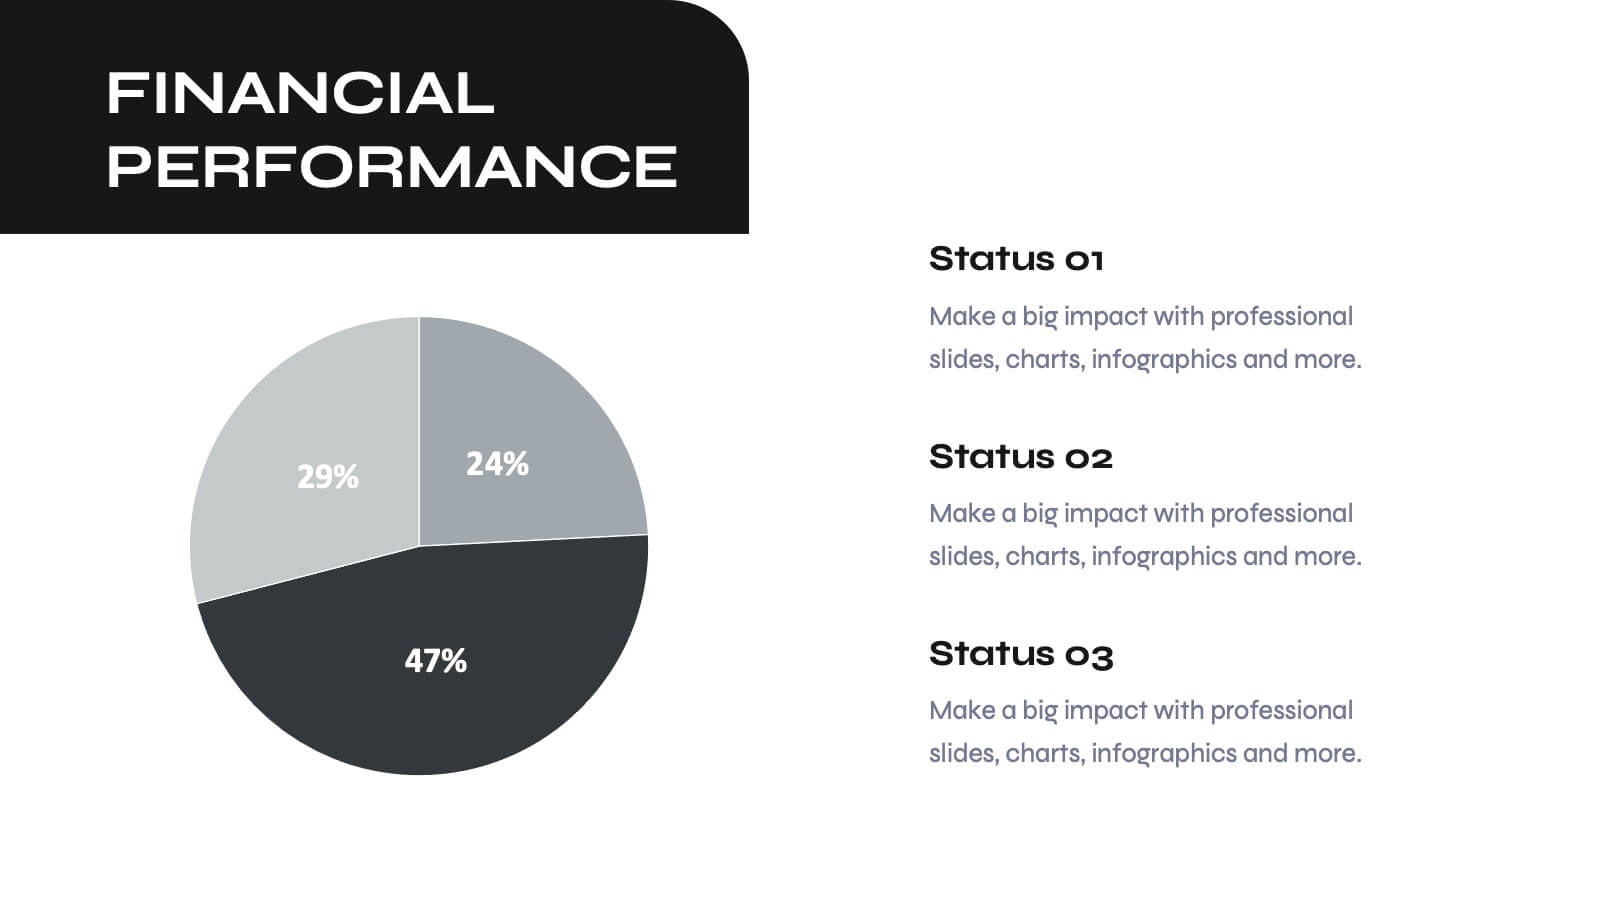
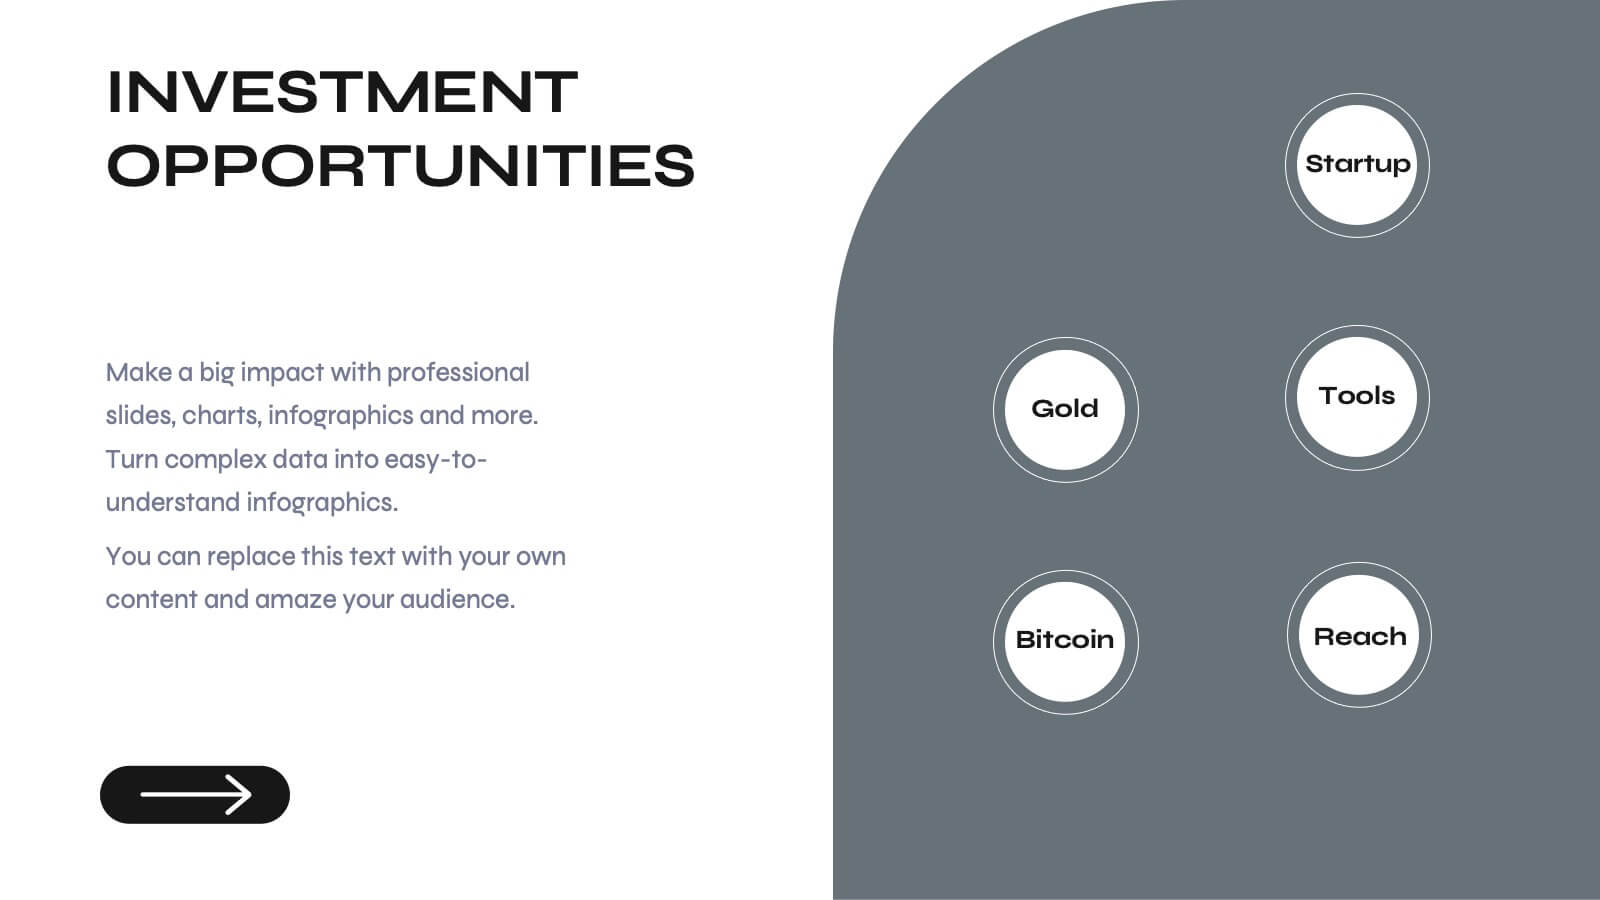
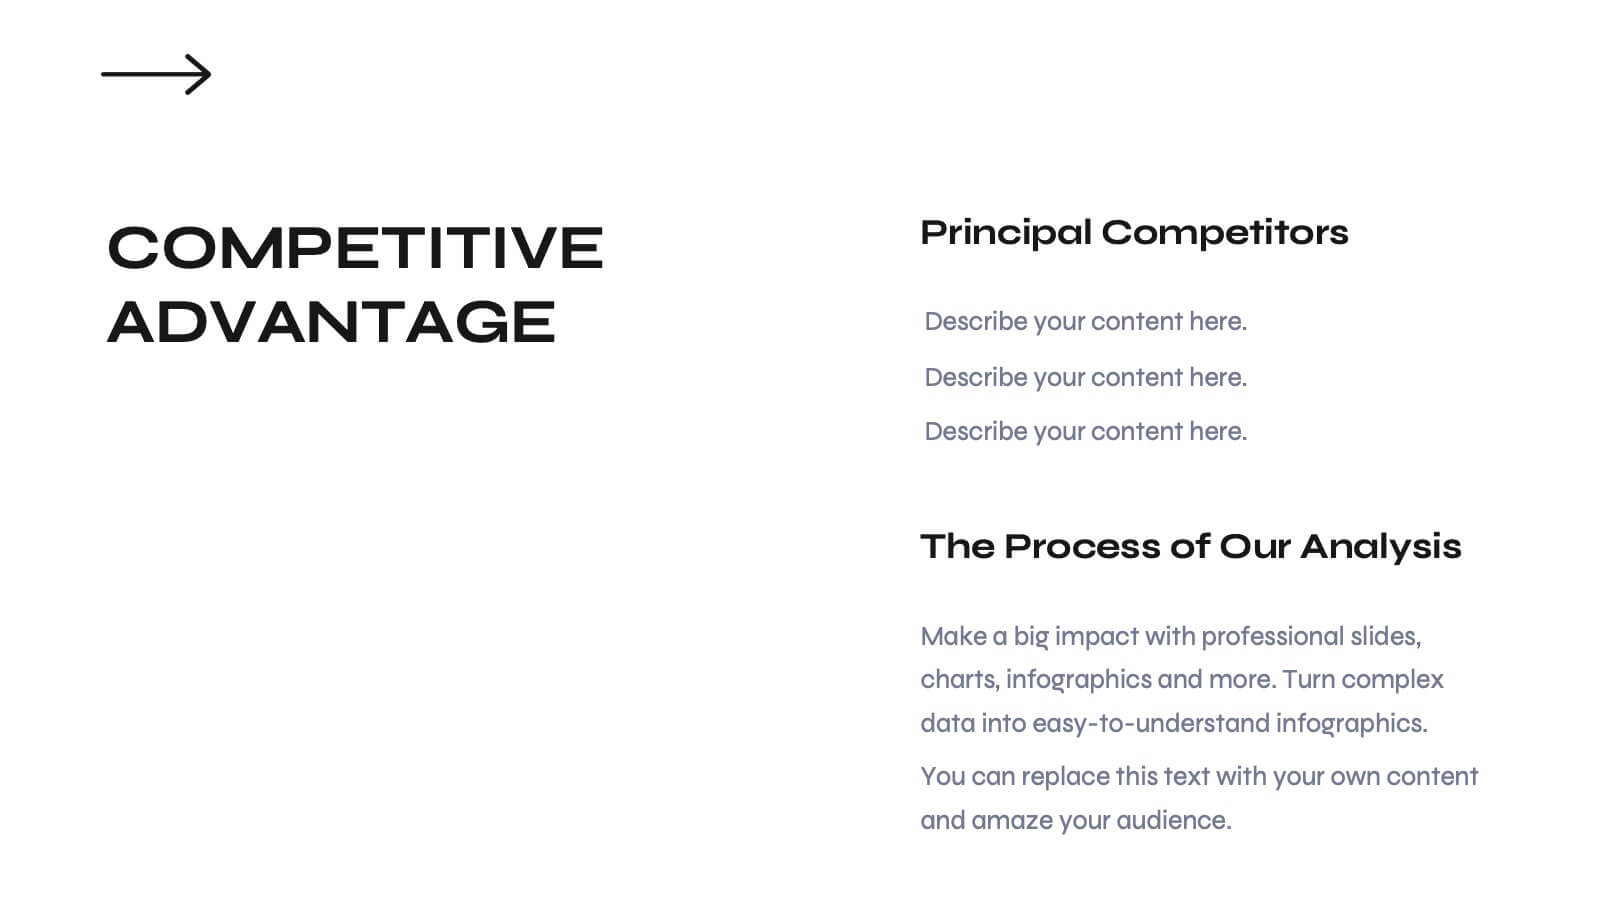
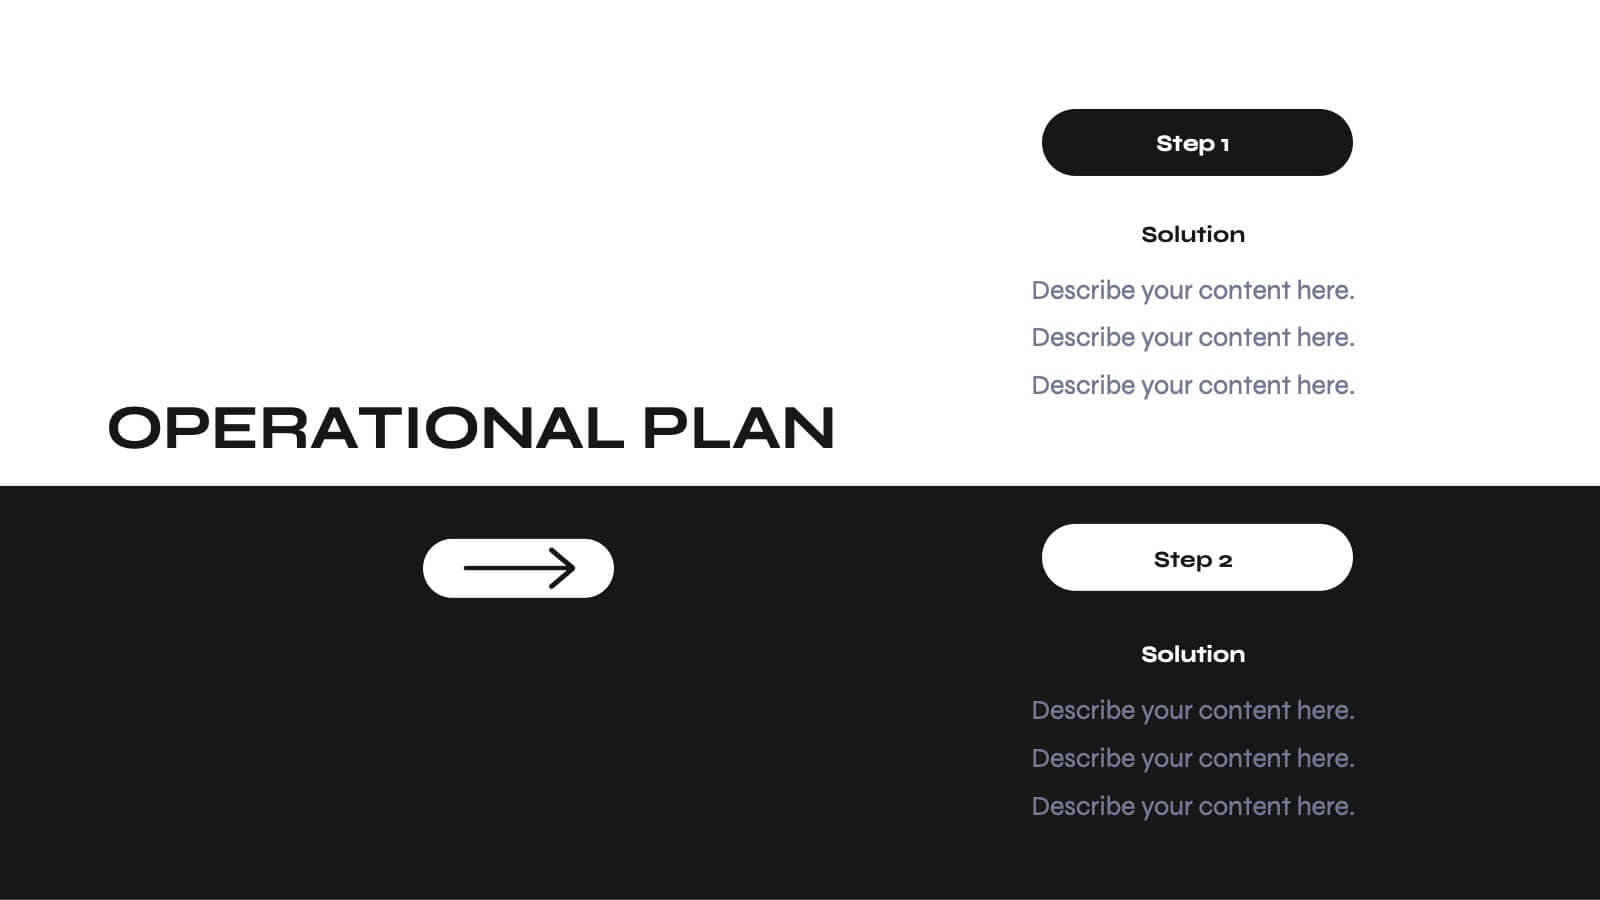
Elevate your business pitch with this sleek, monochrome presentation template. Perfect for presenting company backgrounds, market opportunities, and financial performance, it features a minimalist design that enhances clarity and impact. Highlight your value proposition and strategic plans to captivate investors. Compatible with PowerPoint, Keynote, and Google Slides, it ensures seamless presentations on any platform.


4 slides
Income and Expense Highlights Presentation
Enhance learning with the Interactive Digital Learning Experience Presentation. This template mimics a multiple-choice format, making it perfect for quizzes, training modules, or eLearning content. Each slide includes labeled options (A–D) alongside a modern vertical interface, ideal for engaging assessments or lesson recaps. Fully editable in Canva, PowerPoint, Keynote, and Google Slides.


13 slides
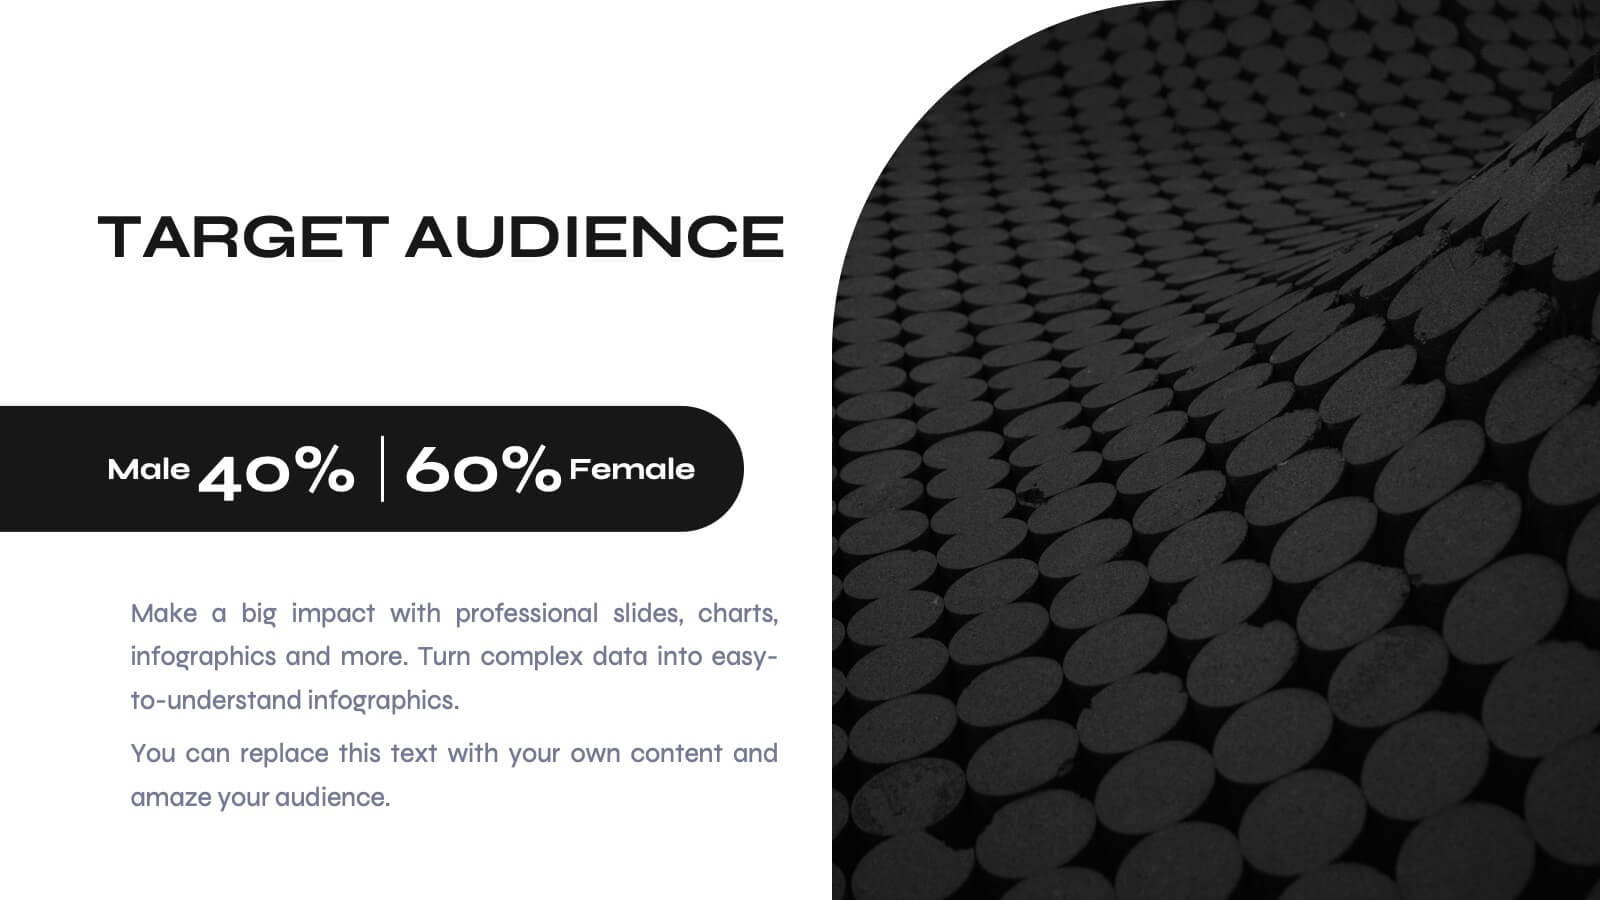
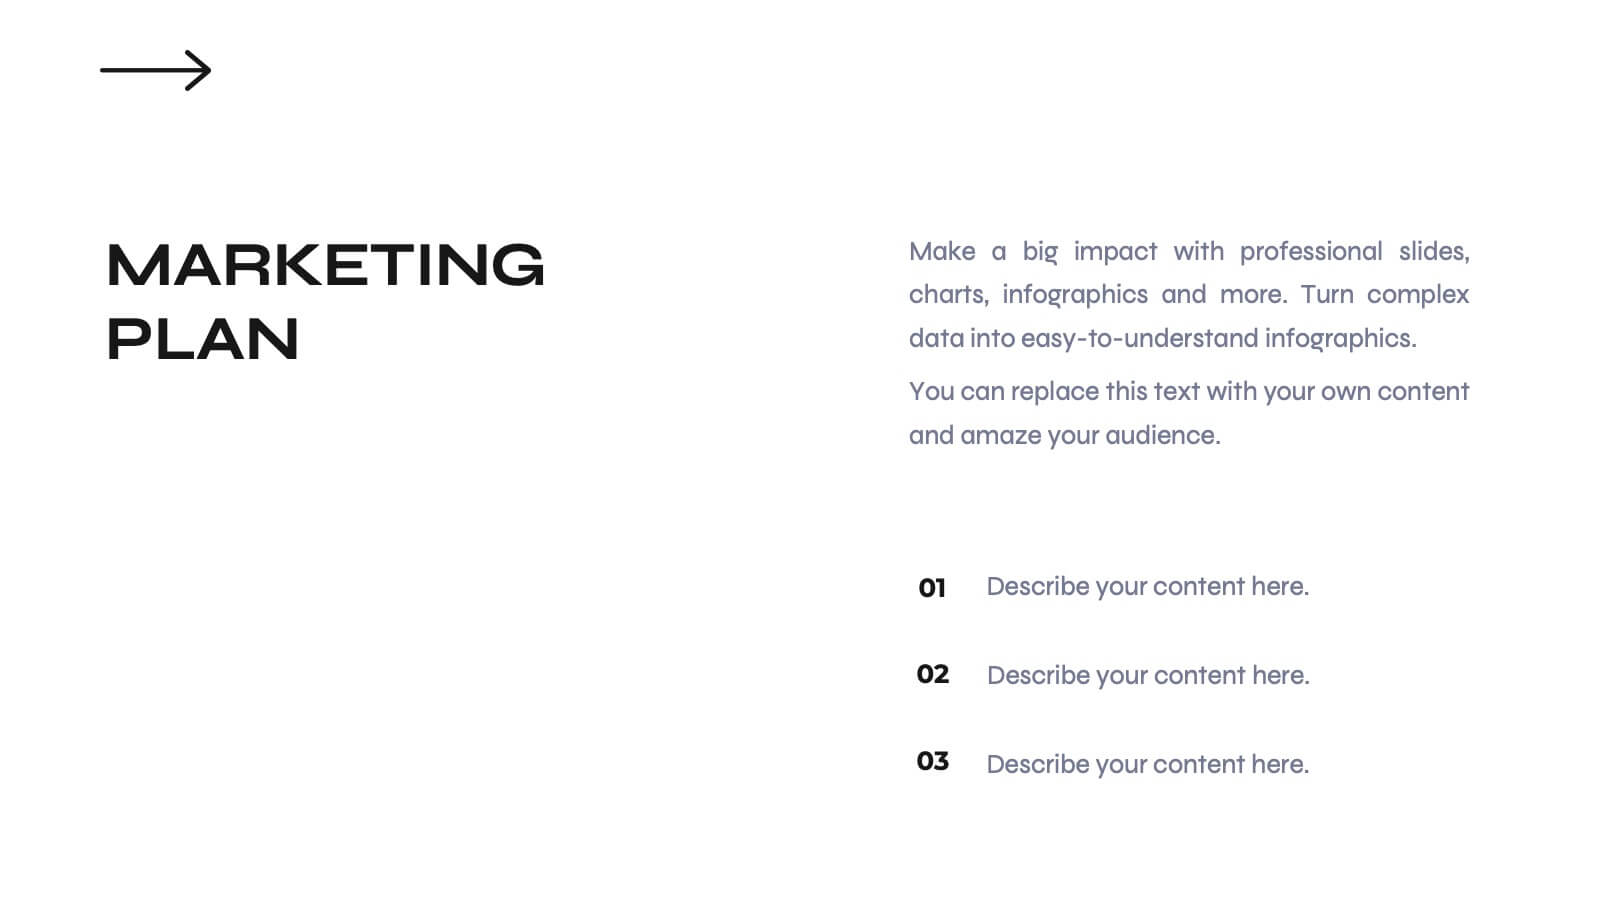
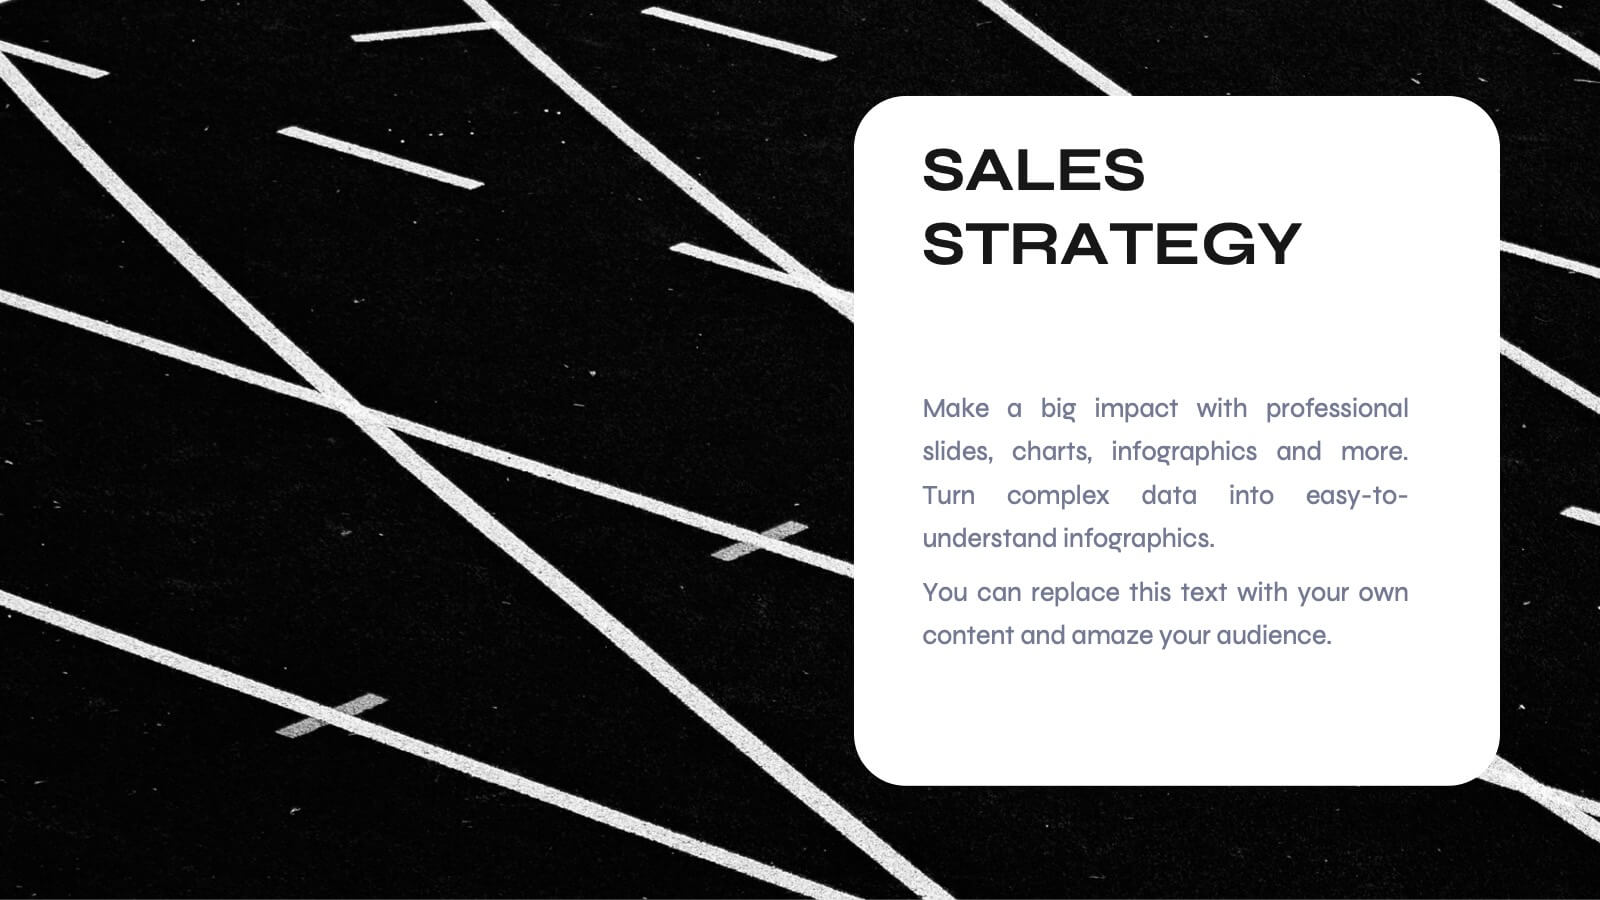
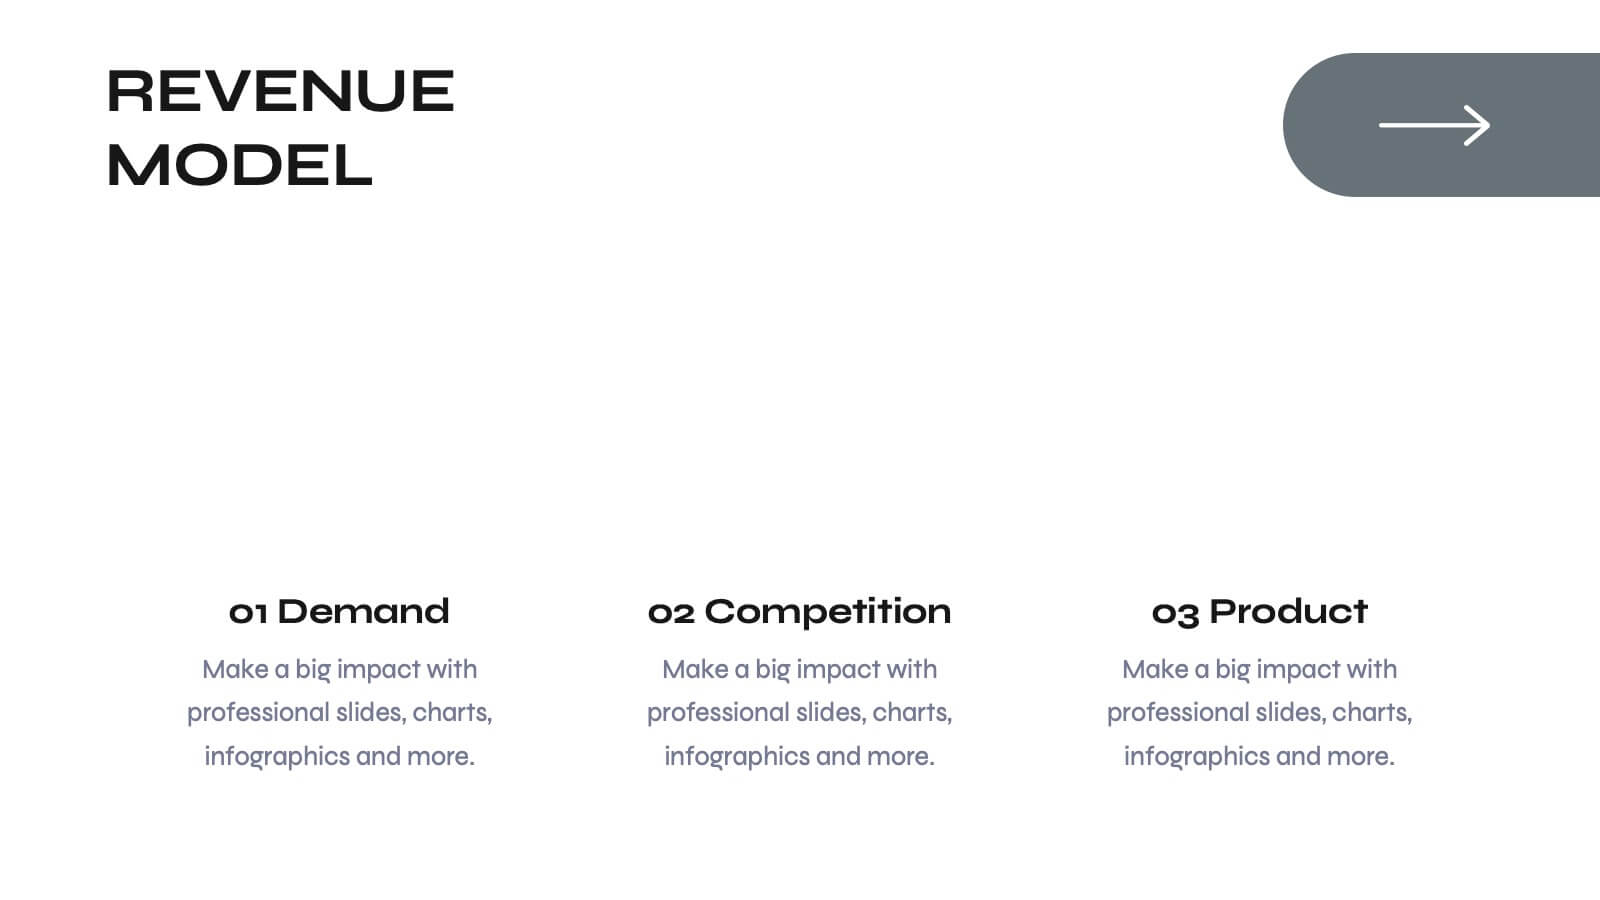
Market Segmentation and Consumer Demographics Presentation
Visualize your audience breakdown with this clean, data-driven demographic infographic slide. Featuring customizable male and female icons, percentage metrics, and bar charts for segment analysis, this layout is perfect for showcasing consumer insights, behavior patterns, and target group comparisons. Ideal for marketing reports, business plans, and audience research decks. Fully editable in PowerPoint, Keynote, and Google Slides.


4 slides
Competitive Strategy Framework Presentation
Visualize your market position with this competitive strategy framework. Featuring a 2x2 matrix layout, this template is ideal for analyzing key strategic areas. Use the chess-themed icons and editable labels to highlight strengths, risks, and opportunities. Fully customizable in PowerPoint, Keynote, or Google Slides for strategic planning or business analysis.


4 slides
Strategic Risk Assessment and Control Presentation
Highlight layered risk priorities with the Strategic Risk Assessment and Control Presentation. This visual template uses a 3D concentric model (D to A) to illustrate escalating risk levels or control measures. Ideal for risk managers and compliance teams. Fully editable in PowerPoint, Google Slides, and Canva for seamless customization.


7 slides
Flow Chart Infographic Presentation Template
A Flow Chart Infographic uses shapes and lines to show the flow of information, steps in a process, or the relationship between different ideas. Flow Charts are often used in business, education, and technology to show the steps in a process, decision-making flow, or to illustrate the relationship between different pieces of information. This template is perfect for showing how things work or how to do something step by step. This flowchart infographic includes a variety of different charts and description boxes that you can customize with your information to make it work for you.


5 slides
Cloud Security and Data Storage Presentation
Visually explain your cloud architecture and data protection strategy with this sleek horizontal diagram. Each layered icon represents different aspects of storage, access, and security control—perfect for IT audits, cloud infrastructure briefs, and risk management reports. Fully editable in PowerPoint, Keynote, and Google Slides.


8 slides
Alphabet List Infographics
Discover the power of alphabet lists, a versatile tool for structured information presentation. This infographic is your guide to understanding alphabet lists, from the basics to the benefits of alphabetical order. Master the art of creating organized and readable content. Learn why arranging information alphabetically is advantageous. Explore its logical sequence that simplifies referencing and comprehension. Unlock the potential of alphabetical order in various contexts, improving content organization for easy access and digestion. Master the use of alphabet lists to boost content readability. Discover techniques such as subheadings and concise descriptions. With this infographic, compatible with PowerPoint, Keynote, and Google Slides, sharing your knowledge of alphabet lists is effortless. Dive into the world of alphabet lists and improve your communication and content organization skills.


7 slides
KPI Sales Dashboard Infographic
A KPI (Key Performance Indicator) Dashboard is a visual tool or interface that provides a real-time snapshot of an organization's or a specific department's key performance indicators. Empower your sales team with our KPI sales dashboard infographic template. This visually striking and insightful template allows you to present key performance indicators and metrics in an easily understandable and engaging format. Compatible with Powerpoint, Keynote, and Google Slides. This template will transform your sales data into a dynamic, easy-to-understand dashboard, helping your team stay informed, motivated, and focused on achieving sales targets.