


Features
- 5 Unique slides
- Fully editable and easy to edit in Microsoft Powerpoint, Keynote and Google Slides
- 16:9 widescreen layout
- Clean and professional designs
- Export to JPG, PDF or send by email


Do you have any questions?
Recommend


5 slides
Organizational Change Management Plan Presentation
Lead transformation with confidence using this layered pyramid visual designed for change management plans. Each tier clearly outlines steps, roles, or phases within your organizational shift—perfect for guiding teams through the process. Ideal for strategic presentations, leadership briefings, and operational planning. Fully compatible with PowerPoint, Keynote, and Google Slides.


7 slides
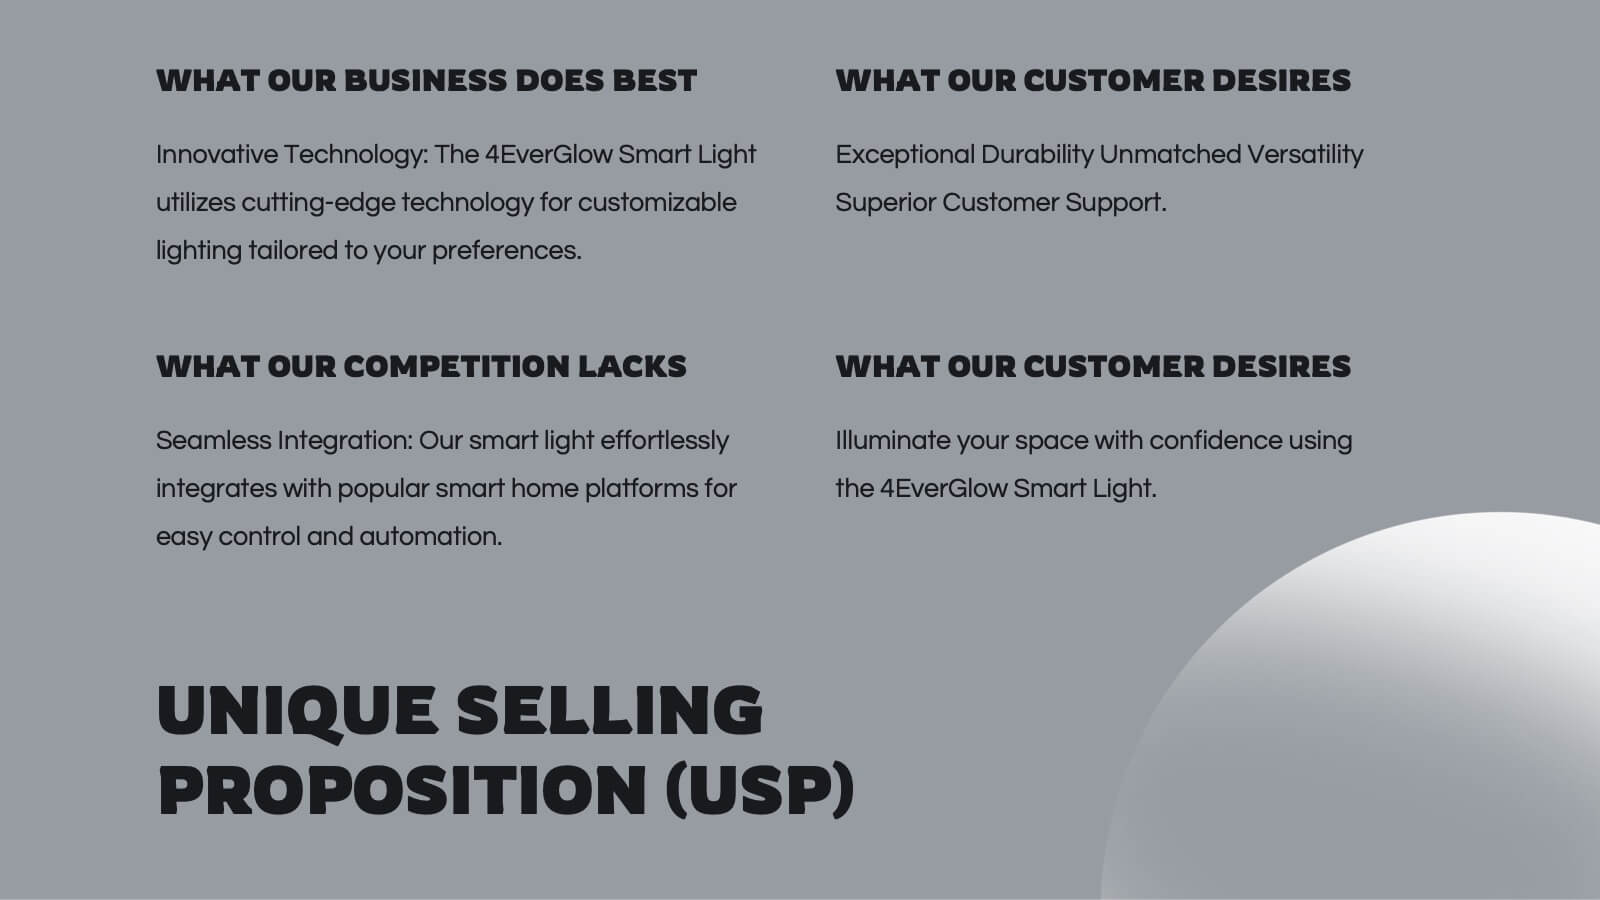
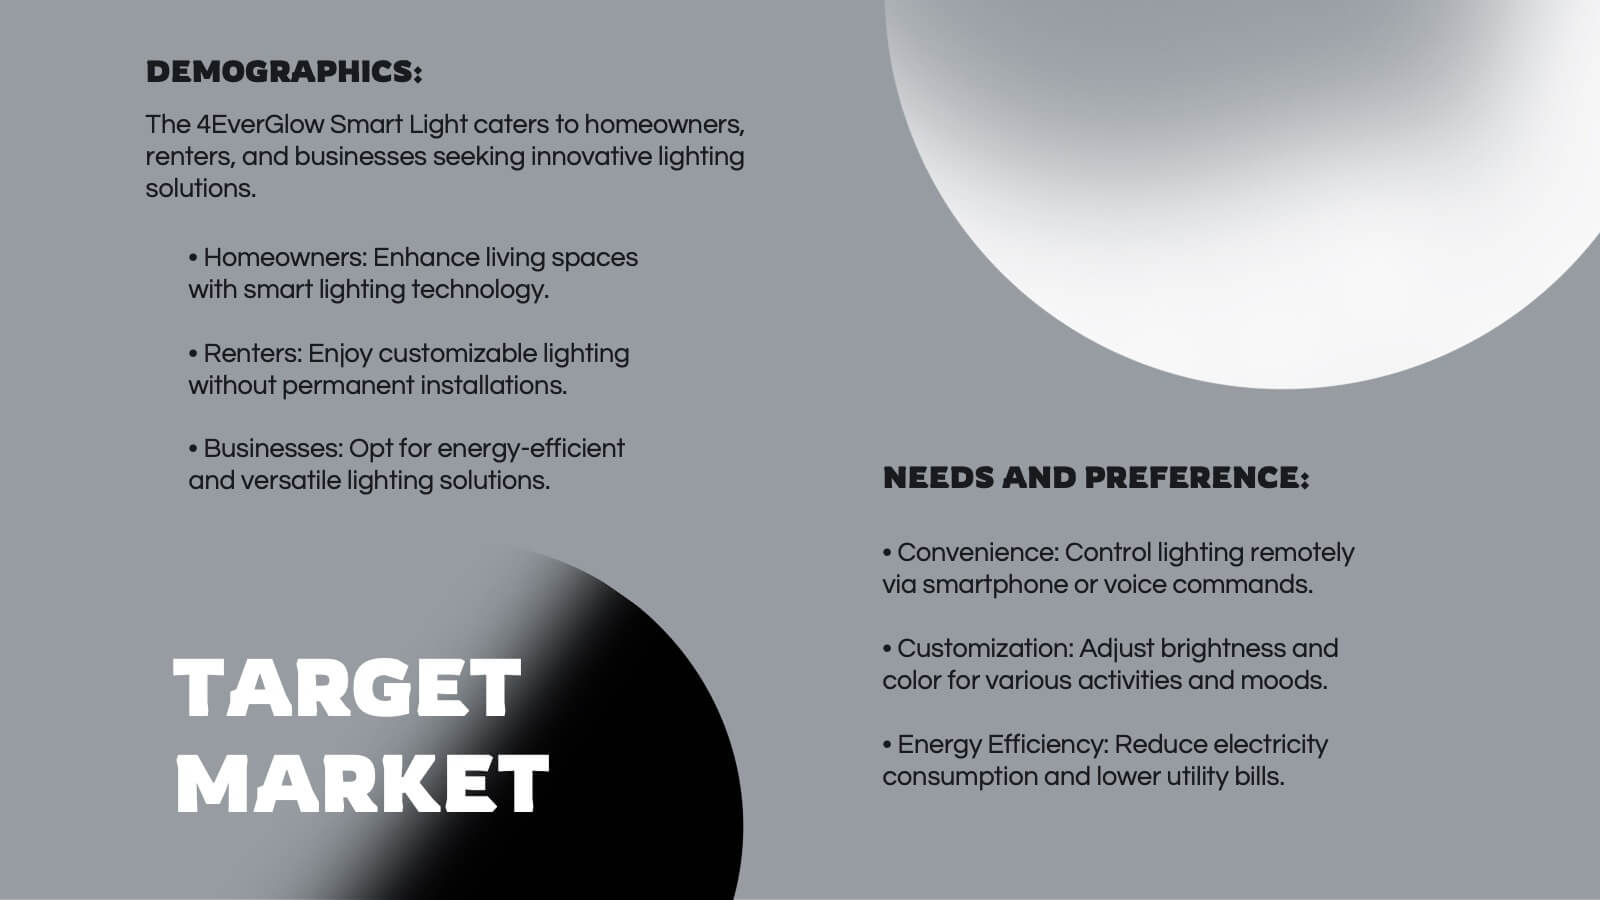
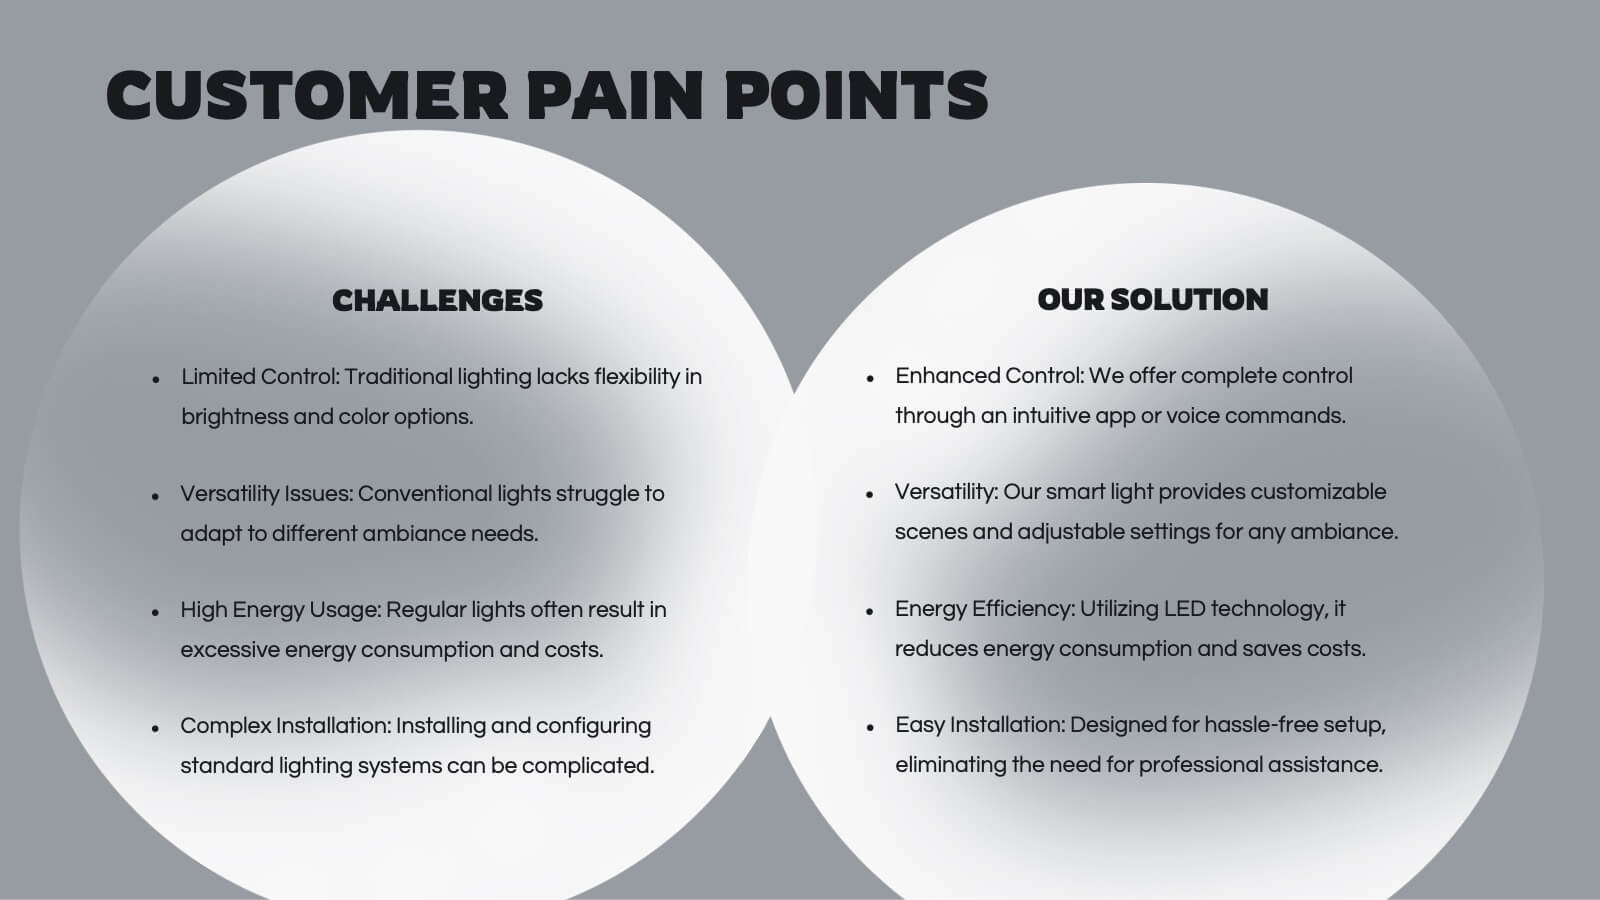
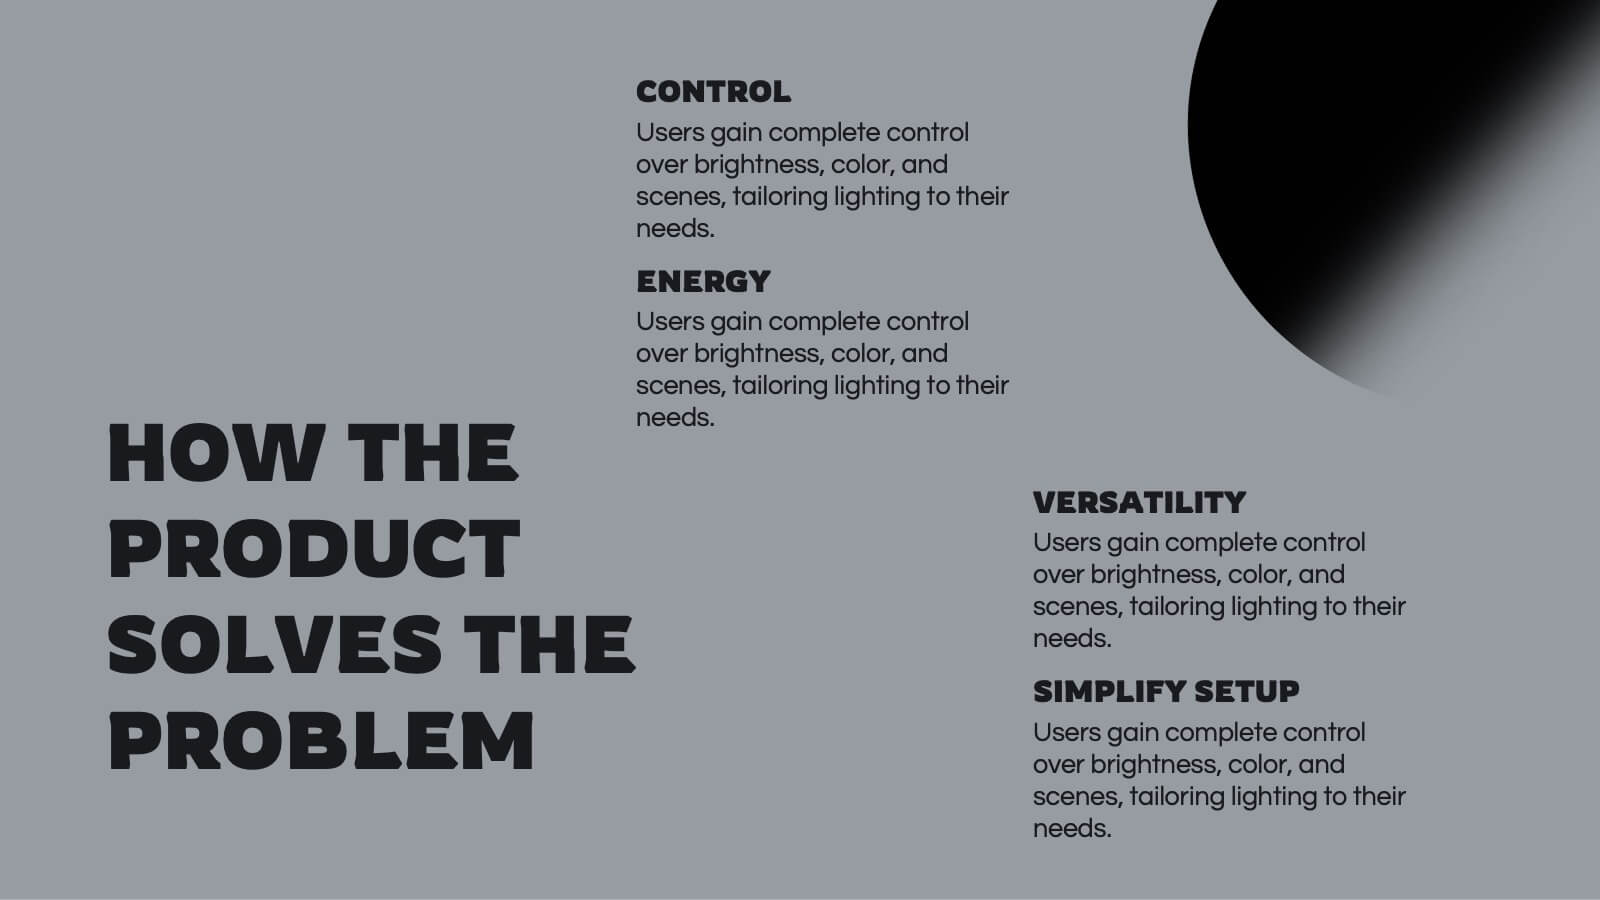
Benefits vs Features Slide Presentation
Make your message stand out by clearly distinguishing what your product does from why it matters. This clean and structured layout helps you explain features and highlight their real-world benefits, keeping audiences engaged and informed. Fully customizable and compatible with PowerPoint, Keynote, and Google Slides for smooth presentation use.


6 slides
Credit Card Benefits Infographic
Credit cards offer various benefits to cardholders, making them a popular financial tool for everyday transactions and managing personal finances. This infographic template highlights the various benefits and advantages of using credit cards. Perfect for banks, financial institutions, and credit card companies, this template presents a comprehensive overview of the perks and rewards that credit cards offer to their users. Compatible with Powerpoint, Keynote, and Google Slide. This template offers the flexibility to customize colors, fonts, and icons to align with the brand identity of the credit card issuer.


6 slides
Mission Goals Infographic
These professionally designed slide templates are tailored to help you articulate your organization's mission goals with clarity and impact. Each slide is structured to emphasize the strategic objectives that guide your operations, making them ideal for communicating with stakeholders, teams, and external partners. Featuring a variety of layouts that include real-life imagery and concise text areas, these templates not only convey your goals but also illustrate the values that underpin your mission. They are perfect for enhancing corporate presentations, annual meetings, or internal strategy discussions, providing a visual and textual guide to what drives your organization forward. Customizable for various communication needs, these templates can be adapted to highlight specific mission goals or to align with different thematic elements of your presentations. They are an essential tool for organizations aiming to foster a unified understanding of their mission and to inspire alignment and action among all stakeholders.


5 slides
Training Needs Through Skills Gap Analysis Presentation
Clearly identify training gaps and skill development priorities with the Training Needs Through Skills Gap Analysis Presentation. This structured layout helps HR teams and managers map out competency levels, prioritize development, and align learning paths with business goals. Fully editable in PowerPoint, Keynote, Canva, and Google Slides.


7 slides
Network Marketing Infographic
Network marketing, is a business strategy where salespersons earn income through both direct sales of products or services and by recruiting new salespeople. This infographic template serves as a compass, guiding you through the intricate pathways of this business model and shedding light on the strategies and dynamics that lead to success. Compatible with Powerpoint, Keynote, and Google Slides. Illustrate a network of interconnected nodes to visualize the structure and growth potential of network marketing, demonstrating how each node represents a potential customer or distributor.


21 slides
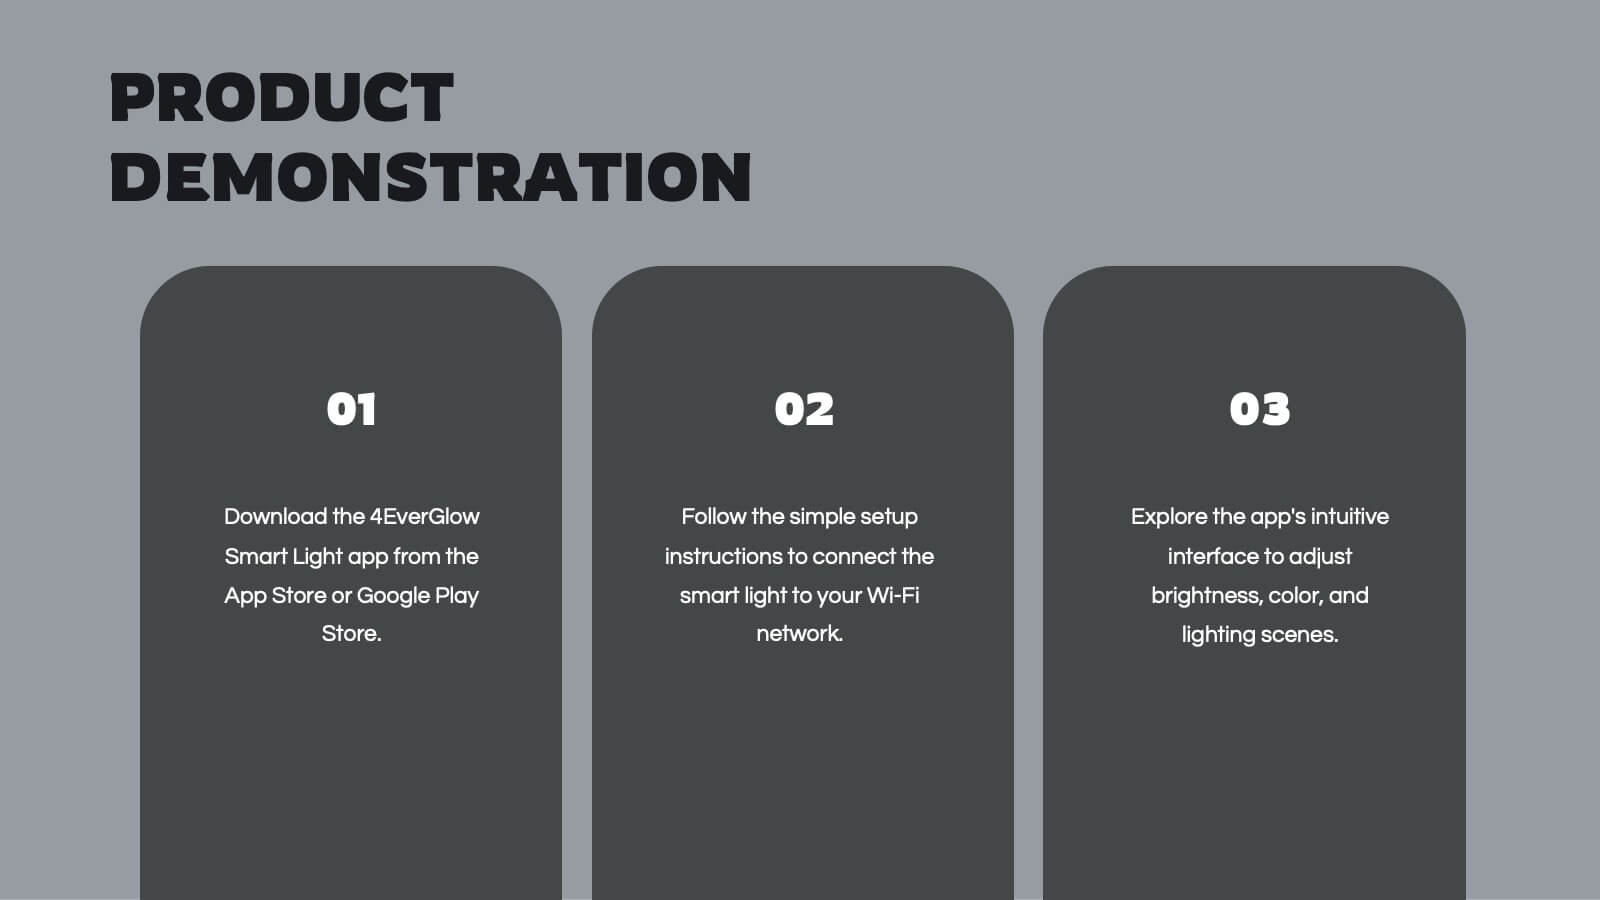
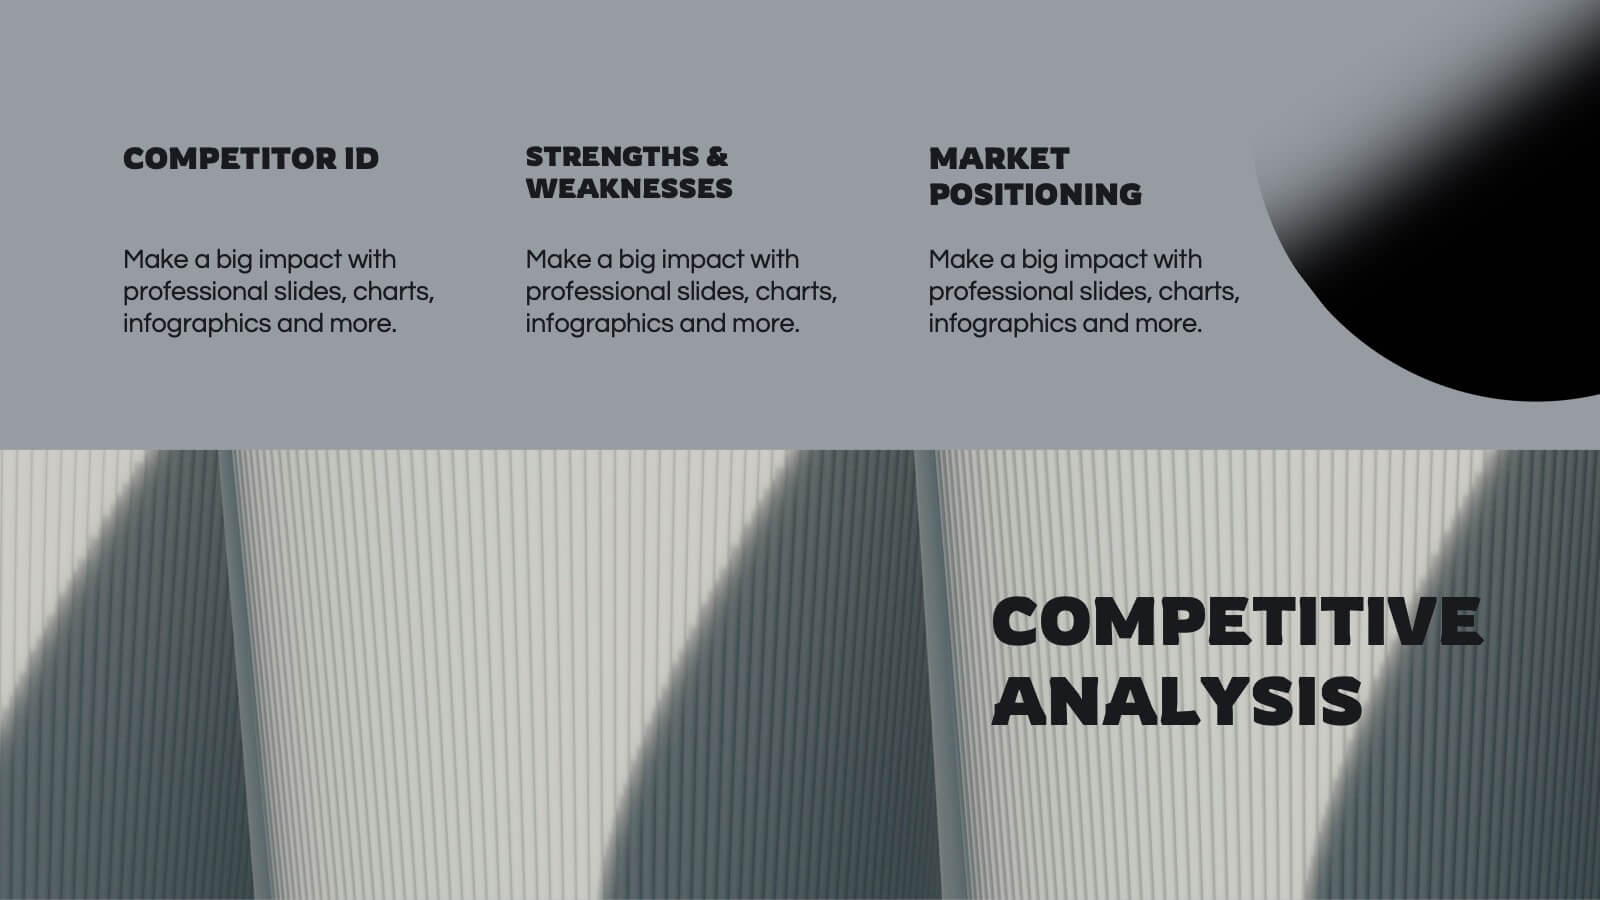
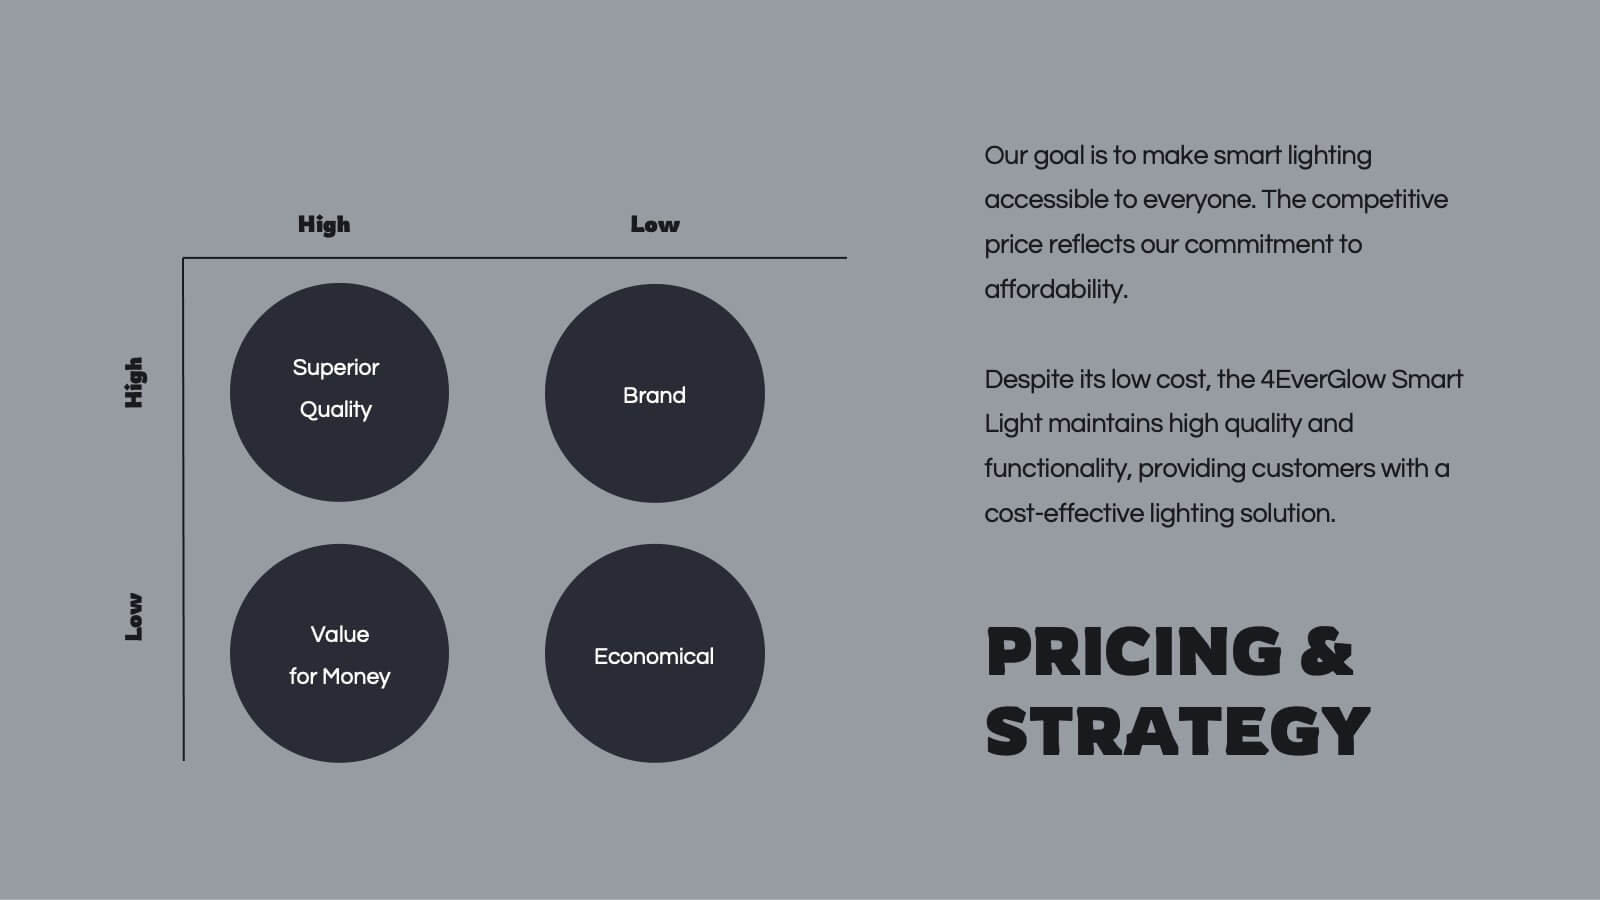
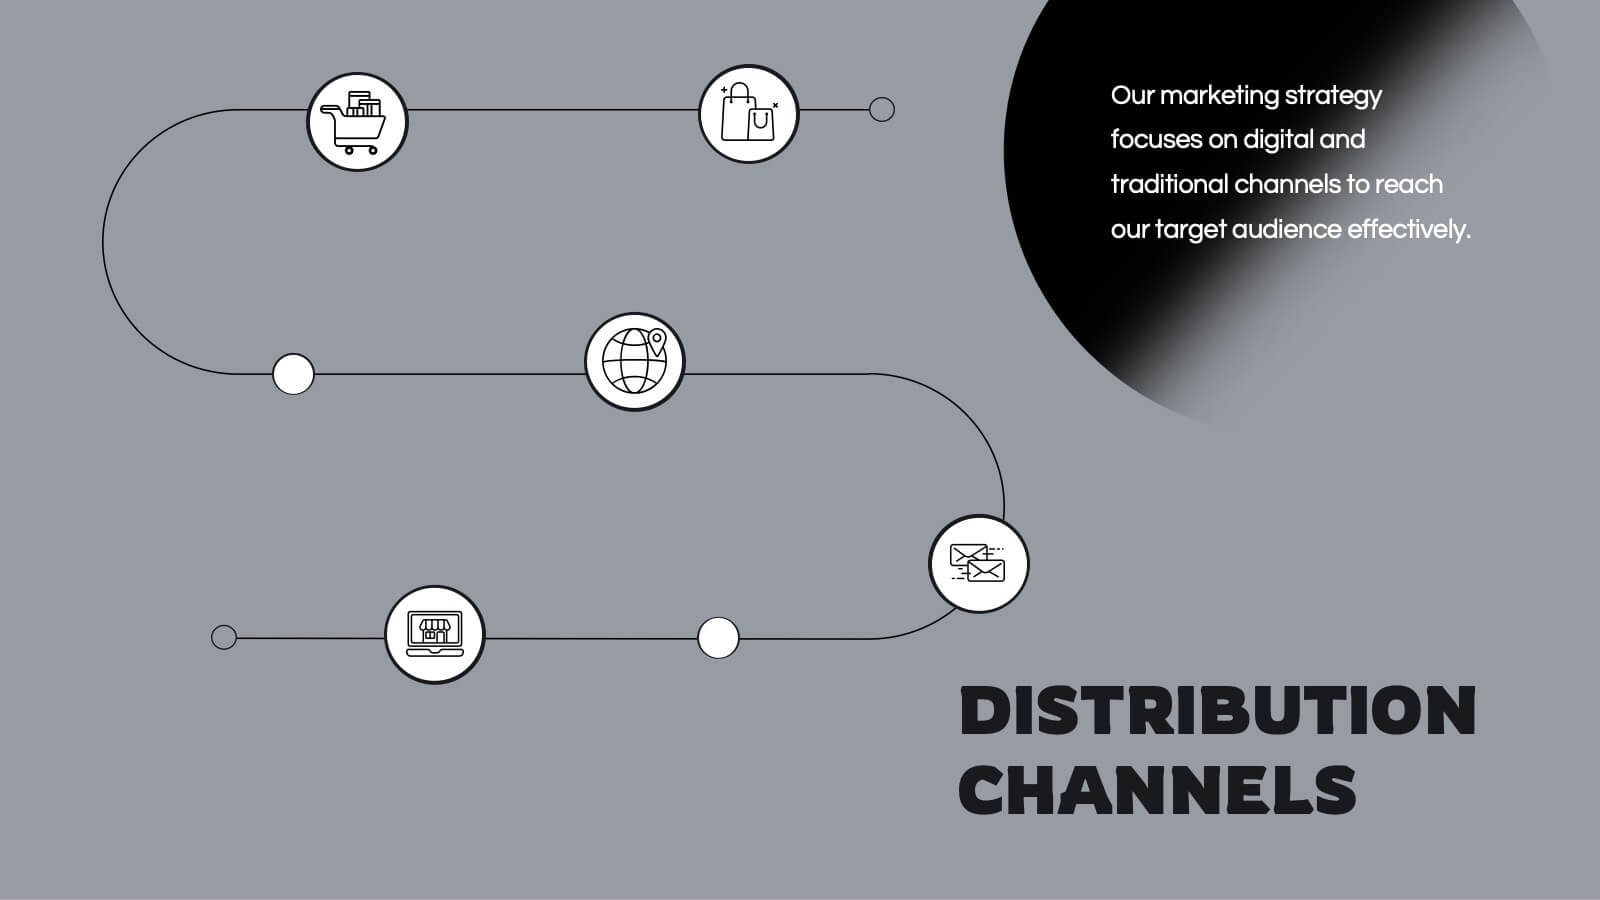
Spinel Product Strategy Report Presentation
Take your product strategy to the next level with this polished, spinel-inspired presentation! Designed to effectively communicate your product's goals, market analysis, and strategy roadmap, this template is both visually striking and easy to navigate. Its sharp design ensures a professional touch. Compatible with PowerPoint, Keynote, and Google Slides.


7 slides
Investment Management Infographic
Investment management, also known as asset management or fund management, involves the professional management of various securities and assets with the goal of achieving specific investment objectives for individuals, institutions, or entities. This infographic will encourage your audience to start or enhance their investment journey for financial prosperity. Customize the content, design, and visuals to craft an engaging and informative infographic that educates about investment management. This infographic should serve as a useful guide for both beginners and those looking to refine their investment strategies.


5 slides
CBD Oil Infographics
CBD oil, also known as cannabidiol oil, is a natural extract derived from the cannabis plant. These infographic templates can effectively present information about CBD oil in an engaging and informative manner, allowing your audience to grasp the potential benefits and practical considerations associated with its use. It is designed to educate and inform the audience about the uses, benefits, and considerations related to CBD oil. The infographics are fully customizable with visually appealing vibrant colors, relevant icons, and eye-catching layouts to capture your audience's attention.


21 slides
Thistlewood Strategic Planning Report Presentation
This comprehensive template is ideal for strategic planning, featuring slides for market analysis, SWOT evaluation, growth opportunities, and resource allocation. Showcase timelines, milestones, risk management, and communication strategies. Fully customizable, it’s perfect for delivering professional insights. Compatible with PowerPoint, Keynote, and Google Slides.


21 slides
Ionforge Startup Pitch Deck Presentation
Impress investors and showcase your startup's potential with this structured pitch deck! It covers key areas like market analysis, business model, value proposition, and financial overview, ensuring a complete story of your growth plan. Perfect for startup presentations and funding pitches, this template is fully compatible with PowerPoint, Keynote, and Google Slides.


6 slides
Home Security Infographics
Enhance your home security awareness with our Home Security infographic template. This template is fully compatible with popular presentation software like PowerPoint, Keynote, and Google Slides, allowing you to easily customize it to illustrate and communicate various aspects of home security measures and best practices. The Home Security infographic template offers a visually engaging platform to outline home security strategies, including alarm systems, surveillance, access control, and safety tips. Whether you're a homeowner, security professional, or simply interested in safeguarding your property and loved ones, this template provides a user-friendly canvas to create informative presentations and educational materials. Optimize your home security with this SEO-optimized Home Security infographic template, thoughtfully designed for clarity and ease of use. Customize it to showcase security device options, safety checklists, emergency procedures, and the importance of a secure home environment, ensuring that your audience gains valuable insights into this critical aspect of personal safety. Start crafting your personalized infographic today to bolster your home security knowledge and practices.


3 slides
Professional Introduction Slide
Introduce team members with clarity and style using this profile-focused slide. Designed to highlight key stats, roles, and responsibilities, it’s perfect for internal presentations, onboarding, or proposals. Easily customizable in PowerPoint, Keynote, and Google Slides.


4 slides
Annual Report Summary Slide
Present key performance metrics with confidence using this Annual Report Summary Slide. Designed with bold percentage visuals and clear titles, it helps break down quarterly or category results in a clean, professional format. Ideal for financial overviews, sales performance, or strategic summaries. Fully editable in PowerPoint, Keynote, and Google Slides.


4 slides
Crypto Investment and Trading Strategies Presentation
Visualize your crypto strategy with clarity using this modern, step-by-step slide. Featuring a rising arrow graph, coin icon, and shopping cart illustration, this layout is ideal for explaining investment phases, trading tactics, or market entry strategies. Editable in PowerPoint, Keynote, and Google Slides for maximum flexibility.


8 slides
Employee Performance Review Presentation
Assess and visualize team performance effectively with these "Employee Performance Review" presentation templates. Crafted to simplify performance analysis, these slides allow you to pinpoint strengths and areas for improvement through clear, sequential visual layouts. They are perfect for managers looking to foster growth and productivity, and are fully compatible with PowerPoint, Keynote, and Google Slides.


20 slides
Oceandra Sales Proposal Presentation
Present your sales strategy with precision and professionalism using this versatile proposal template. Designed to clearly communicate your problem statement, proposed solutions, and goals, it’s perfect for impressing potential clients and stakeholders. Walk your audience through the project scope, methodology, and deliverables with clean, visually appealing layouts. With sections for pricing structures, team expertise, and risk mitigation strategies, this template ensures your proposal is comprehensive and persuasive. The next steps and action plan slide helps solidify your commitment to achieving results. Fully compatible with PowerPoint, Google Slides, and Keynote, it’s customizable to meet any business or industry requirements. Ideal for turning prospects into partnerships!