


Features
- 5 Unique slides
- Fully editable and easy to edit in Microsoft Powerpoint, Keynote and Google Slides
- 16:9 widescreen layout
- Clean and professional designs
- Export to JPG, PDF or send by email


Do you have any questions?
Recommend


21 slides
Thistledown Marketing Campaign Presentation
Elevate your marketing campaigns with this polished and professional presentation template. Perfectly tailored to showcase key components such as campaign objectives, target audience, and competitive landscape, it provides a cohesive structure for presenting your strategies effectively. The slides also include sections for financial highlights, unique selling proposition, and growth planning, ensuring your goals are communicated with clarity. Whether you're discussing market presence, service offerings, or team leadership, this template helps streamline your content. Fully editable in PowerPoint, Google Slides, and Keynote, it offers flexibility to align with your branding and deliver a compelling campaign presentation.


21 slides
Kyanite Small Business Pitch Deck Presentation
Make your business pitch stand out with this vibrant and engaging presentation! Featuring sections like project overviews, team updates, performance metrics, and collaboration opportunities, it helps convey your ideas with clarity and impact. Whether for internal reviews or investor pitches, this template works seamlessly with PowerPoint, Keynote, and Google Slides.


5 slides
Suicide Prevention & Awareness Infographics
Suicide Awareness plays a vital role in addressing the global public health issue of suicide. These vertical infographics are powerful and informative designs that aim to raise awareness about suicide prevention, promote mental health, and provide essential information to help individuals recognize the signs and support those in need. With its thoughtful and sensitive design, the template communicates important statistics, facts, and resources. The template is fully customizable, allowing you to personalize the infographics with your own content, including local helpline numbers, support services, or specific awareness campaigns.

18 slides
Pinnacle Academic Research Report Presentation
Present your academic research with style and precision using this comprehensive template. It covers everything from research objectives to key findings and recommendations. Perfect for making your data clear and engaging. Compatible with PowerPoint, Keynote, and Google Slides, it ensures your research is presented professionally and effectively.


4 slides
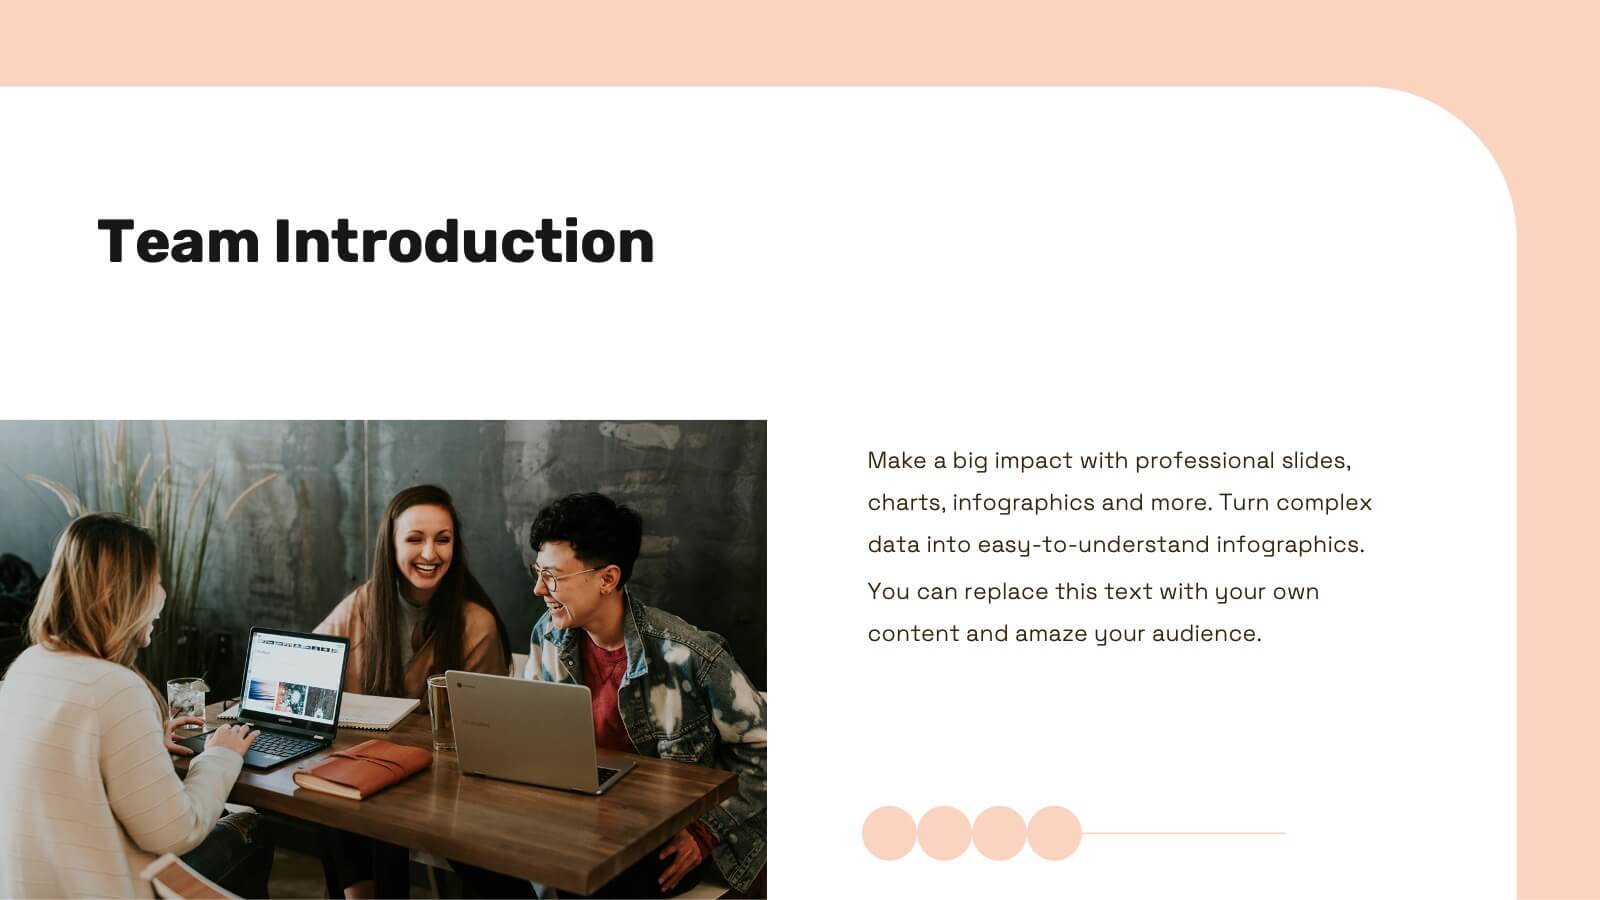
Professional Team Member Slides Presentation
Meet your team in a fresh, dynamic way with a layout that highlights personalities, roles, and key contributions at a glance. This presentation helps introduce members clearly, supporting stronger collaboration and professional communication across any project. Fully customizable and compatible with PowerPoint, Keynote, and Google Slides.


5 slides
Wellness Program and Public Health Overview Presentation
Give your health data a clean, visual voice with this engaging infographic layout. Designed to showcase wellness programs, public health statistics, or fitness data, this slide maps key points alongside a human body silhouette to enhance clarity. Easy to edit and compatible with PowerPoint, Keynote, and Google Slides for seamless customization.


6 slides
Stakeholder Analysis and Engagement
Effectively map out internal and external stakeholders with this structured hexagon-based layout. This presentation highlights six key groups—Employee, Manager, Shareholder, Society, Media, and Customer—centered around your company. Ideal for corporate strategy, stakeholder engagement, or CSR planning. Fully customizable in PowerPoint, Keynote, and Google Slides.


21 slides
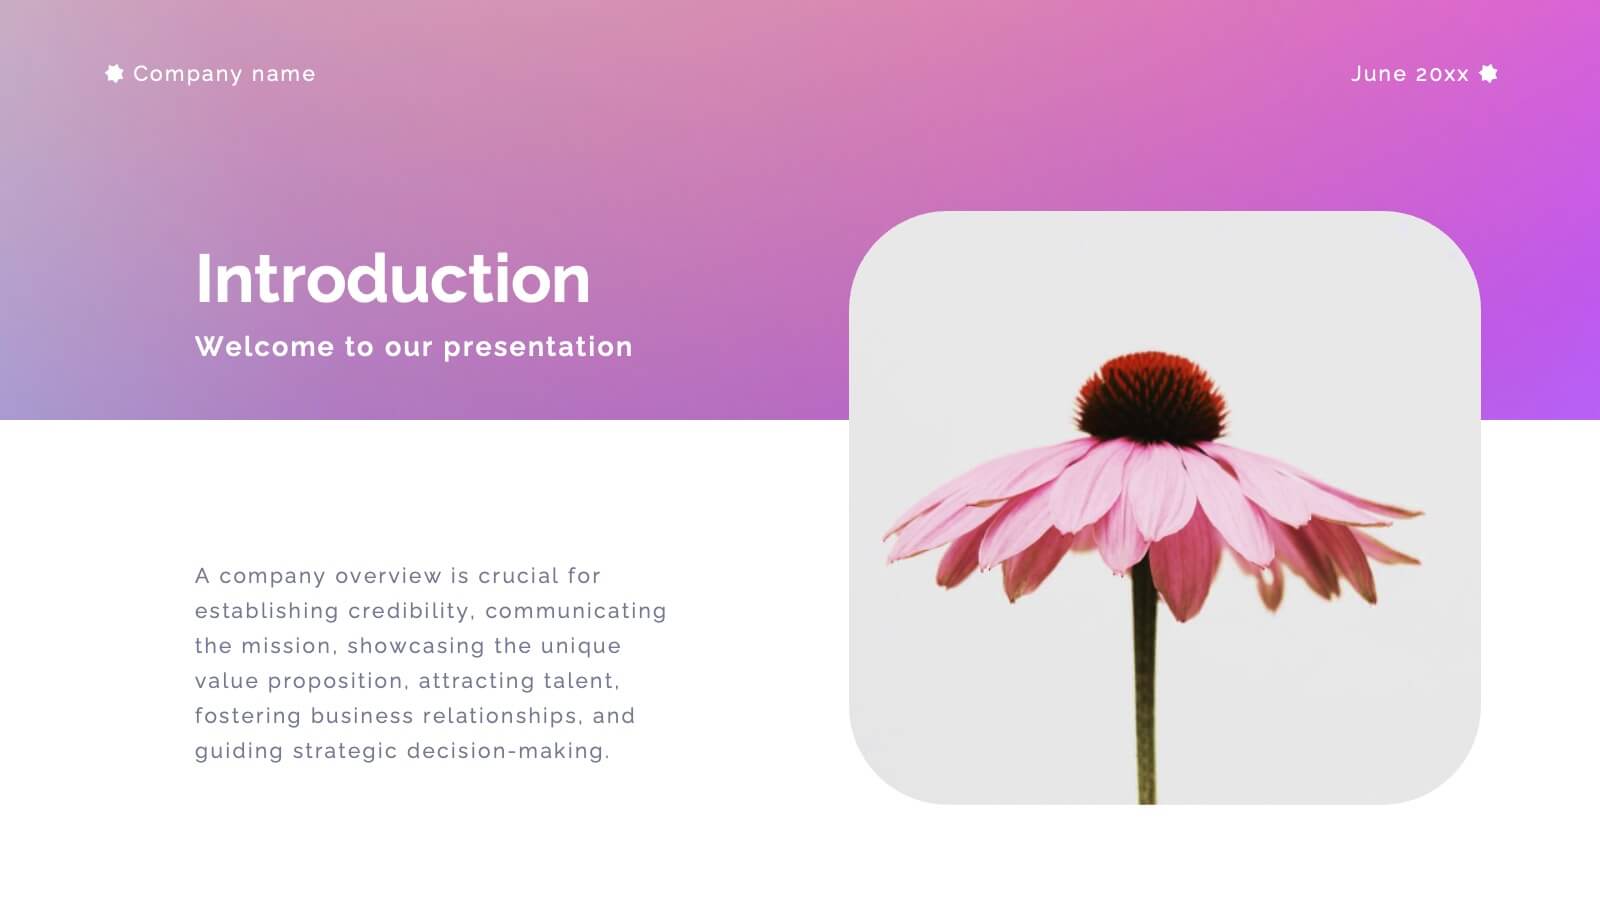
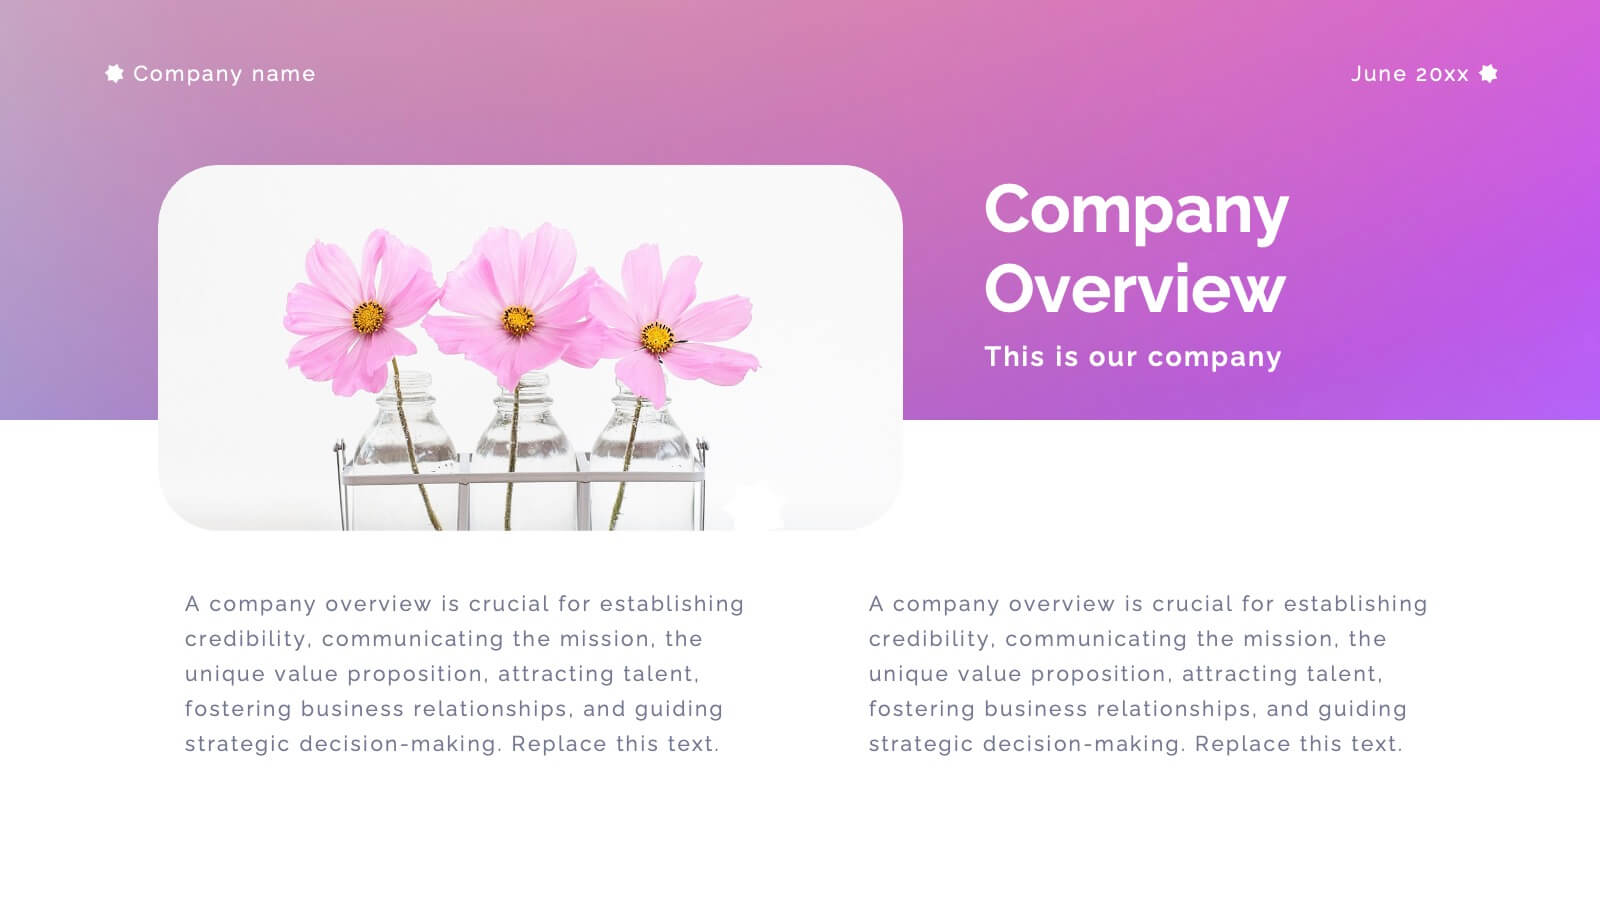
Aventurine New Product Proposal Presentation
Showcase your product in style with this vibrant and modern product proposal template! It covers everything from product features to target market, pricing strategy, and marketing plans. Designed for clarity and impact, it's perfect for pitching your product. Fully customizable, and compatible with PowerPoint, Keynote, and Google Slides for seamless presentations.


5 slides
North American Business Overview and Map Presentation
Showcase regional performance data across North America with this clean, data-driven map slide. Highlight four key statistics using pinpoint markers and modern percentage indicators. Ideal for market overview, financial reporting, or strategic insights. Fully customizable and compatible with PowerPoint, Keynote, and Google Slides for seamless business presentations.


7 slides
McKinsey 7S Model Infographic Presentation Template
The McKinsey 7S model is a management framework developed by the consulting firm McKinsey & Company. The model consists of seven interdependent factors that are important for an organization's success: strategy, structure, systems, shared values, skills, staff, and style. The template can be used to visualize the 7S model hierarchy and the importance of each component to your business. This inventive presentation is designed to take an economic approach, If you’re interested in taking this strategic step to evaluating your processes and measuring performance, this presentation is for you.


6 slides
Employee Change Management Strategy Presentation
Communicate change with clarity using this structured, gear-themed presentation slide. Designed to visualize six strategic stages of employee transition, it's ideal for HR professionals, team leaders, and consultants managing organizational change. Each step is represented with a numbered circle and aligned text for easy guidance. Fully customizable in PowerPoint, Keynote, and Google Slides.


7 slides
PESTEL Analysis Marketing Infographic
PESTEL Analysis, often referred to as PESTLE Analysis, is a strategic management tool used to analyze and evaluate external macro-environmental factors that can impact an organization. This infographic template is a comprehensive and visually captivating template that unravels the strategic insights derived from the PESTEL analysis in the realm of marketing. Explore the critical external factors that influence your marketing strategy and steer your business towards success. Compatible with Powerpoint, Keynote, and Google Slides. Empower your marketing strategies with our PESTEL Analysis Marketing Infographic!


6 slides
Talent Acquisition and Recruitment Presentation
Showcase your hiring process with clarity using this Talent Acquisition and Recruitment slide. Designed with a stack of resumes and a 5-step vertical layout, it's perfect for outlining stages such as job posting, candidate sourcing, interviews, and selection. Each section includes icons and editable titles to match your specific recruitment flow. Compatible with PowerPoint, Keynote, and Google Slides for easy customization.


10 slides
4-Quadrant Responsibility Chart Presentation
Bring your message to life with a slide that feels bold, modern, and instantly engaging. This presentation helps you outline four key responsibilities or categories in a clean quadrant layout, making complex information easy to follow and visually compelling. It’s perfect for strategy, workflow, or team-based insights. Fully compatible with PowerPoint, Keynote, and Google Slides.


4 slides
Project Task Ownership with RACI Chart Presentation
Assign roles clearly with the Project Task Ownership with RACI Chart Presentation. This template simplifies responsibility mapping across tasks using the RACI framework (Responsible, Accountable, Consulted, Informed). With a clean matrix layout, it's perfect for project planning, stakeholder alignment, and workflow transparency. Fully editable in PowerPoint, Canva, and Google Slides.


8 slides
Process Flowchart Presentation
Visualize your workflows effortlessly with this Process Flowchart template. Designed for business presentations, it helps map out key steps with a structured, gear-based design. Fully editable with customizable colors, icons, and text for seamless adaptation. Compatible with PowerPoint, Keynote, and Google Slides for maximum flexibility and ease of use.
22 slides
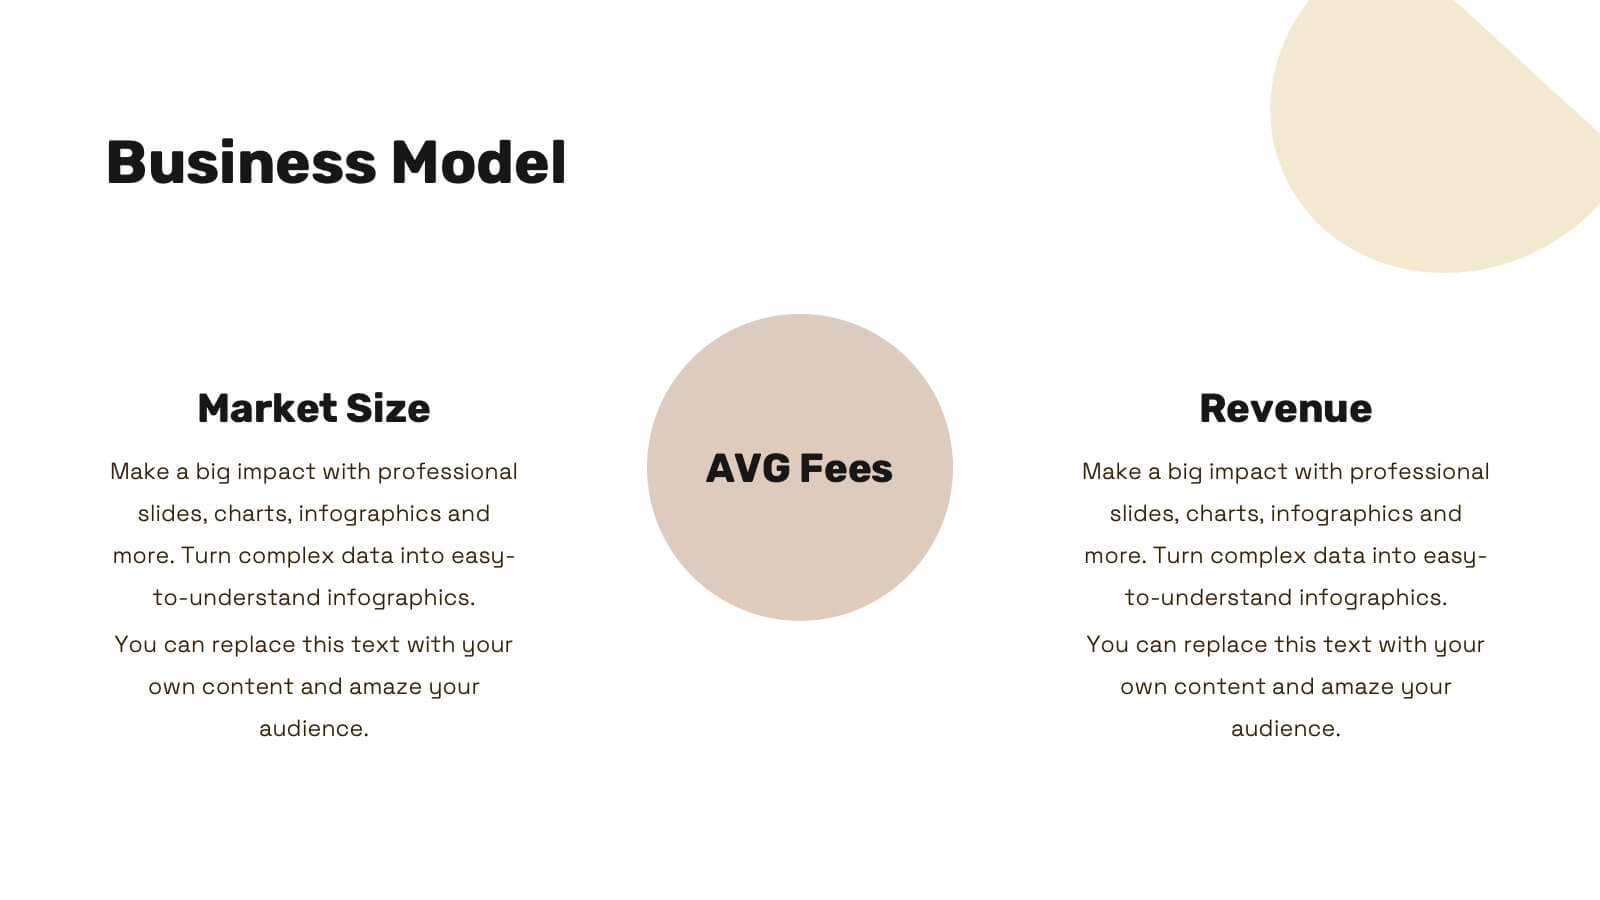
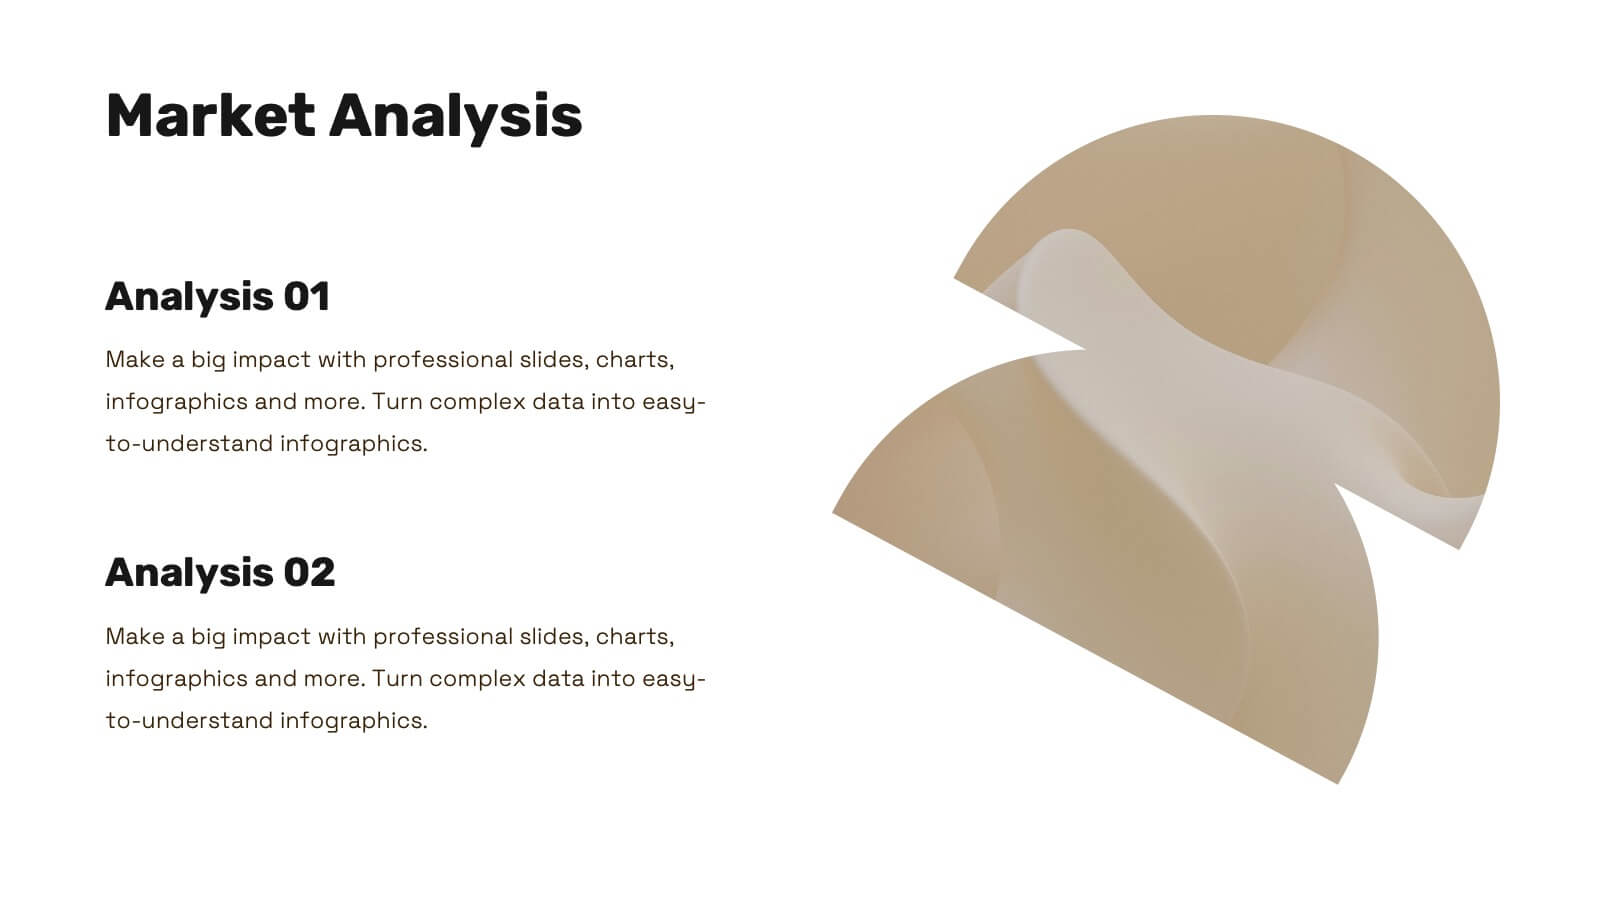
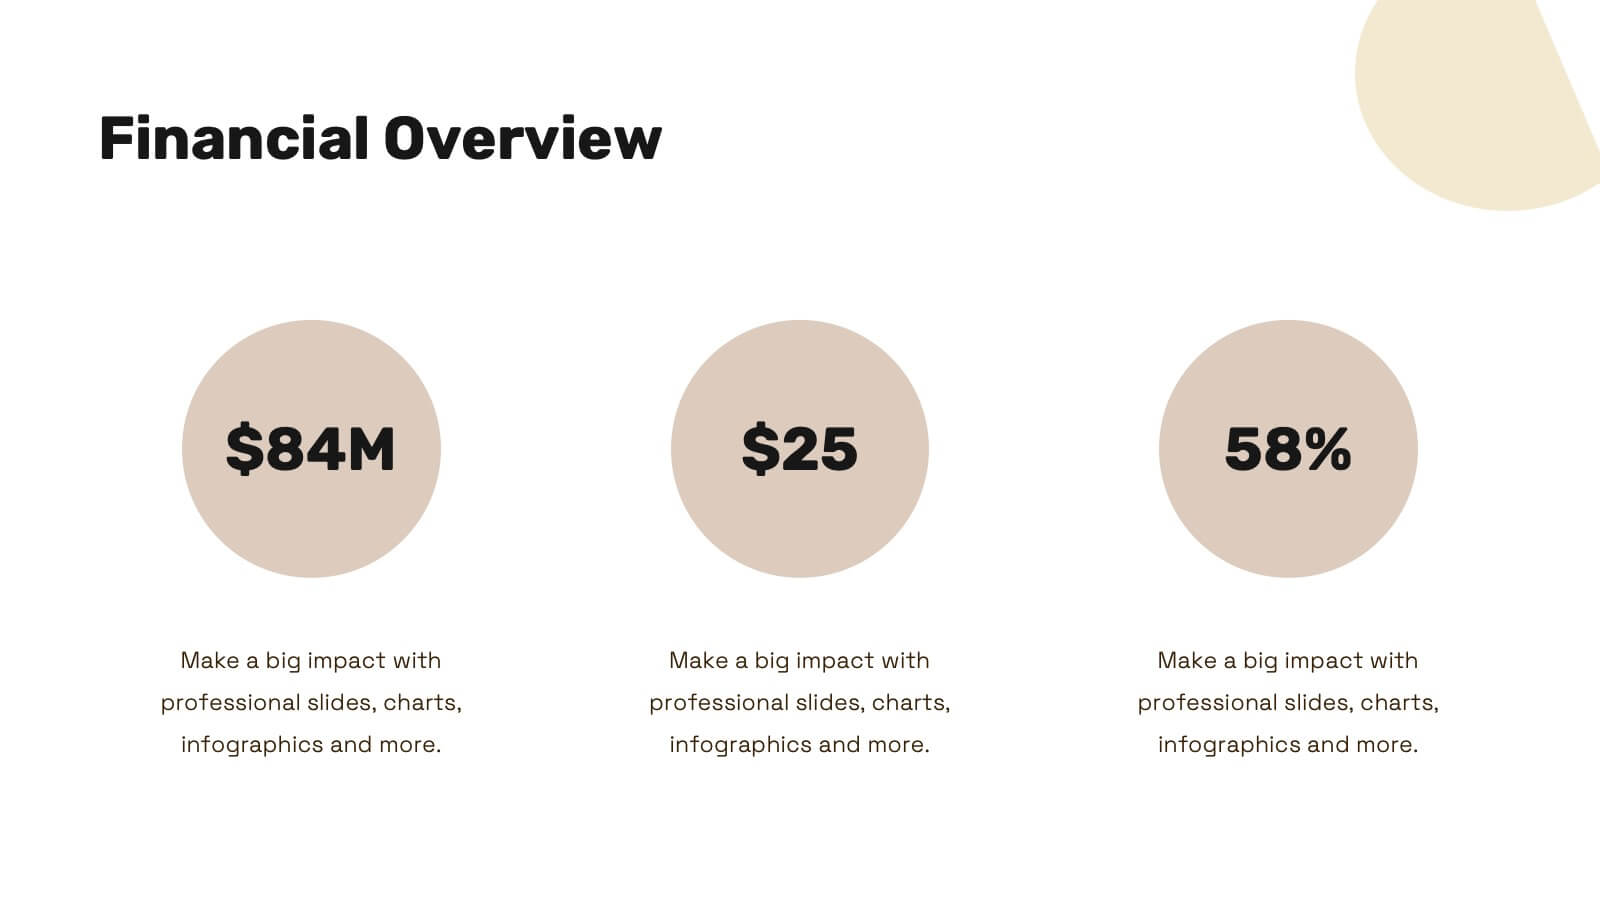
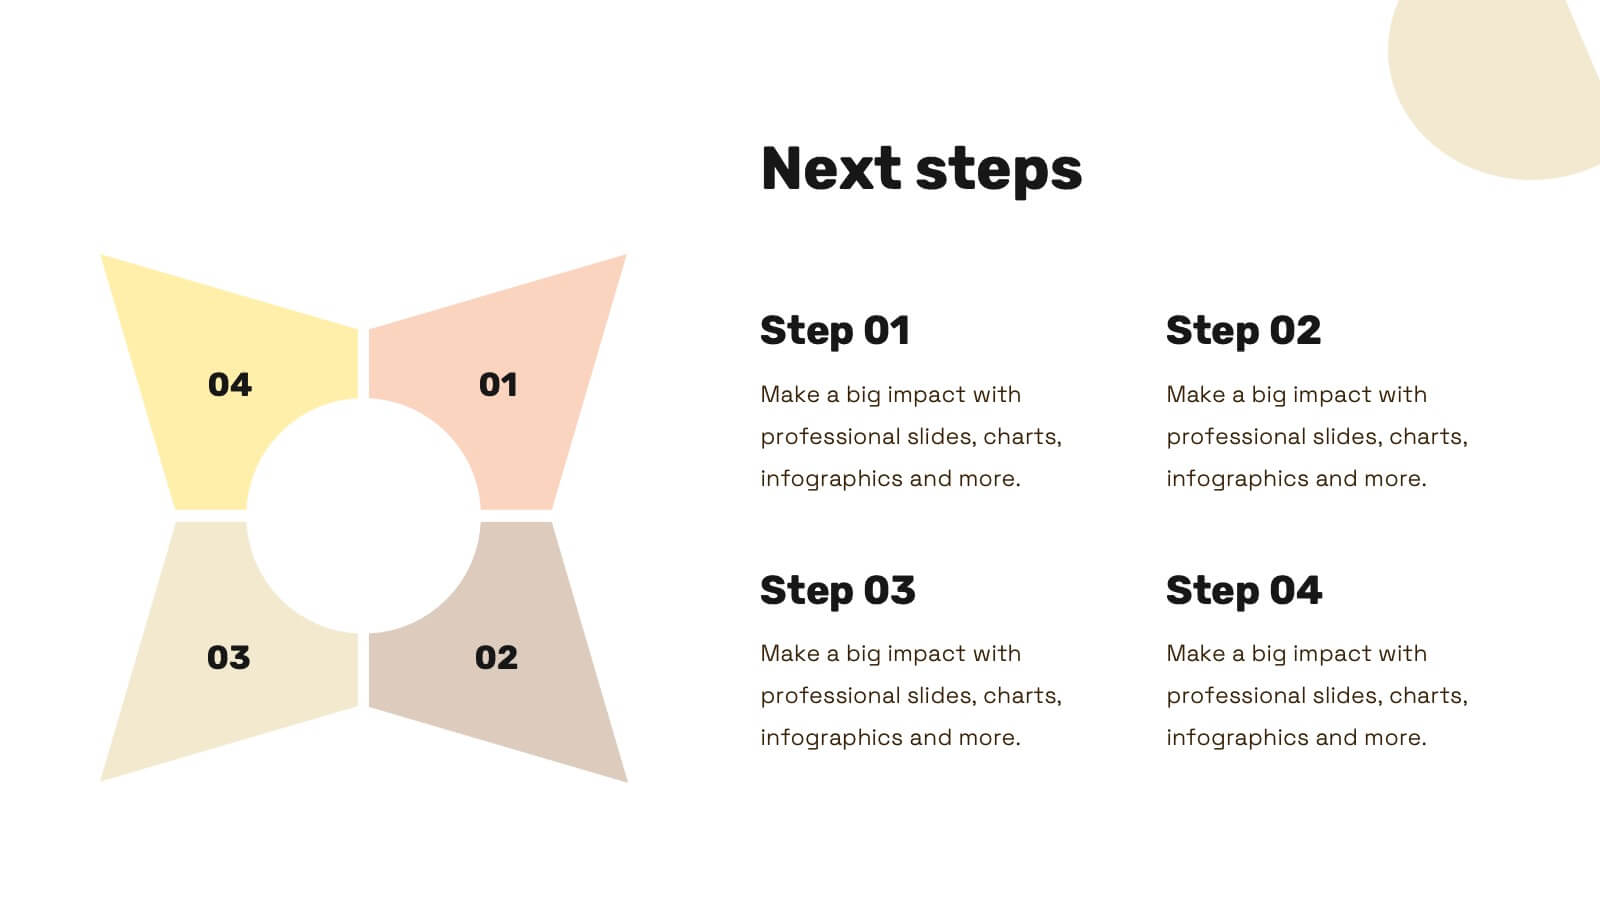
Nova Startup Funding Proposal Presentation
Craft an impressive startup funding proposal with this elegant template. It includes sections for mission, vision, market analysis, business model, and financial overview. Ideal for clear and professional presentations. Fully compatible with PowerPoint, Keynote, and Google Slides for easy customization.