


Features
- 4 Unique slides
- Fully editable and easy to edit in Microsoft Powerpoint, Keynote and Google Slides
- 16:9 widescreen layout
- Clean and professional designs
- Export to JPG, PDF or send by email


Do you have any questions?
Recommend


3 slides
Stock Market Performance Overview Presentation
Showcase financial growth like a pro with this clean, data-driven layout designed to visualize performance, market activity, and business progress over time. Ideal for professionals presenting key financial trends, metrics, or strategies. Fully compatible with PowerPoint, Keynote, and Google Slides for easy customization and professional presentation results.


22 slides
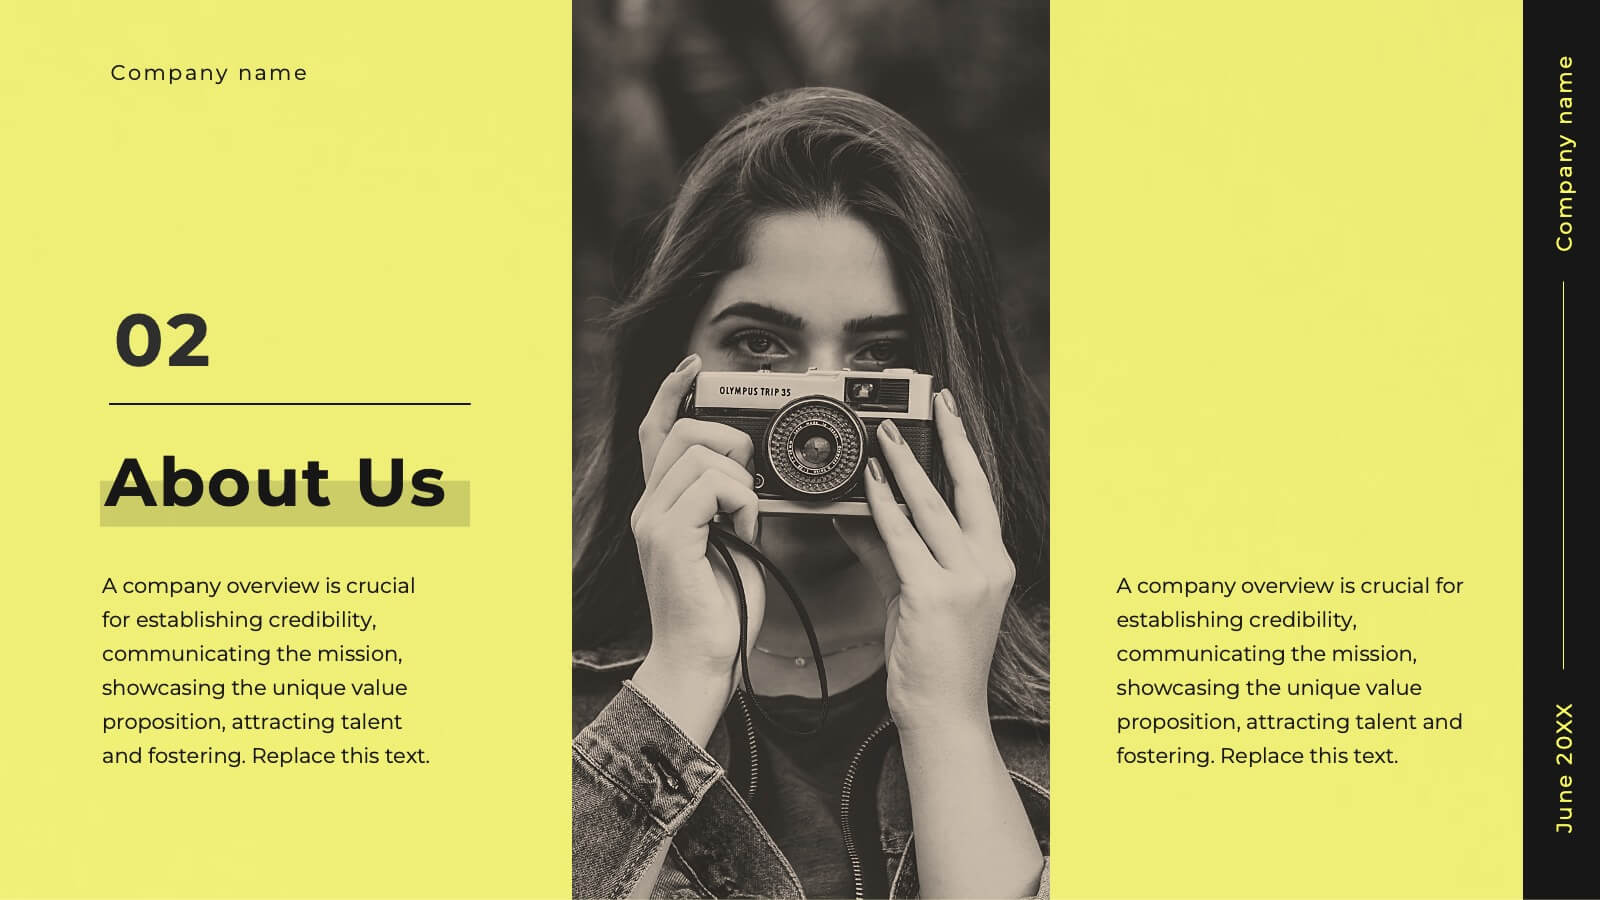
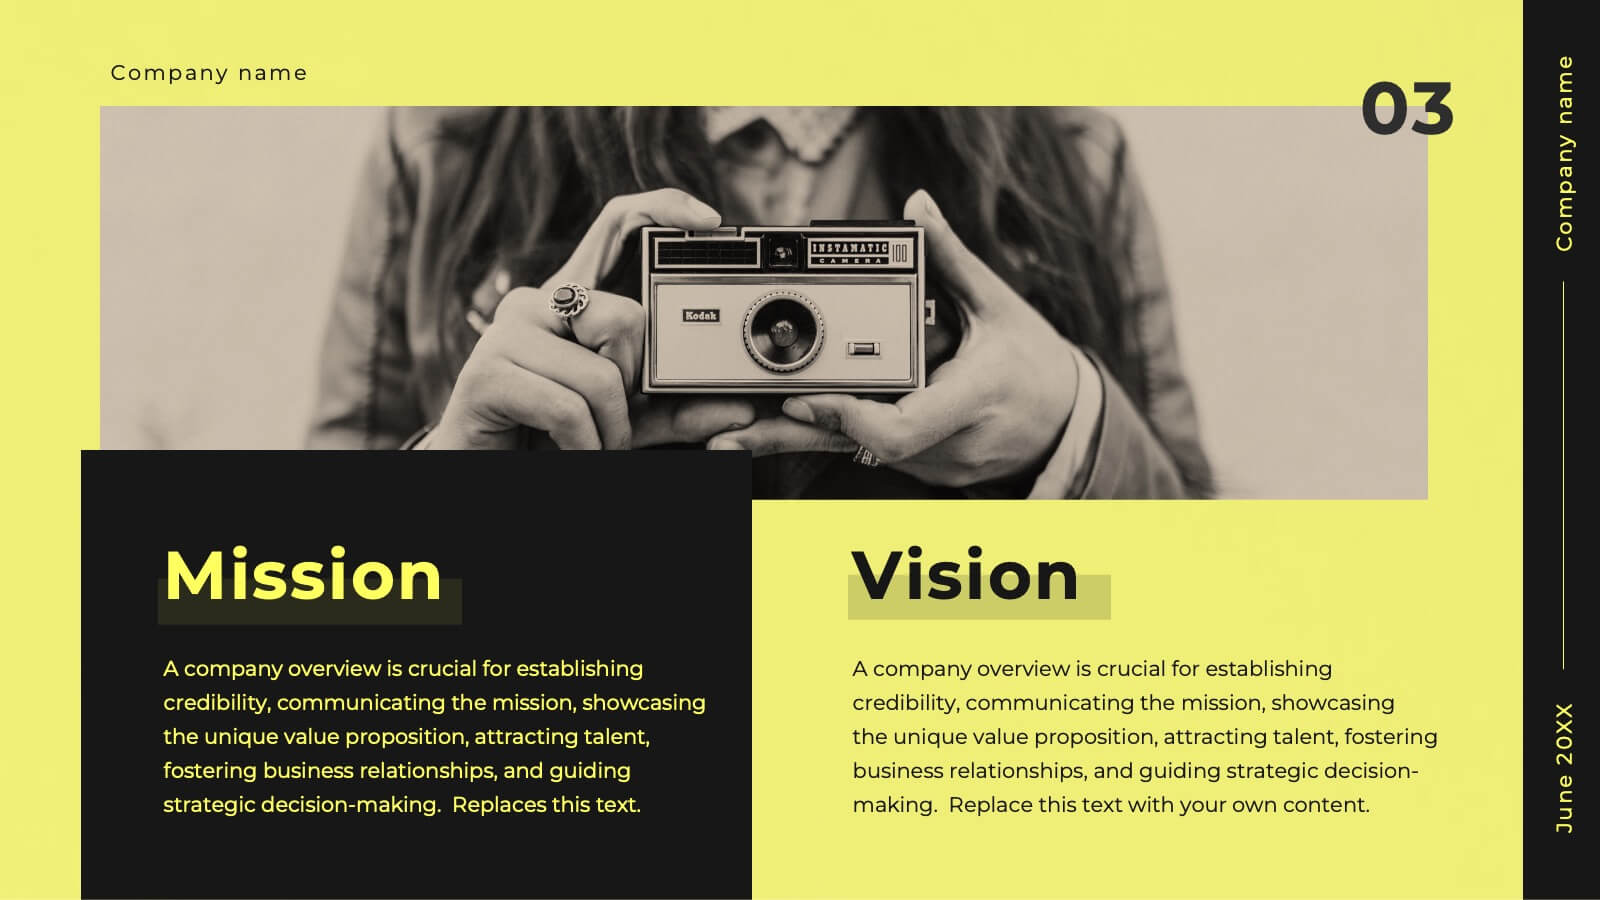
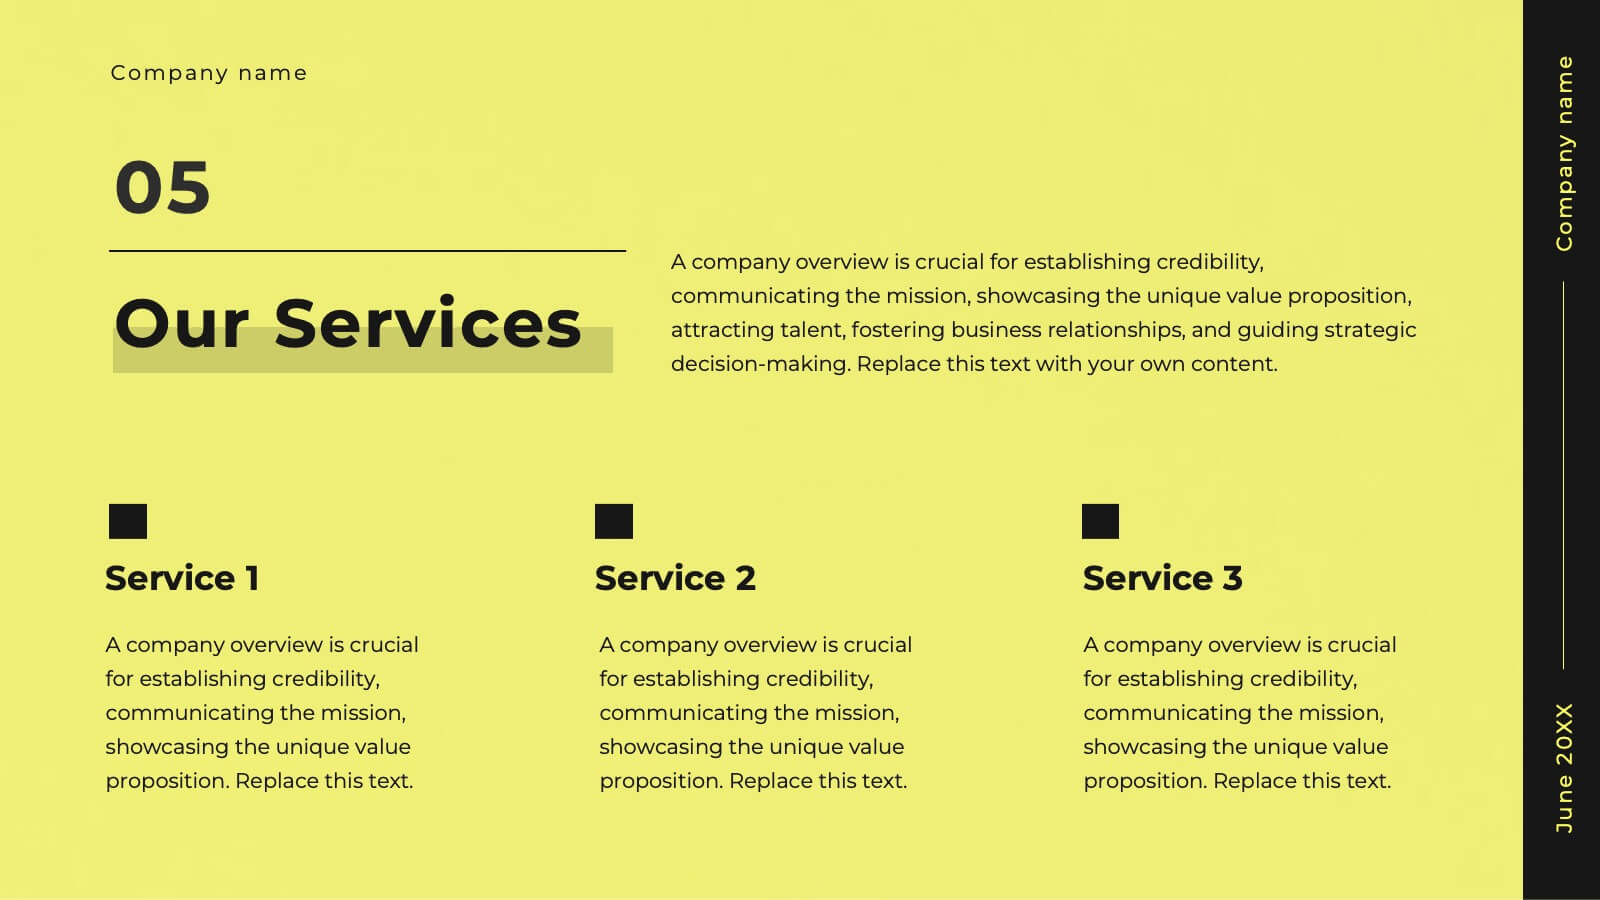
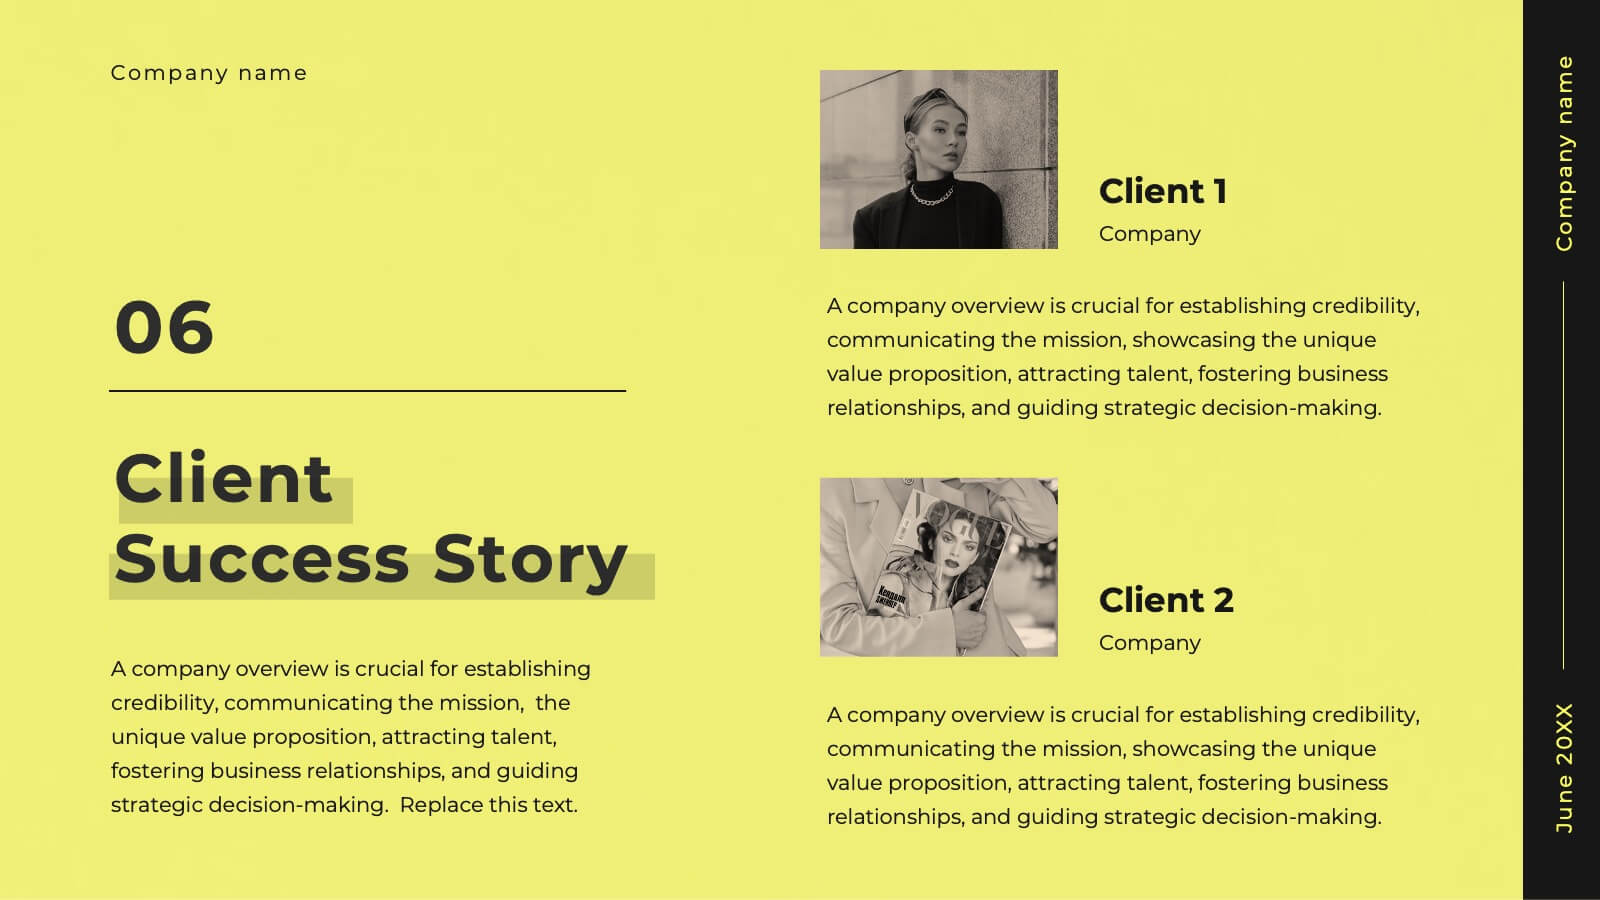
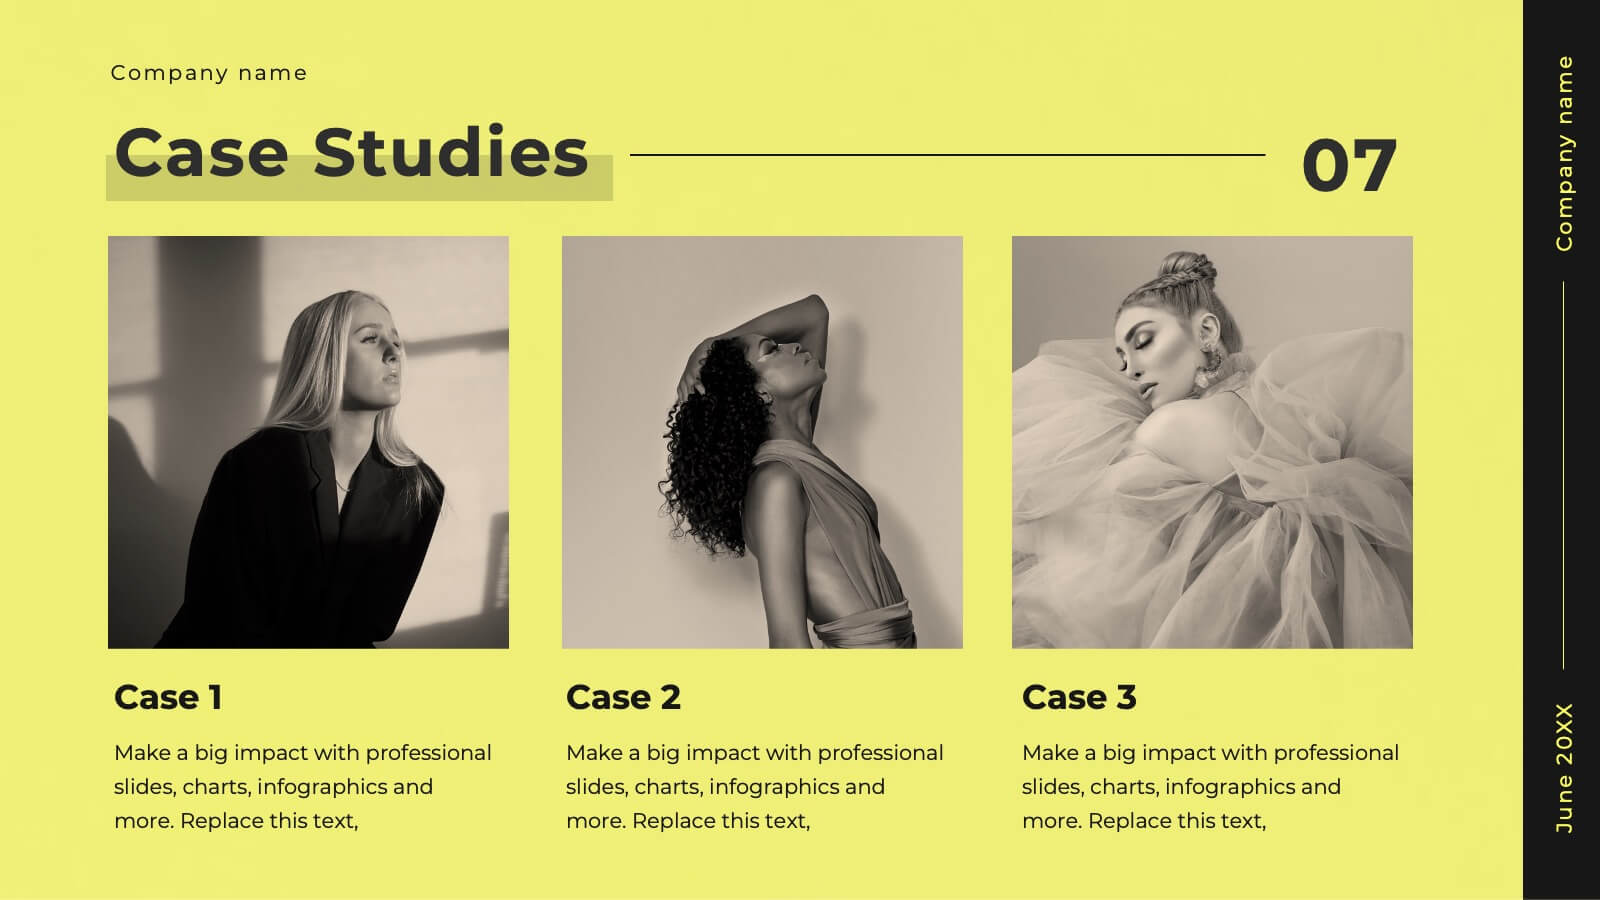
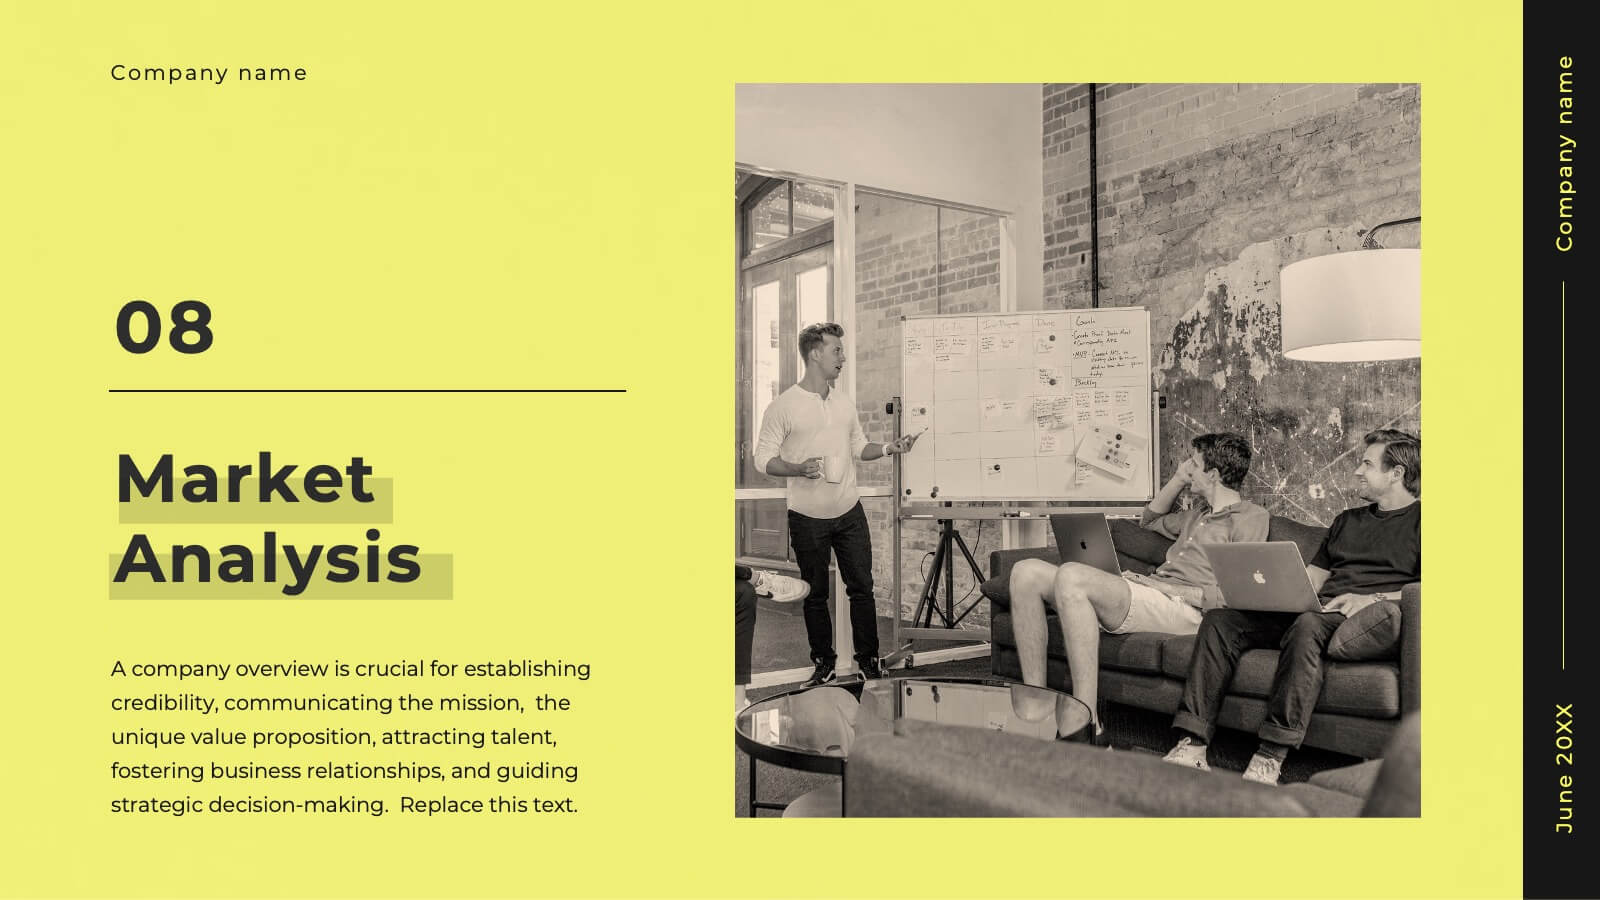
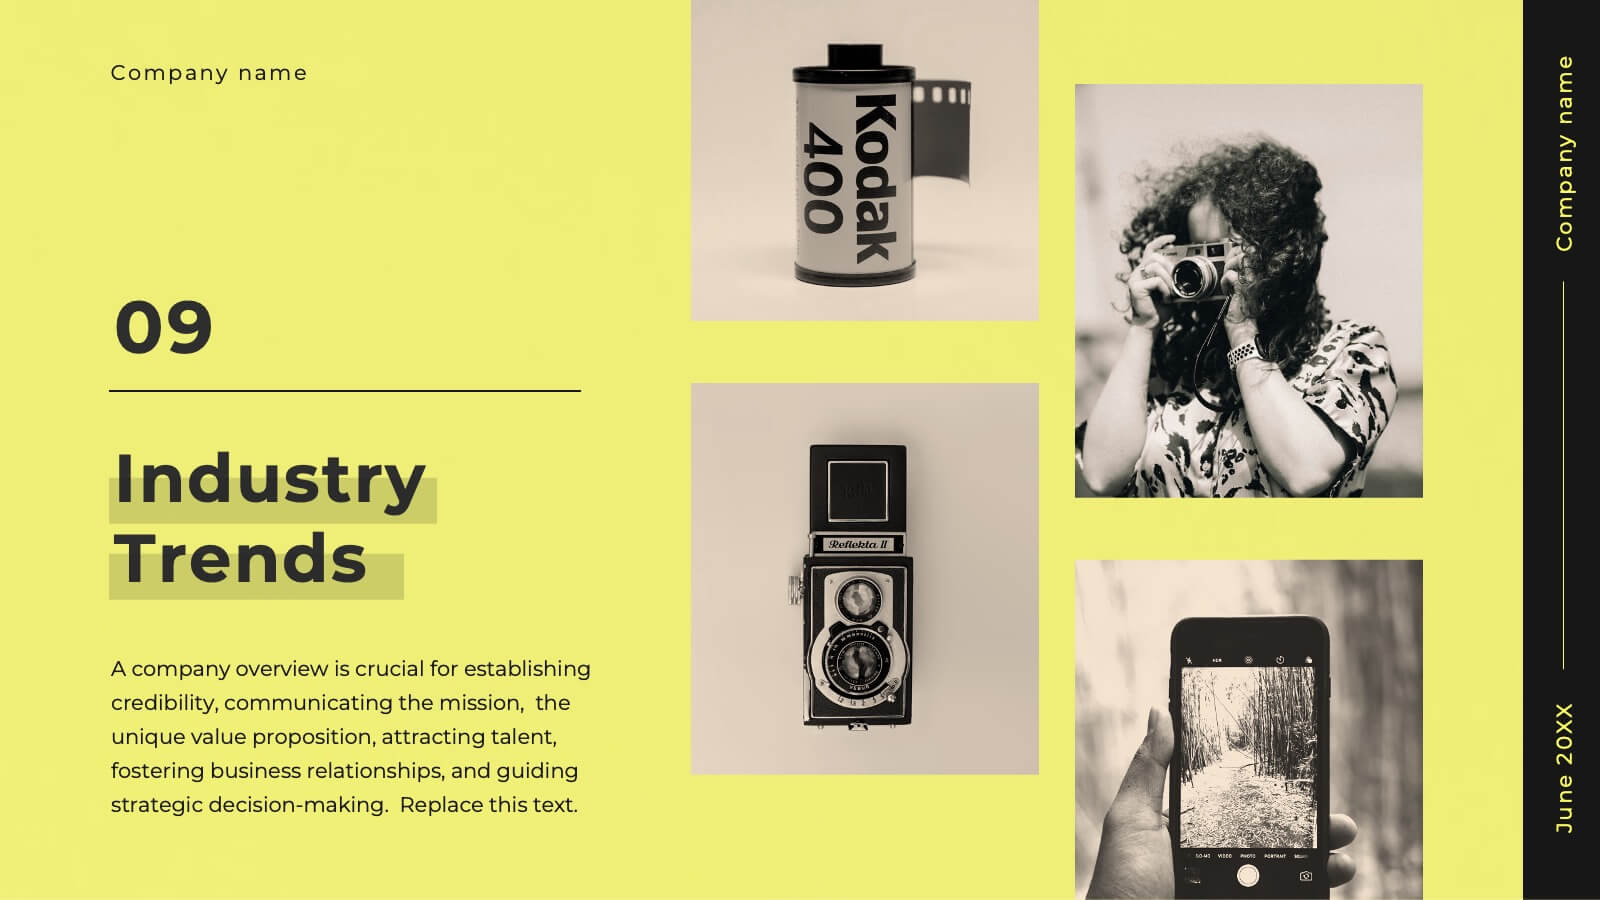
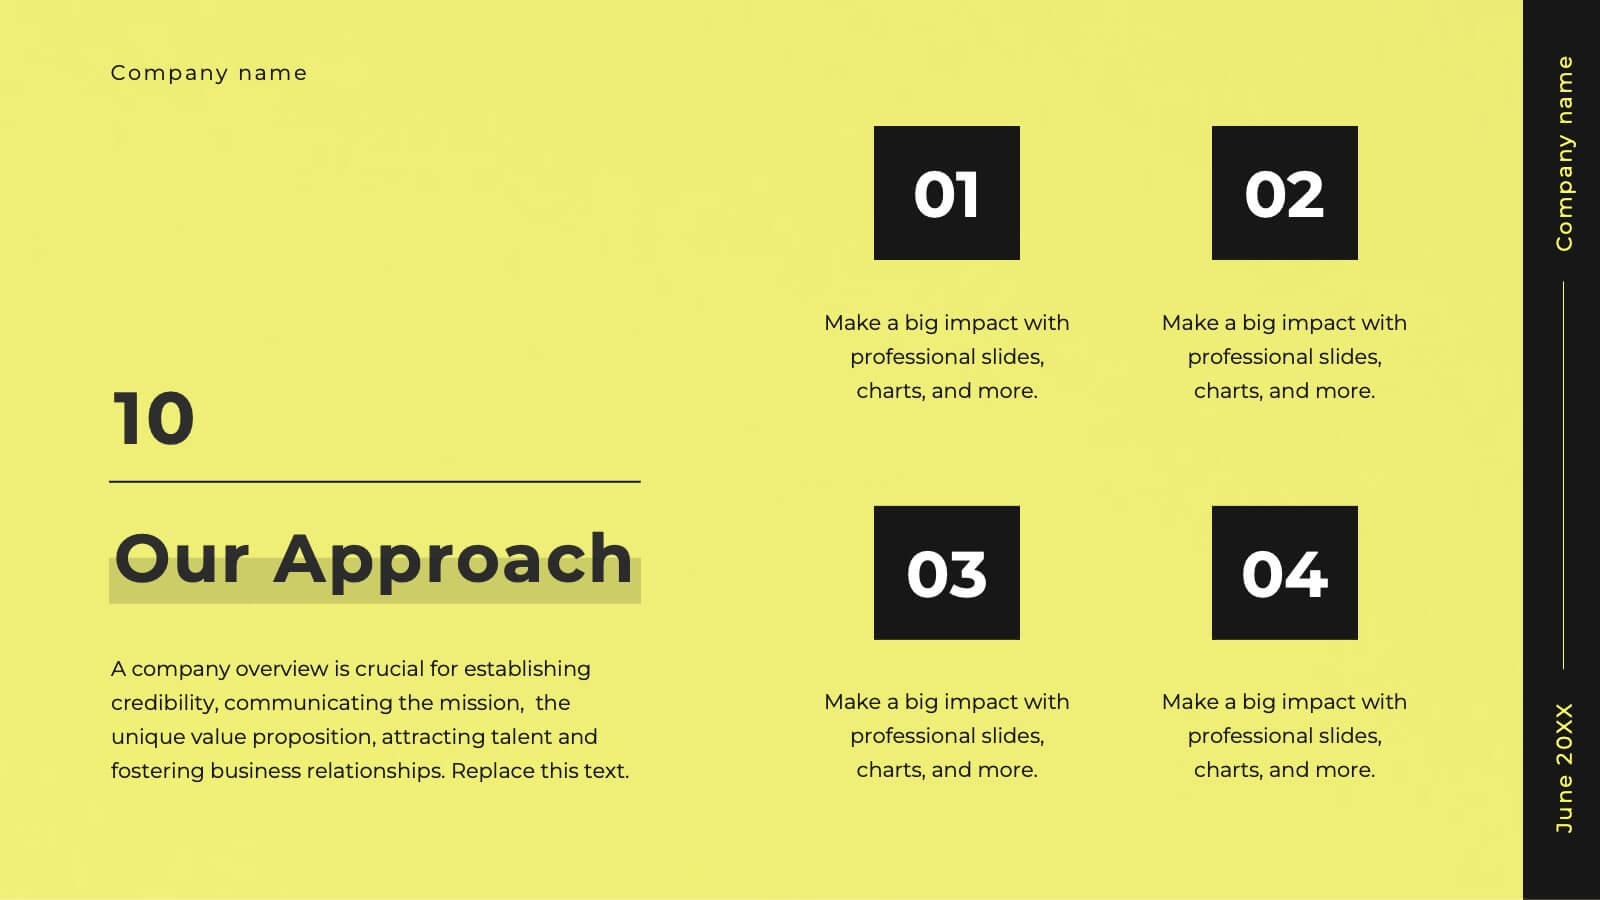
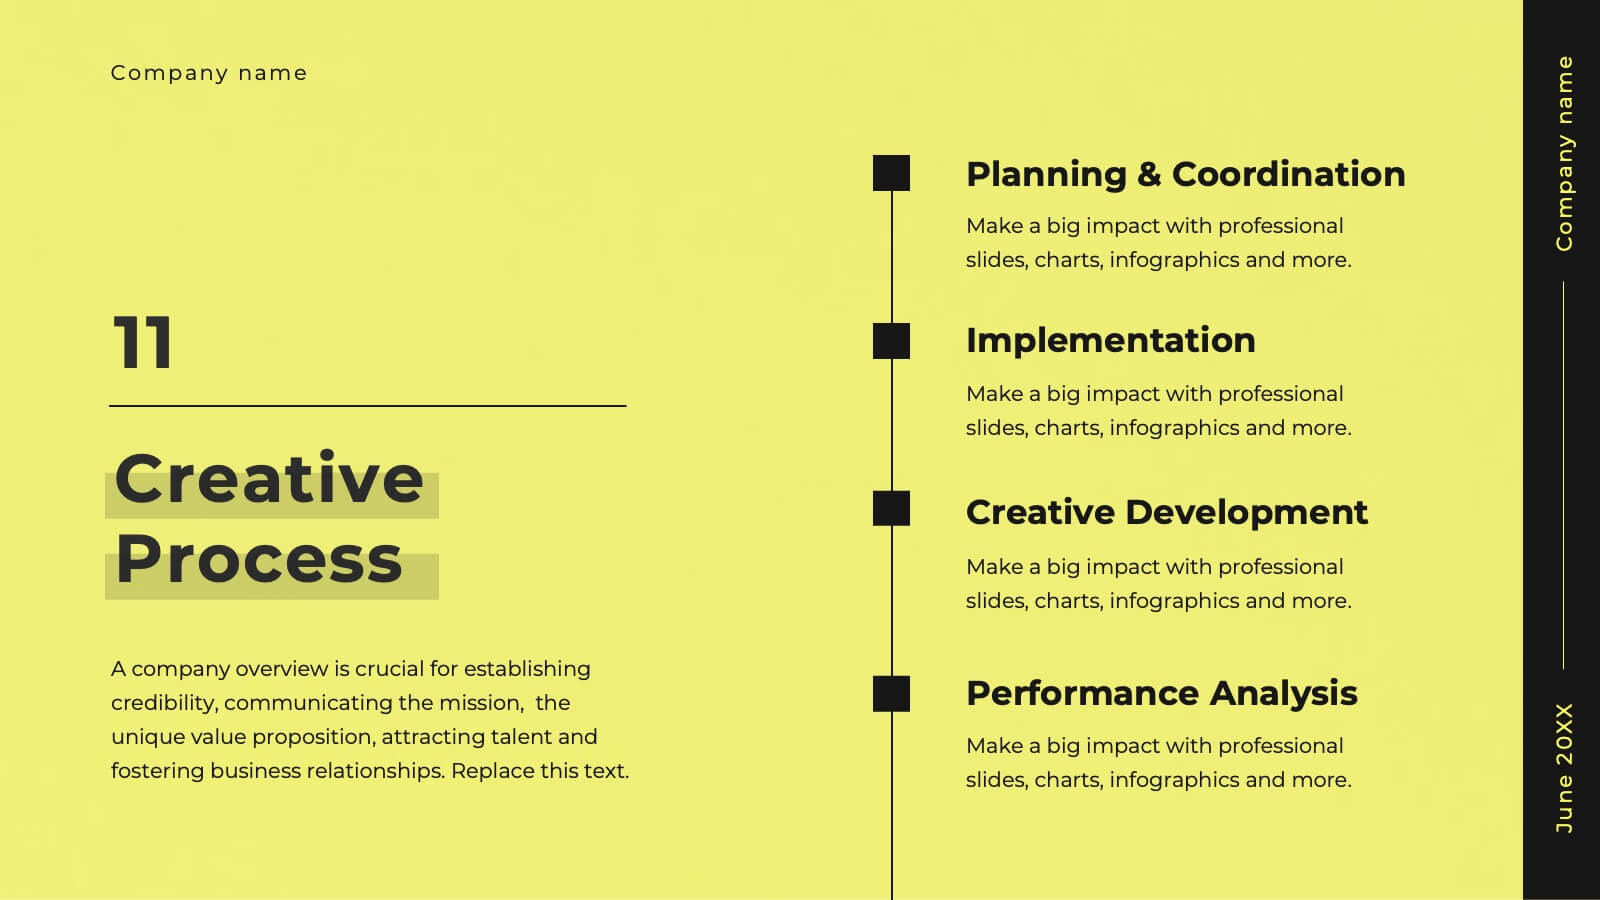
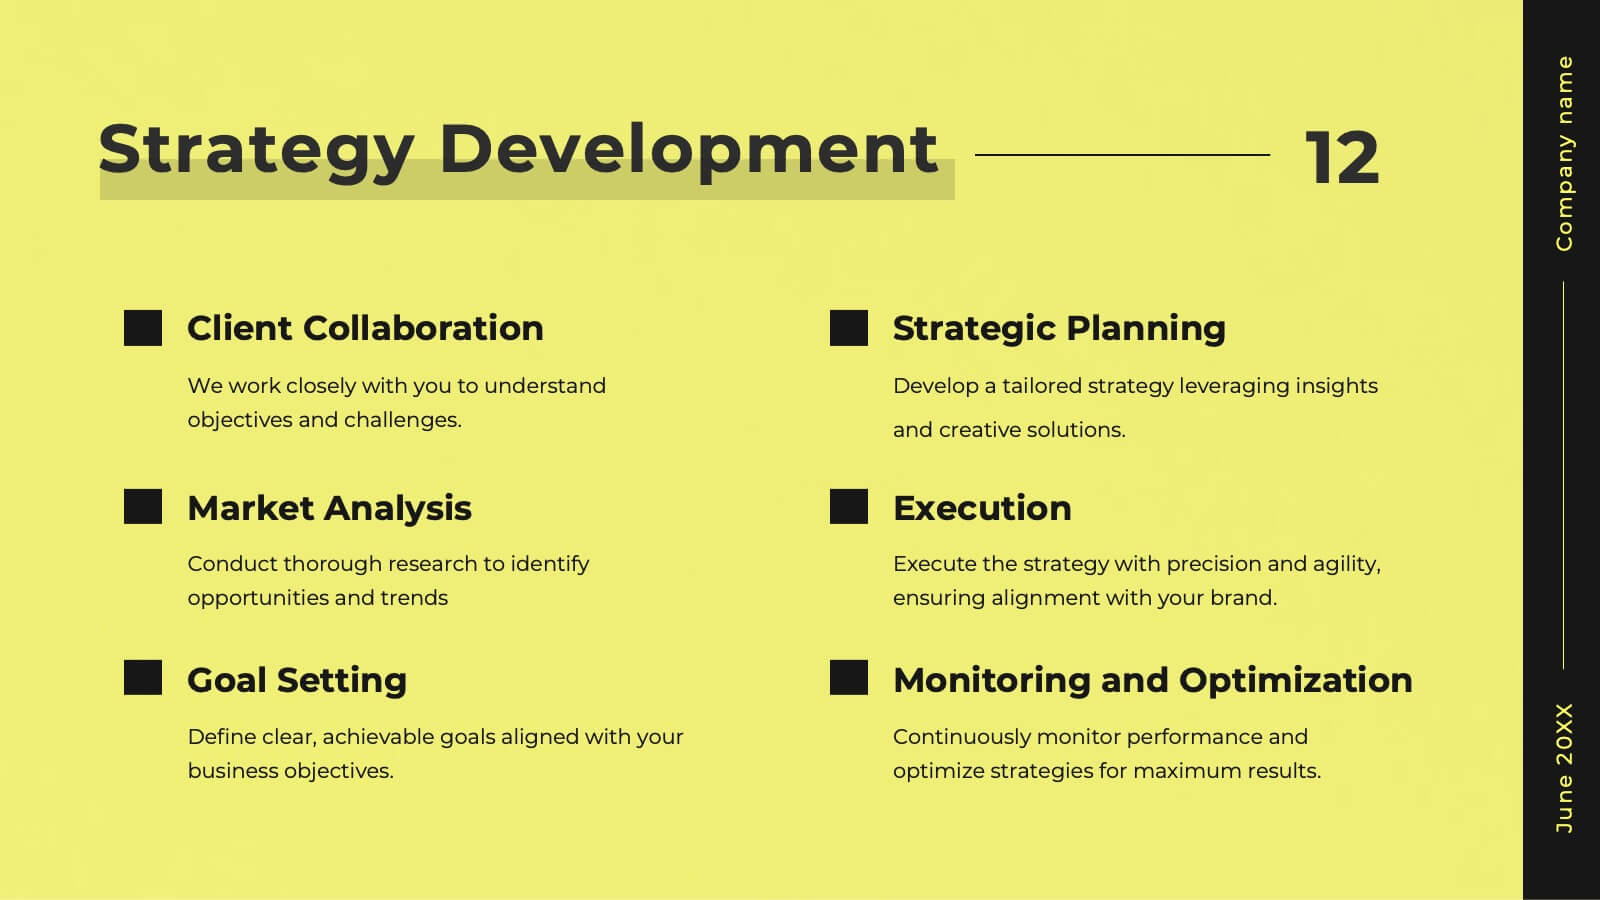
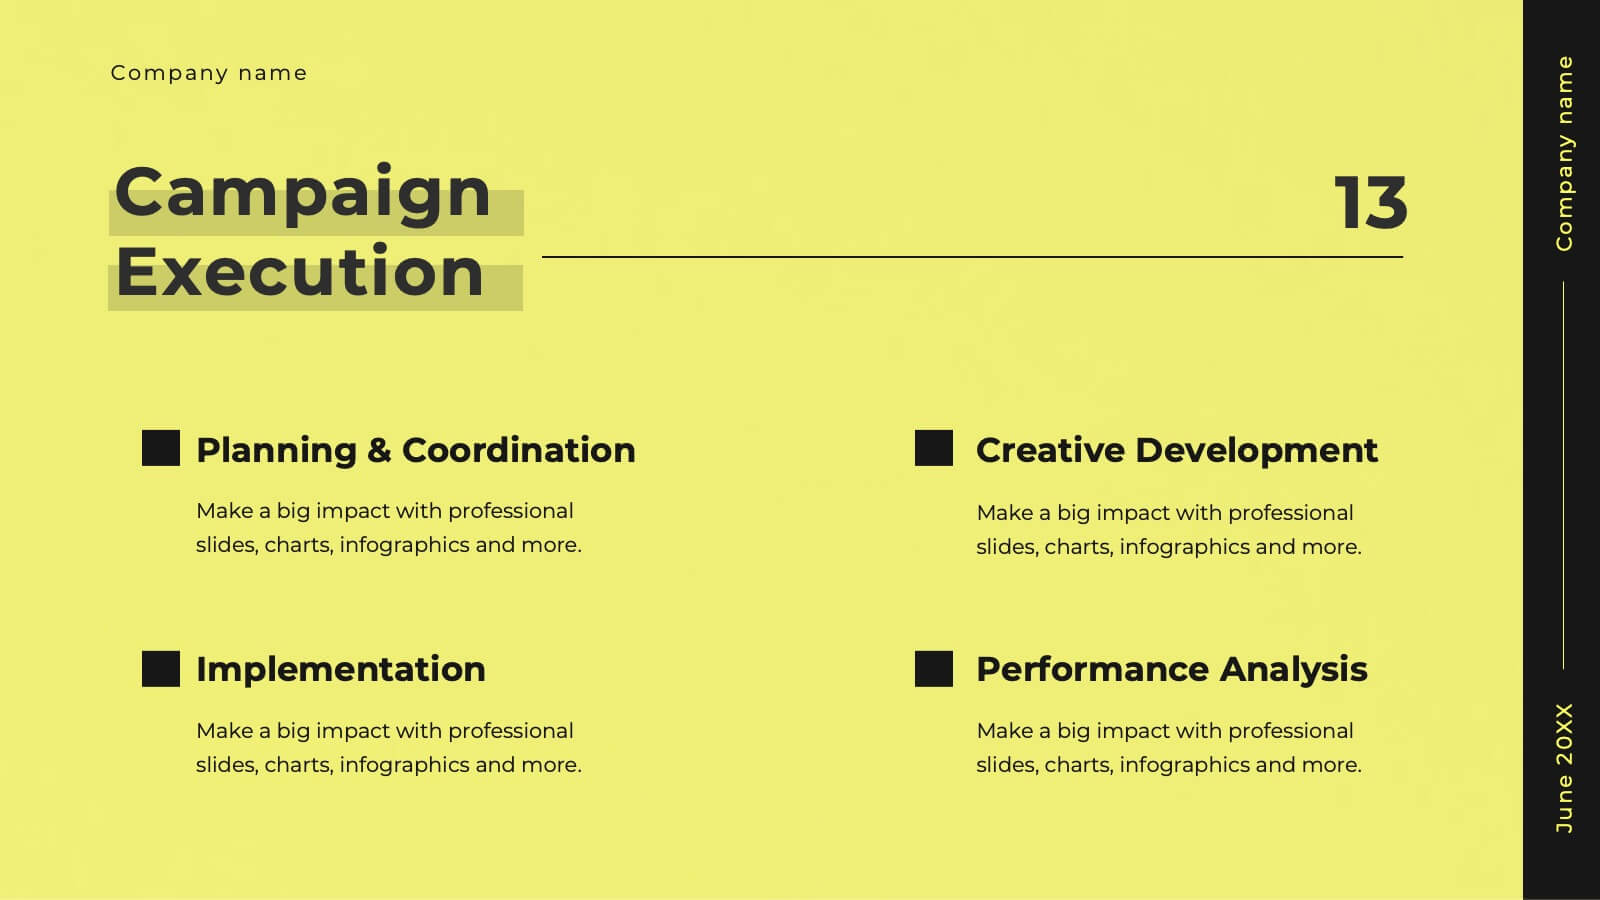
Glimmer Creative Agency Pitch Deck Presentation
Step up your game with this vibrant agency pitch deck template! Ideal for showcasing your services, client success stories, and strategic approach, it includes dynamic slides for market analysis and campaign execution. Engage potential clients with compelling visuals and well-organized content. Compatible with PowerPoint, Keynote, and Google Slides for a smooth presentation experience on any platform.


6 slides
Audience Targeting and Segmentation
Get to know your audience like never before with this human-centered visual layout—ideal for mapping out key segments, demographics, and targeting strategies. Great for marketing plans, user personas, or customer insights presentations, this slide keeps your data visually focused and easy to digest. Fully compatible with PowerPoint, Keynote, and Google Slides.


6 slides
Weekly Task Schedule Presentation
Stay on top of your week with this clean and efficient layout designed to organize daily priorities and action plans. Perfect for tracking goals, meetings, or team deliverables, it keeps productivity front and center. Fully customizable and compatible with PowerPoint, Keynote, and Google Slides for easy professional presentation use.


7 slides
Exponential Growth Infographic
Exponential growth refers to a process where a quantity grows at a consistent percentage rate per unit of time. This infographic template takes your audience on a visual expedition through the marvels of exponential expansion, turning complex data into a clear and engaging narrative. Compatible with Powerpoint, Keynote, and Google Slides. This features dynamic visuals like ascending graphs and vibrant charts, this infographic embodies the essence of exponential growth, making this come alive. Showcase the growth trajectory using ascending line graphs or bar charts, visually representing the skyrocketing growth in a way that's easy to comprehend.


6 slides
Customer Loyalty Program Strategy Presentation
Drive customer engagement and retention with the "Customer Loyalty Program Strategy" presentation template. This template helps you design and present effective loyalty strategies that increase customer lifetime value. Ideal for marketers and business strategists, it is fully compatible with PowerPoint, Keynote, and Google Slides, offering a versatile tool for any presentation need.


6 slides
Big Data Solutions Infographics
Discover the power of Big Data Solutions with our customizable infographic template. This template is fully compatible with popular presentation software like PowerPoint, Keynote, and Google Slides, allowing you to easily customize it to illustrate and communicate various aspects of big data solutions. The Big Data Solutions infographic template offers a visually engaging platform to explain the principles, technologies, and benefits of harnessing big data for insights and decision-making. Whether you're a data professional, business leader, or simply interested in the world of big data, this template provides a user-friendly canvas to create informative presentations and educational materials. Deepen your understanding of Big Data Solutions with this SEO-optimized infographic template, thoughtfully designed for clarity and ease of use. Customize it to showcase data sources, analytics tools, data storage options, and the real-world applications of big data in various industries, ensuring that your audience gains valuable insights into this transformative field. Start crafting your personalized infographic today to explore the world of Big Data Solutions.


8 slides
Lean Business Model Canvas Framework Presentation
Visualize your entire business strategy on a single slide with this Lean Business Model Canvas. Ideal for startups or strategic planning, each editable block represents a key area: value propositions, customer segments, revenue, and more. Streamlined and clear, it's perfect for team alignment or investor-ready business model pitches.


6 slides
Customer Feedback Smile Rating Scale
Visualize customer satisfaction with this editable Smile Rating Scale Presentation. Featuring five emotive icons, it’s perfect for showcasing feedback, survey results, or performance reviews. Fully customizable in PowerPoint, Keynote, and Google Slides, it simplifies data presentation while adding a friendly, professional touch to your report or presentation.


5 slides
Facts About Vegan Infographics
Veganism is a lifestyle and dietary choice that seeks to avoid the use of animal products and by-products. These infographic templates are perfect for showcasing key facts and information about veganism. This allows you to effectively communicate the positive impacts of veganism on health, the environment, and animal welfare. It serves as an engaging and persuasive resource to promote awareness, education, and understanding about the benefits of a vegan lifestyle. The templates features a variety of engaging and eye-catching infographic designs, each focusing on a specific aspect of veganism. Compatible with Powerpoint, Keynote, and Google Slides.


10 slides
Project Budget Breakdown Presentation
The "Project Budget Breakdown Presentation" template offers a clear and efficient way to visualize budget allocations within a project. It uses a visually appealing color scheme that highlights four different budget segments, each represented by a different color to ensure quick readability and easy understanding. The template allows you to illustrate percentages and corresponding financial values, making it straightforward for stakeholders to grasp budget allocations at a glance. This template is highly beneficial for project managers, financial analysts, and business executives who need to present and discuss budgetary details clearly and concisely in project meetings or budget reviews. It is adaptable for use in various industries, including construction, IT, marketing, and research development, supporting effective budget management and transparency.


22 slides
Starlit Agency Portfolio Presentation
The Starlit Agency Portfolio template is a sophisticated way to highlight your agency's expertise, achievements, and creative vision! Perfect for presenting to potential clients or partners, this template starts with a polished introduction and an "About Us" section that clearly defines your agency's mission and vision. Showcase your team's skills and services in an organized manner, making it easy for clients to understand what you offer. With slides dedicated to client success stories, case studies, and market analysis, you can build trust by displaying your proven track record. Highlight industry trends and your agency's approach to creative processes to demonstrate your strategic thinking. The template also includes sections for strategy development, campaign execution, and measurement analytics, ensuring you cover all aspects of your services. Close with client testimonials, partnership opportunities, and a future outlook, leaving your audience impressed. This template is fully compatible with PowerPoint, Keynote, and Google Slides, making it versatile and easy to use for any presentation.


23 slides
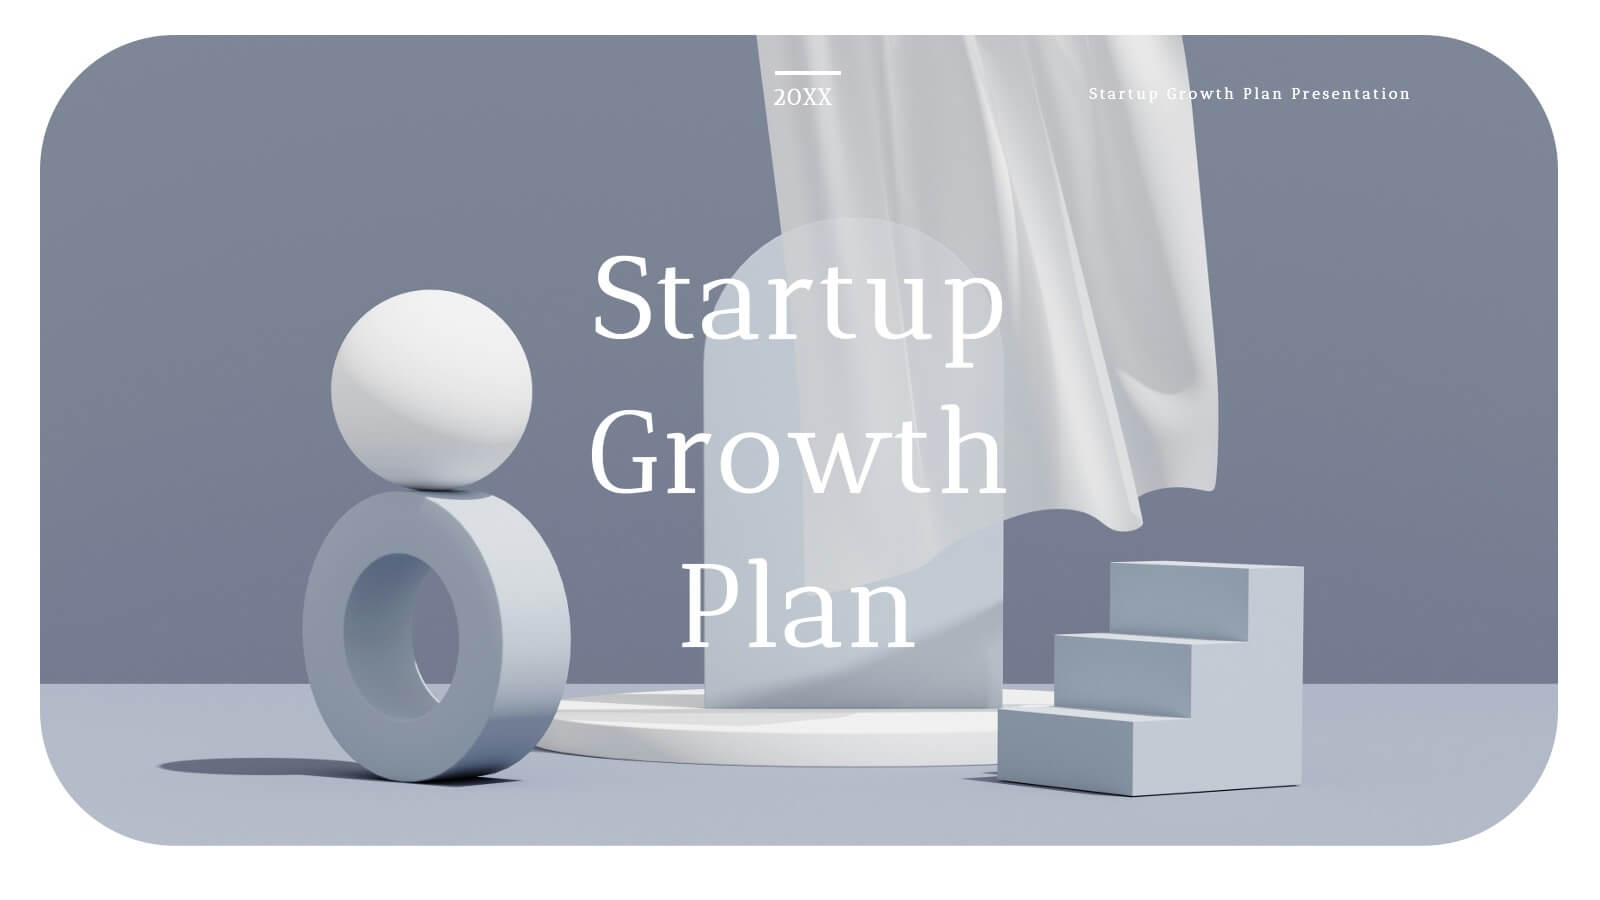
Grecian Startup Growth Plan Presentation
Elevate your pitch with this stunning Grecian-inspired presentation template, perfect for outlining your startup's growth plan! Showcase your business strategy, revenue projections, and scaling opportunities with a clean, elegant design that grabs attention. Impress investors and stakeholders with every slide. Compatible with PowerPoint, Keynote, and Google Slides for seamless customization.


5 slides
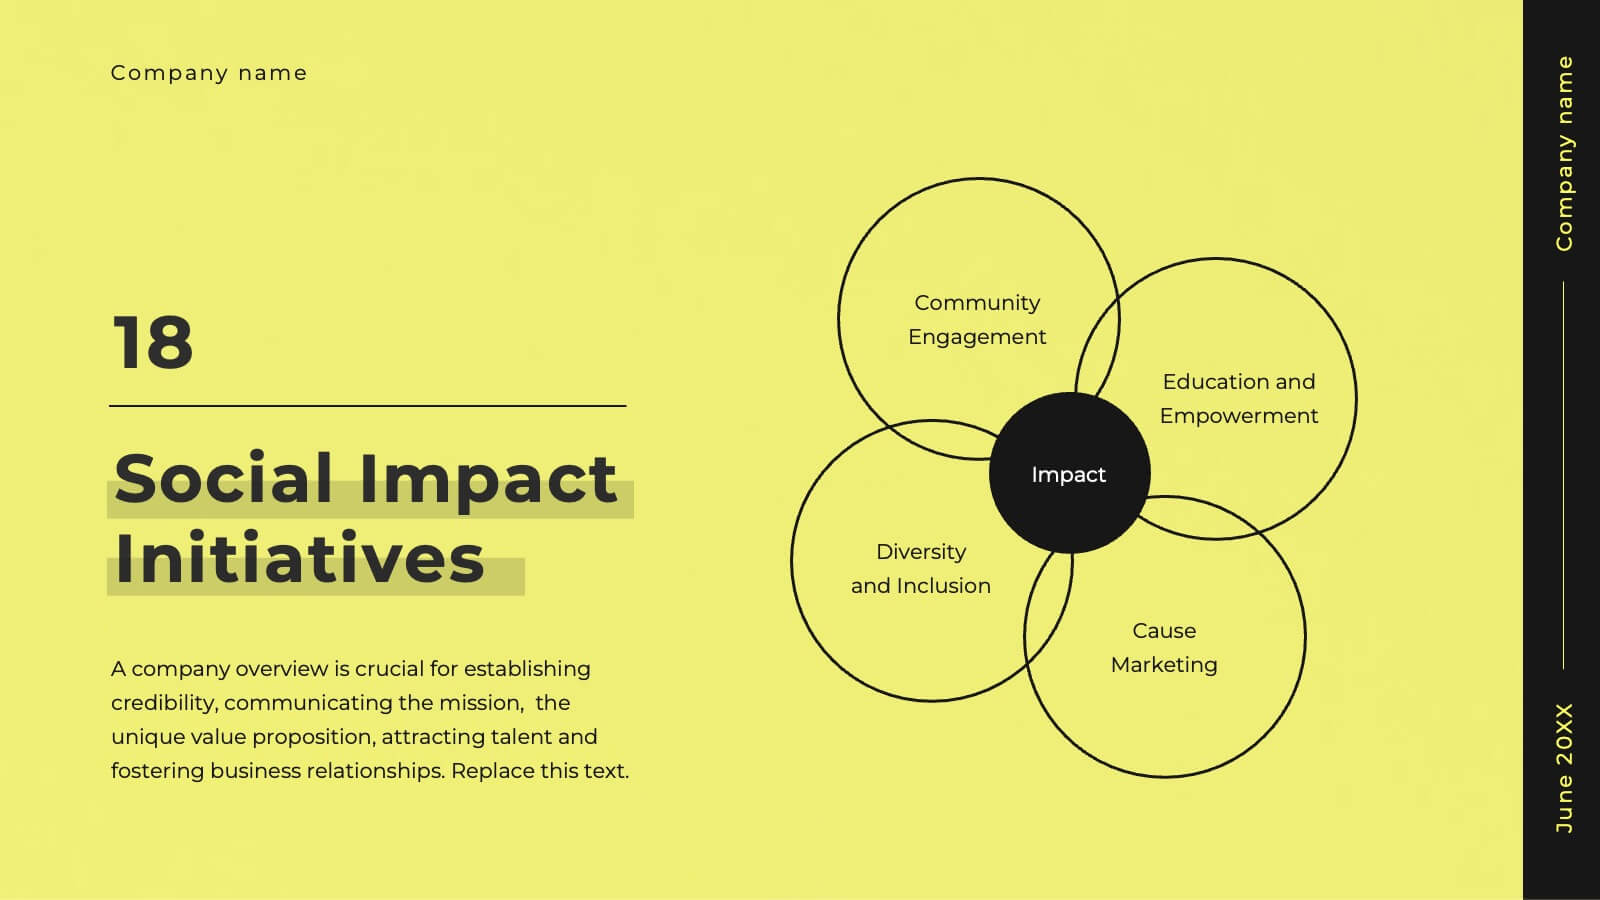
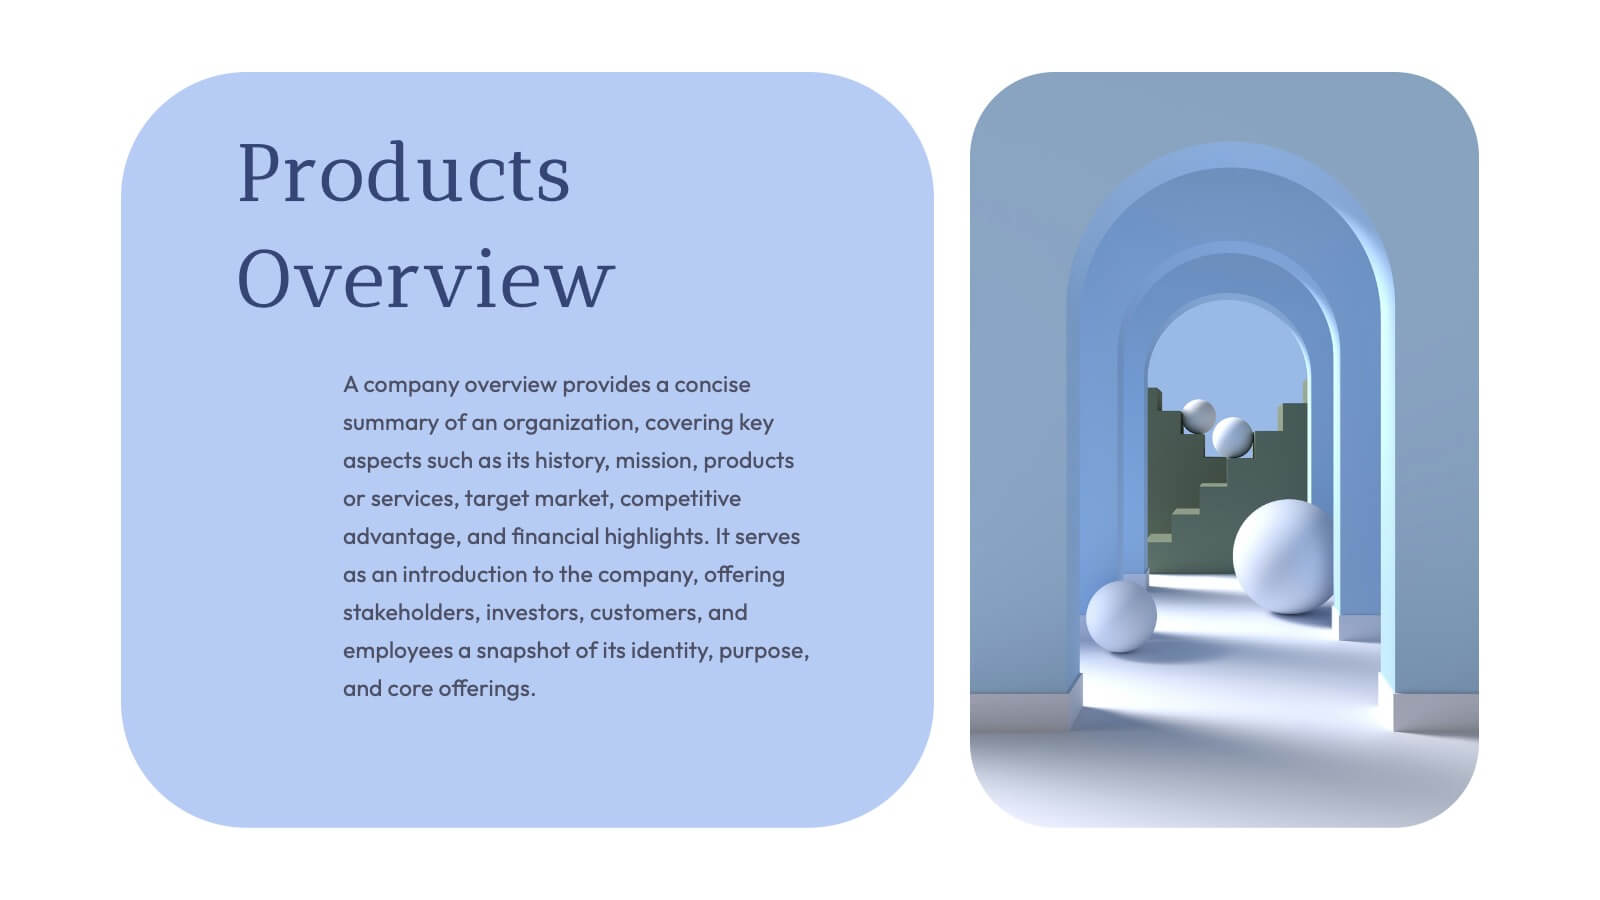
Business Introduction and Company Profile Presentation
Introduce your business with precision and clarity using this company profile layout. Highlight your mission, vision, and key insights alongside sleek visuals and structured content. Perfect for new client onboarding, internal briefings, or stakeholder presentations. Fully editable in PowerPoint, Keynote, and Google Slides for seamless, professional customization.


4 slides
Social Media Calendar Overview
Stay organized and consistent with your posting schedule using the Social Media Calendar Overview Presentation. This clean, visual weekly planner helps you map out daily content across multiple categories with color-coded bullets and structured columns from Monday to Sunday. Perfect for content teams, marketers, and freelancers managing multi-platform campaigns. Fully customizable in PowerPoint, Keynote, and Google Slides.


4 slides
5G Tech Use Cases and Industry Impact Presentation
Step into the future with this modern, tech-focused layout designed to simplify complex 5G use case presentations. Ideal for showcasing industry-specific impacts, this infographic-style slide makes your data look clean and professional. Fully editable and compatible with PowerPoint, Keynote, and Google Slides for seamless customization.


6 slides
Real Estate and Building Development Presentation
Present key insights into the real estate market with the Real Estate and Building Development template. Designed for property investors and urban planners, this visual framework highlights financial trends, project phases, and market analysis. Fully customizable and compatible with PowerPoint, Keynote, and Google Slides for seamless presentation delivery.