


Features
- 6 Unique slides
- Fully editable and easy to edit in Microsoft Powerpoint, Keynote and Google Slides
- 16:9 widescreen layout
- Clean and professional designs
- Export to JPG, PDF or send by email


Do you have any questions?
Recommend


21 slides
Sungrove Startup Strategy Presentation
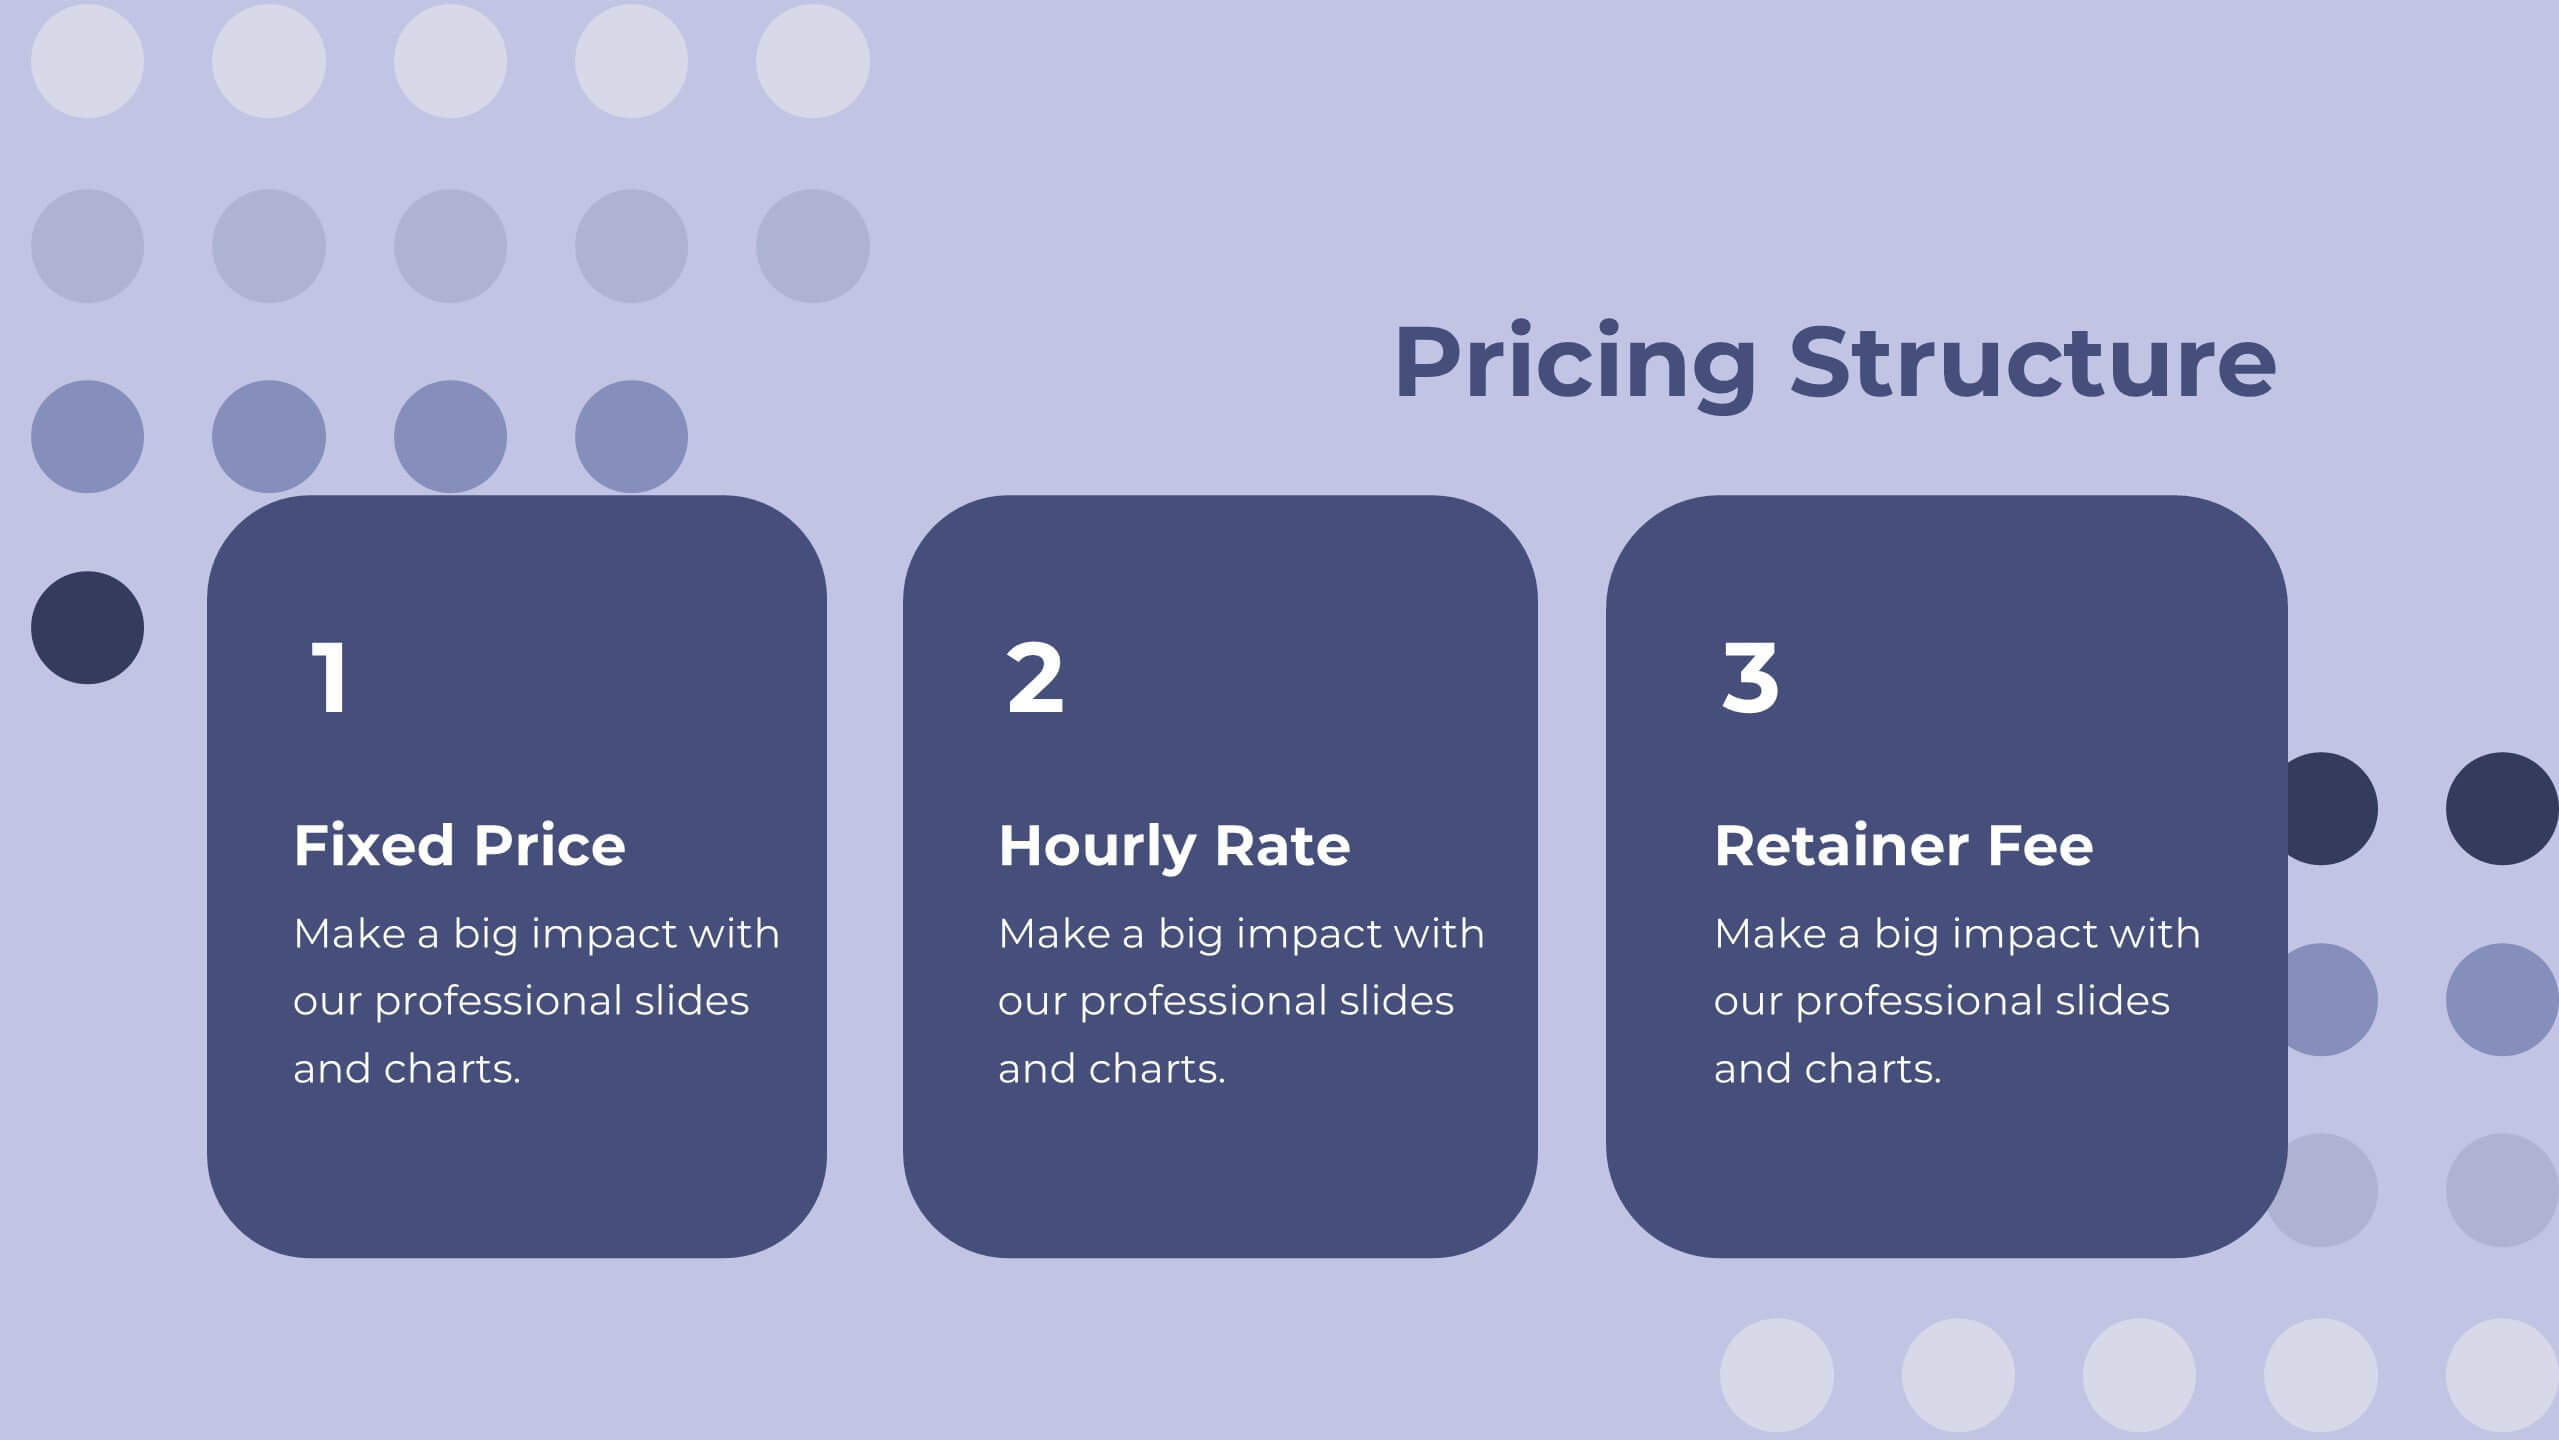
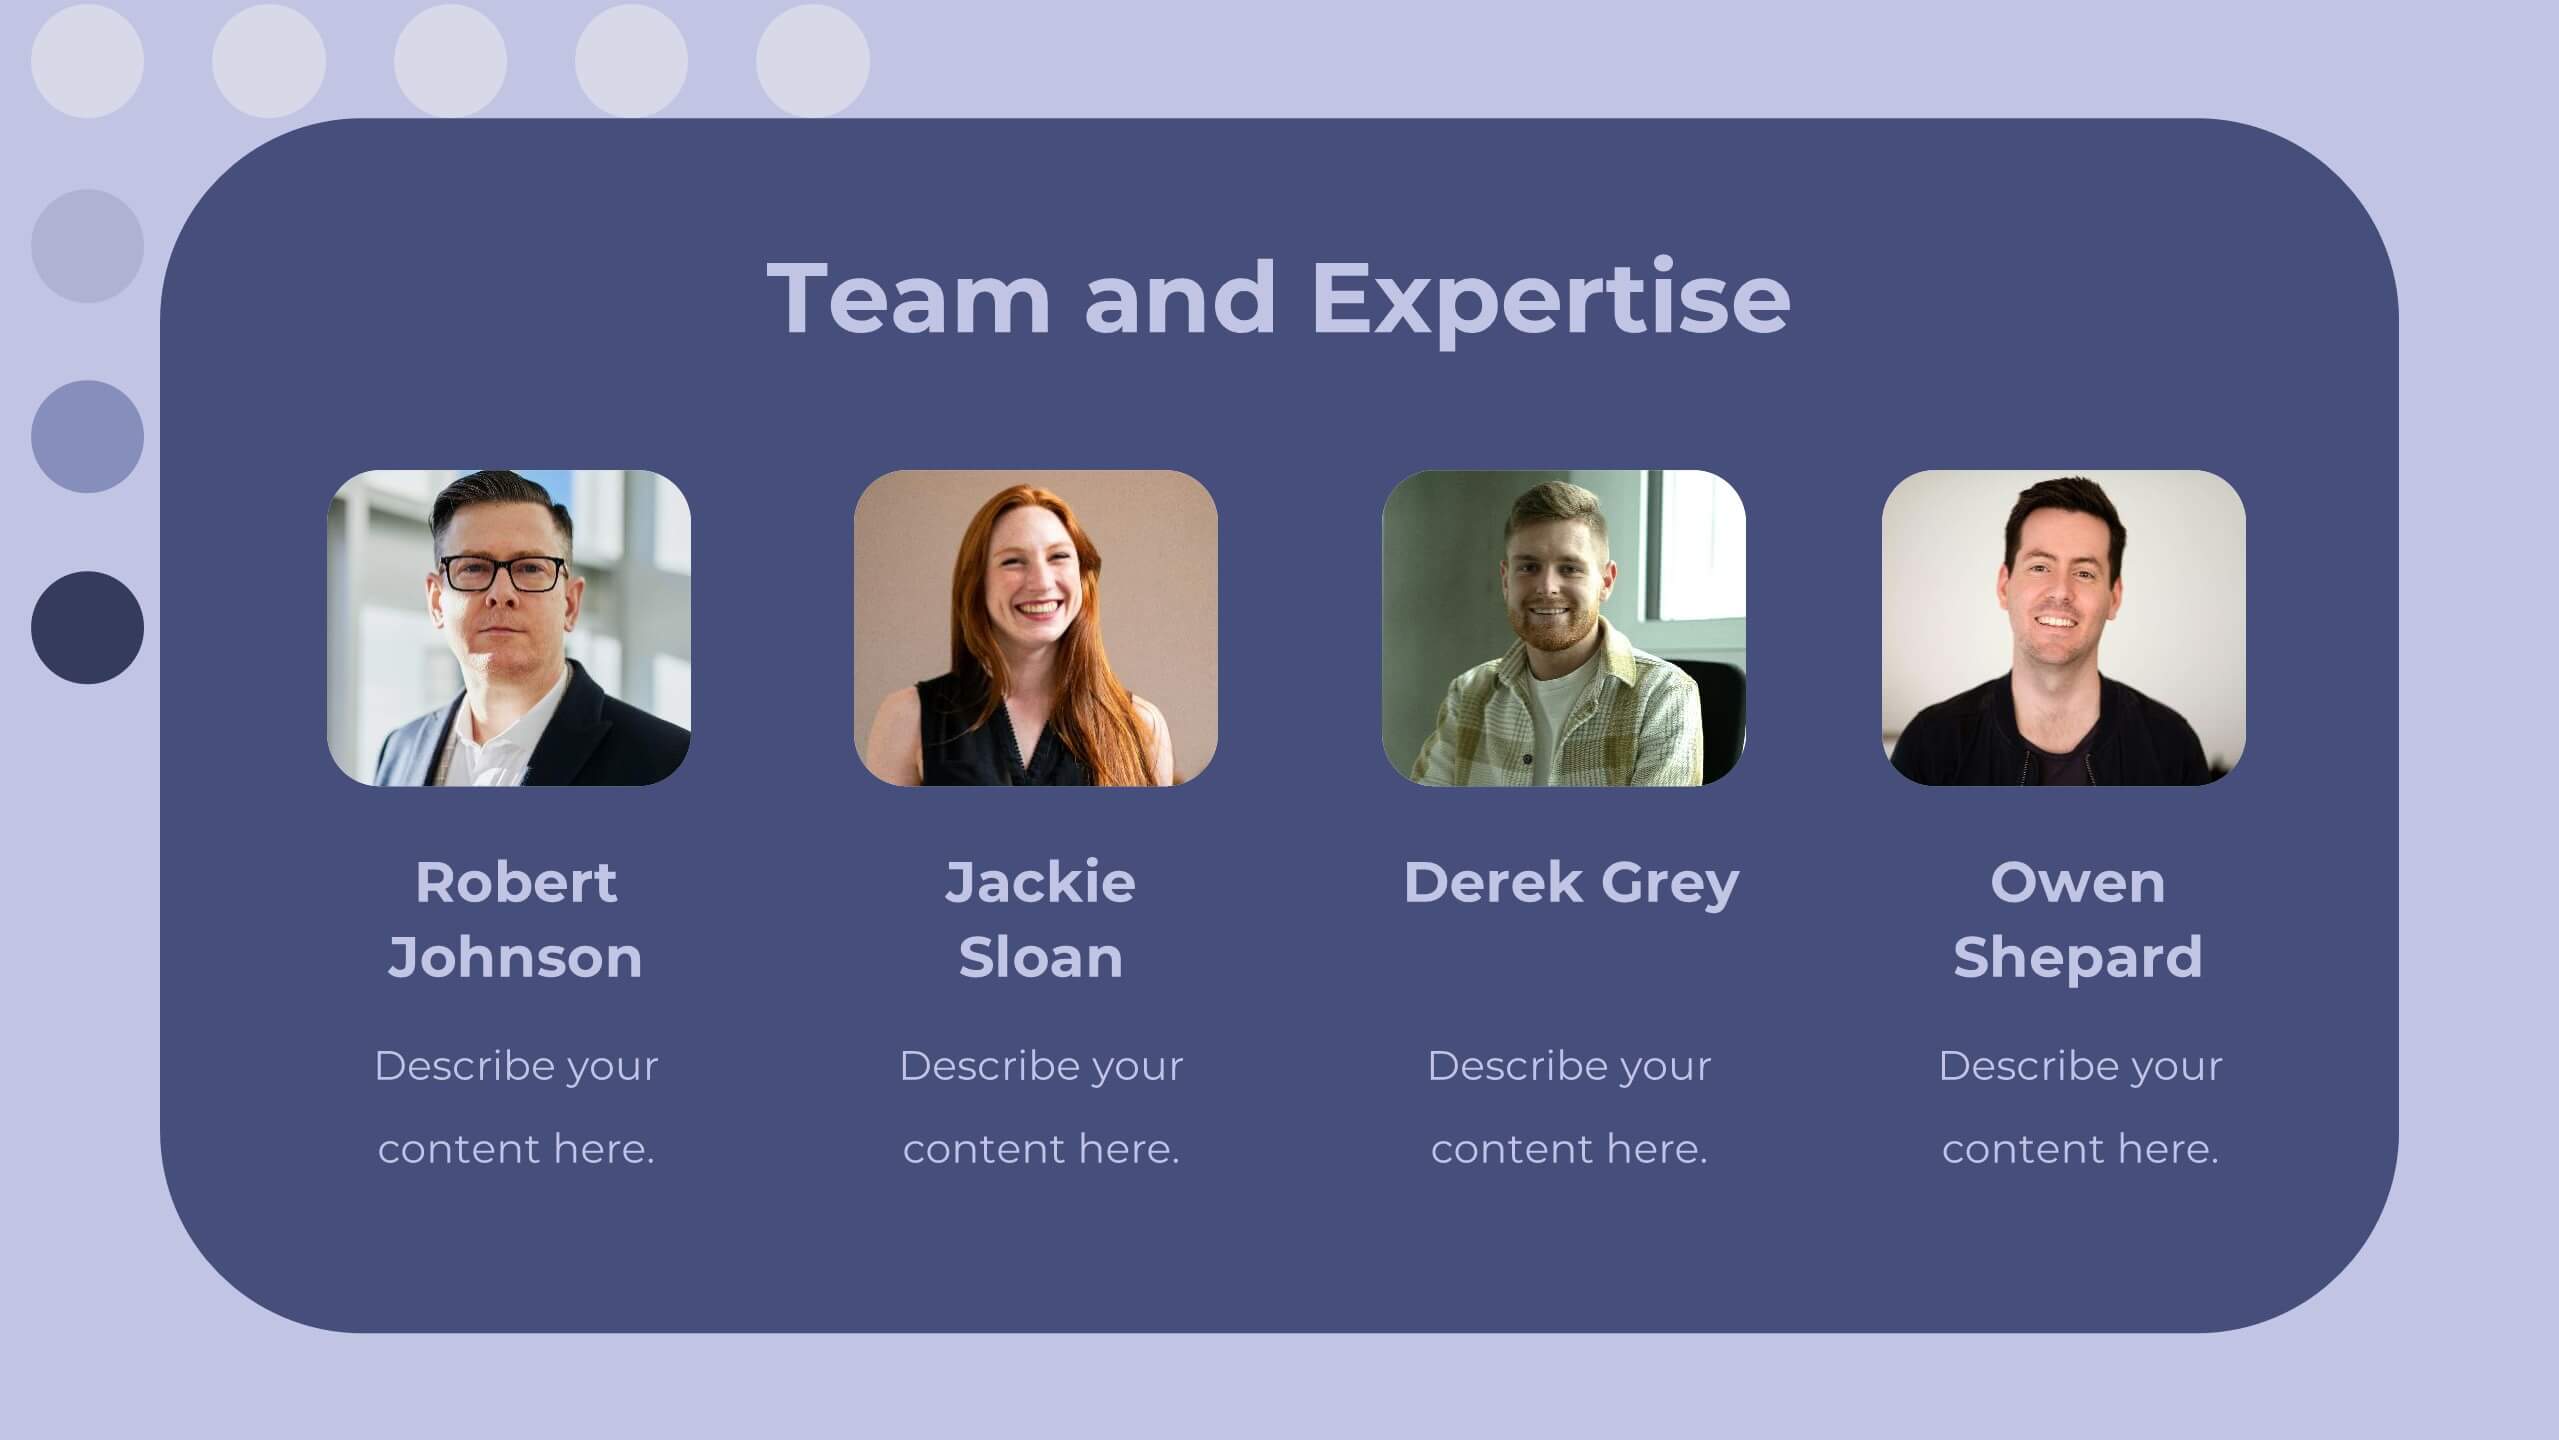
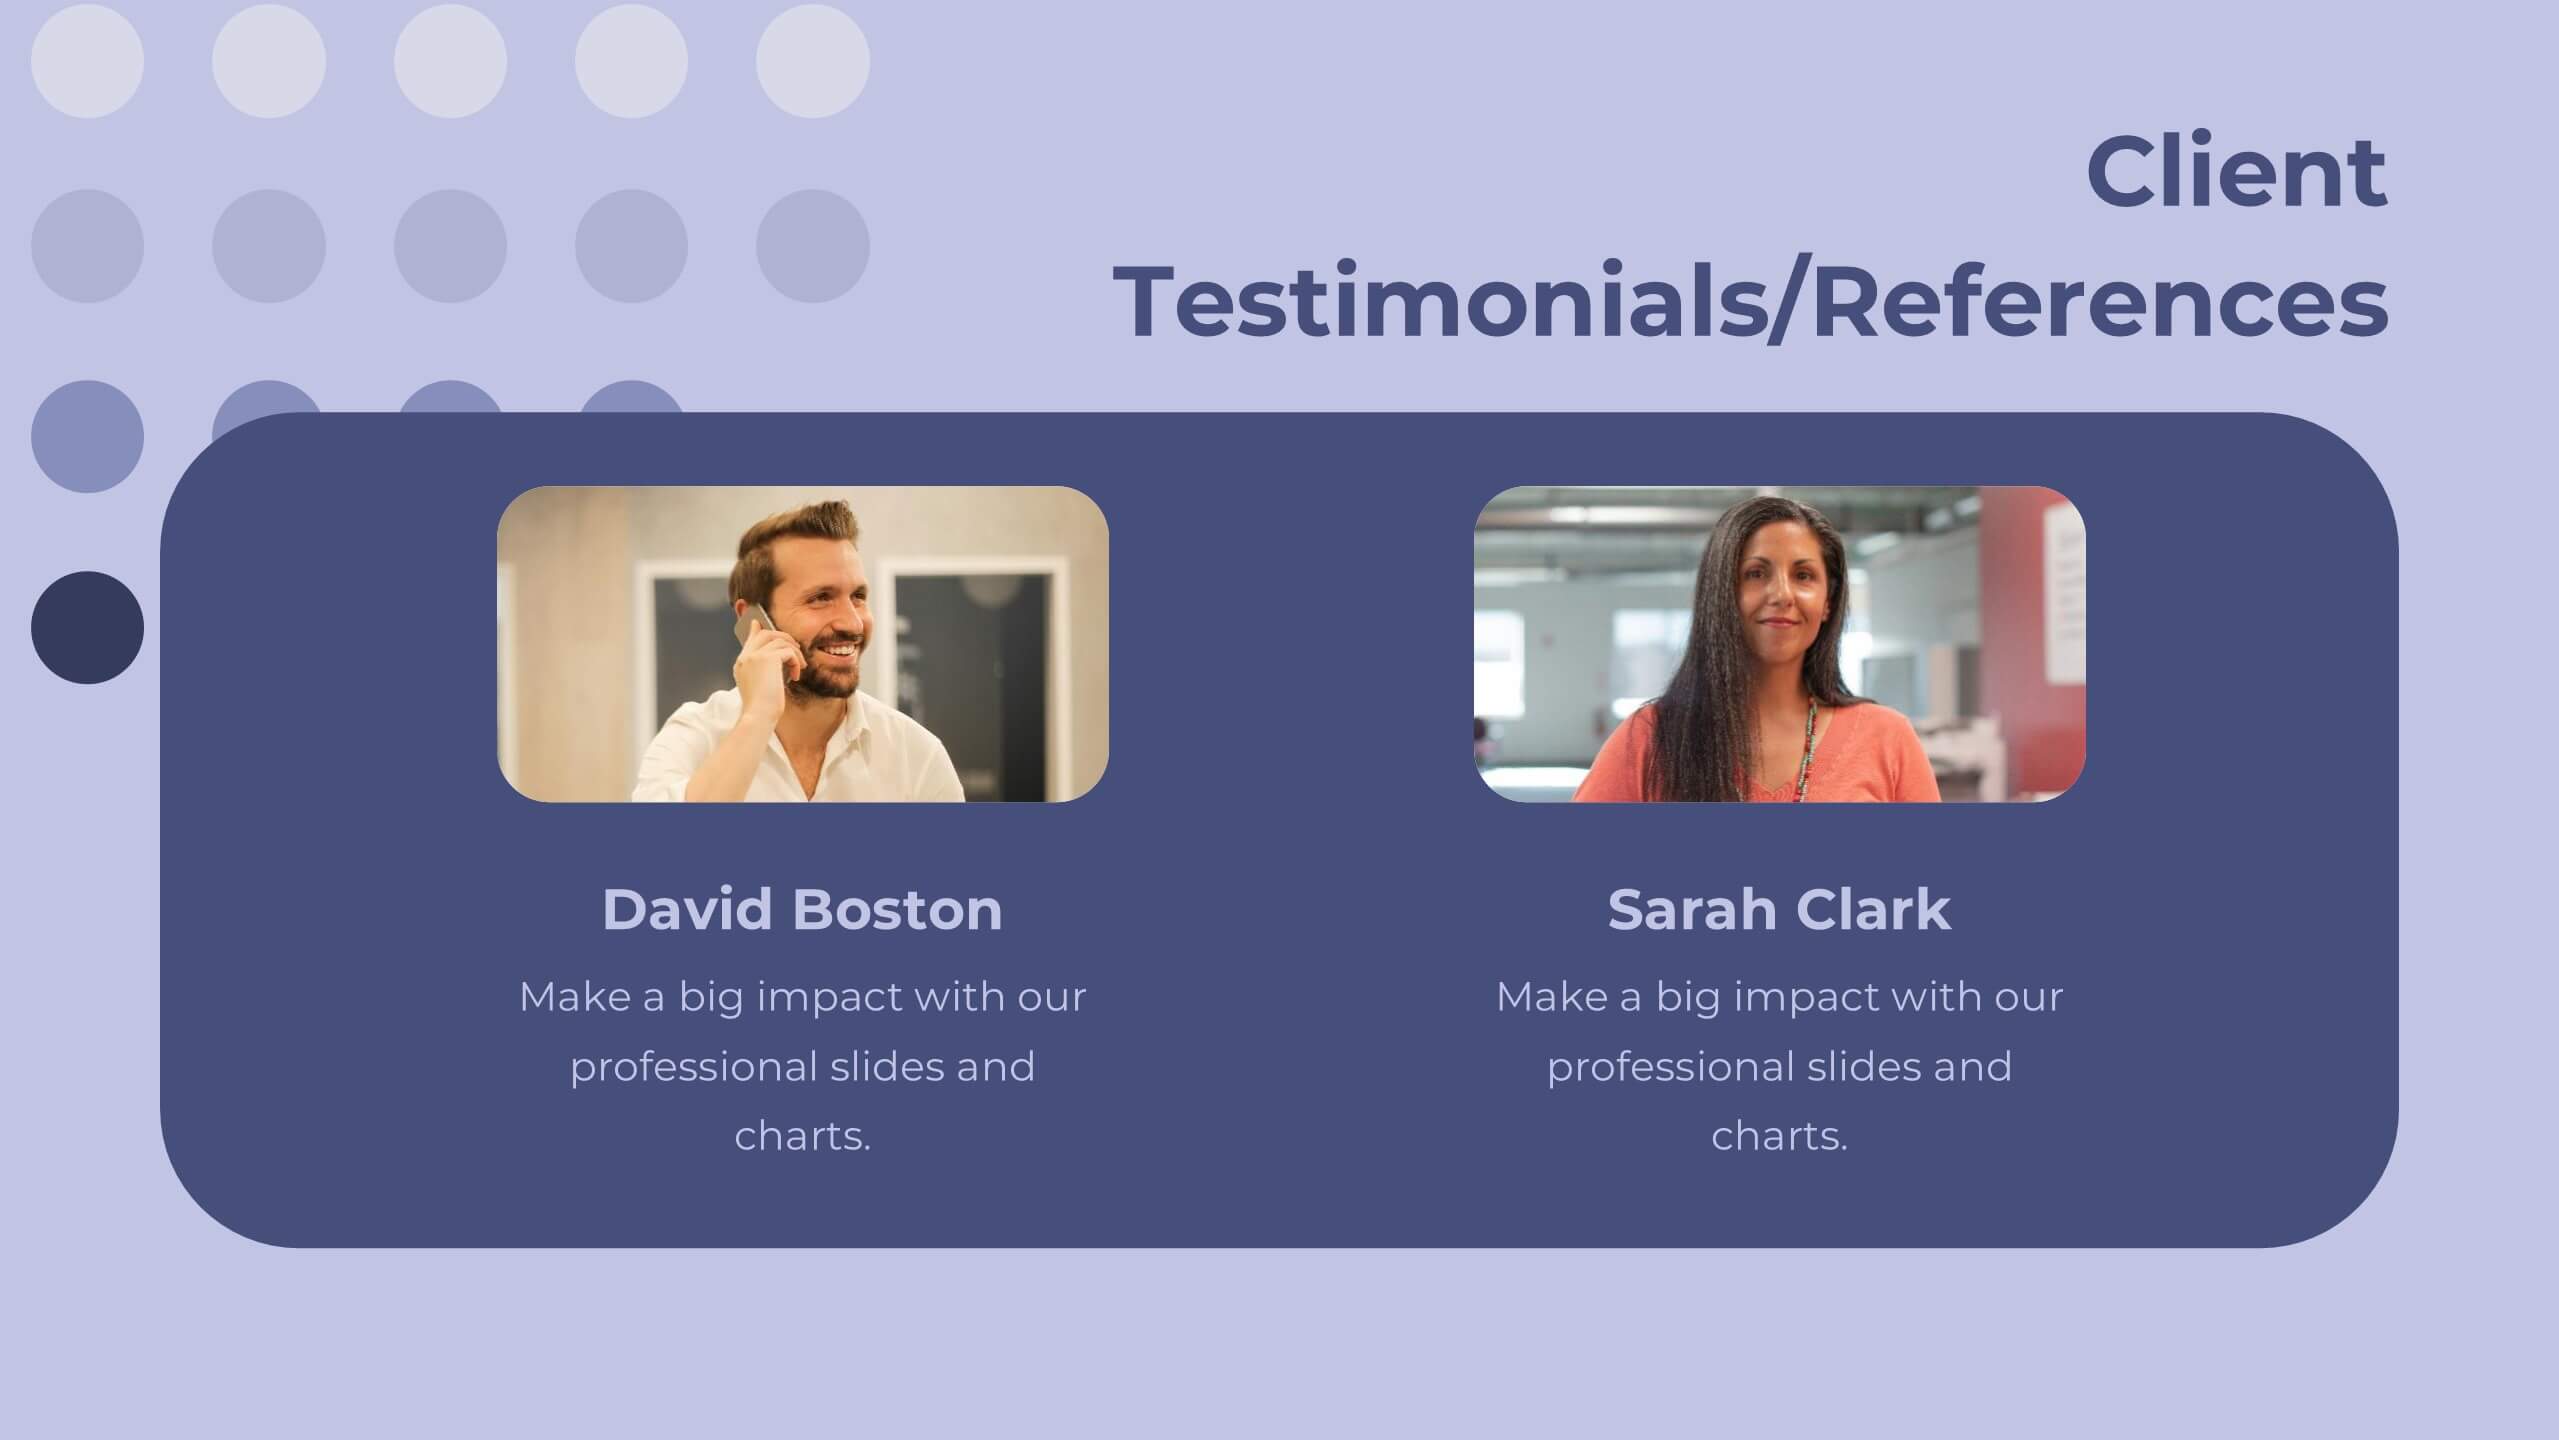
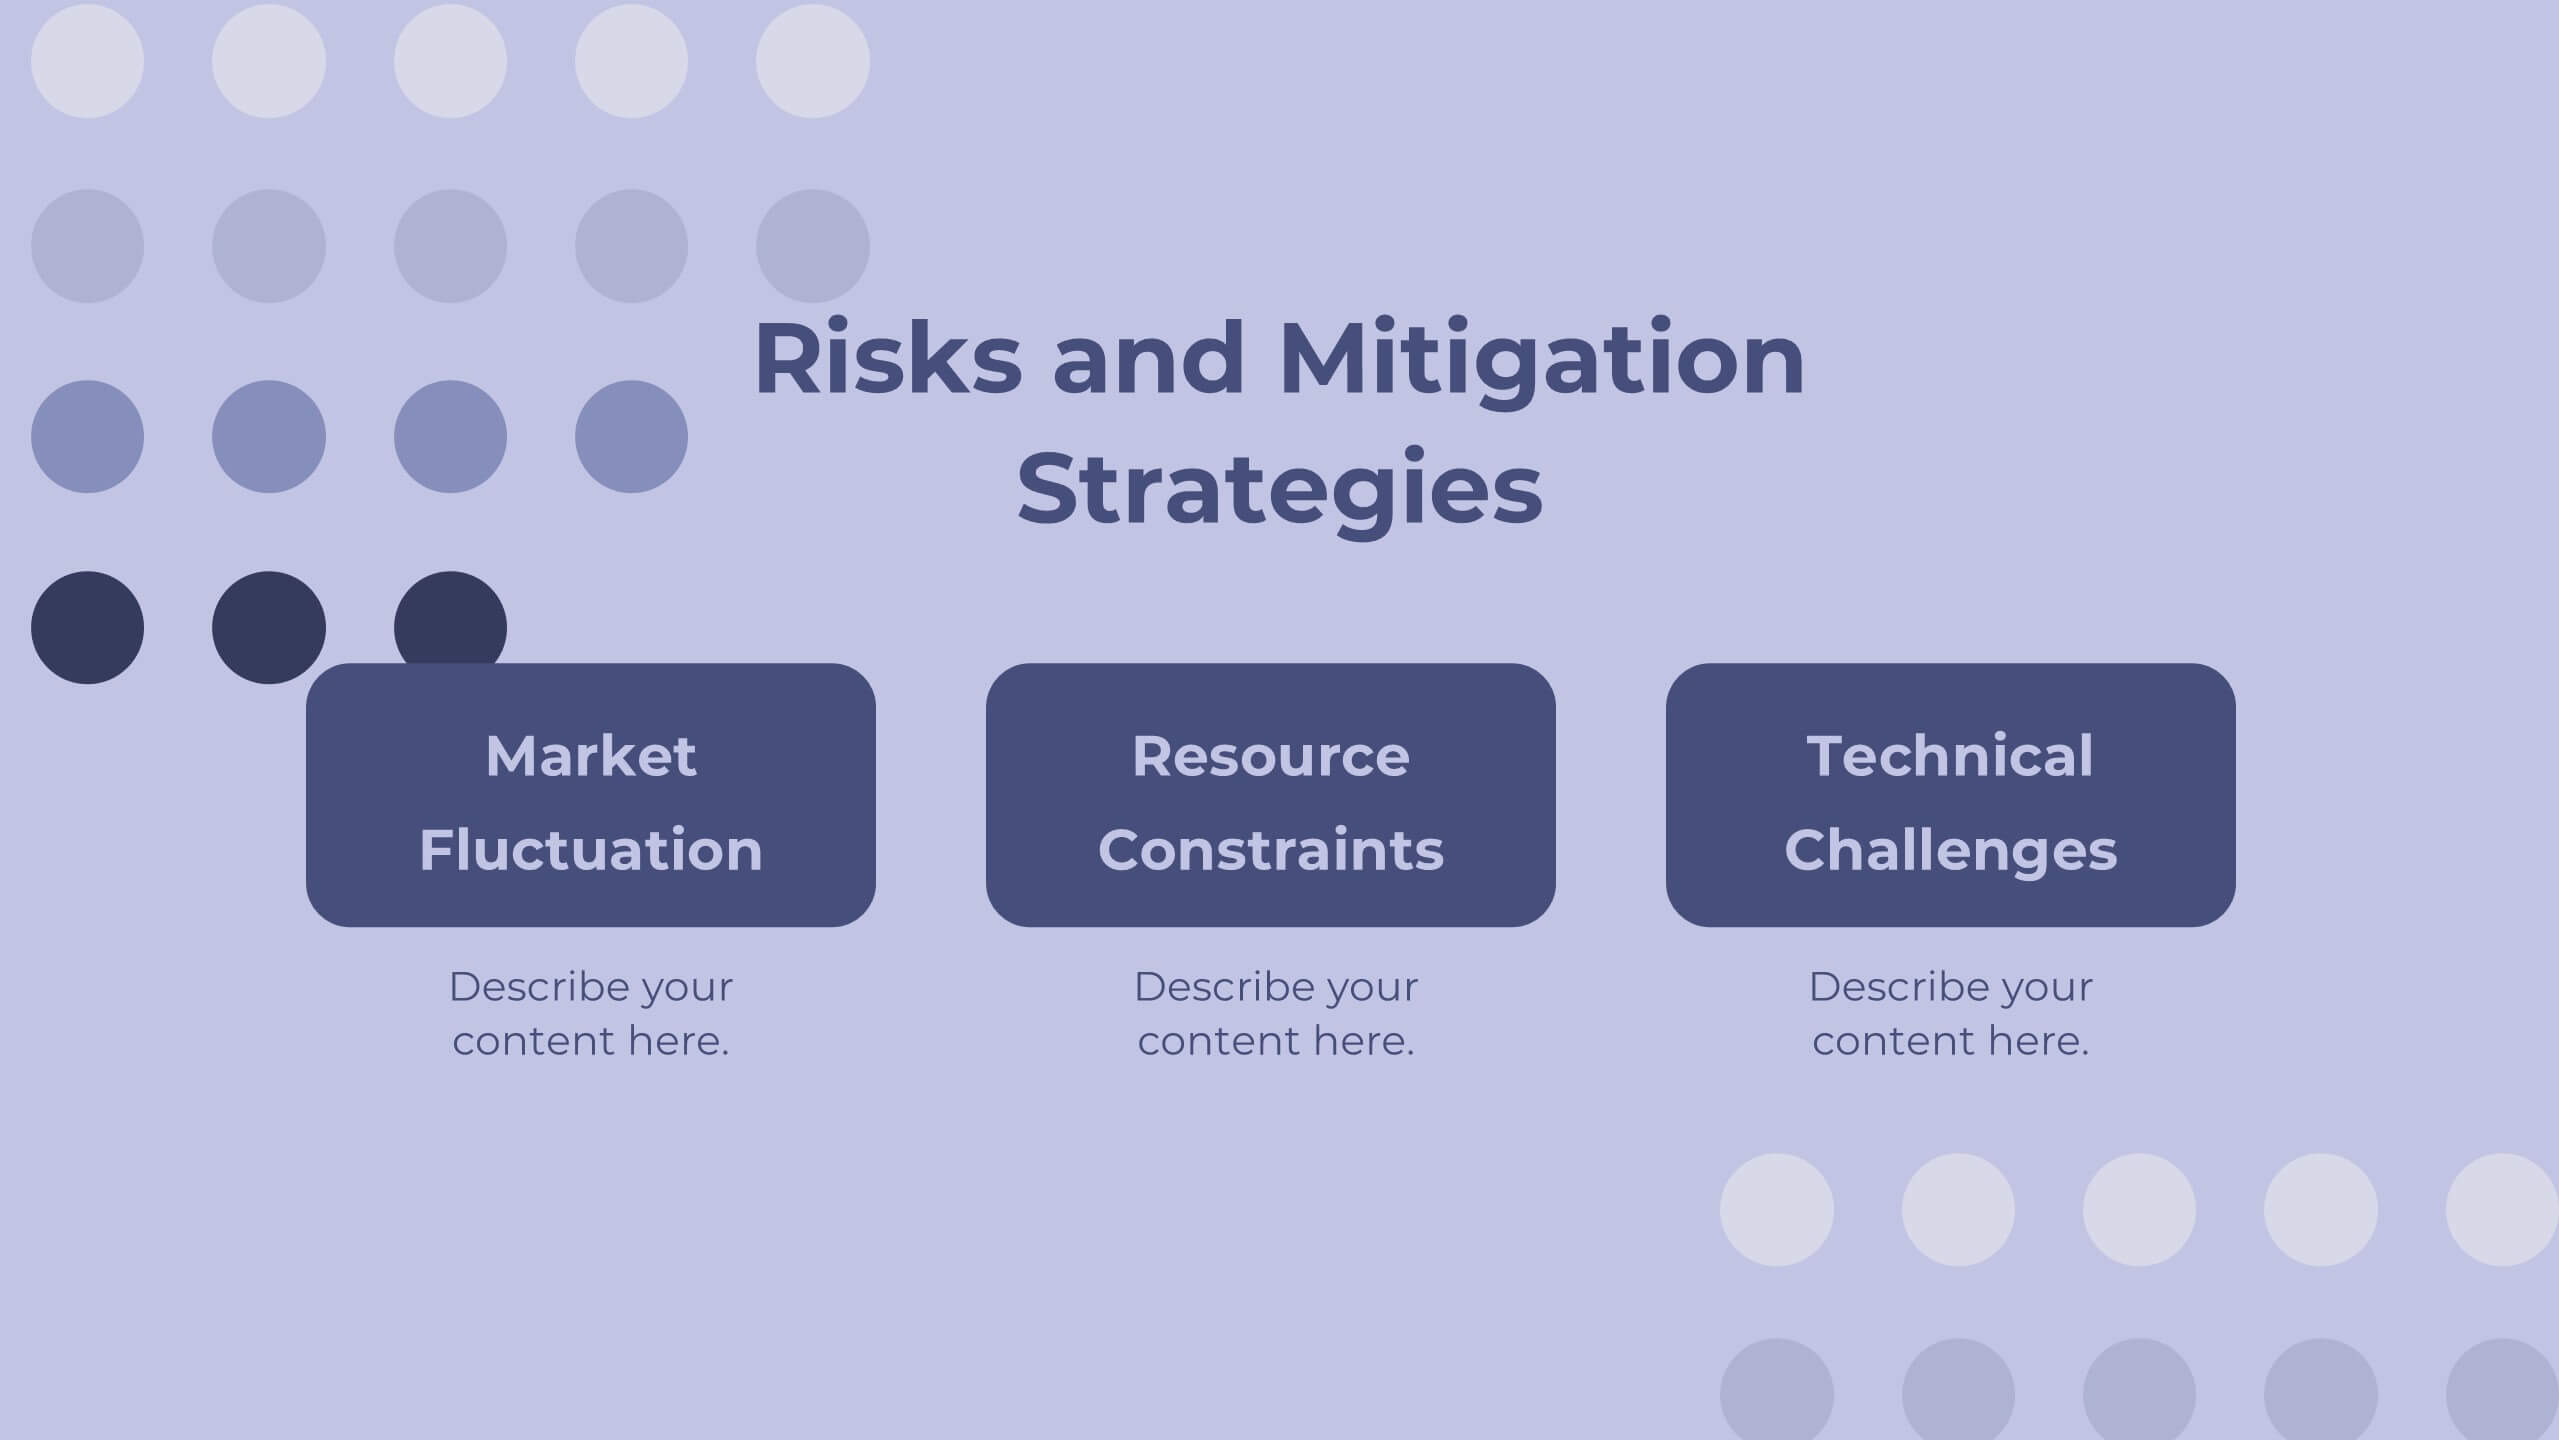
Define and present your startup strategy with this sleek and dynamic template, tailored for showcasing innovative plans and competitive positioning. Dive into key slides like customer needs and market insights, business model breakdown, and unique value proposition to clearly outline your vision. Highlight target market analysis, financial forecasts, and growth projections to ensure stakeholders grasp the potential of your business. The template also includes sections for team introductions, infrastructure planning, and competitor landscape analysis to give a holistic overview of your strategy. Designed for customization and compatibility with PowerPoint, Google Slides, and Keynote, this template is perfect for entrepreneurs or startups aiming to deliver a compelling presentation.


10 slides
Risk Management Plan Presentation
The "Risk Management Plan Presentation" template is designed to outline strategic steps for identifying, assessing, managing, and monitoring business risks. Each segment of the plan is clearly labeled and represented on a segmented wheel, with A identifying risks, B assessing them, C managing responses, and D monitoring and reporting outcomes. The clean and straightforward design ensures key risk management strategies are communicated effectively to stakeholders. This visual tool is perfect for business meetings or training sessions, helping teams understand their roles in mitigating risks and ensuring that the business maintains a proactive approach to challenges.


7 slides
Law and Compliance Presentation
Bring order and precision to your reports with this modern, structured layout designed to simplify complex regulations and policies. Perfect for presenting legal processes, compliance updates, or governance strategies, it blends professionalism with clarity. Fully compatible with PowerPoint, Keynote, and Google Slides for seamless editing and presentation flexibility.


6 slides
Interview Question Infographic
Illuminate the path to insightful dialogue with our sleek Infographic Template, a visual masterpiece designed to make every question count! With its chic, minimalist design, this template pairs clean lines and soft colors to create an environment where information stands out and engagement flourishes. Perfect for those looking to elevate dialogue, whether through educational content, team meetings, or customer interactions, this tool makes communication clear and effective. It elegantly balances text and imagery, turning complex questions into easy-to-understand visuals that captivate and inform. Adaptable to various contexts, this template allows for full customization to match your brand’s aesthetic, ensuring that your message not only resonates but also reflects your unique style. Ideal for use in digital forums, presentations, or as part of interactive guides, it ensures your points are both seen and remembered, making every interaction more meaningful.


21 slides
Mistrain Marketing Research Report Presentation
Present complex marketing research data with a visually engaging and structured template. This presentation design simplifies the process of showcasing company history, market presence, target audience insights, and competitive landscape analysis. With sections for financial highlights, growth plans, and client testimonials, it supports a comprehensive storytelling approach. Featuring clean layouts and aesthetic visuals, this template is ideal for presenting research findings, marketing plans, or audience insights to stakeholders. Fully customizable and compatible with PowerPoint, Google Slides, and Keynote, it ensures a seamless and professional presentation experience. Perfect for businesses, agencies, and professionals aiming to make impactful impressions.


6 slides
Business Process Checklist Overview Presentation
Simplify your workflow presentations with the Business Process Checklist Overview Presentation. This circular layout is ideal for outlining five sequential or cyclical steps in a business process, featuring icon-labeled checkpoints and editable titles. Each step is visually marked with subtle checkmarks, making it perfect for status tracking, task progression, or implementation plans. Clean, professional, and fully customizable in PowerPoint, Keynote, and Google Slides.
20 slides
Labyrinth Project Proposal Presentation
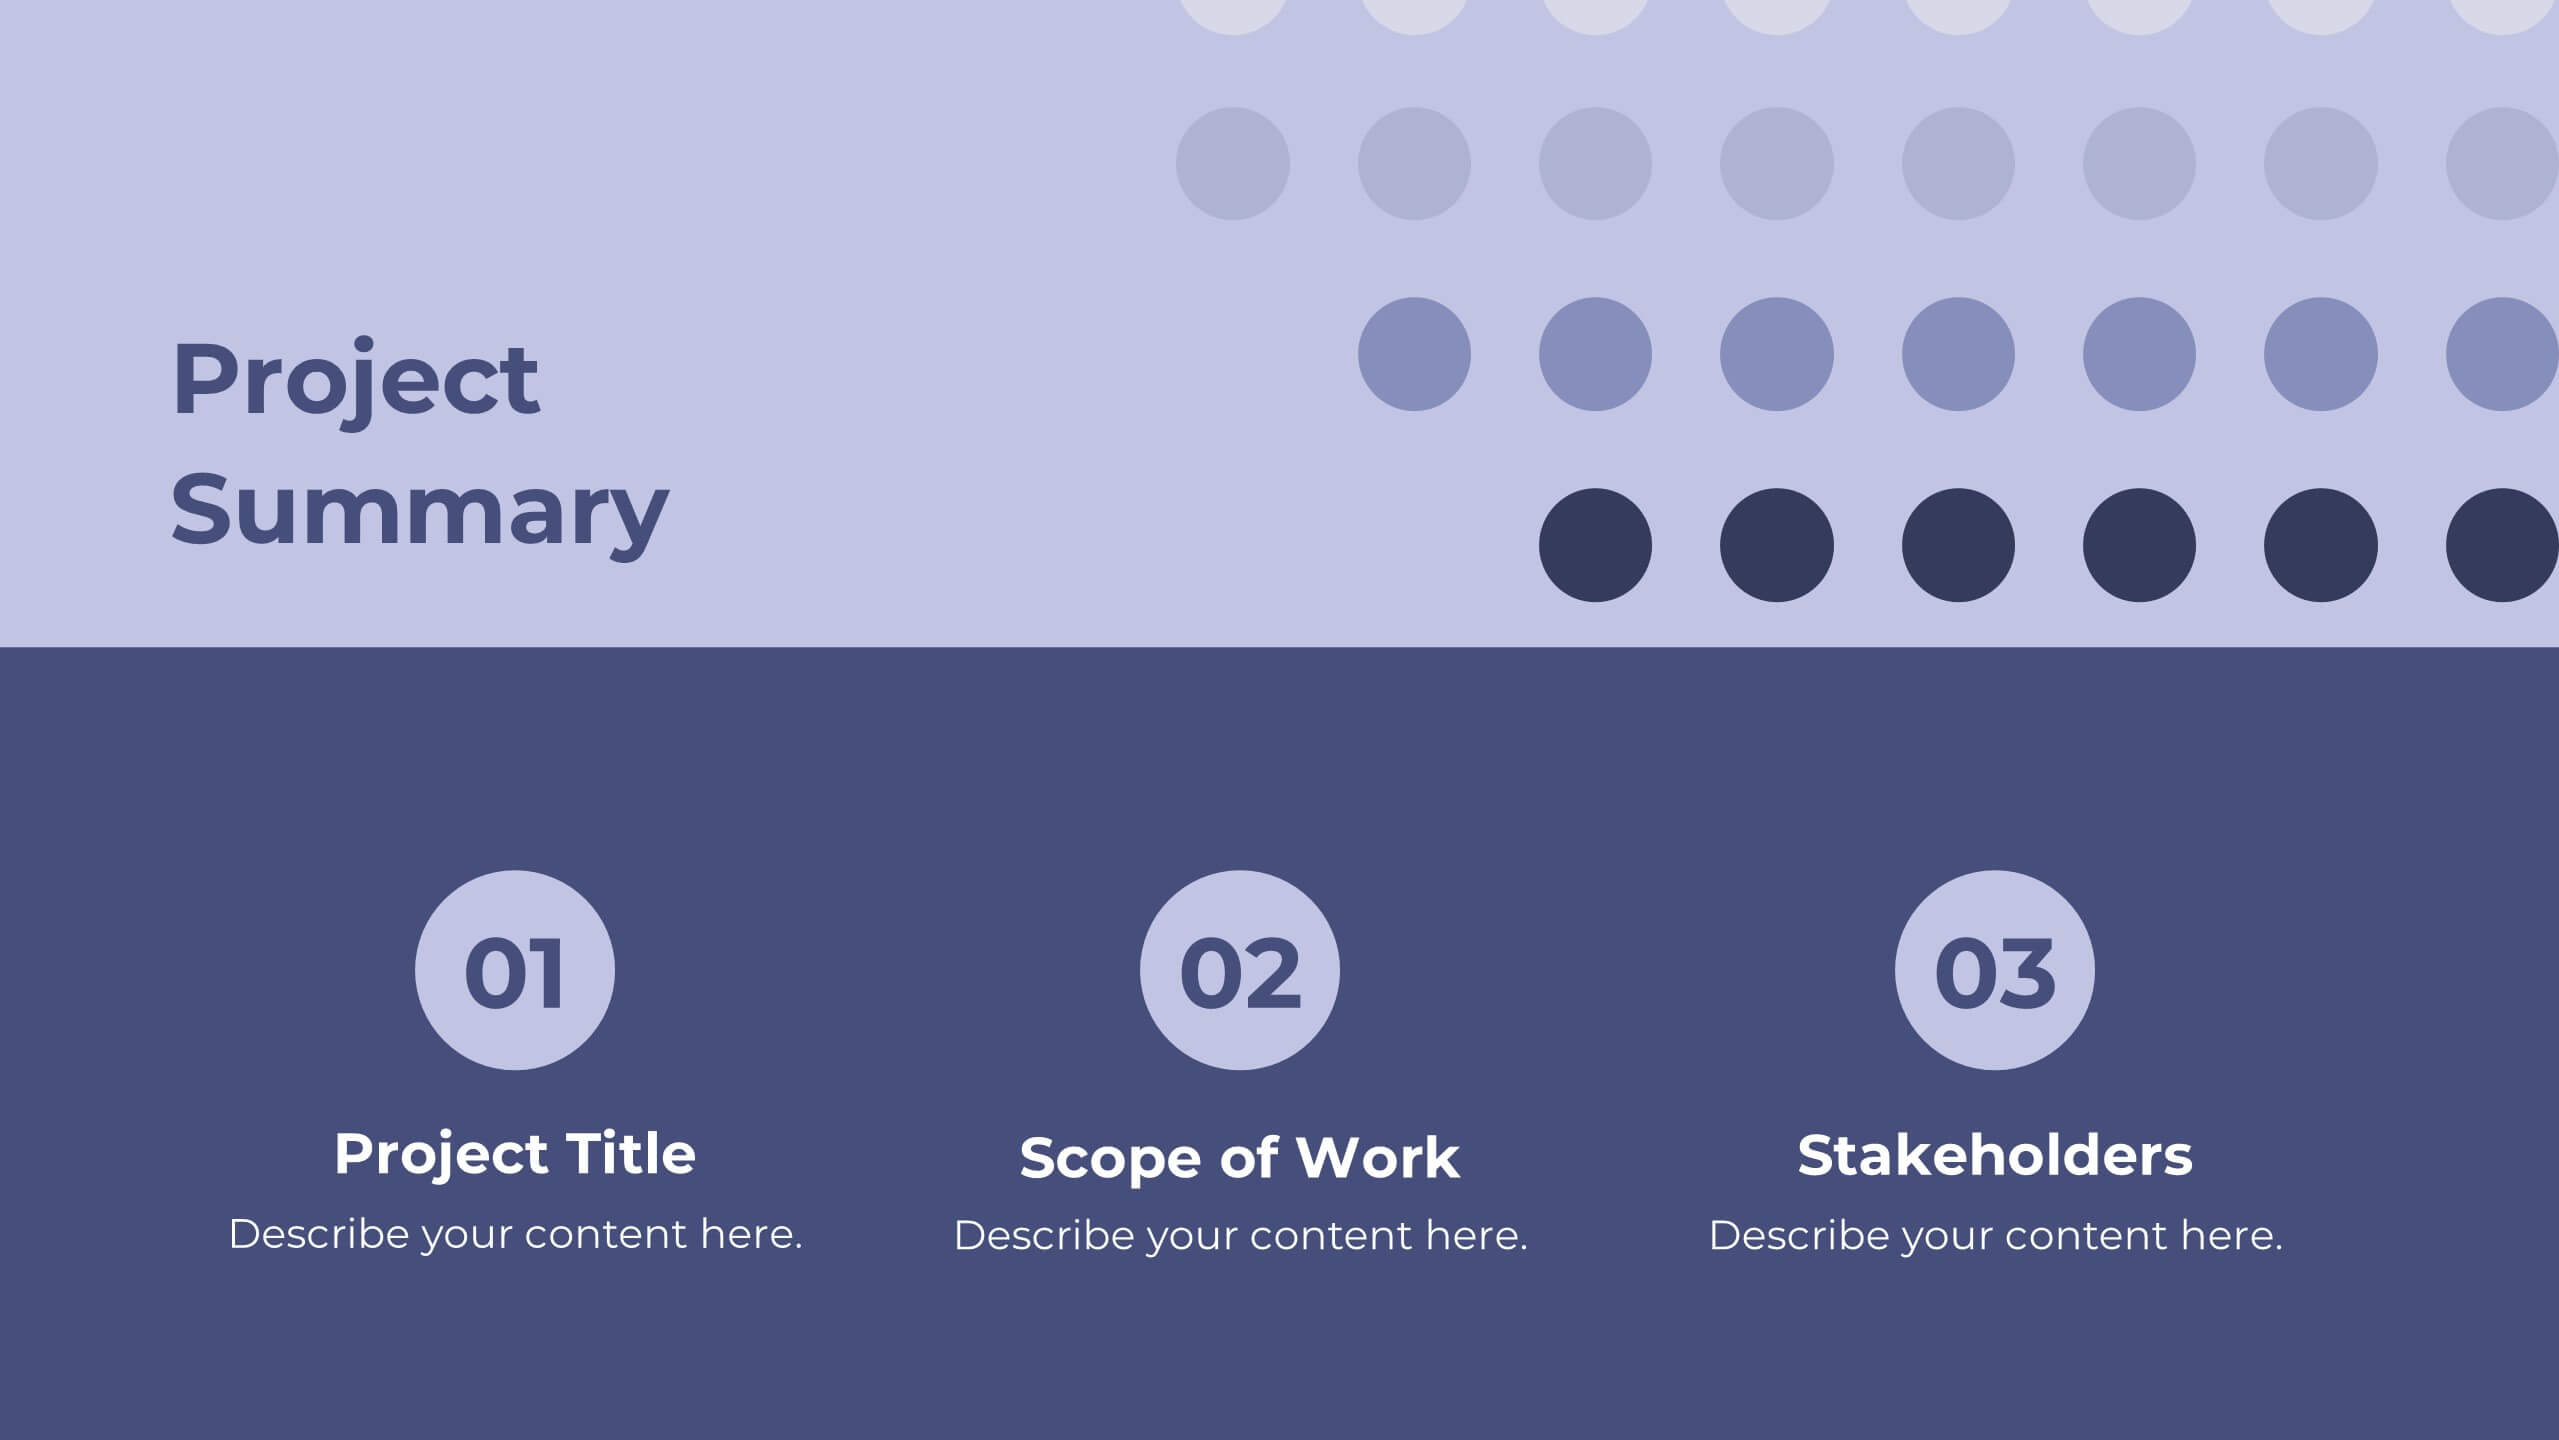
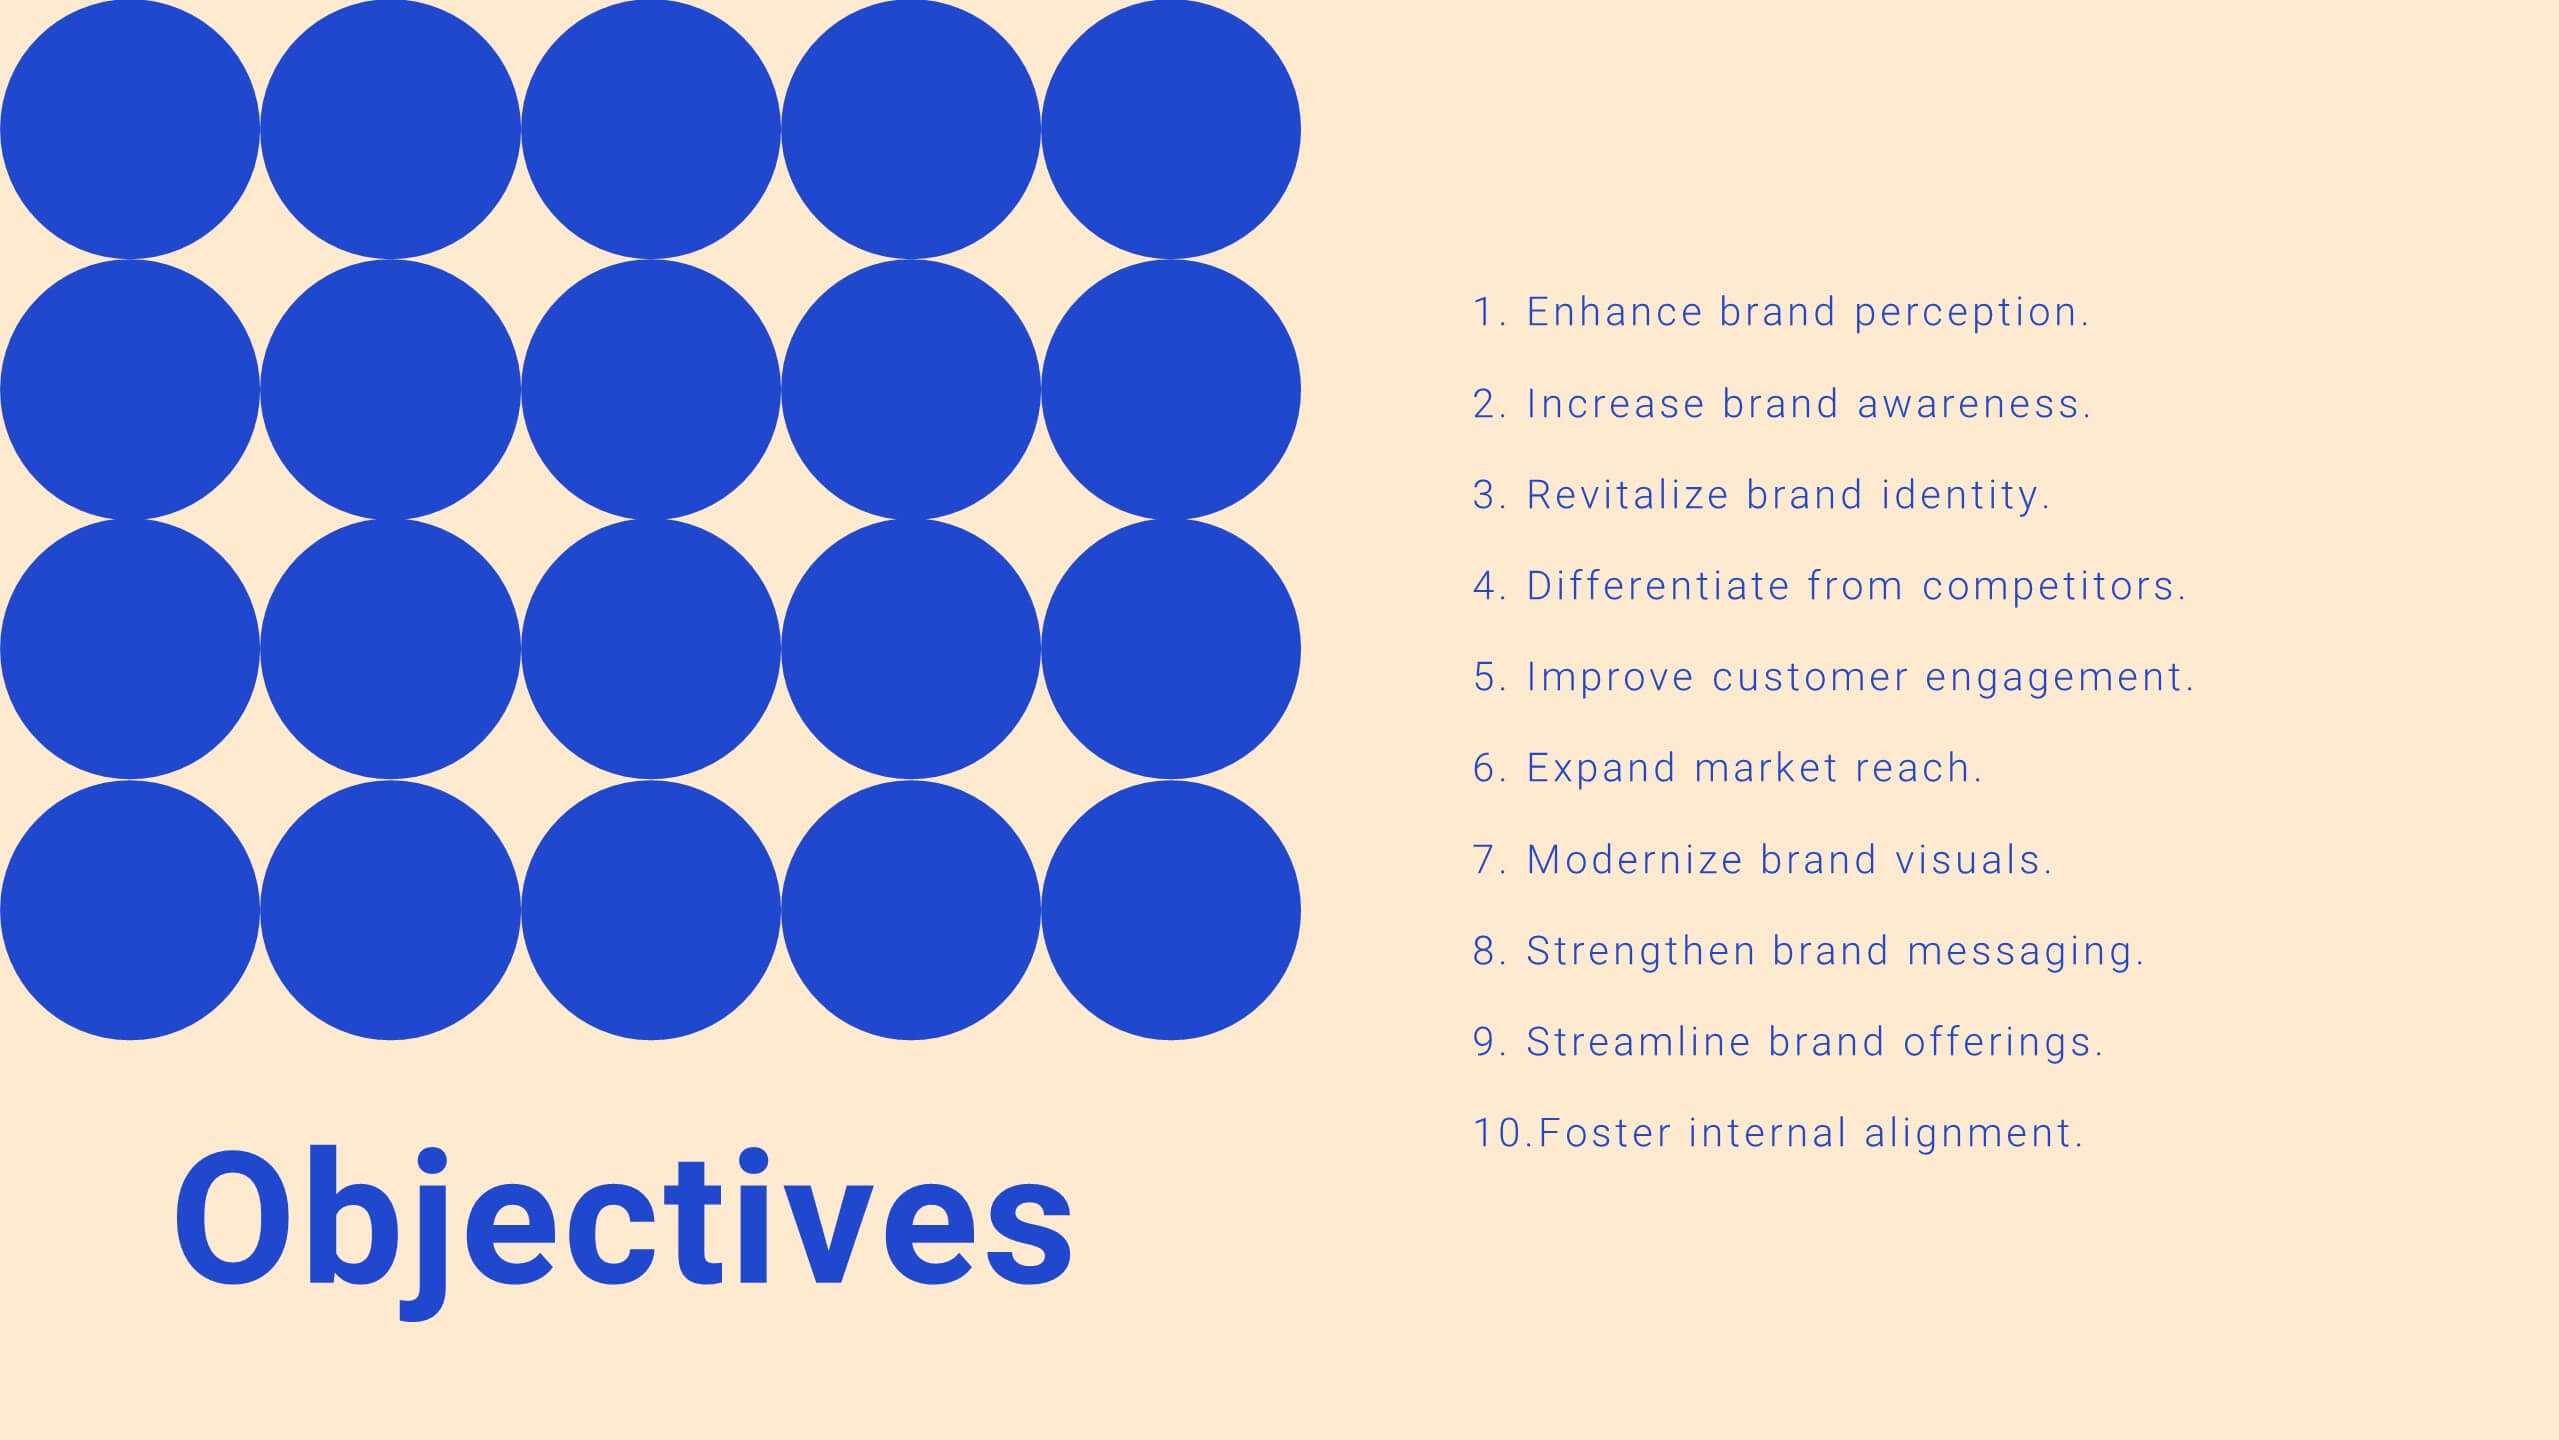
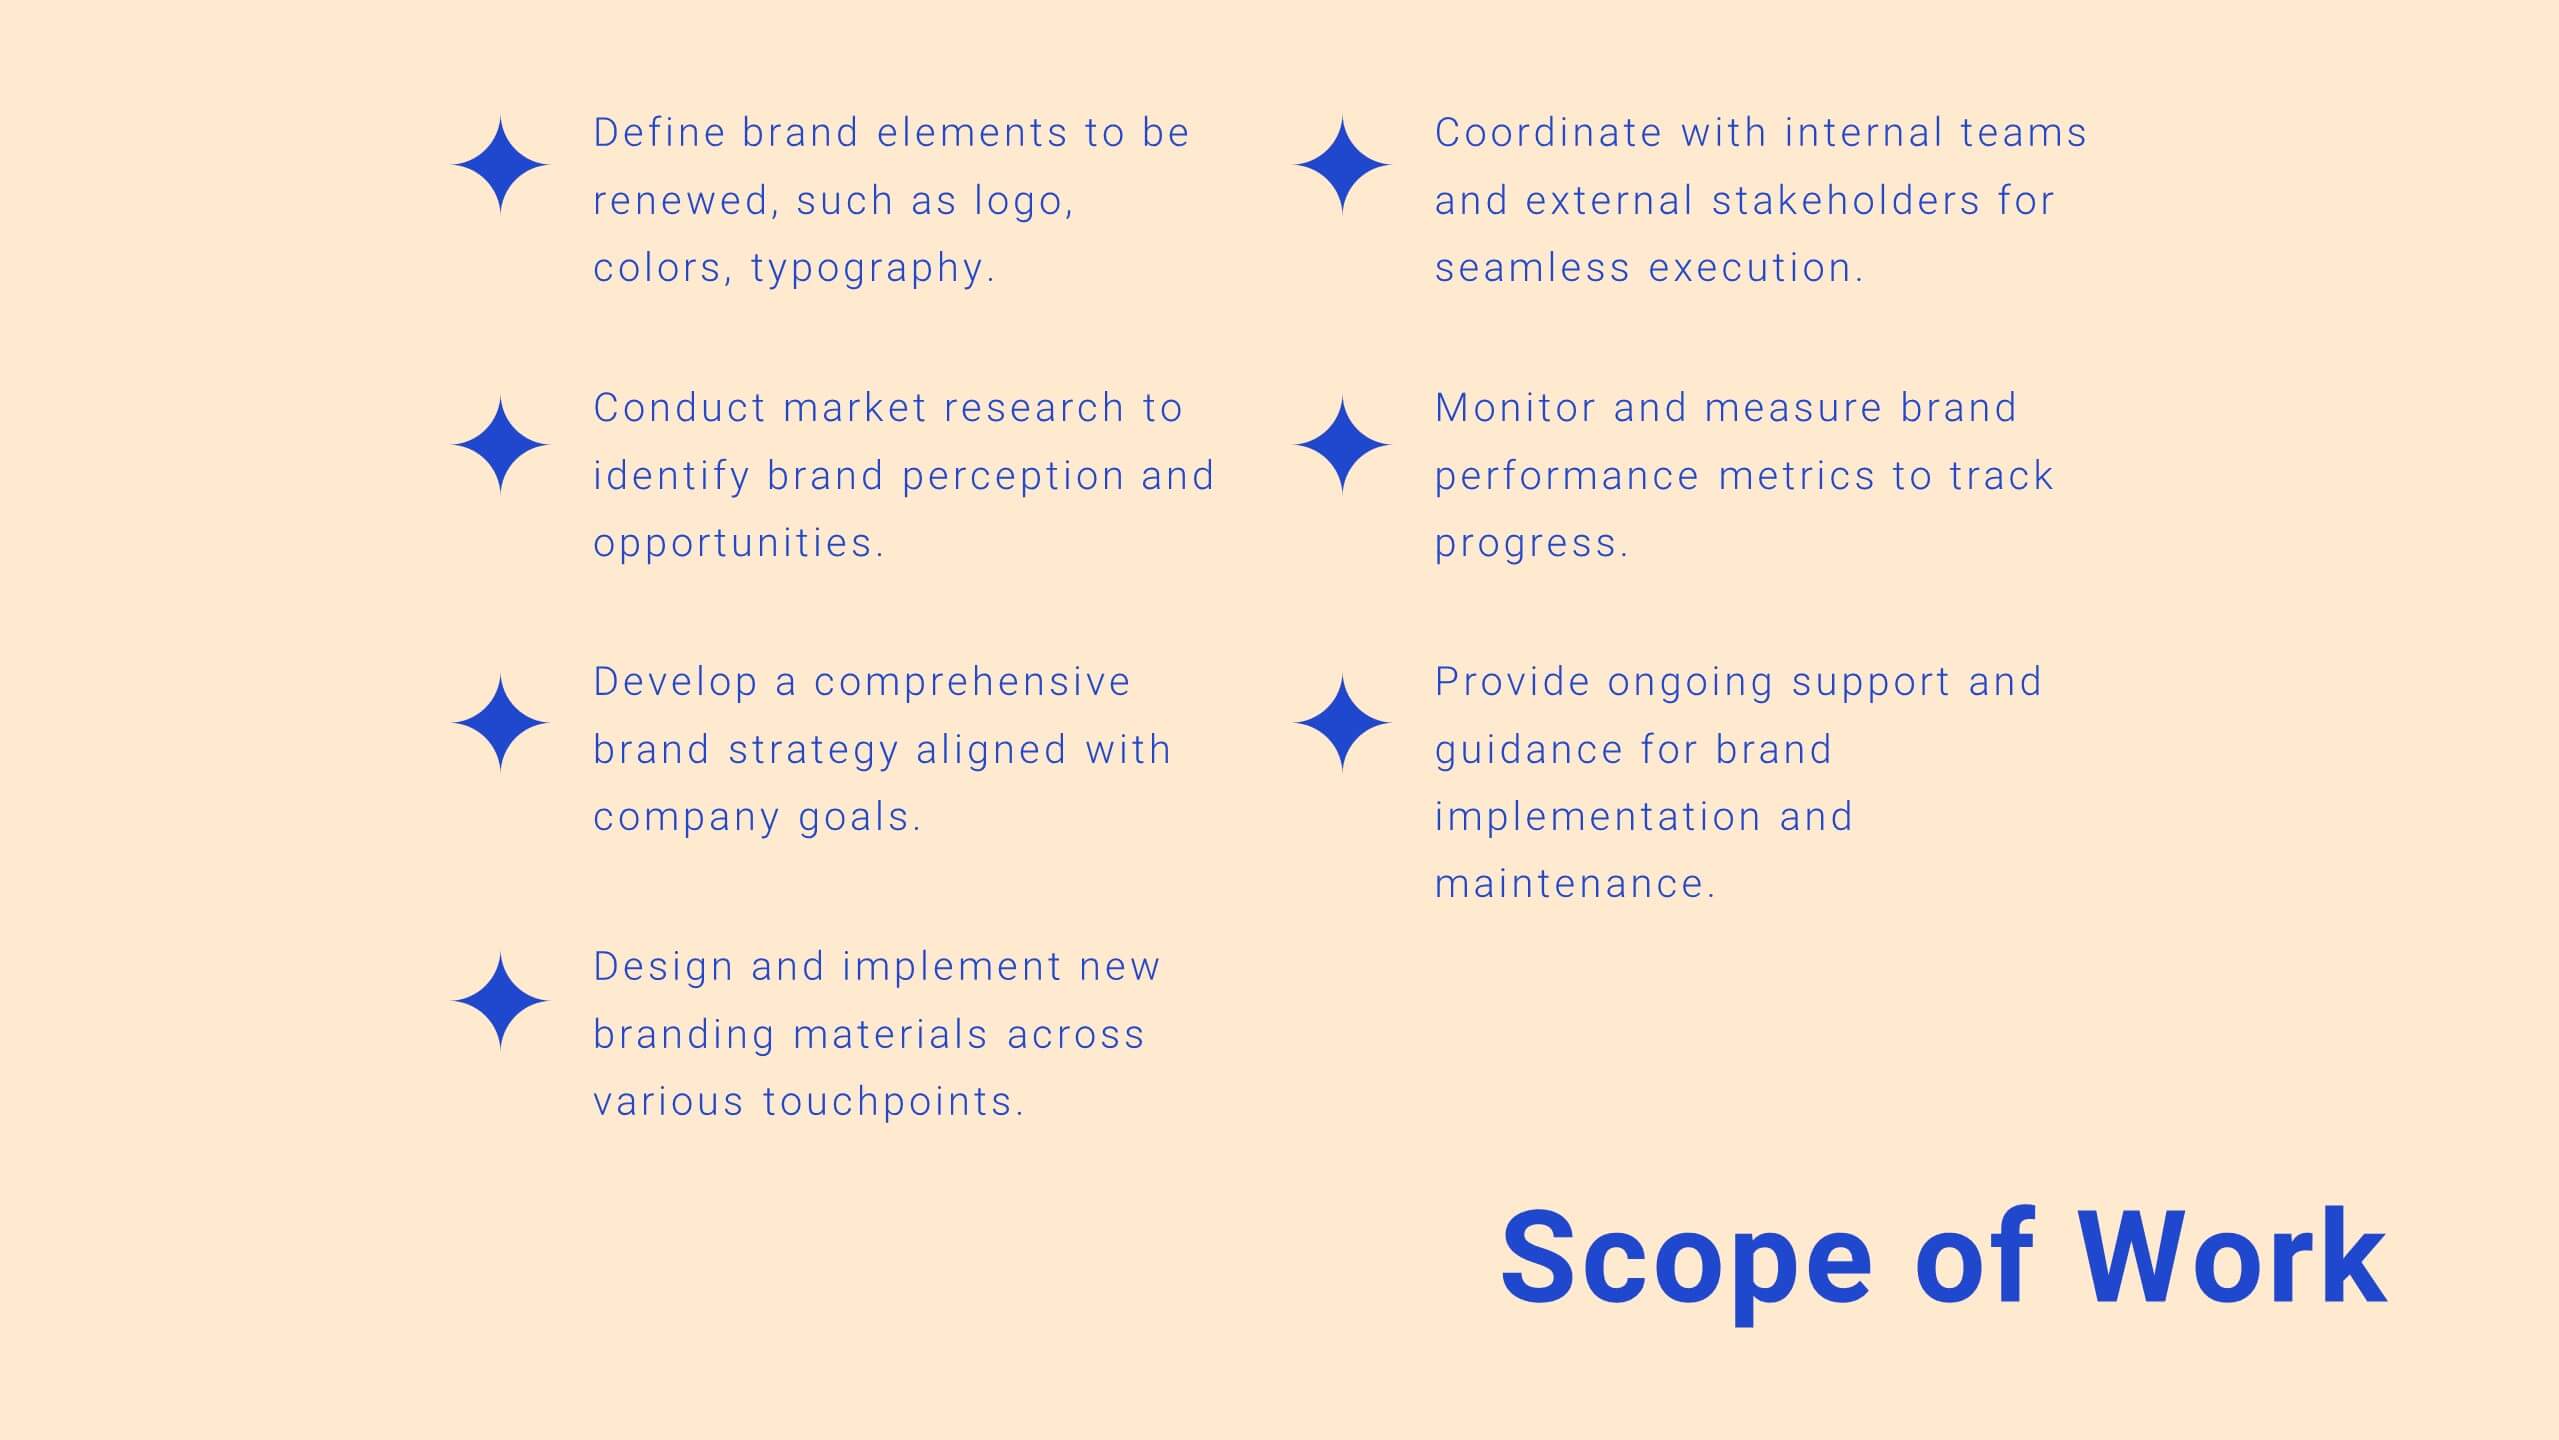
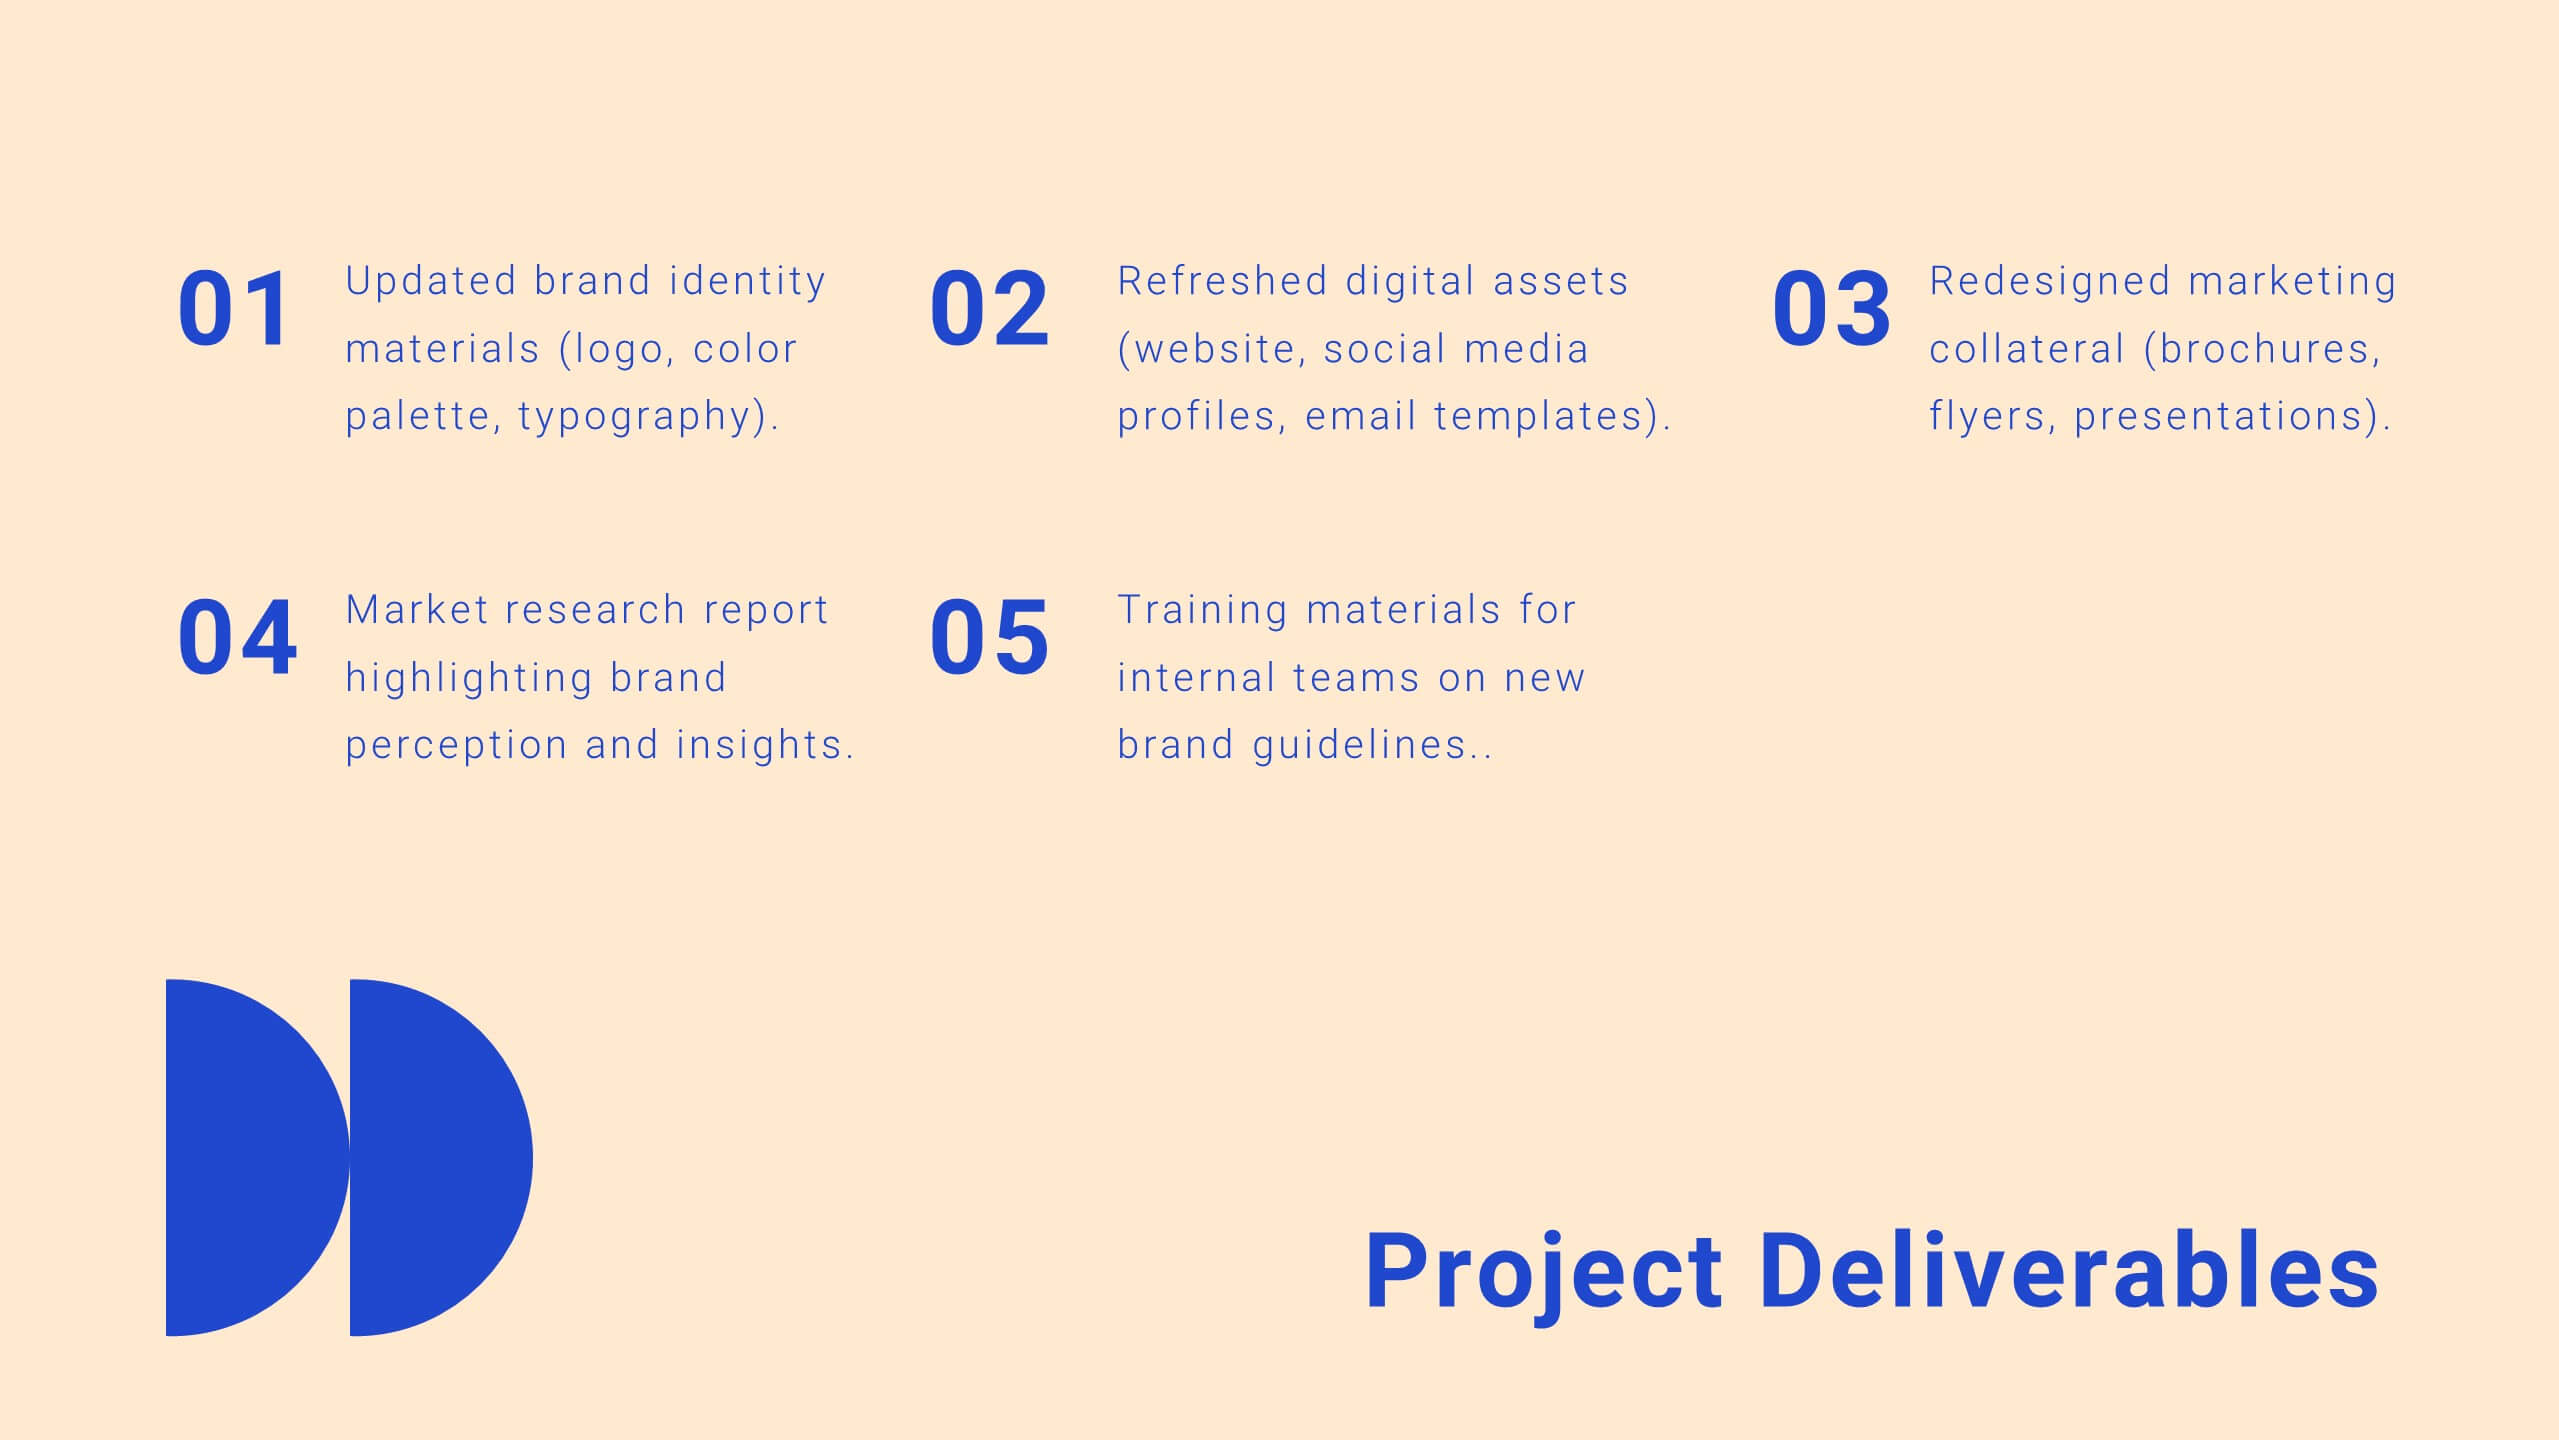
Present your project proposal with this clean and professional template! Covering sections such as objectives, scope of work, timeline, and budget breakdown, it helps you convey your plan clearly and effectively. Fully customizable and compatible with PowerPoint, Keynote, and Google Slides, it’s perfect for delivering impactful proposals to clients.


7 slides
Business People Management Infographic
Business people refer to individuals involved in the world of commerce and trade, encompassing various roles within the business landscape. This Infographic is an illuminating and dynamic template designed to guide you through the art and science of managing human capital within the business sphere. Explore the key aspects of effective people management and elevate your organizational success by harnessing the power of your workforce. Compatible with Powerpoint, Keynote, and Google Slides. Discover the art of leading and engaging your team, and witness the transformation as your organization excels and grows, driven by the power of effective people management!


4 slides
Employee Training and Development
Train smarter, not harder—with this bold funnel-style visual that maps your employee development journey from initial training to measurable impact. It's perfect for illustrating progress, performance shifts, or development stages across teams or roles. Fully customizable in PowerPoint, Keynote, and Google Slides for smooth integration into any professional presentation.


5 slides
Project Management Framework
Guide your team through every project phase with this step-by-step framework presentation. Designed with a five-stage visual flow, this layout helps clearly communicate key milestones, tasks, and deliverables. Each stage is color-coded for easy tracking and includes editable text and icons. Perfect for planning, strategy, and agile workflows. Fully compatible with PowerPoint, Keynote, and Google Slides.


7 slides
Strategic Solution Framework
Present your business strategies clearly with this strategic solution framework slide. Designed with a semi-circular puzzle diagram, it’s perfect for showcasing interconnected solutions, phased plans, or collaborative initiatives. Ideal for business meetings, consulting proposals, and corporate strategy sessions. Fully editable and compatible with PowerPoint, Keynote, and Google Slides.


7 slides
Target Customer Profile Infographic
This Target Customer Profile infographic template is designed to help businesses clearly define and present their ideal customer segments. Available for PowerPoint, Google Slides, and Keynote, it includes various sections to detail demographics, customer needs, purchasing habits, and more. With a clean layout and a warm color scheme of oranges and blues, it facilitates the easy organization of customer information. Icons and comparison charts enable users to visualize customer motivations, goals, and product alignment efficiently. Ideal for marketers and business planners, this template simplifies the process of profiling target customers in a visually engaging and informative manner.


5 slides
Country Breakdown South America Map Presentation
Turn complex regional data into clear visual insights with this modern map layout designed for South America. Perfect for showcasing country statistics, market segmentation, or performance comparisons, this slide keeps information clean and engaging. Fully compatible with PowerPoint, Keynote, and Google Slides for easy editing and professional presentations.
21 slides
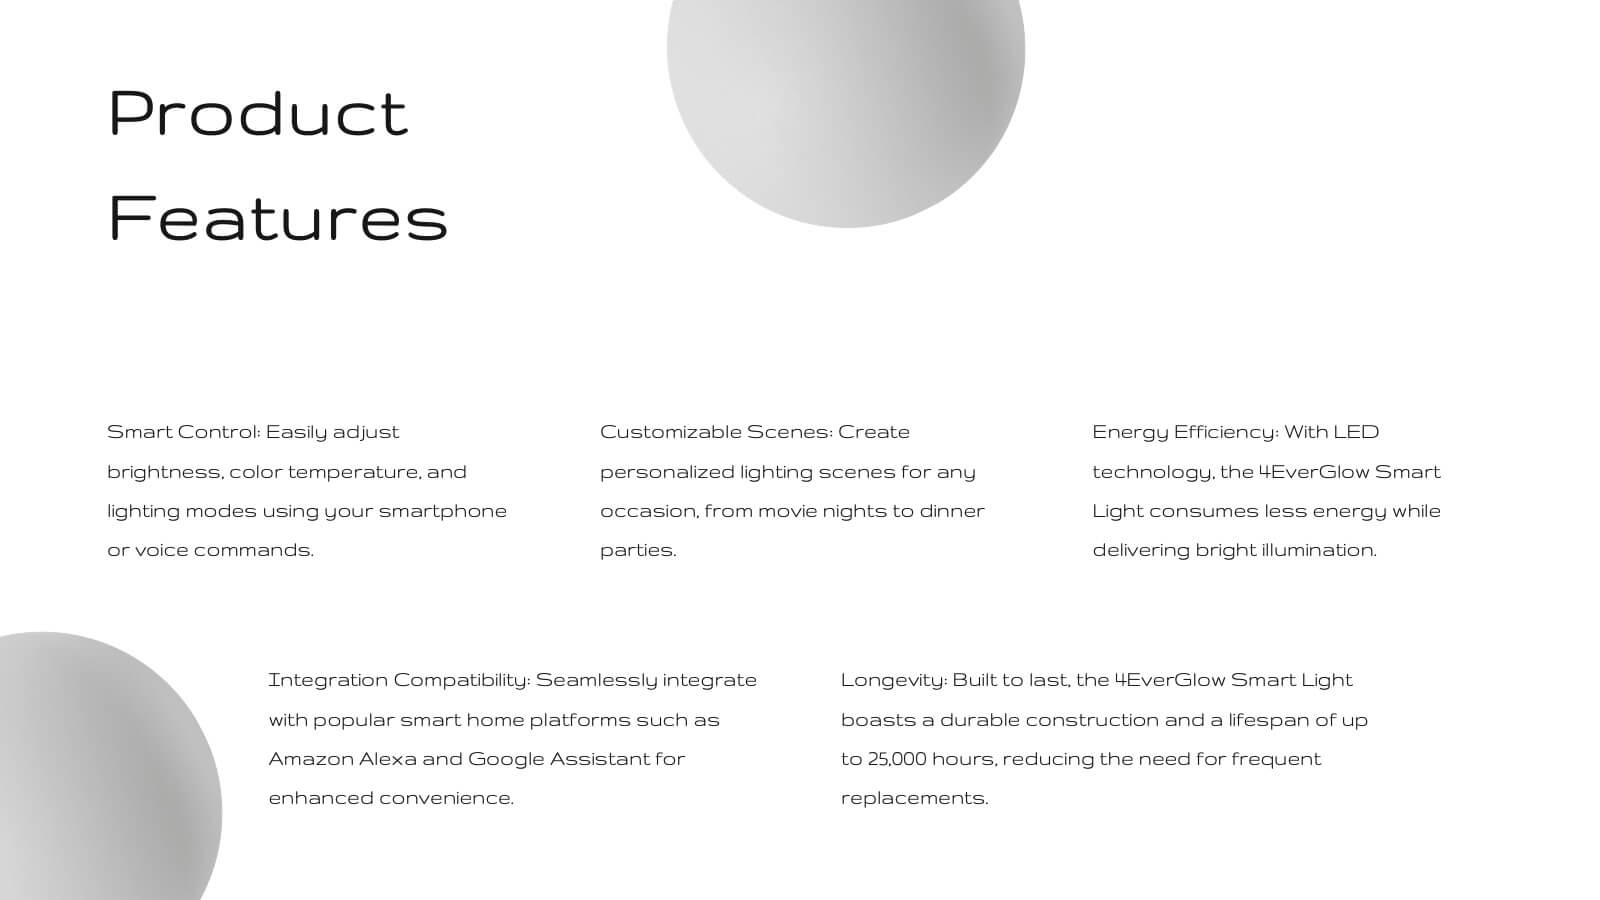
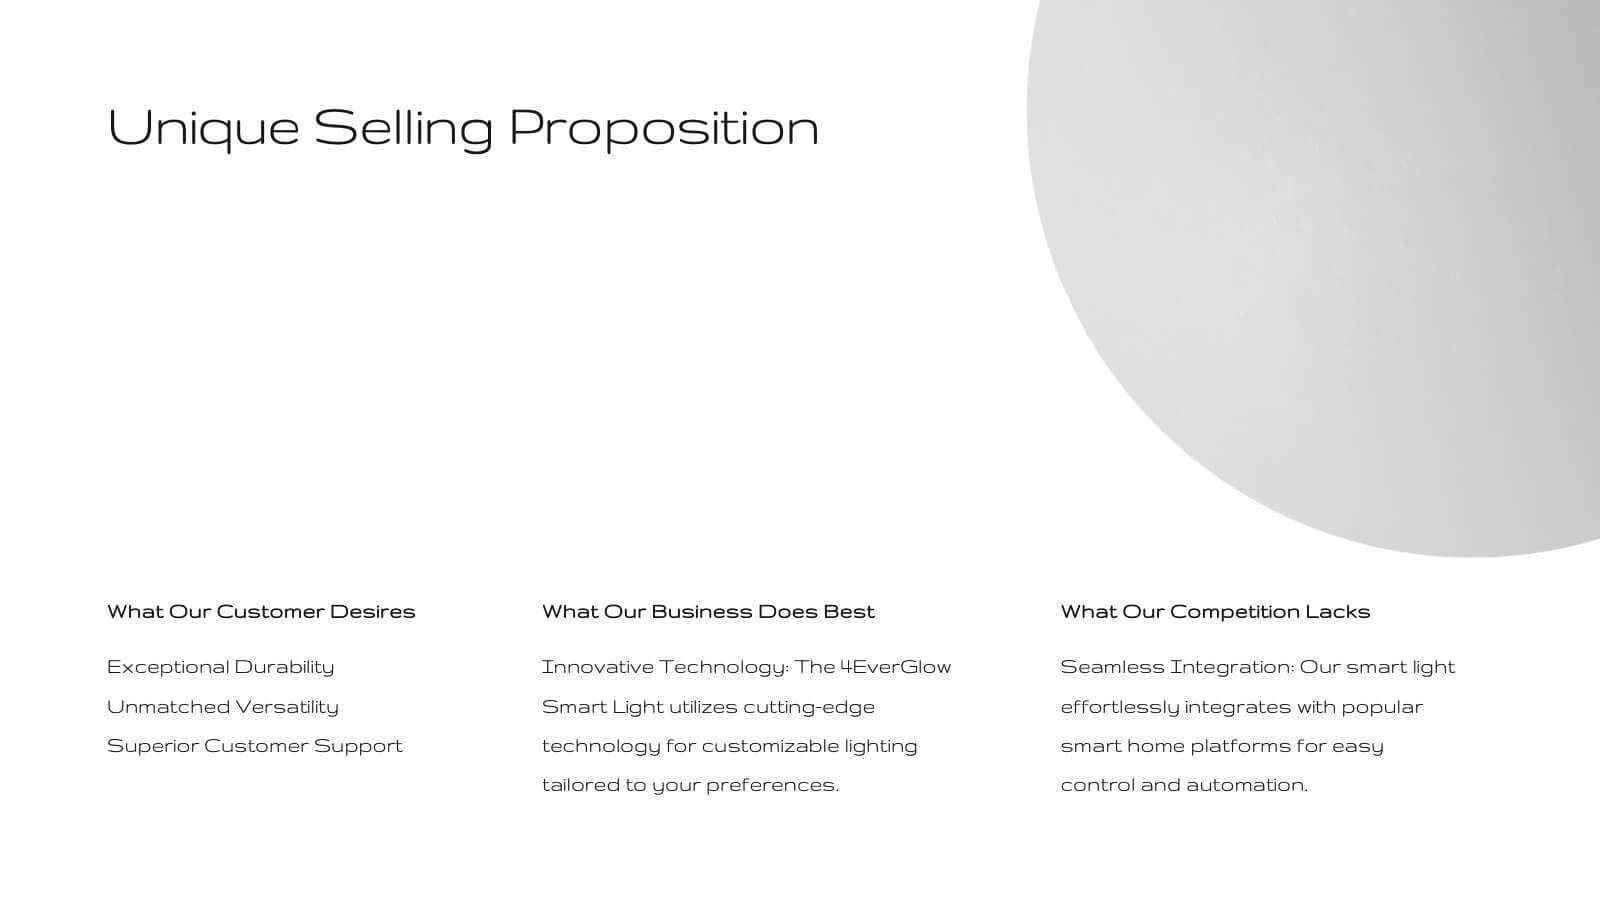
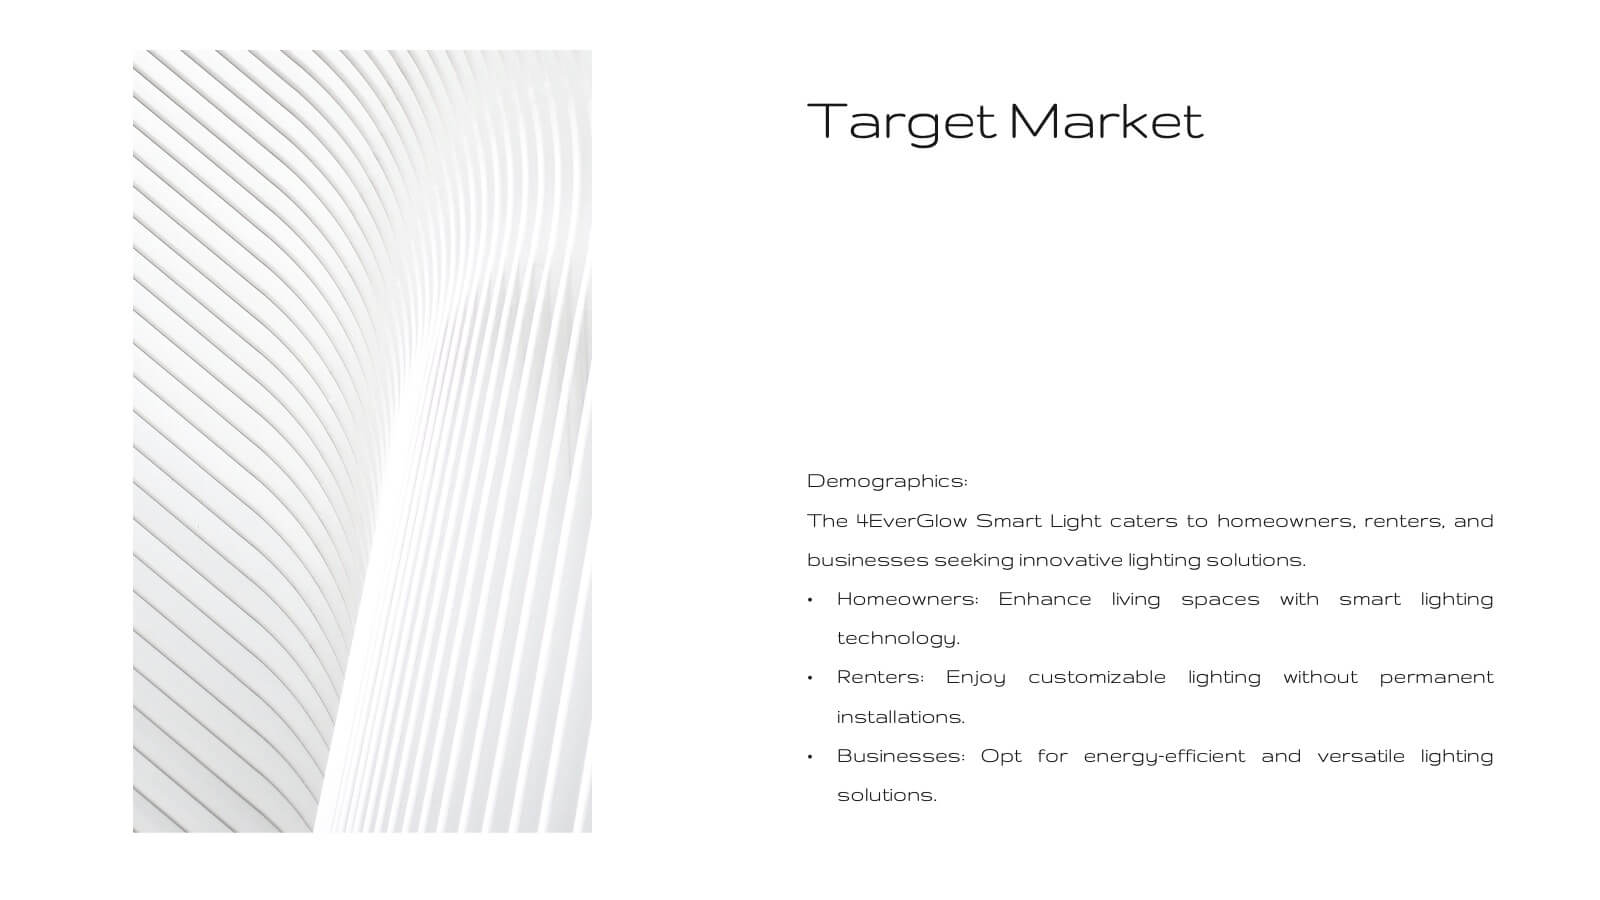
Fortuna Product Development Plan Presentation
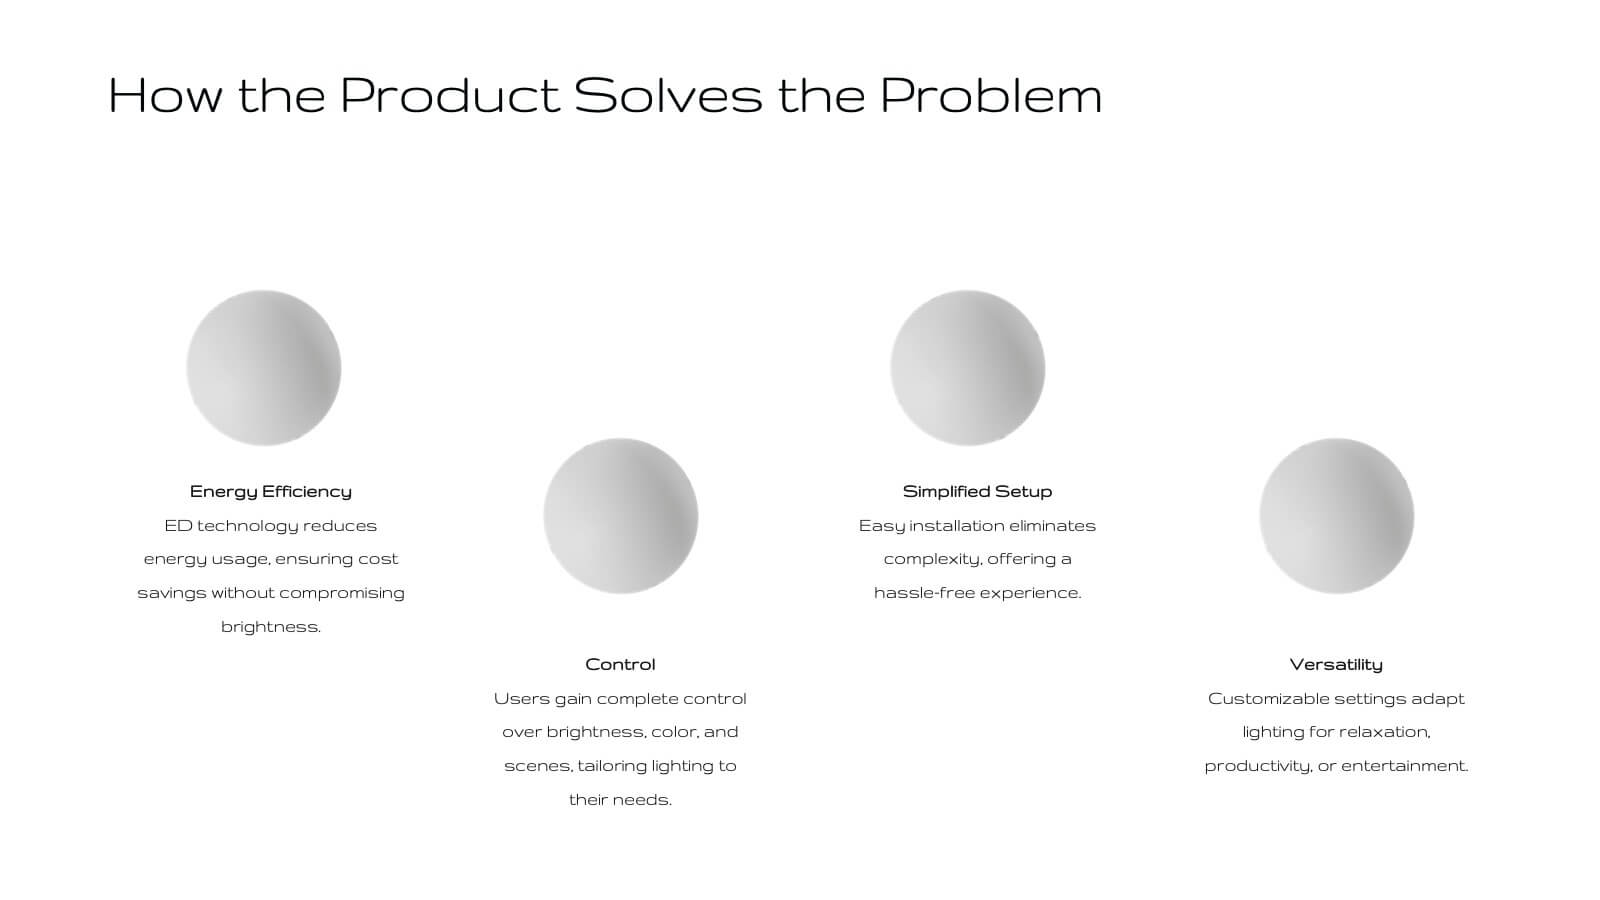
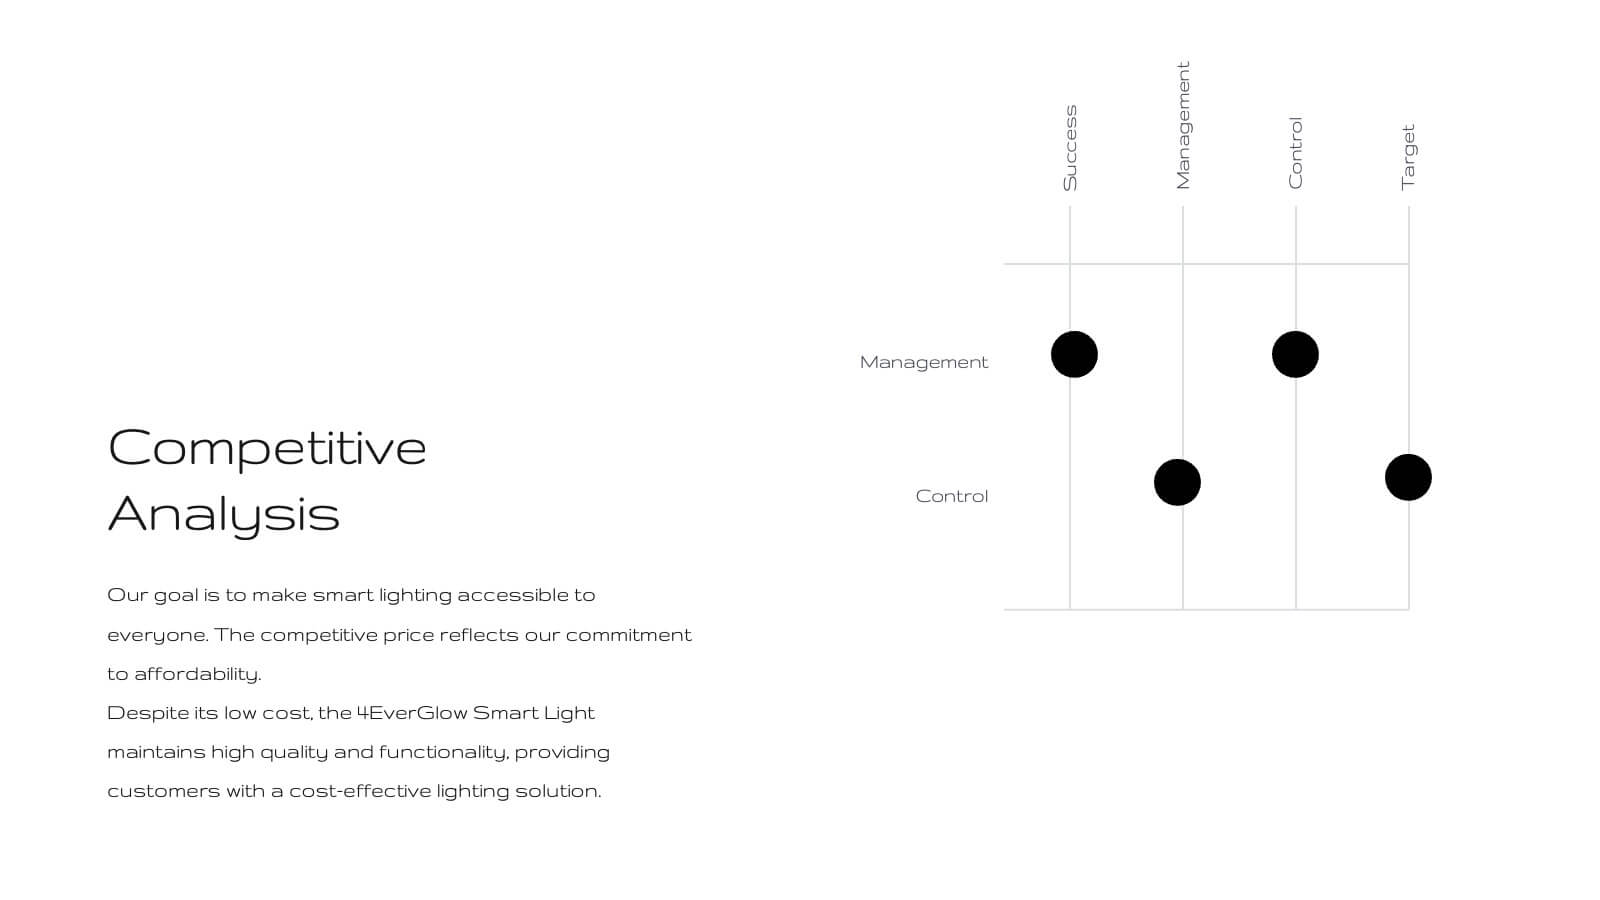
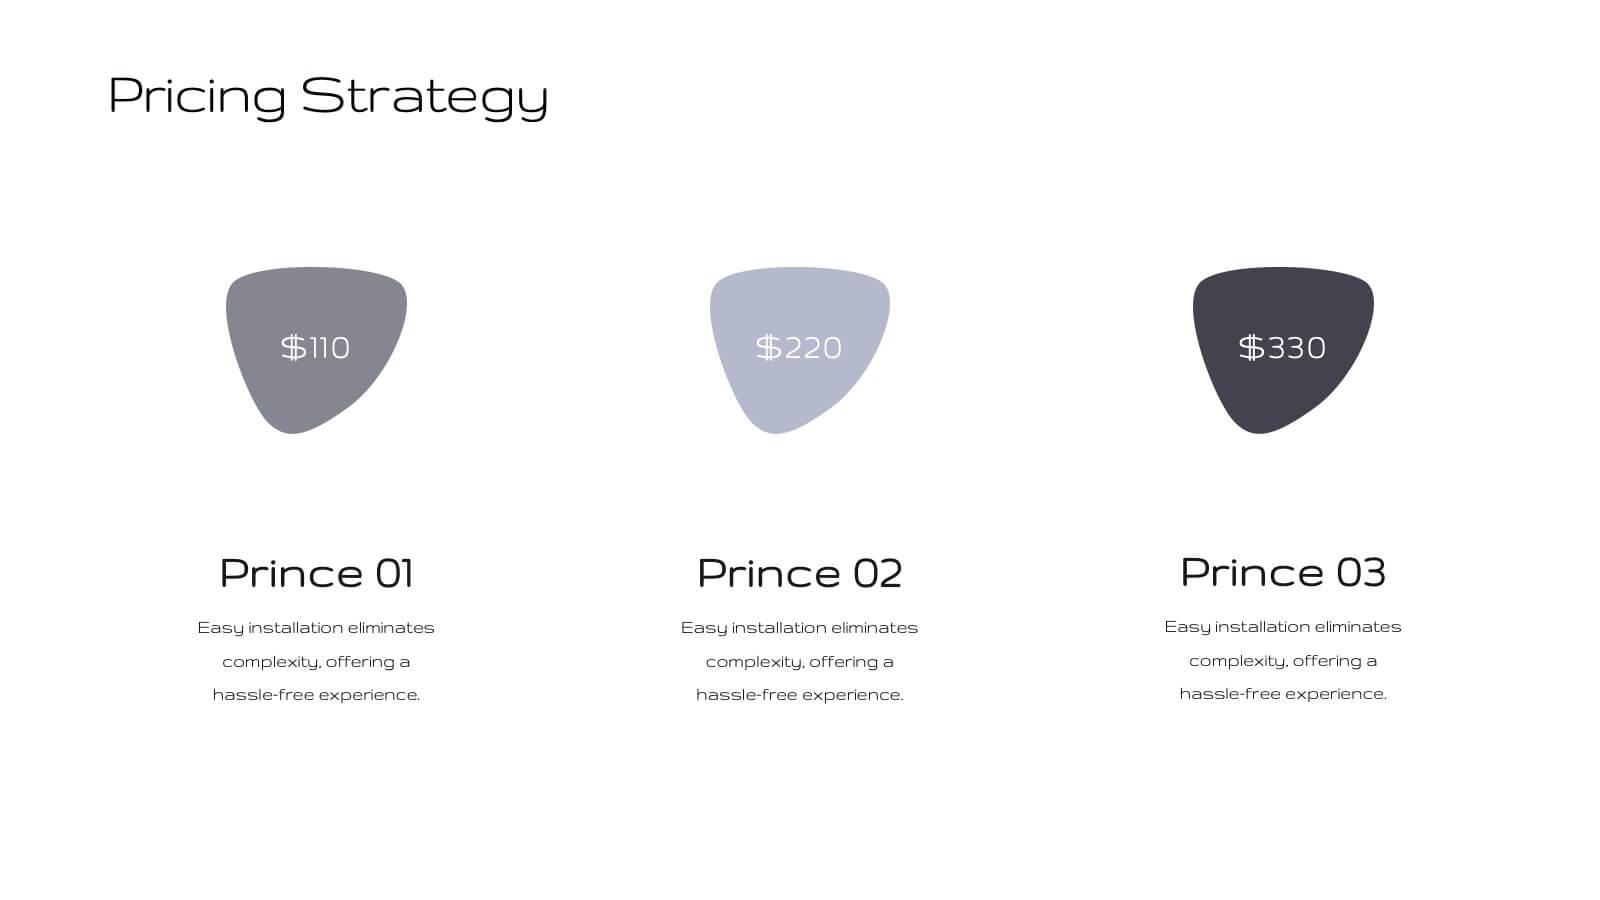
Unveil your product's potential with this elegant, minimalist presentation template. Perfect for detailing product development, features, and market strategies, it features a clean design that emphasizes clarity and professionalism. Highlight key aspects like customer pain points, competitive analysis, and pricing strategies to captivate your audience. Compatible with PowerPoint, Keynote, and Google Slides, it ensures seamless presentations on any platform.


5 slides
Meeting Schedule and Agenda Layout Presentation
Plan, track, and communicate multi-day meetings with this Meeting Schedule and Agenda Layout presentation. Ideal for organizing conference sessions, workshops, or internal team agendas, this layout lets you present key topics by day and time. Clean, structured, and fully editable in Canva, PowerPoint, and Google Slides for easy customization.


21 slides
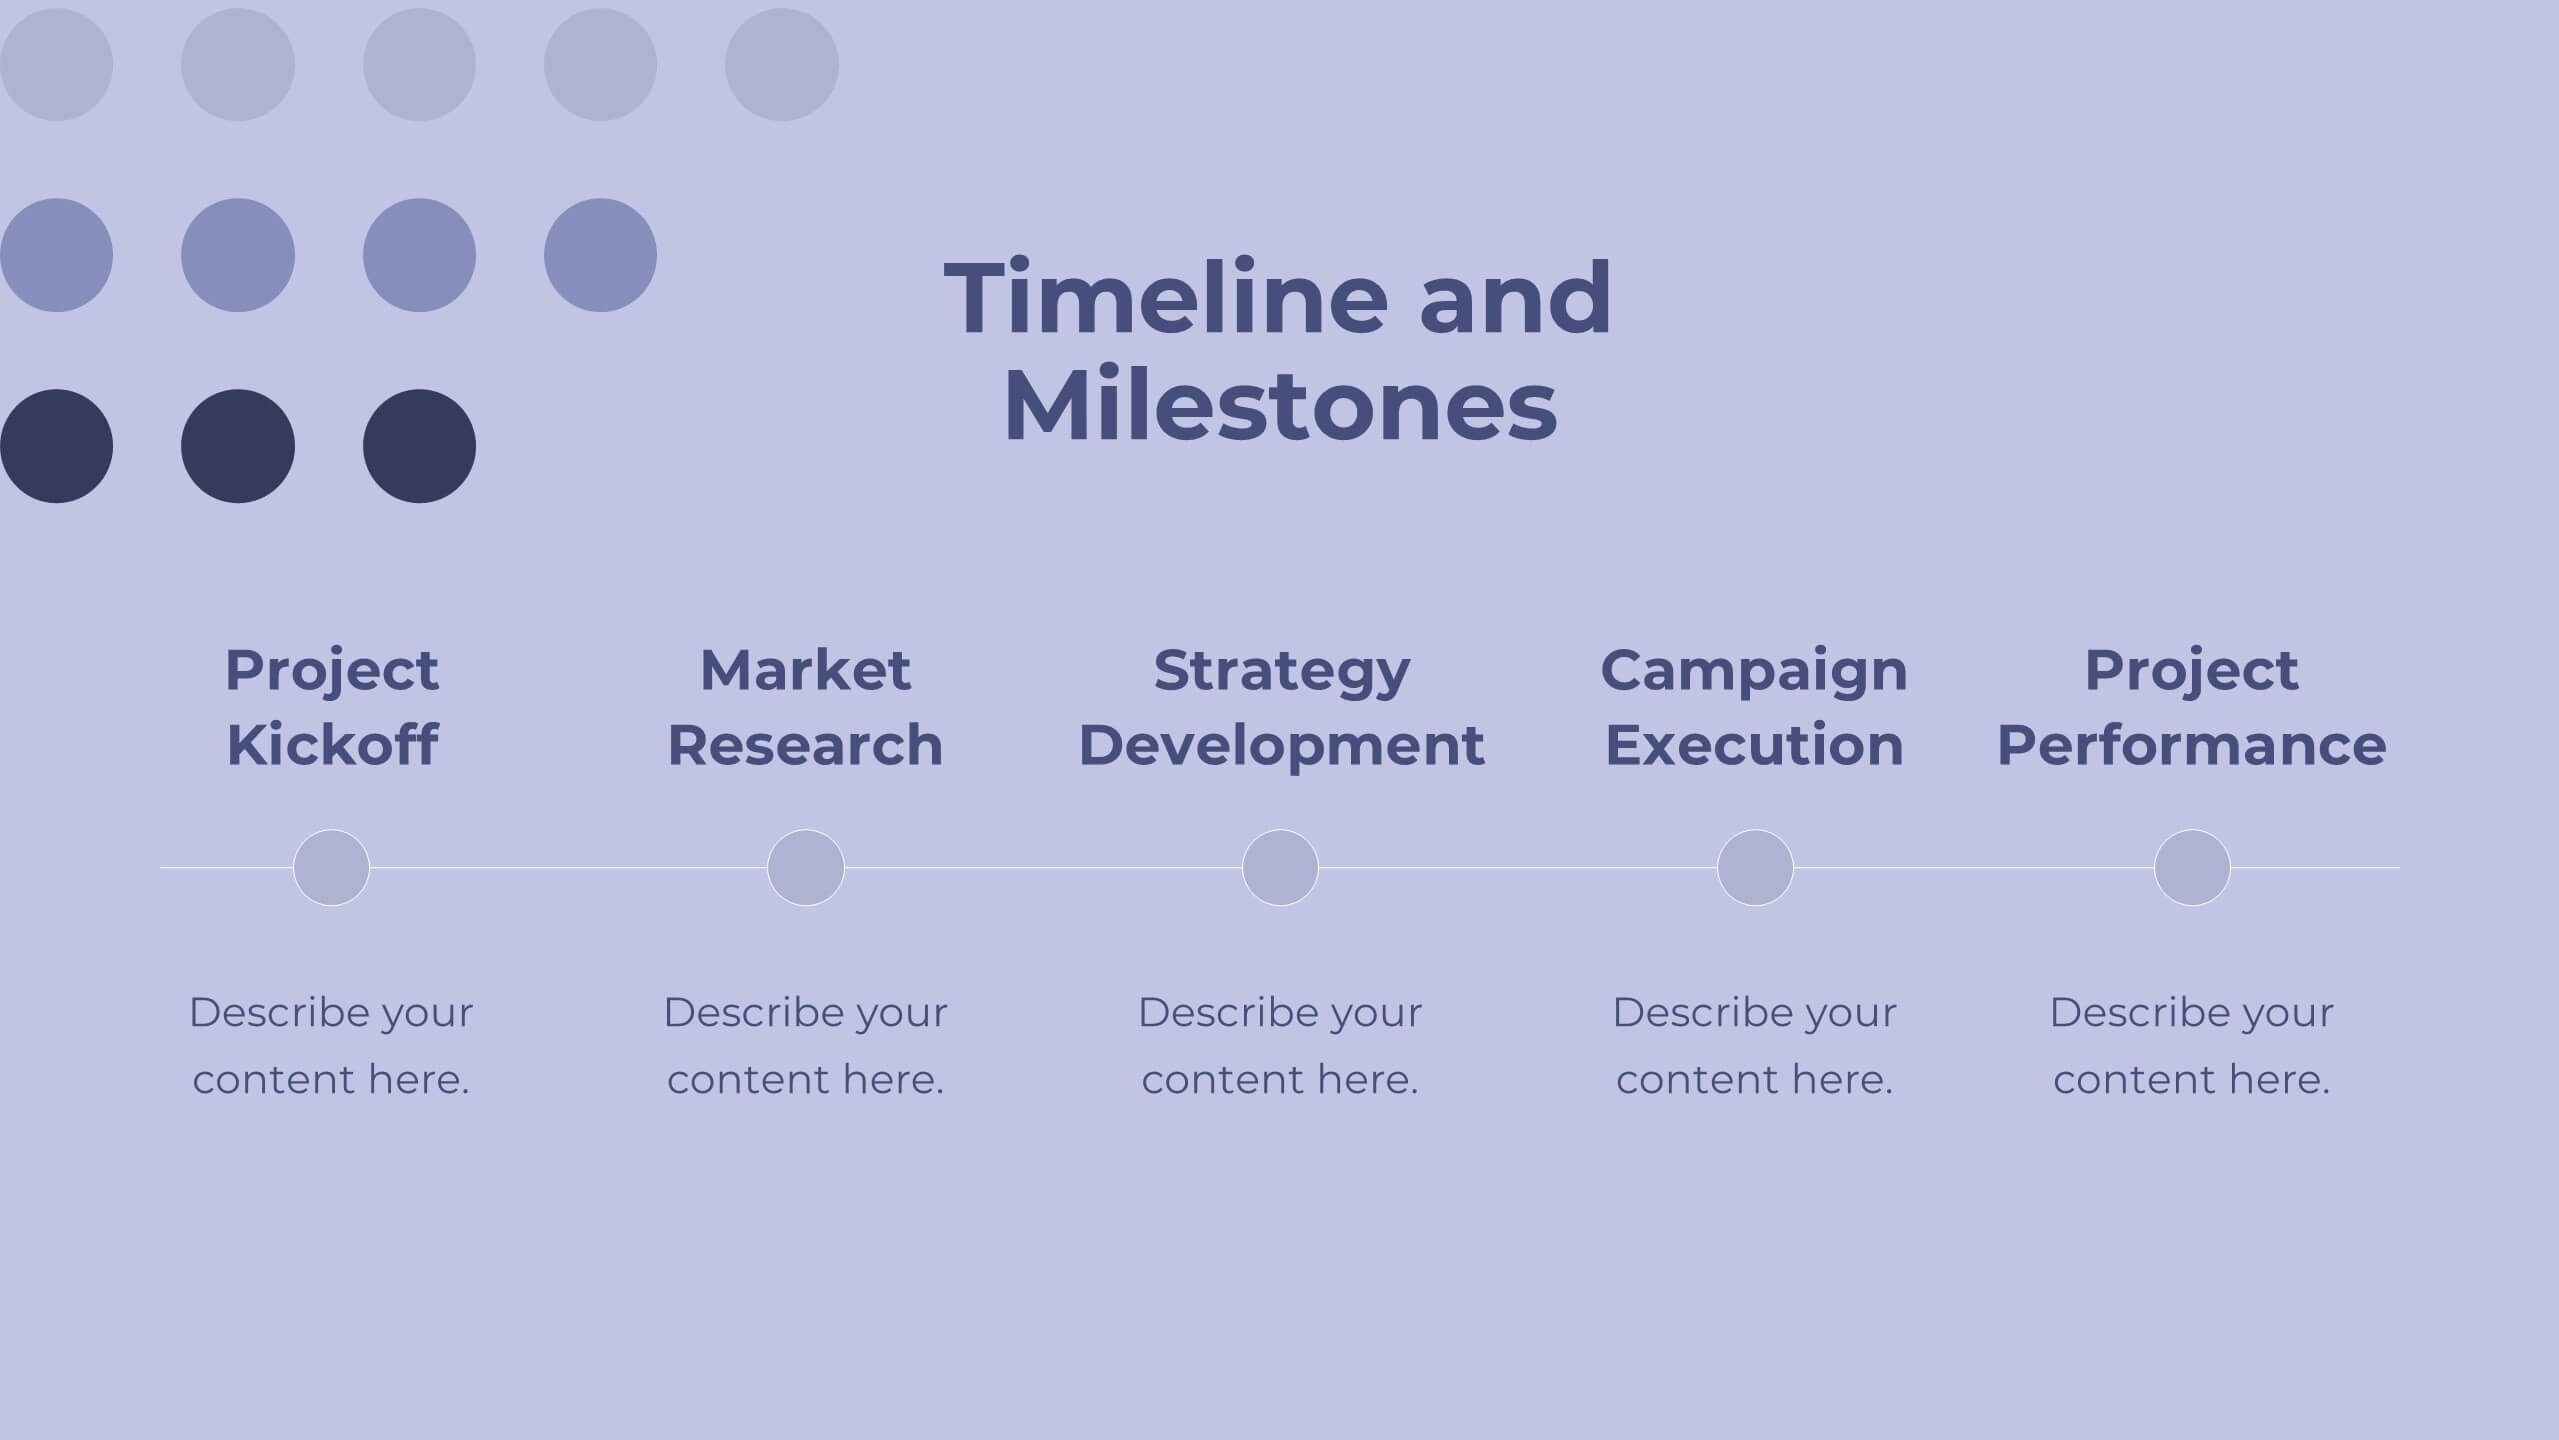
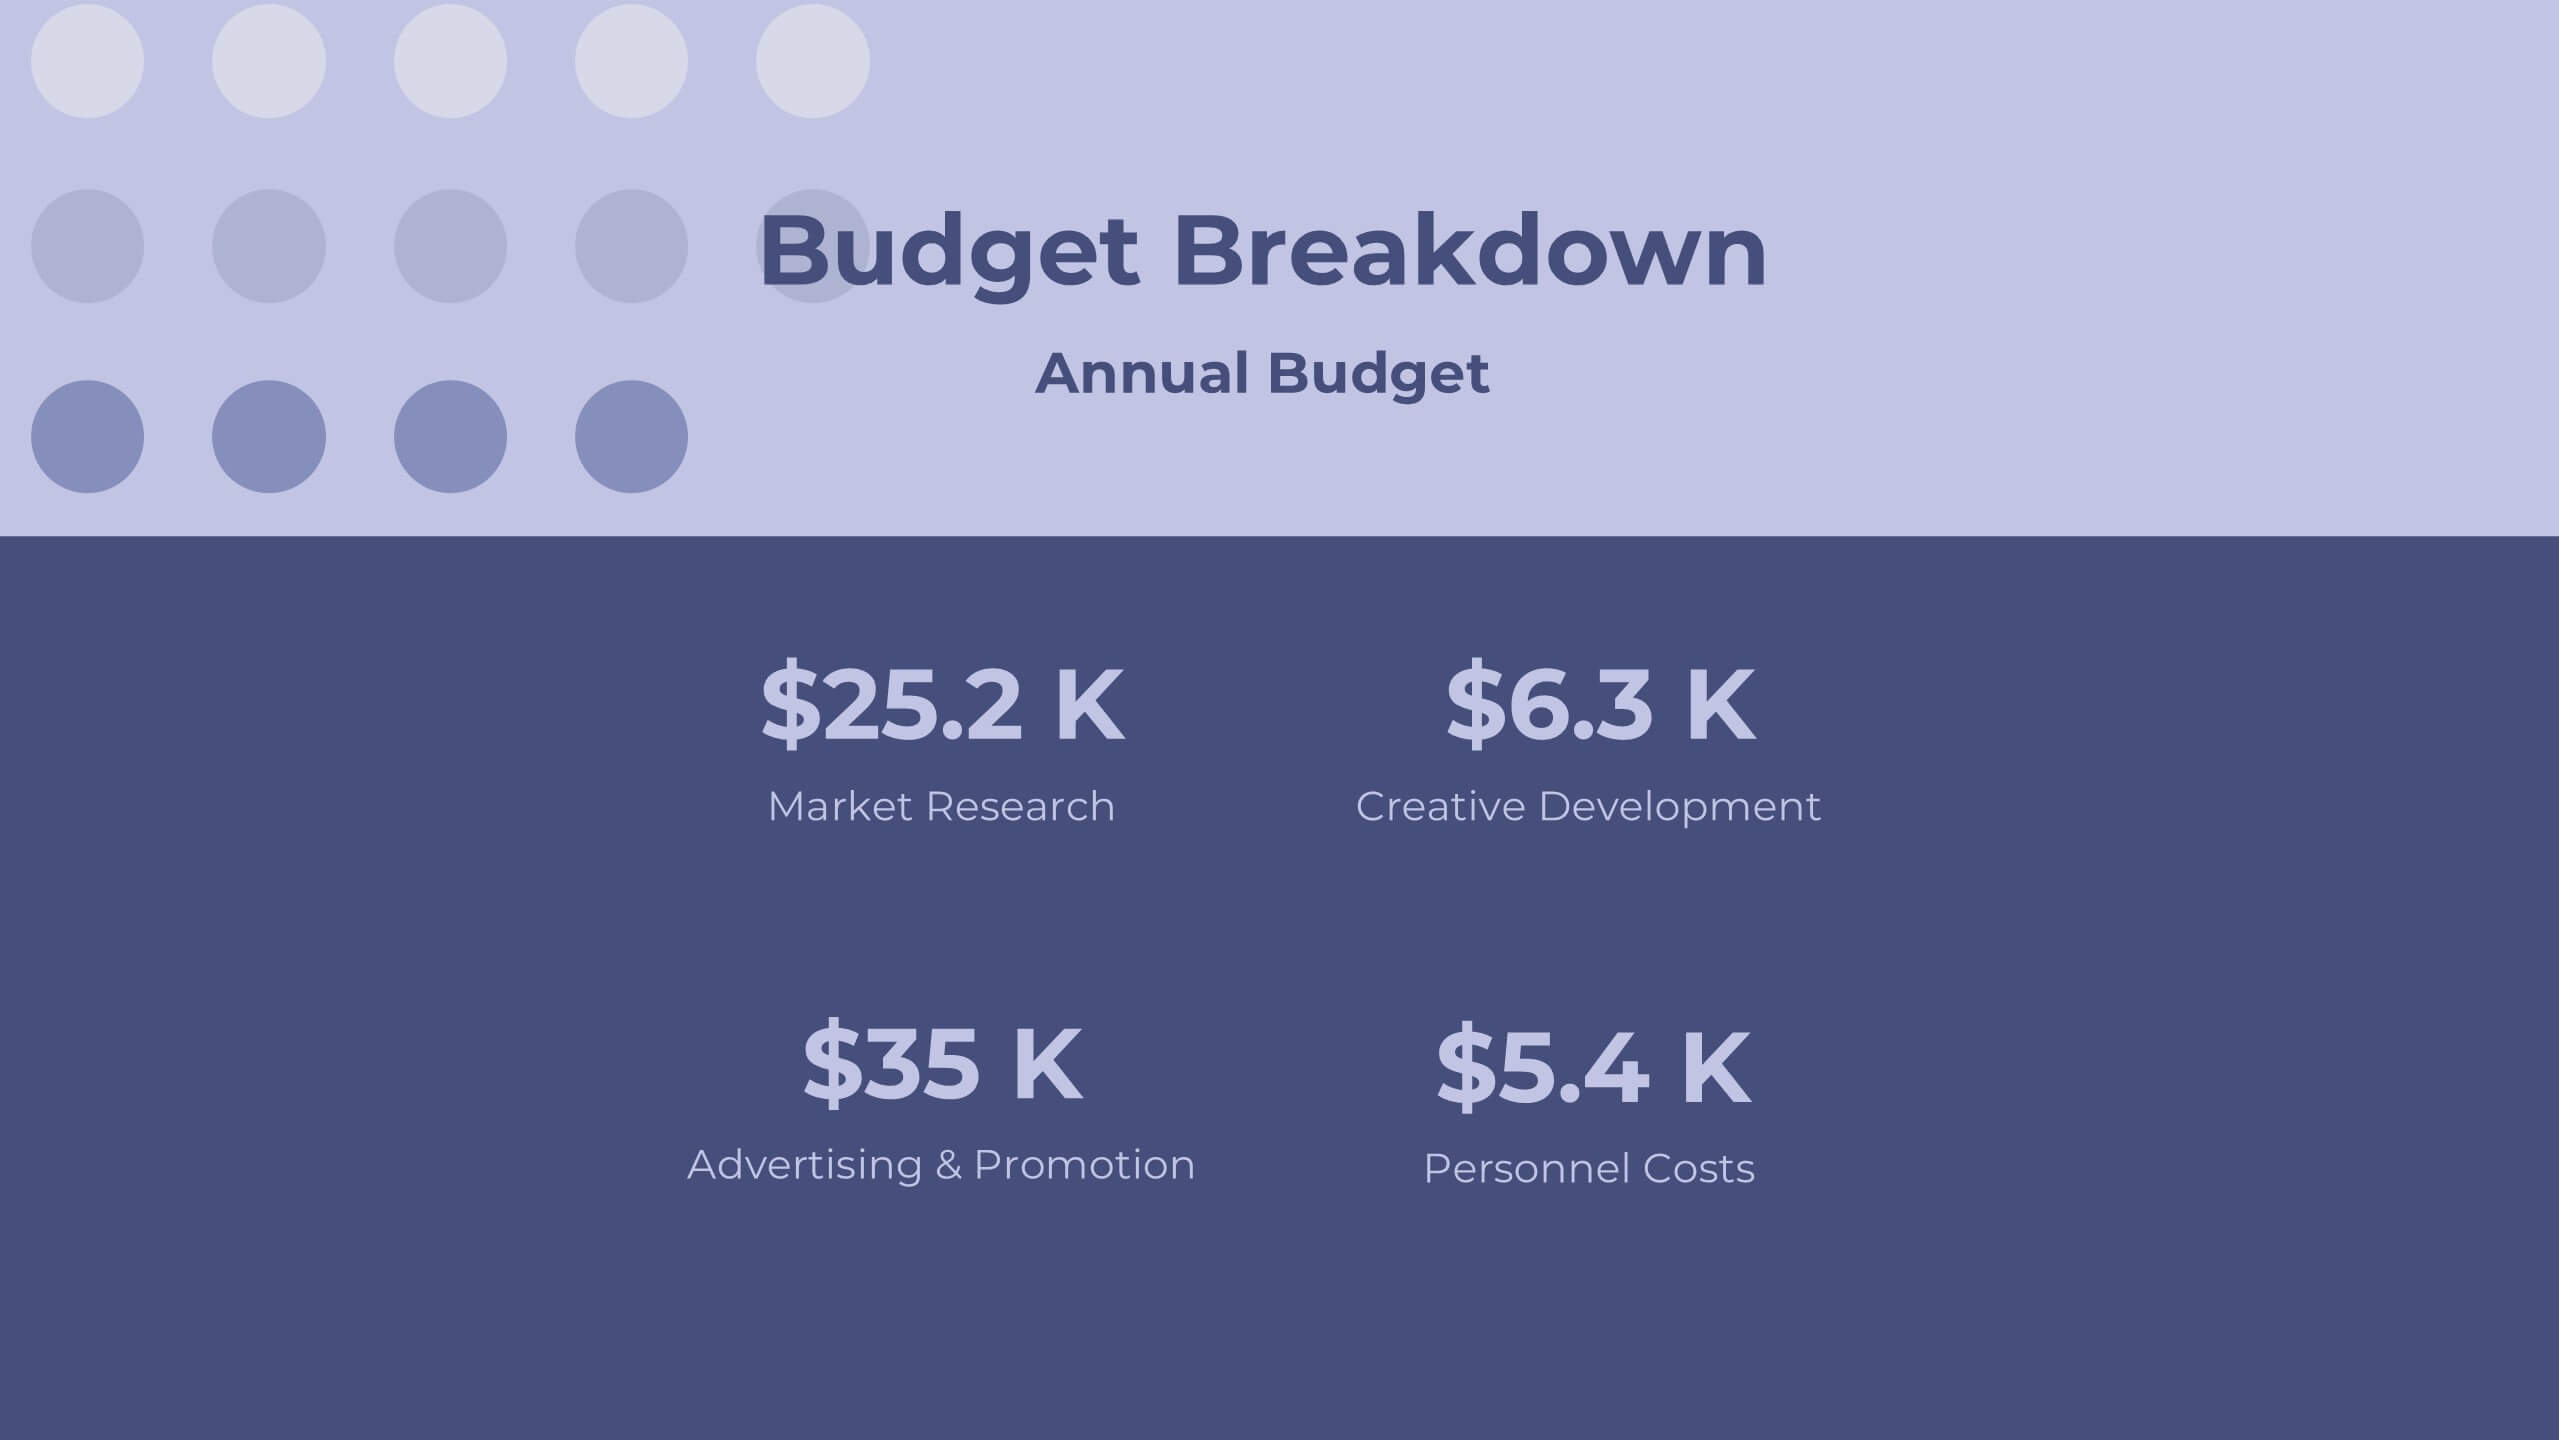
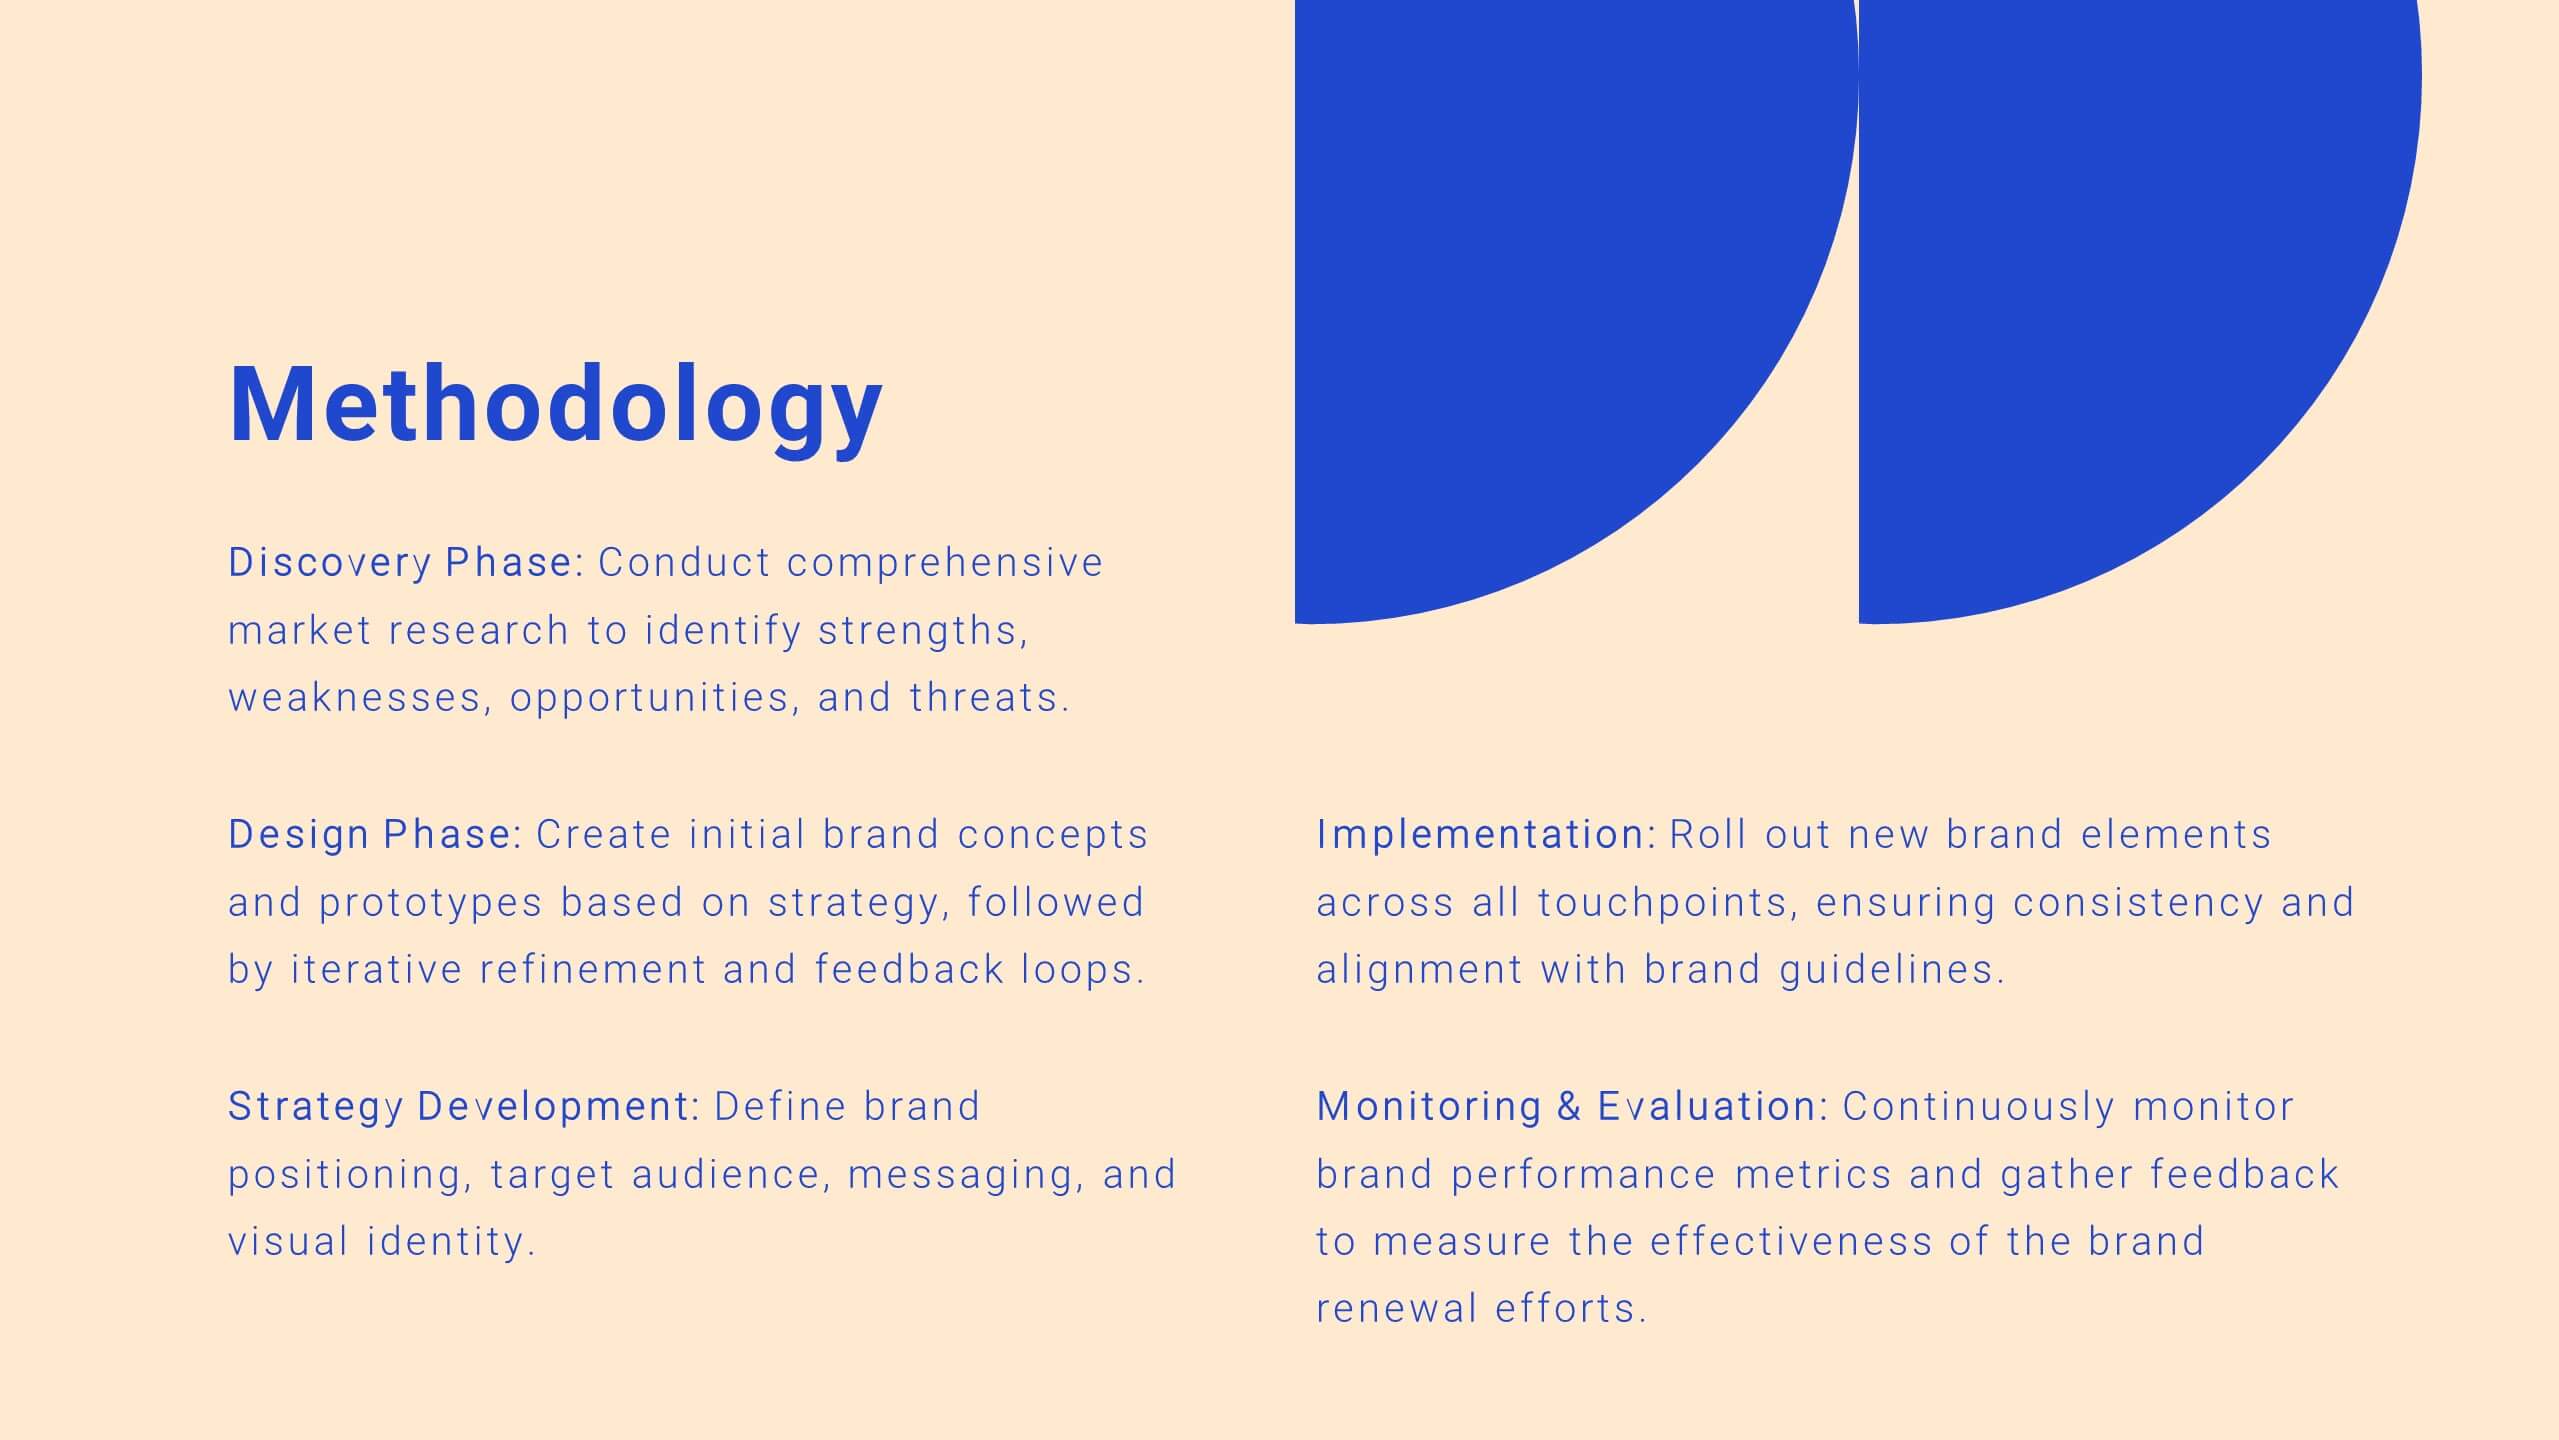
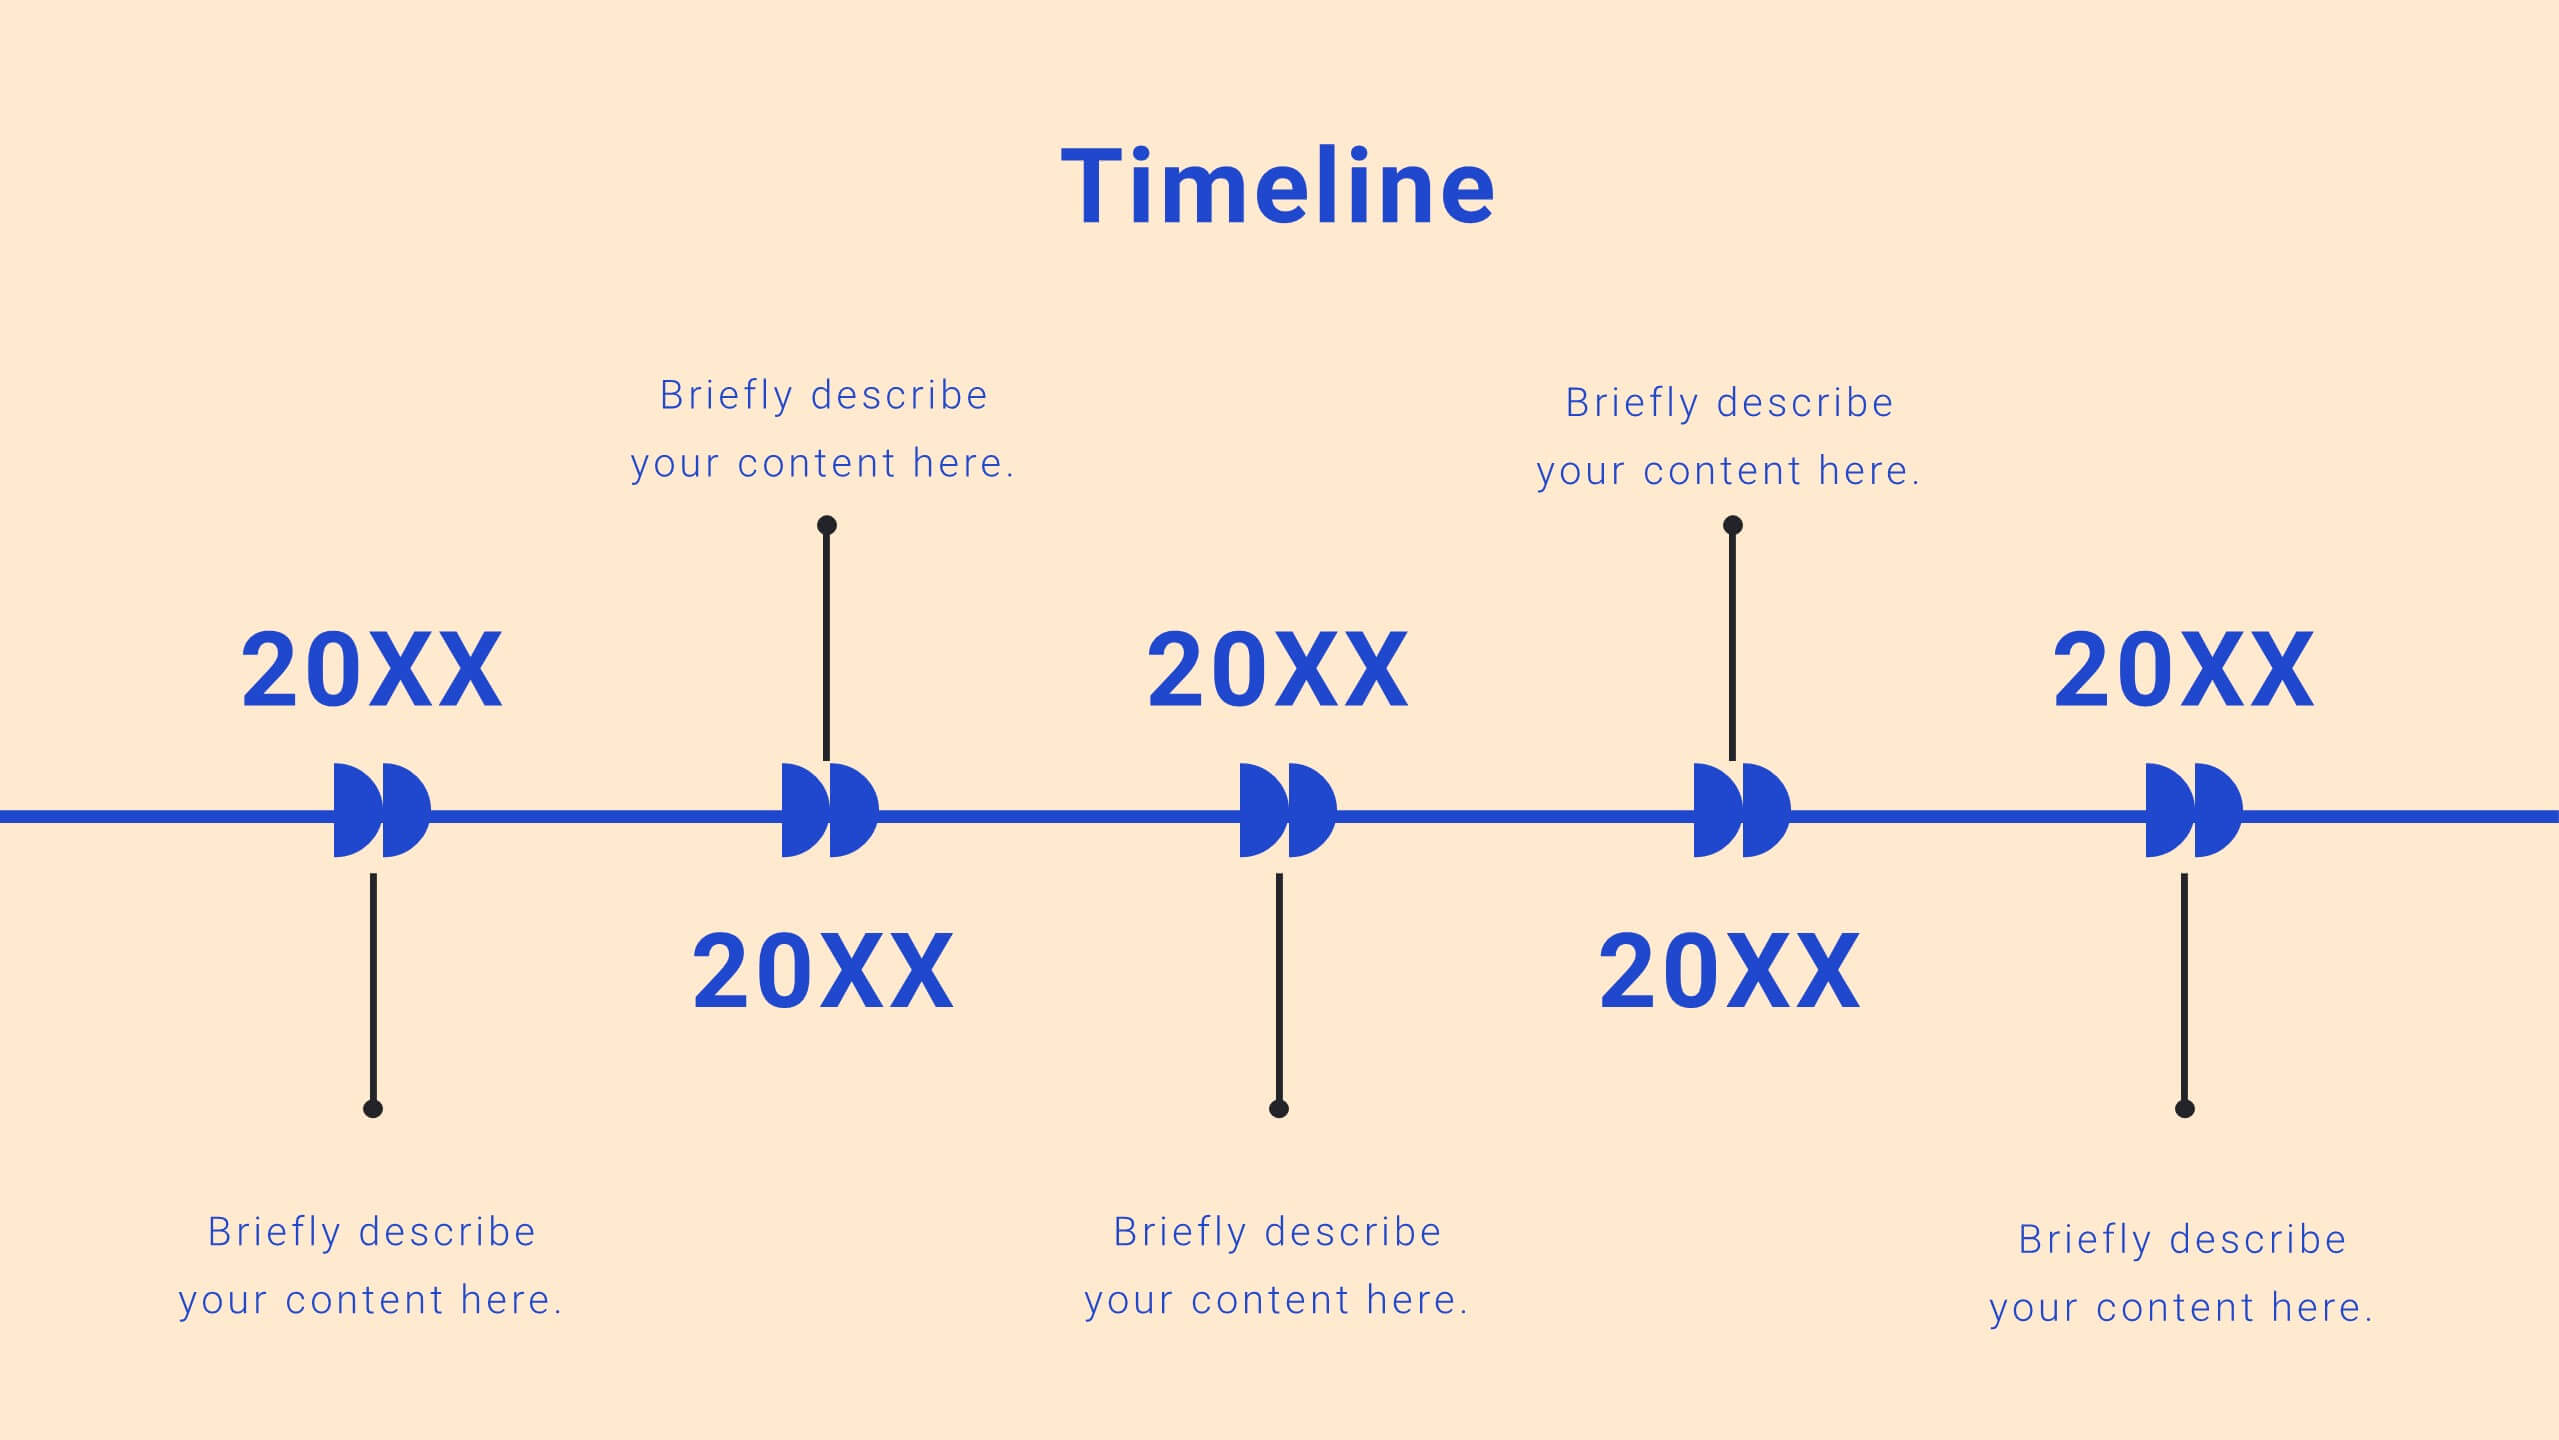
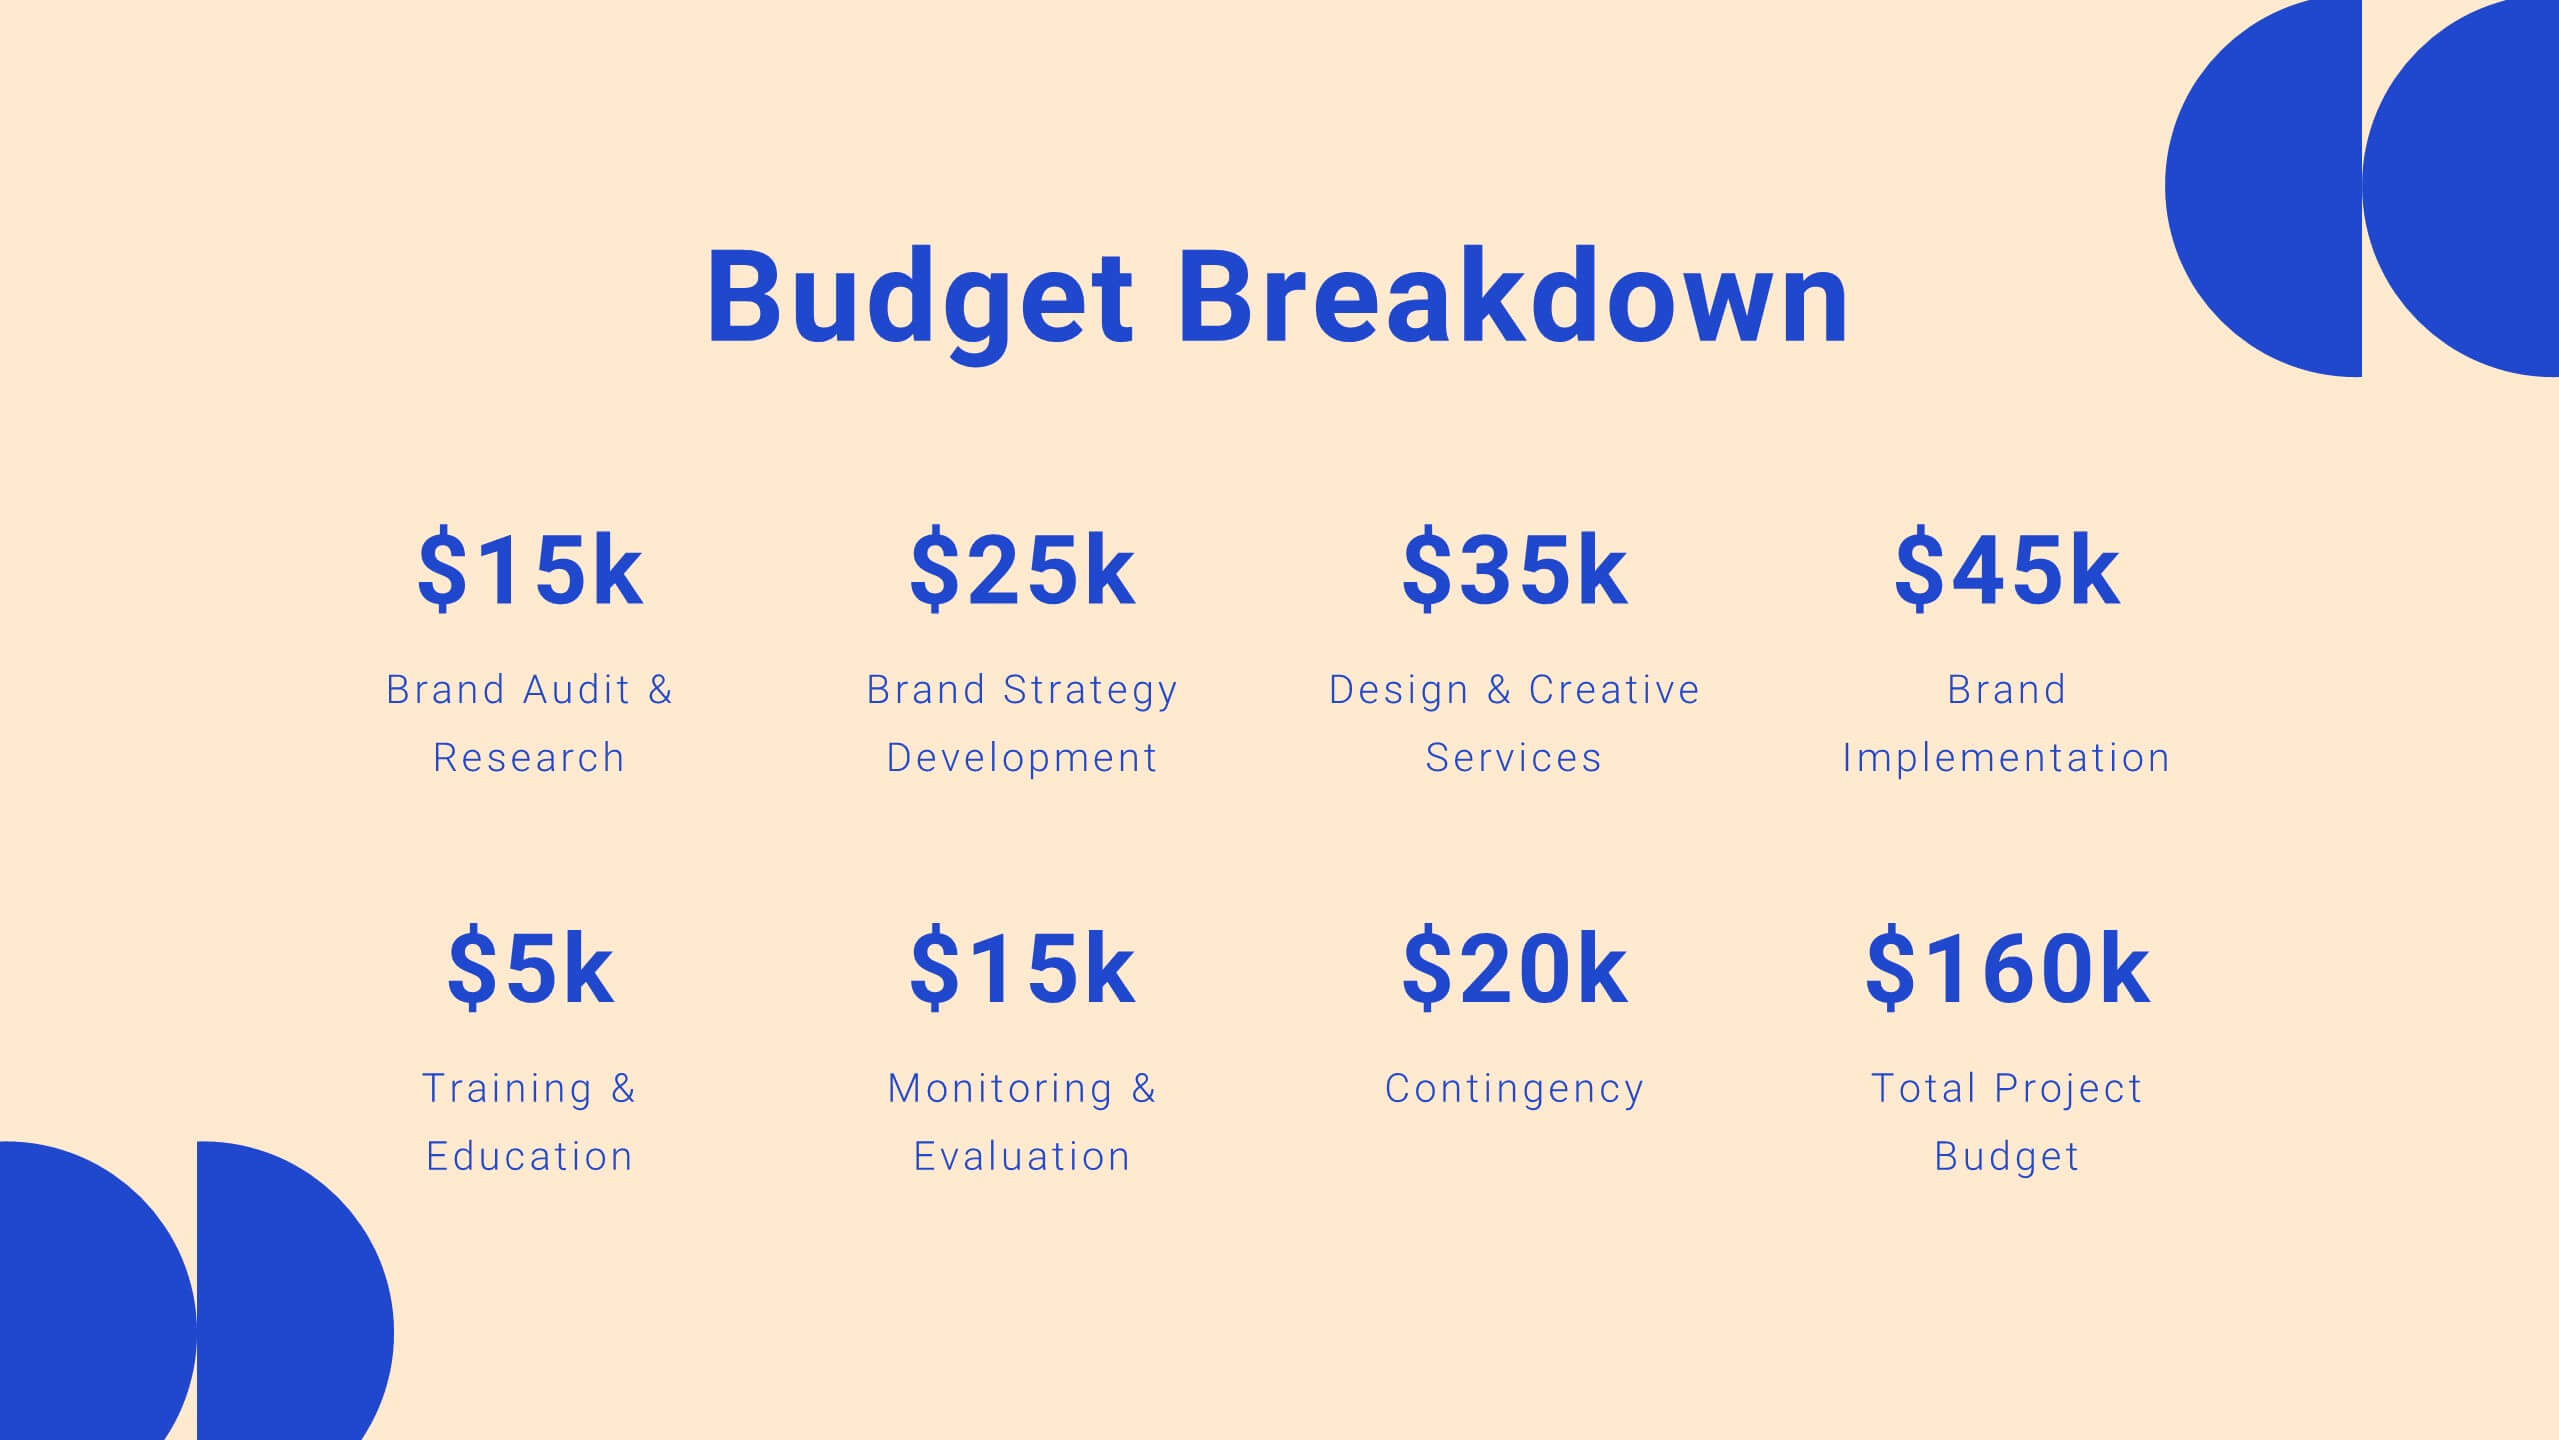
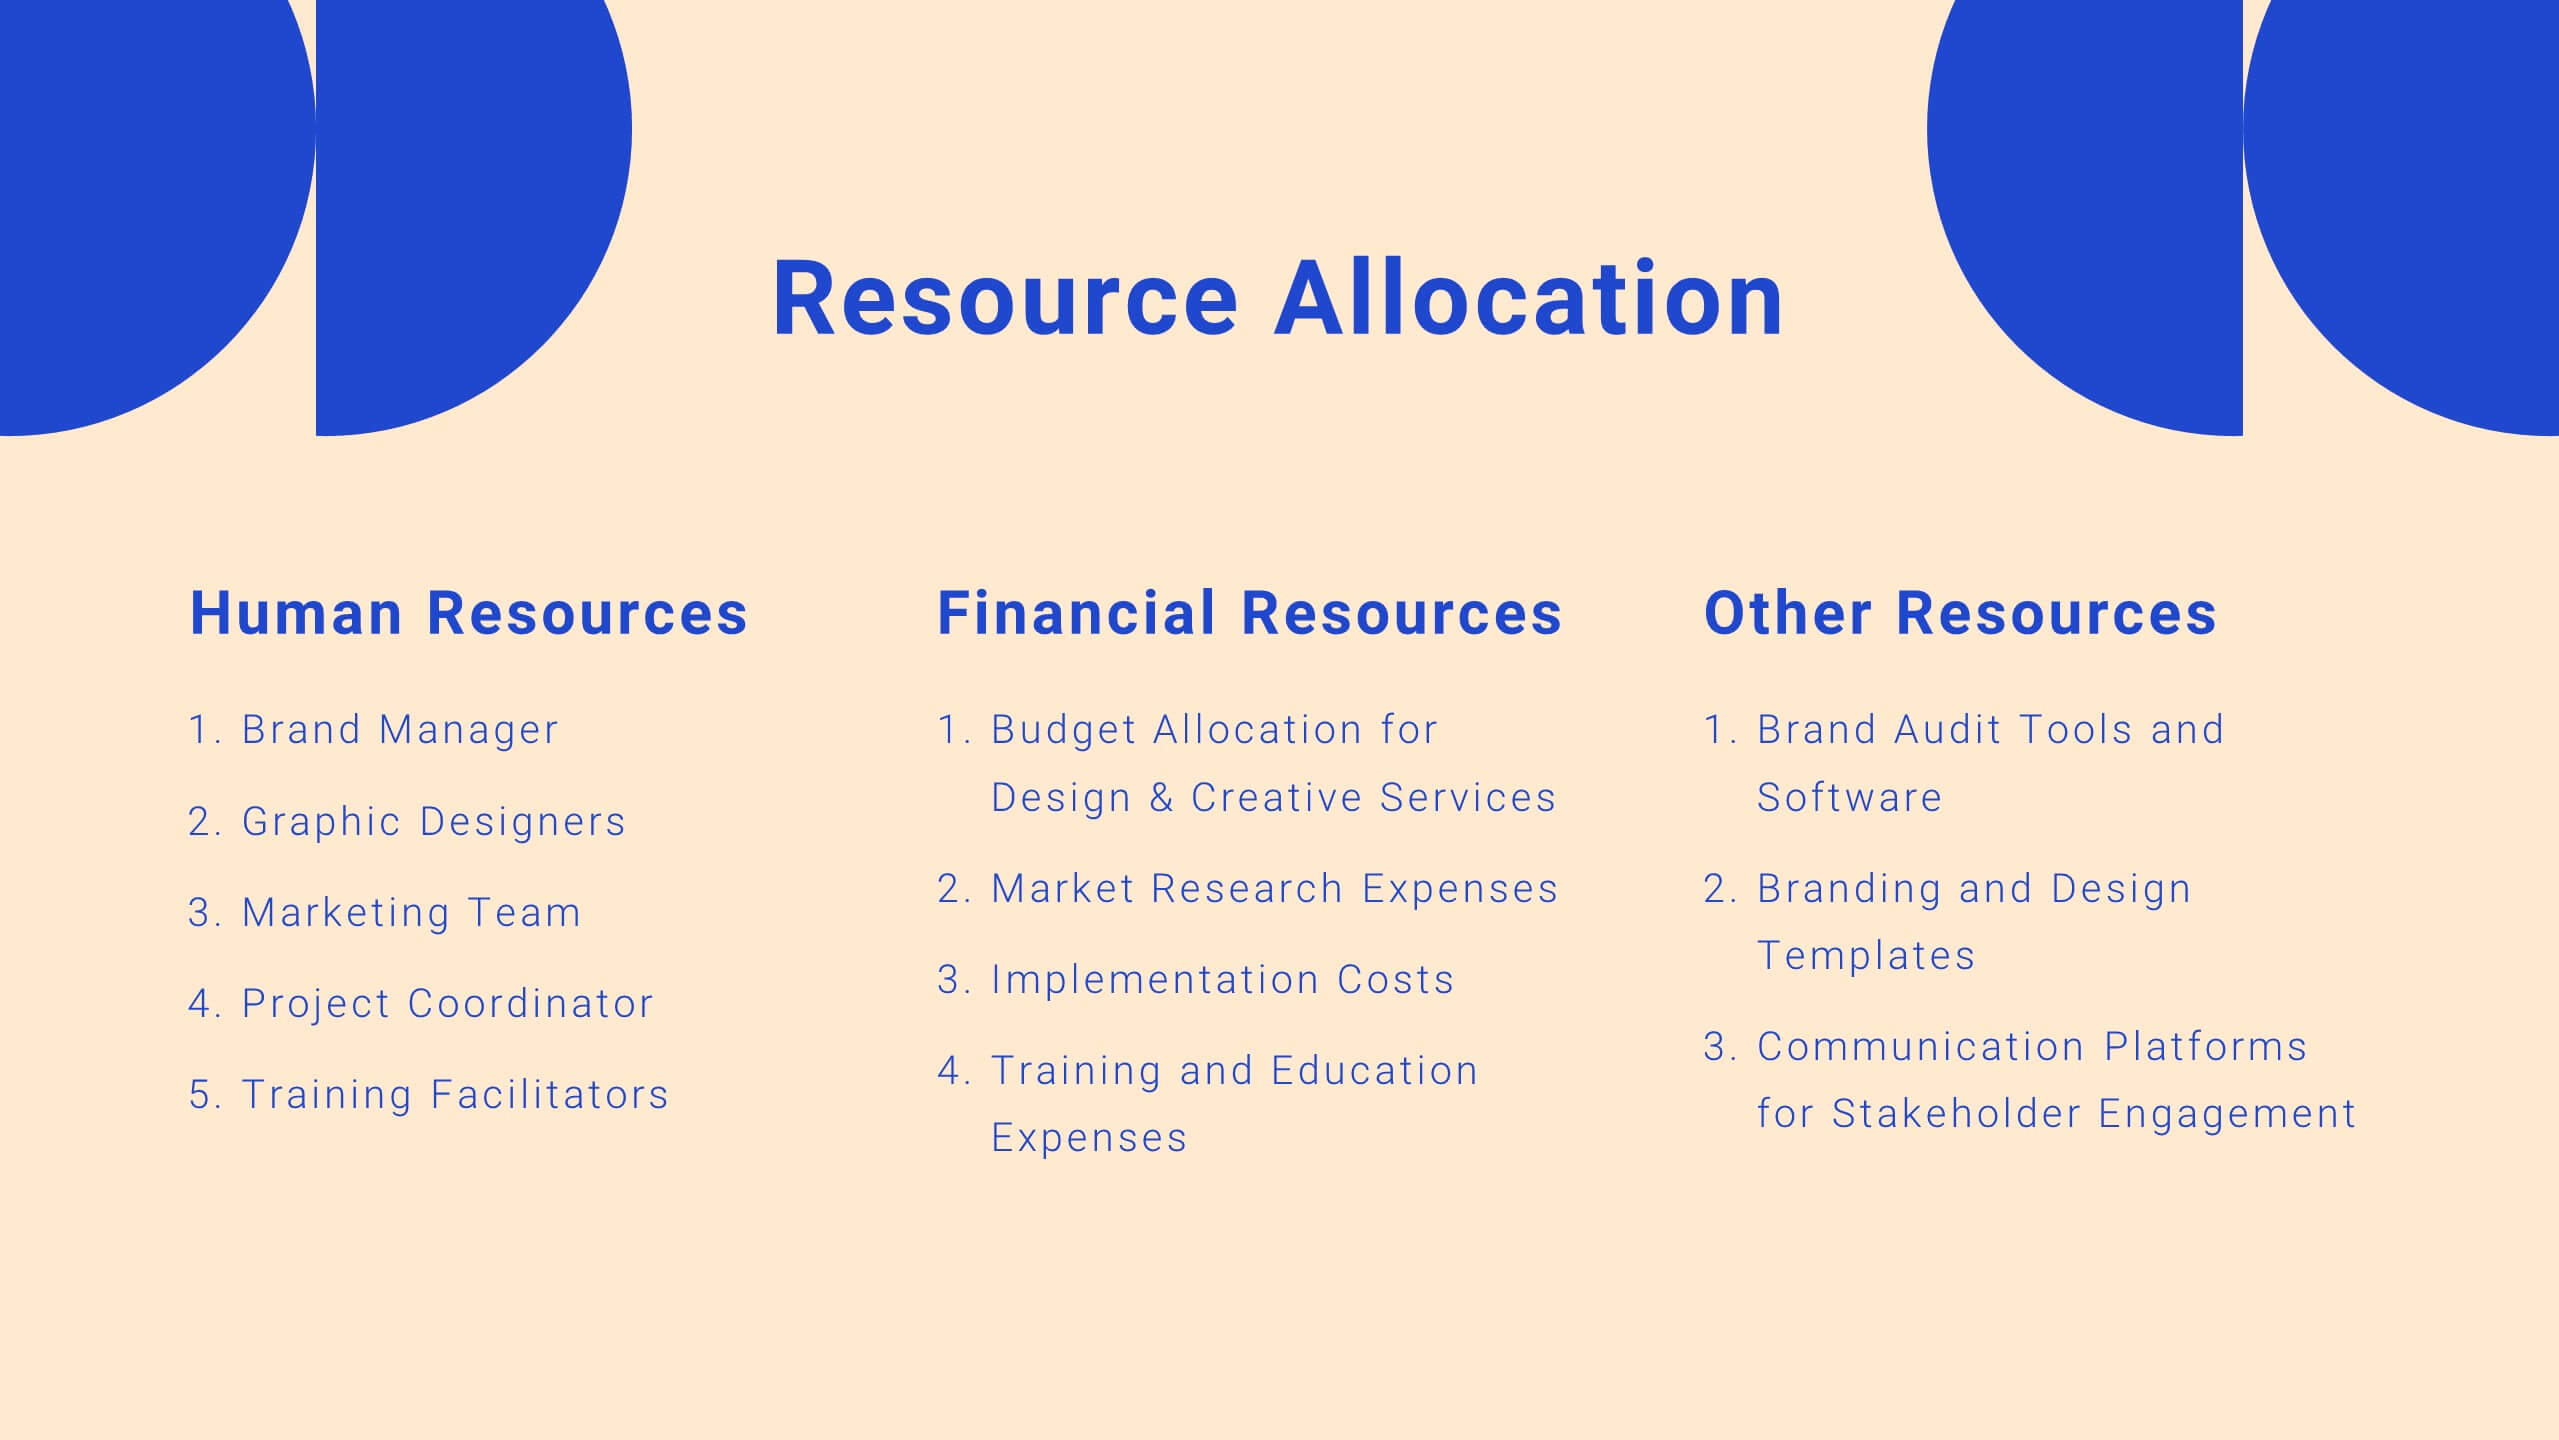
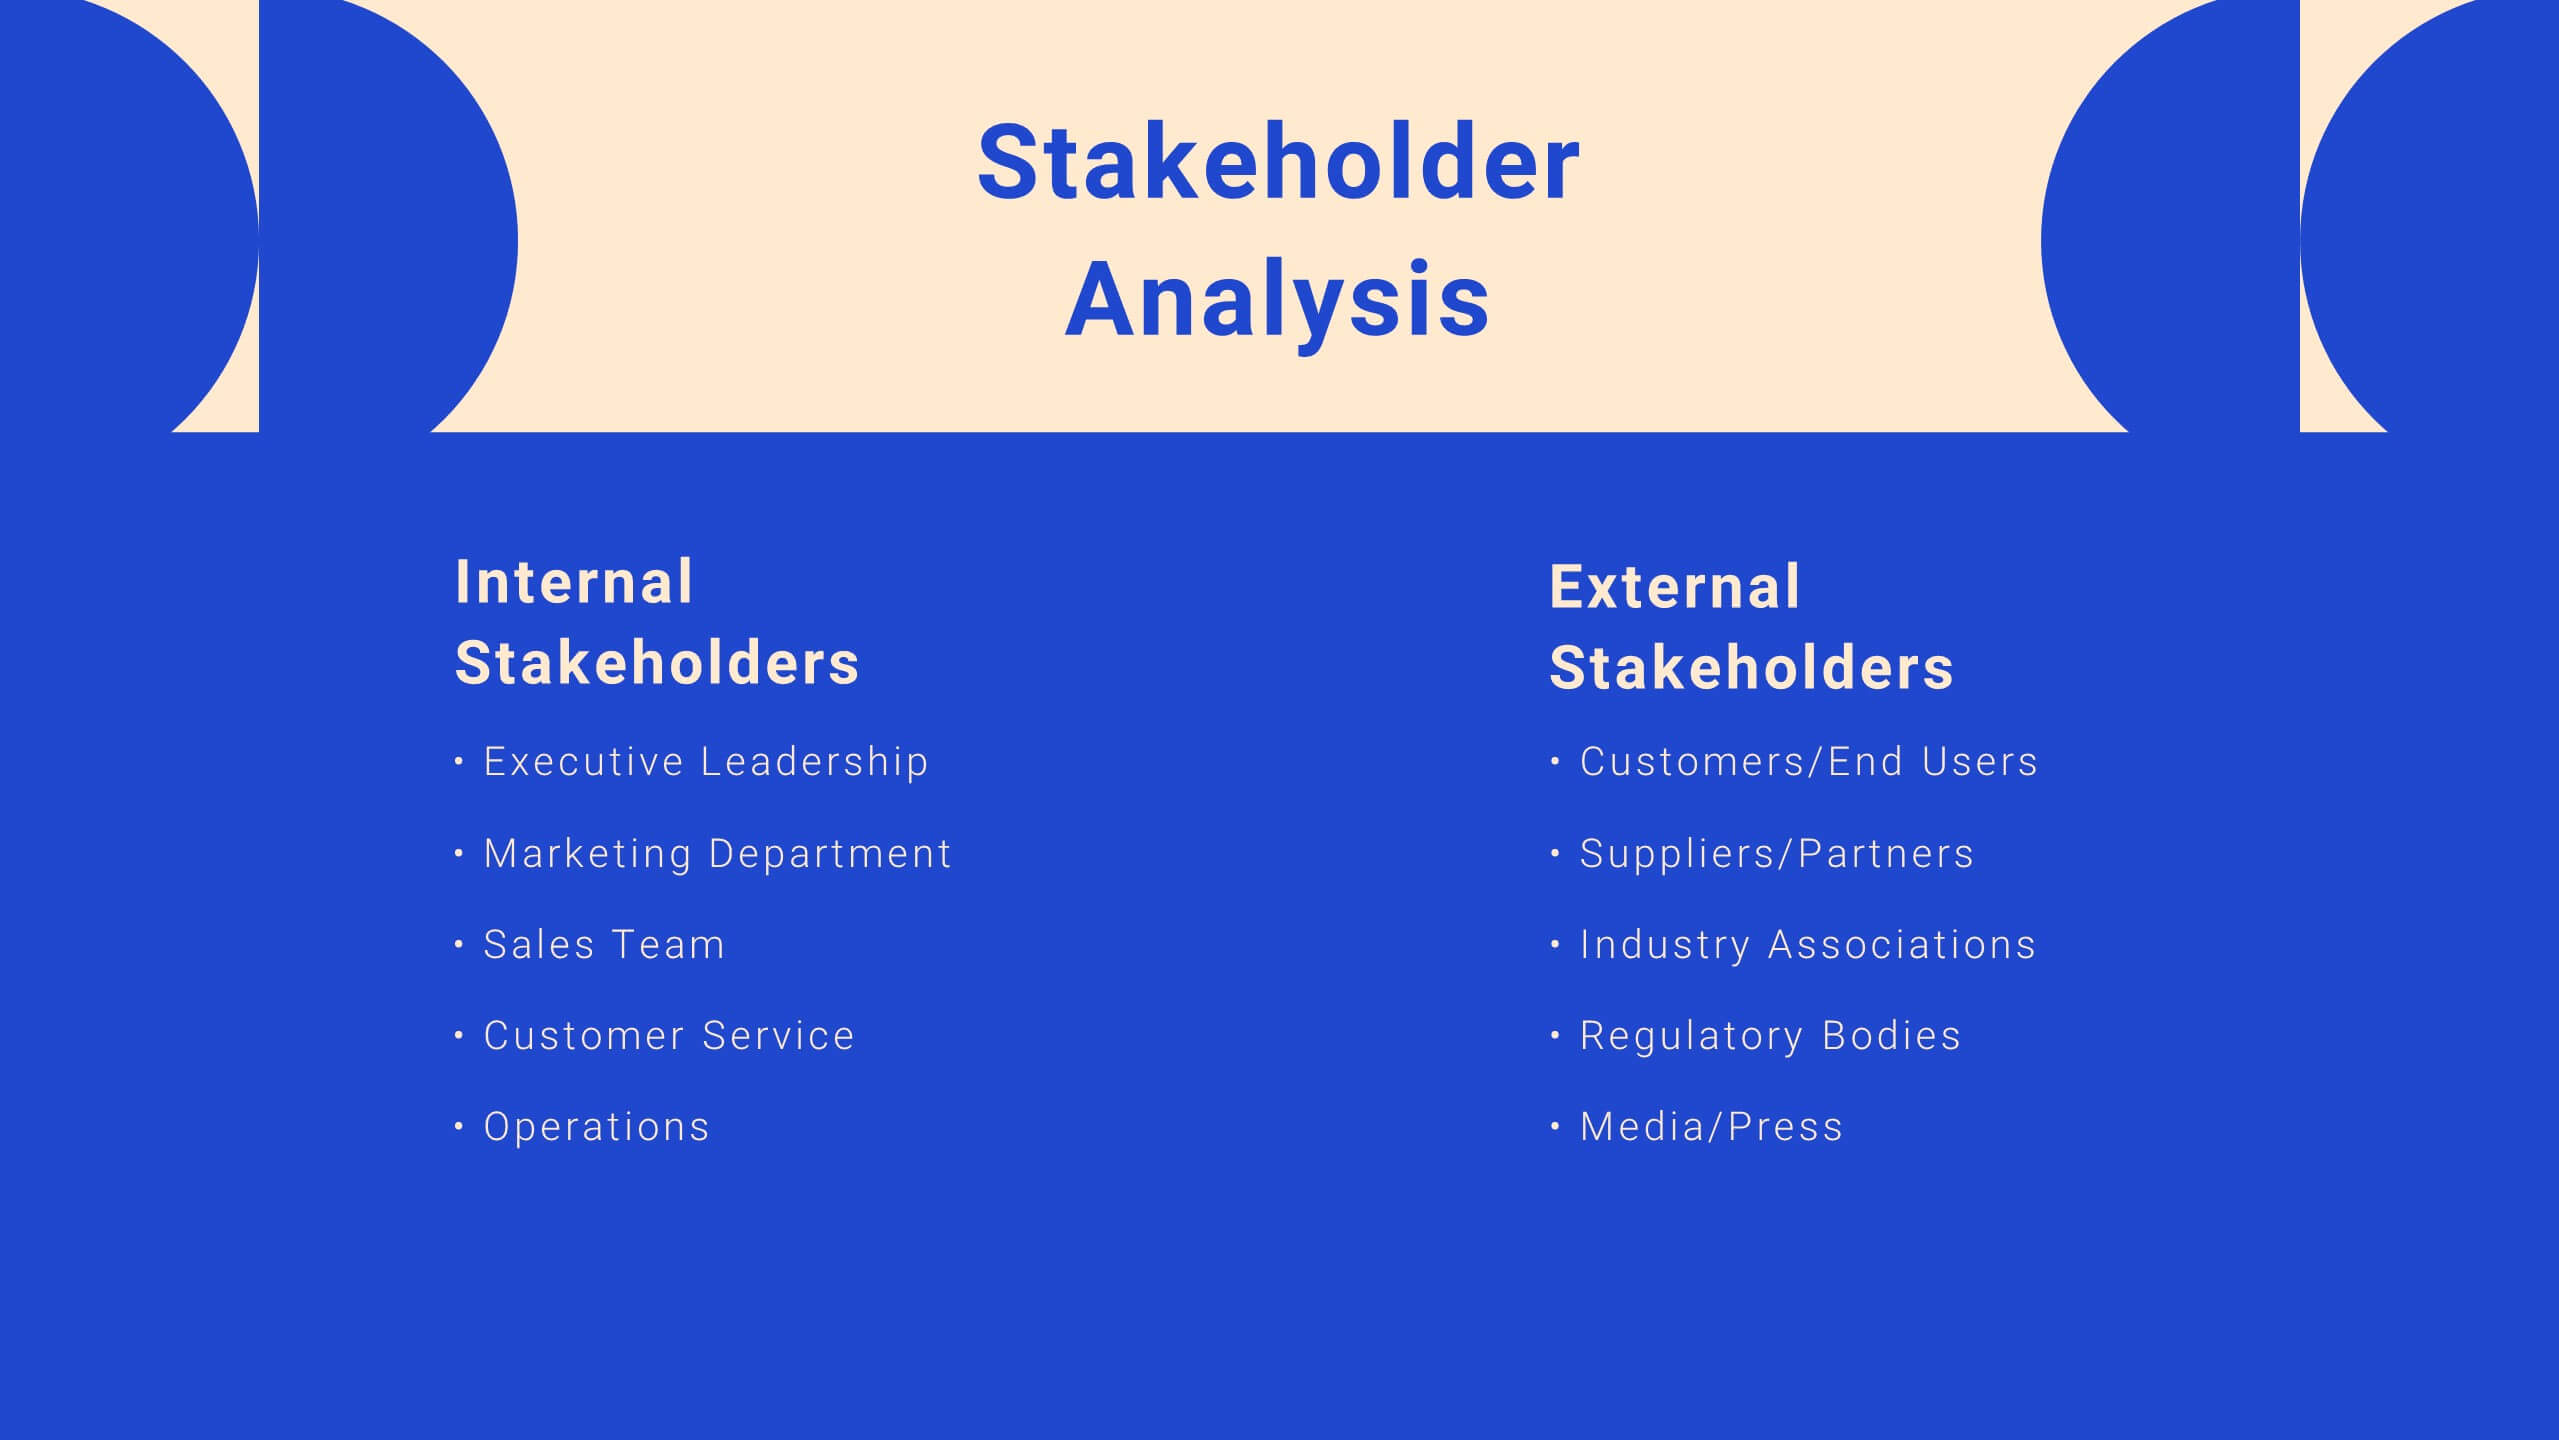
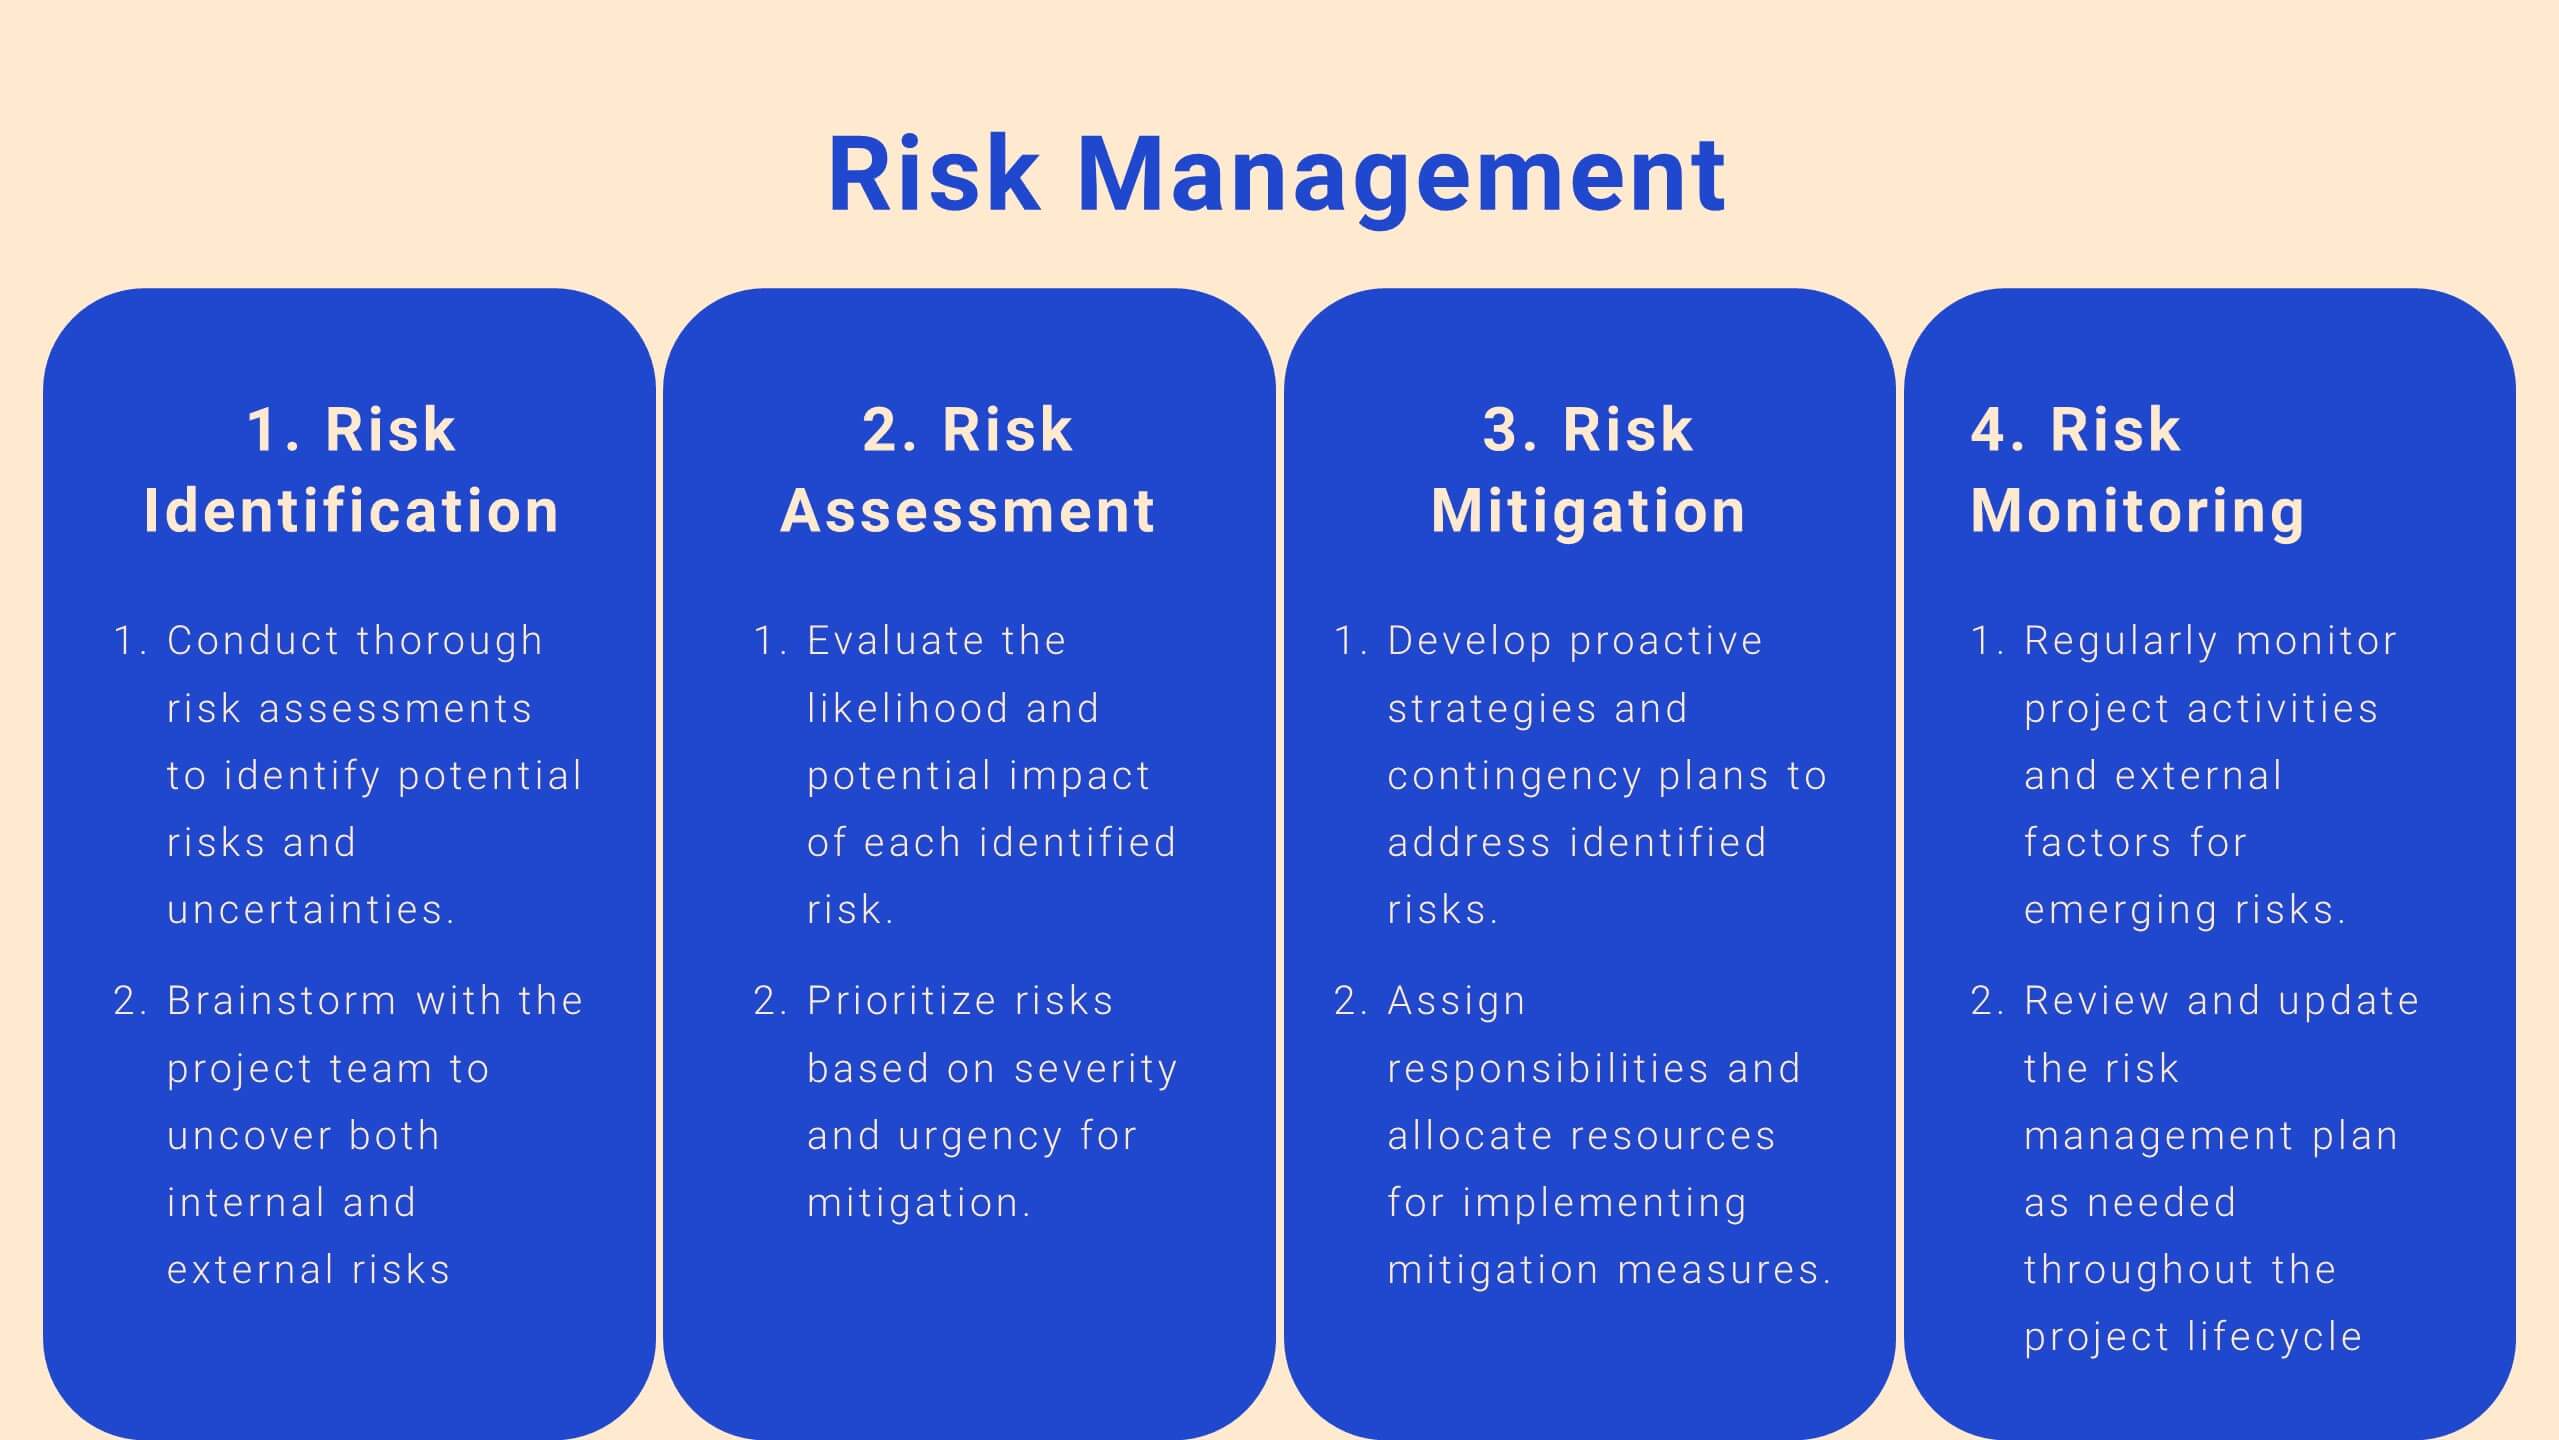
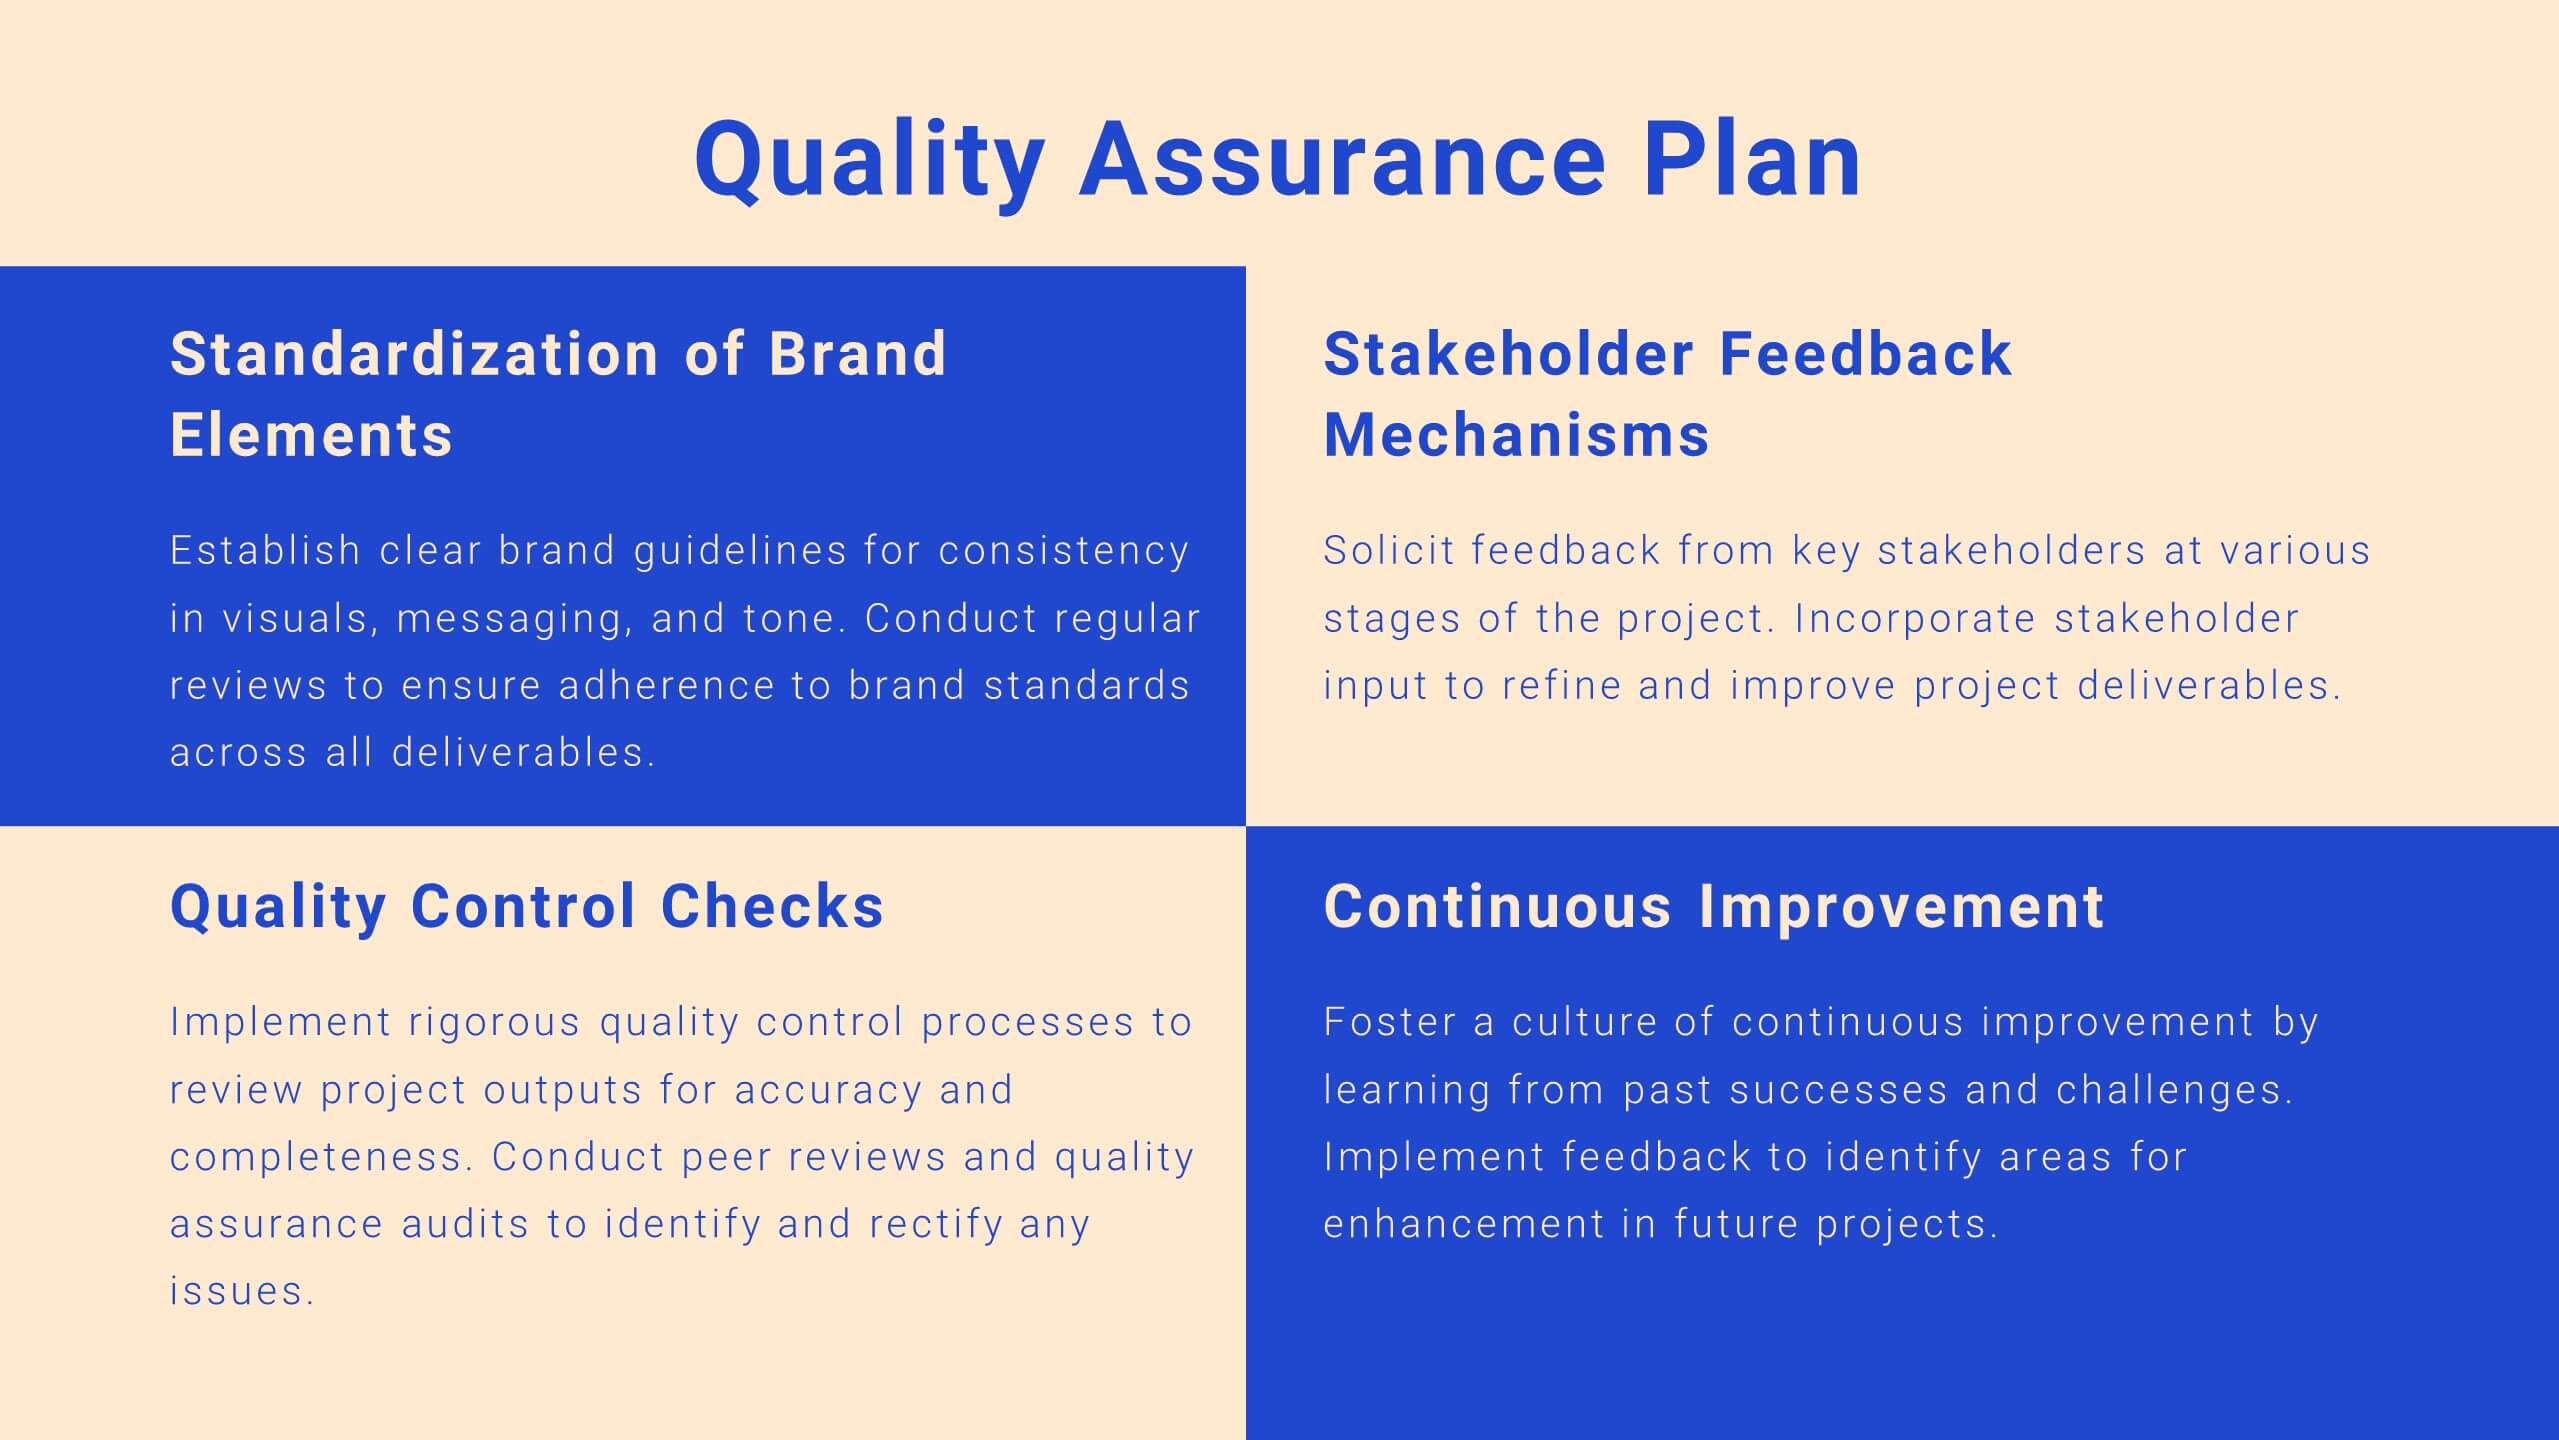
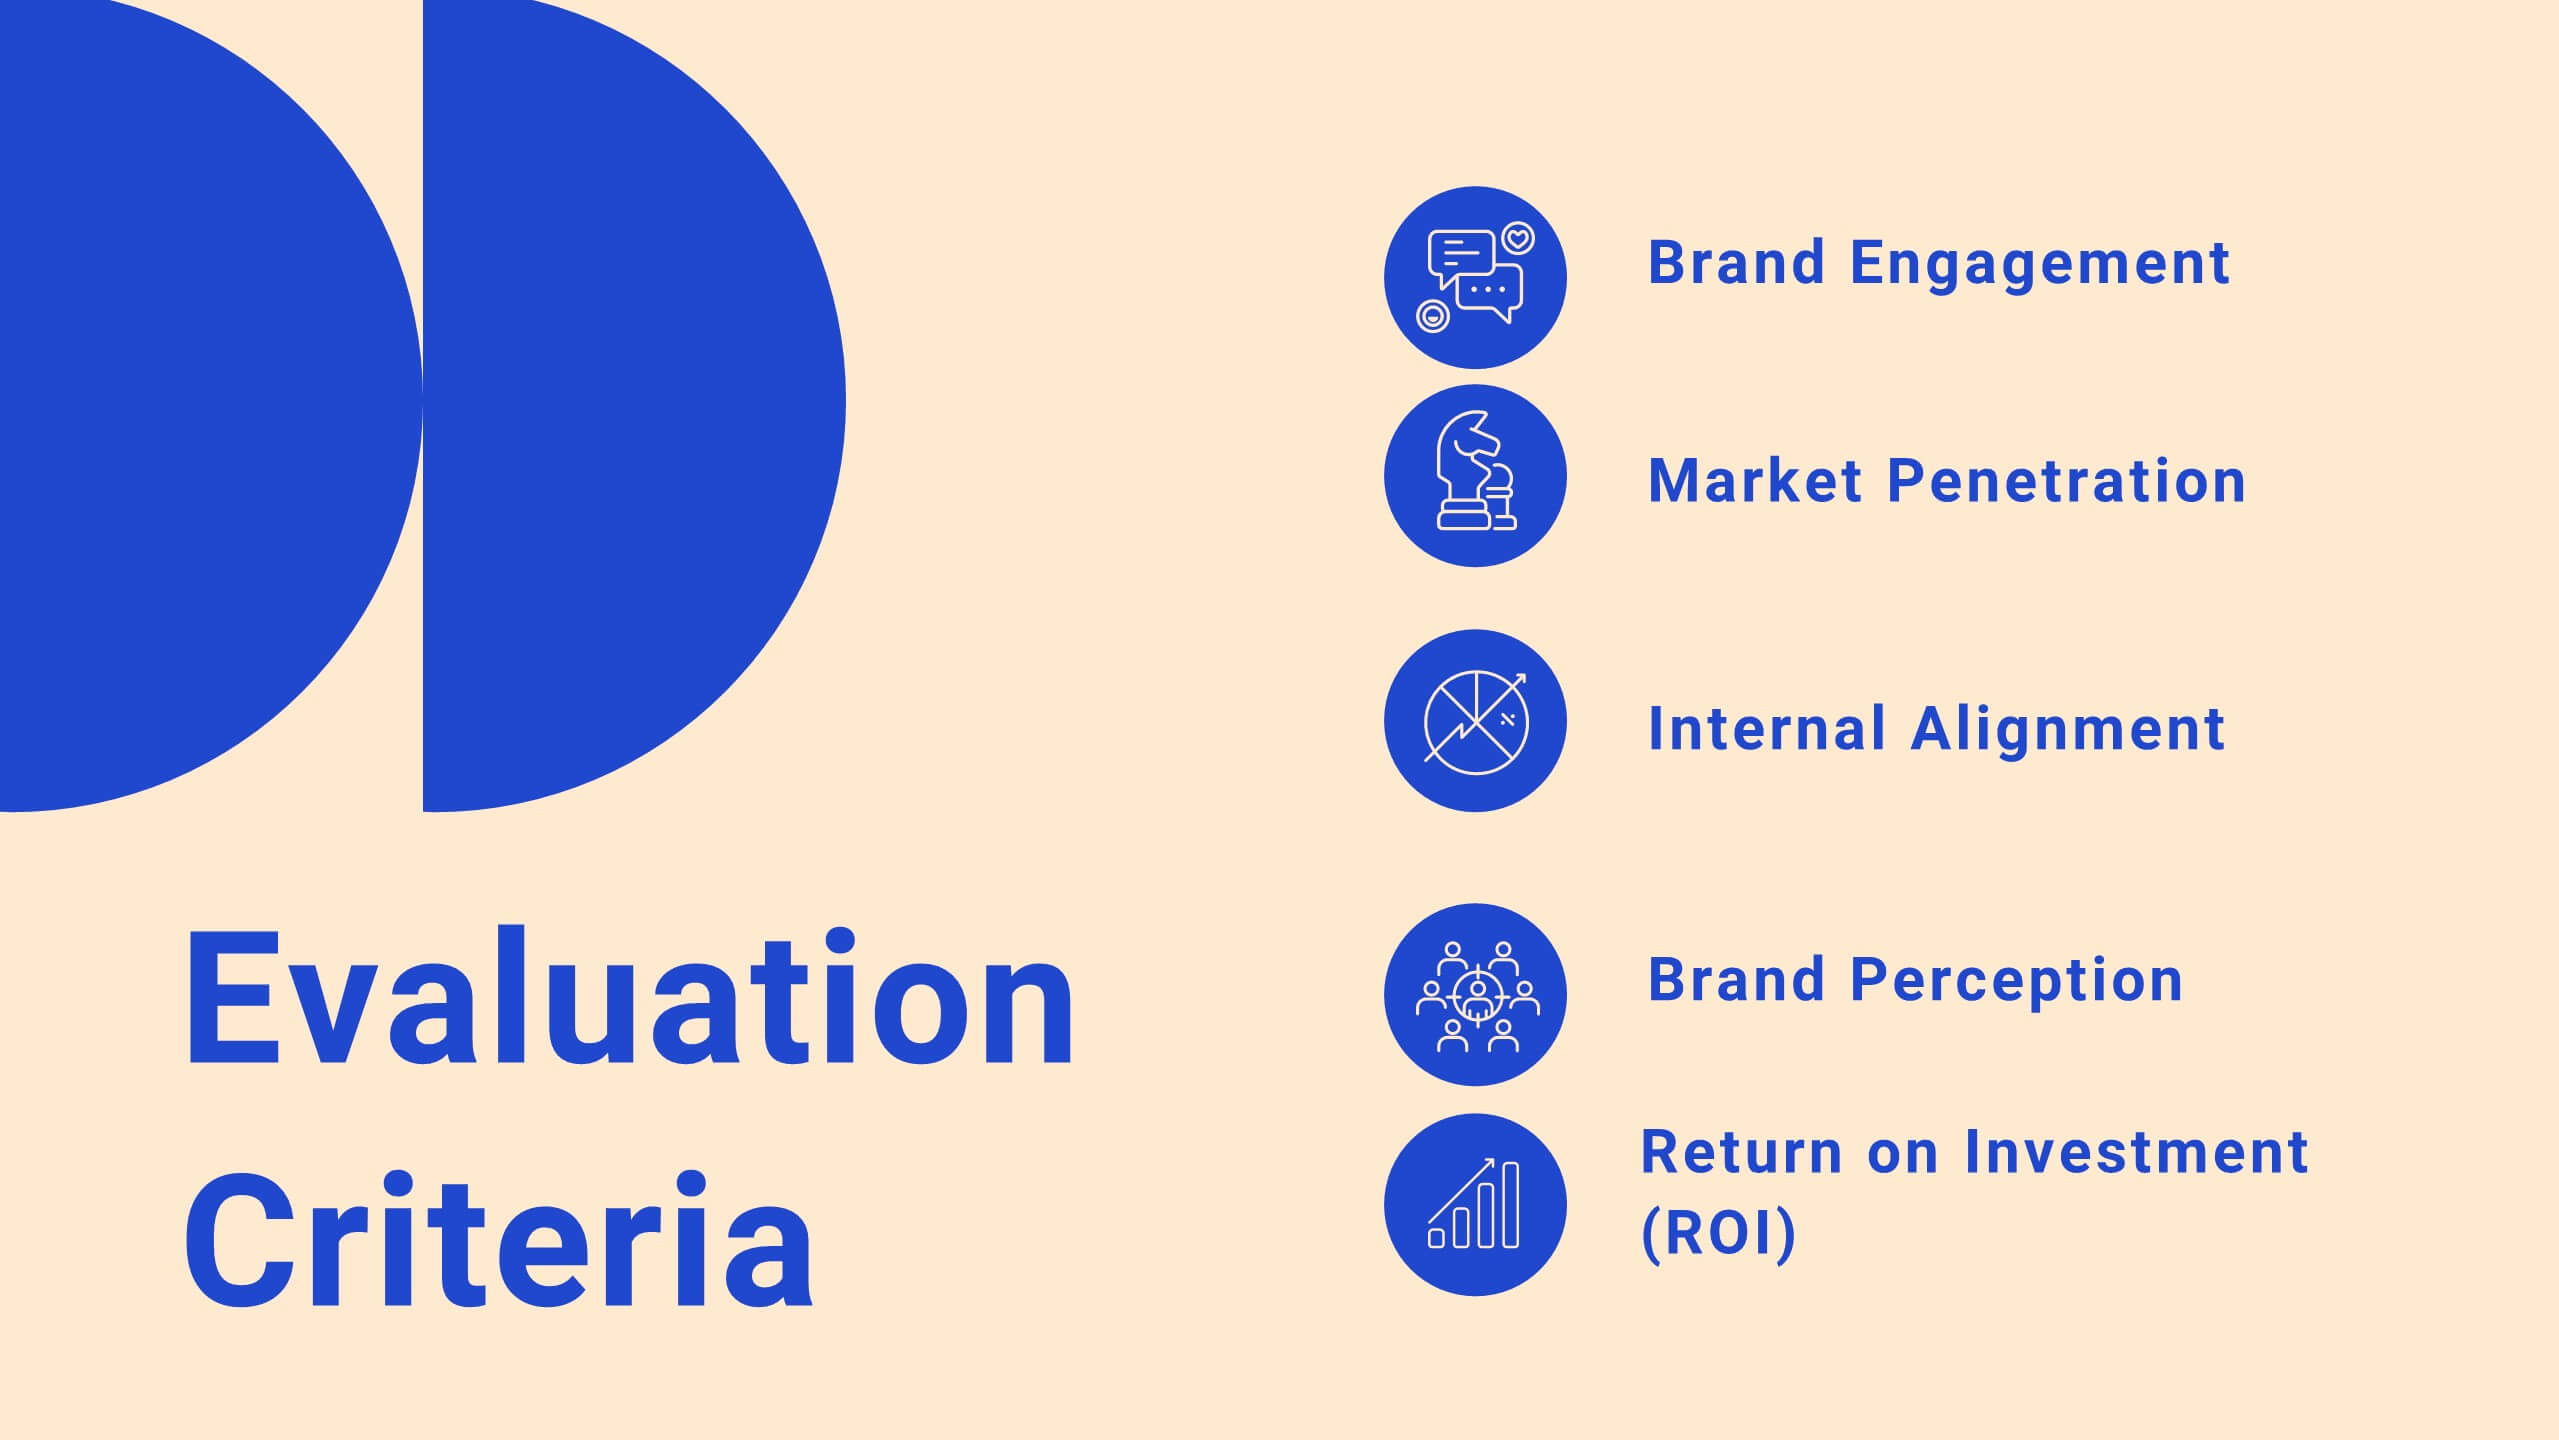
Drift Agile Project Plan Presentation
Take control of your projects with this comprehensive project plan template! From introductions to detailed objectives, this template covers scope of work, methodology, timelines, budget breakdowns, and risk management. Ideal for ensuring your project stays on track, it also includes stakeholder analysis and quality assurance plans. Compatible with PowerPoint, Keynote, and Google Slides.


7 slides
Innovation Technology Infographics
Innovation technology refers to the application of technology or the use of innovative approaches to create new products, services, processes, or business models. This infographic template is designed to showcase the cutting-edge technologies shaping our future. Let the vibrant visuals and insightful content guide you through the exciting realm of innovation and technology. Compatible with Powerpoint, Keynote, and Google Slides. Fully customizable, explore this infographic and step into the future. The visuals are designed to ignite your imagination and enlighten your audience about the limitless potential of innovation and technology.