


Features
- 6 Unique slides
- Fully editable and easy to edit in Microsoft Powerpoint, Keynote and Google Slides
- 16:9 widescreen layout
- Clean and professional designs
- Export to JPG, PDF or send by email


Do you have any questions?
Recommend


6 slides
2-Option Comparison Chart Presentation
Make your decision-making story pop with a clean, energetic layout that clearly contrasts two paths side by side. This presentation helps you compare options, outline pros and cons, and guide audiences toward confident choices with sharp visual structure. Fully compatible with PowerPoint, Keynote, and Google Slides.


5 slides
Eco-Friendly Practices Summary Presentation
Bring your green initiatives to life with a vibrant, city-inspired visual that makes sustainability easy to explain and engaging to explore. This presentation helps you outline key eco-friendly efforts, goals, and results in a clean, modern layout. Fully customizable and compatible with PowerPoint, Keynote, and Google Slides.


21 slides
Terraflare Project Status Report Presentation
Keep stakeholders updated with this comprehensive project status report template, featuring agenda, key highlights, performance metrics, project progress, risk assessments, and goals. Easily track progress, strategic initiatives, and team productivity. Perfect for PowerPoint, Keynote, and Google Slides, ensuring clear communication of project updates and priorities.


5 slides
Key Business Benefits and Value
Present your organization’s core strengths using this 4-part value diagram. Ideal for outlining benefits, service pillars, or strategic goals, the slide features directional arrows with matching icons for clarity and structure. Easy to customize in PowerPoint, Keynote, and Google Slides—adjust text, icons, and colors to align with your business branding.


26 slides
HIIT Workout Pink Presentation
Unleash the energy with our vibrant HIIT gym workout presentation template, a dynamic blend of pink, red, orange, and yellow, designed to bring your fitness regime to life. This energetic palette is perfect for gym owners, fitness influencers, and personal trainers aiming to showcase the high-intensity intervals that promise fast results. The template offers various graphics, icons, and image placeholders that add a visual punch to your information. Dive into creating an engaging, motivational fitness journey that highlights the benefits, routines, and transformative power of HIIT workouts, ensuring your audience is pumped and ready to go!


5 slides
Managing Product Maturity and Decline
Effectively visualize each phase of a product’s lifecycle with this curve-style infographic—from introduction to decline. Ideal for business strategy, product development, or market lifecycle planning. Fully editable in PowerPoint, Keynote, or Google Slides for seamless customization.


6 slides
5-Year Financial Forecast Slide Presentation
Show your long-term growth with a clean, visual touch that makes numbers easy to follow and goals clear to everyone. This modern layout highlights yearly progress using engaging icons and percentage indicators, perfect for financial reports or investor decks. Fully compatible with PowerPoint, Keynote, and Google Slides for seamless editing.


4 slides
Preventive Health Services Layout Presentation
Make health data more human with this modern infographic layout for service-based reporting. This preventive health slide design clearly maps wellness categories to body parts, making it easy to communicate medical insights and early intervention strategies. Fully editable and compatible with PowerPoint, Keynote, and Google Slides for smooth integration into any deck.


10 slides
AI Impact on Business and Innovation Presentation
Deliver insights with precision using this data-driven presentation template tailored for machine learning, AI, and analytics topics. Featuring a central hub-and-spoke design, this layout allows you to showcase key components like algorithms, tools, processes, or data sources. Each segment includes clean icons and customizable titles for seamless editing. Ideal for data scientists, tech professionals, and academic presentations. Fully editable in PowerPoint, Keynote, and Google Slides.


3 slides
Governance and Compliance Framework Presentation
Strengthen your organization's structure with our Governance and Compliance Framework template. This visually compelling template is crafted to effectively communicate the integration of governance, compliance, and risk management. It is ideal for demonstrating how these elements collaborate to uphold regulatory standards and manage business risks. Fully compatible with PowerPoint, Keynote, and Google Slides, it's an essential tool for any corporate governance presentation aimed at promoting effective, compliant business practices.
8 slides
Creative Alphabet Visual Reference Presentation
This creative presentation uses a bold A–B–C visual structure to highlight key points in a clean, modern layout. Ideal for overviews, comparisons, or step-by-step frameworks. Fully customizable in Canva, it balances design and clarity—perfect for business strategies, education, or visual storytelling with strong alphabetical cues and icon integration.


20 slides
Egeria Artist Portfolio Presentation
Showcase your artistry with this vibrant portfolio template, featuring sections for project displays, creative process, awards, and testimonials. Perfect for artists seeking a polished presentation of their work. Customizable and suitable for PowerPoint, Keynote, and Google Slides, this template highlights your unique style and professional journey.


6 slides
Customer Perceived Value Analysis
Visualize what matters most to your audience using this customer-centric diagram. Perfect for marketers, brand strategists, and CX professionals looking to present value drivers, motivations, or user insights. Easily editable in PowerPoint, Keynote, and Google Slides—customize colors, icons, and text to align with your brand.


22 slides
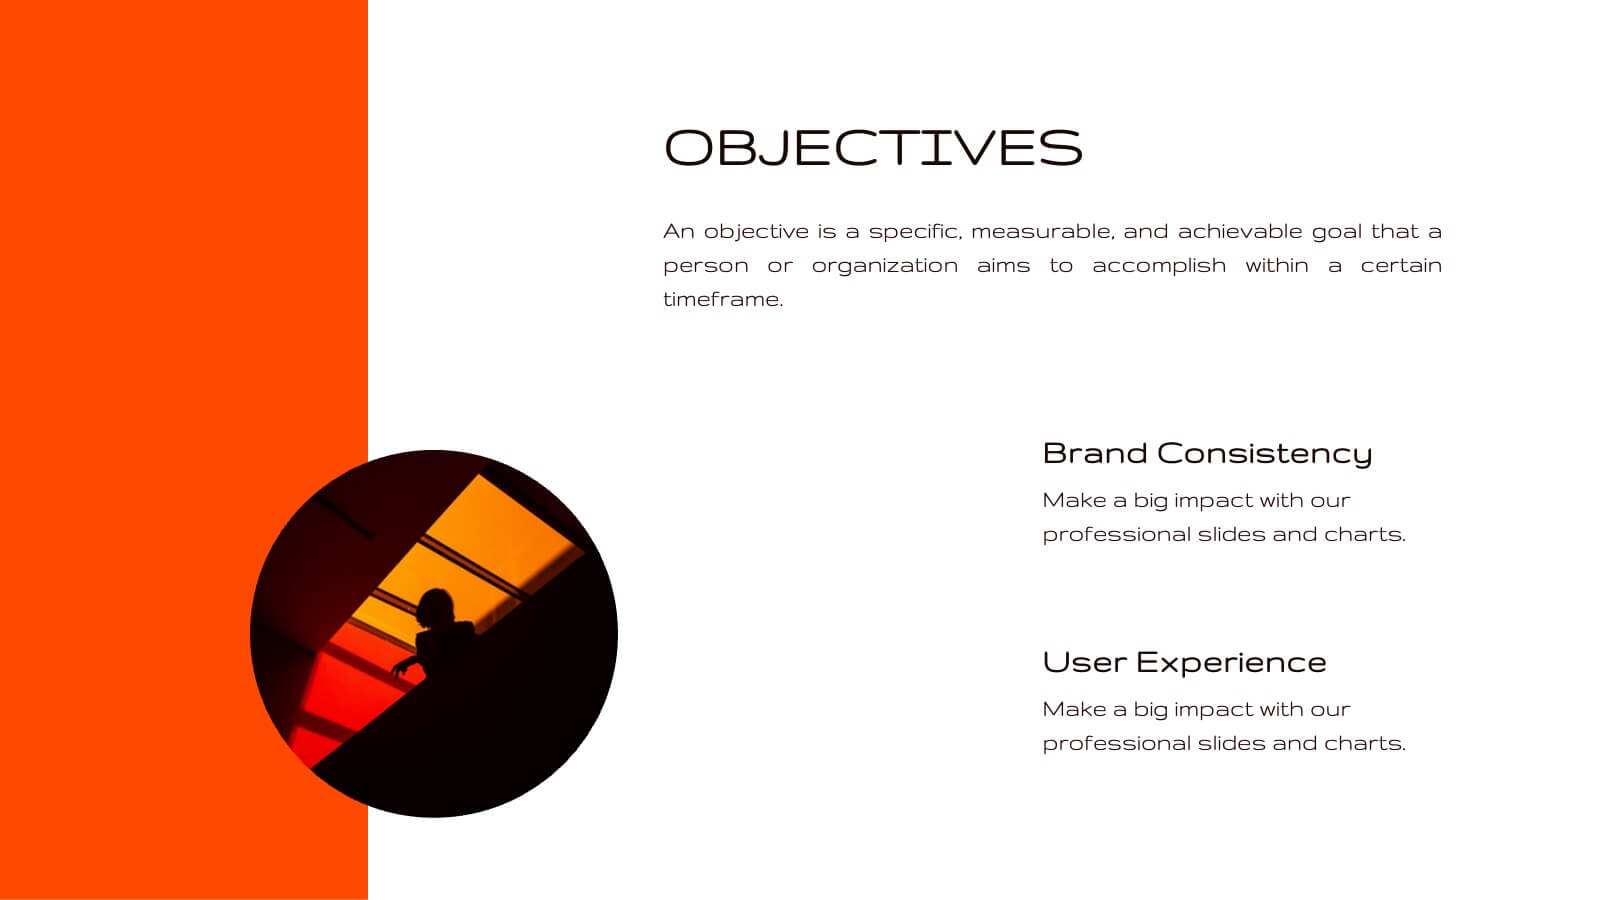
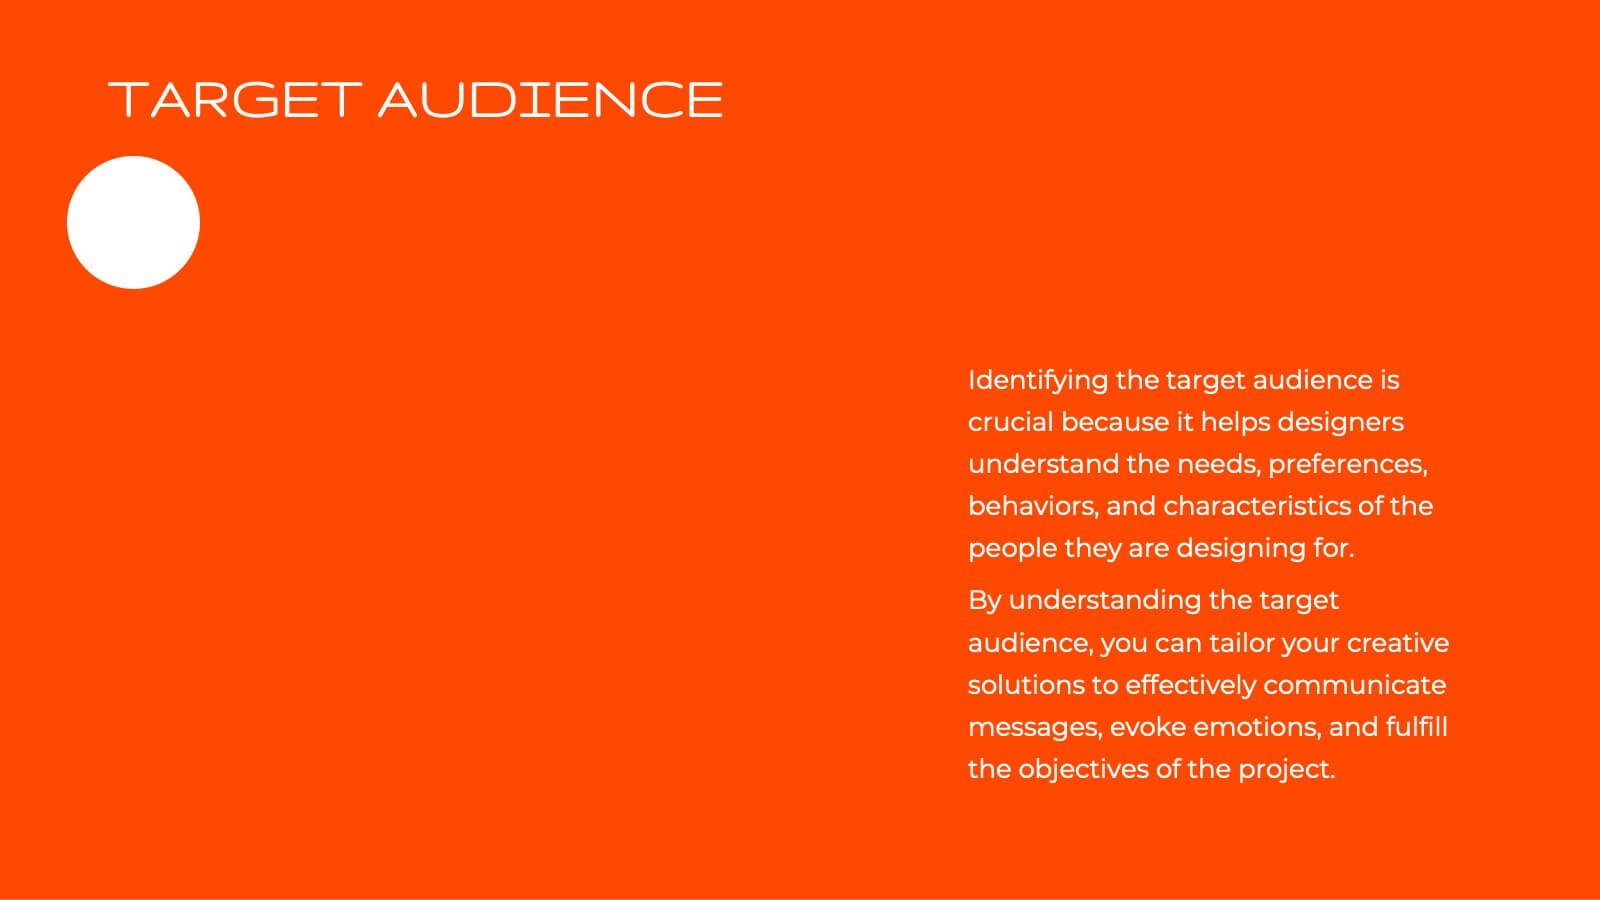
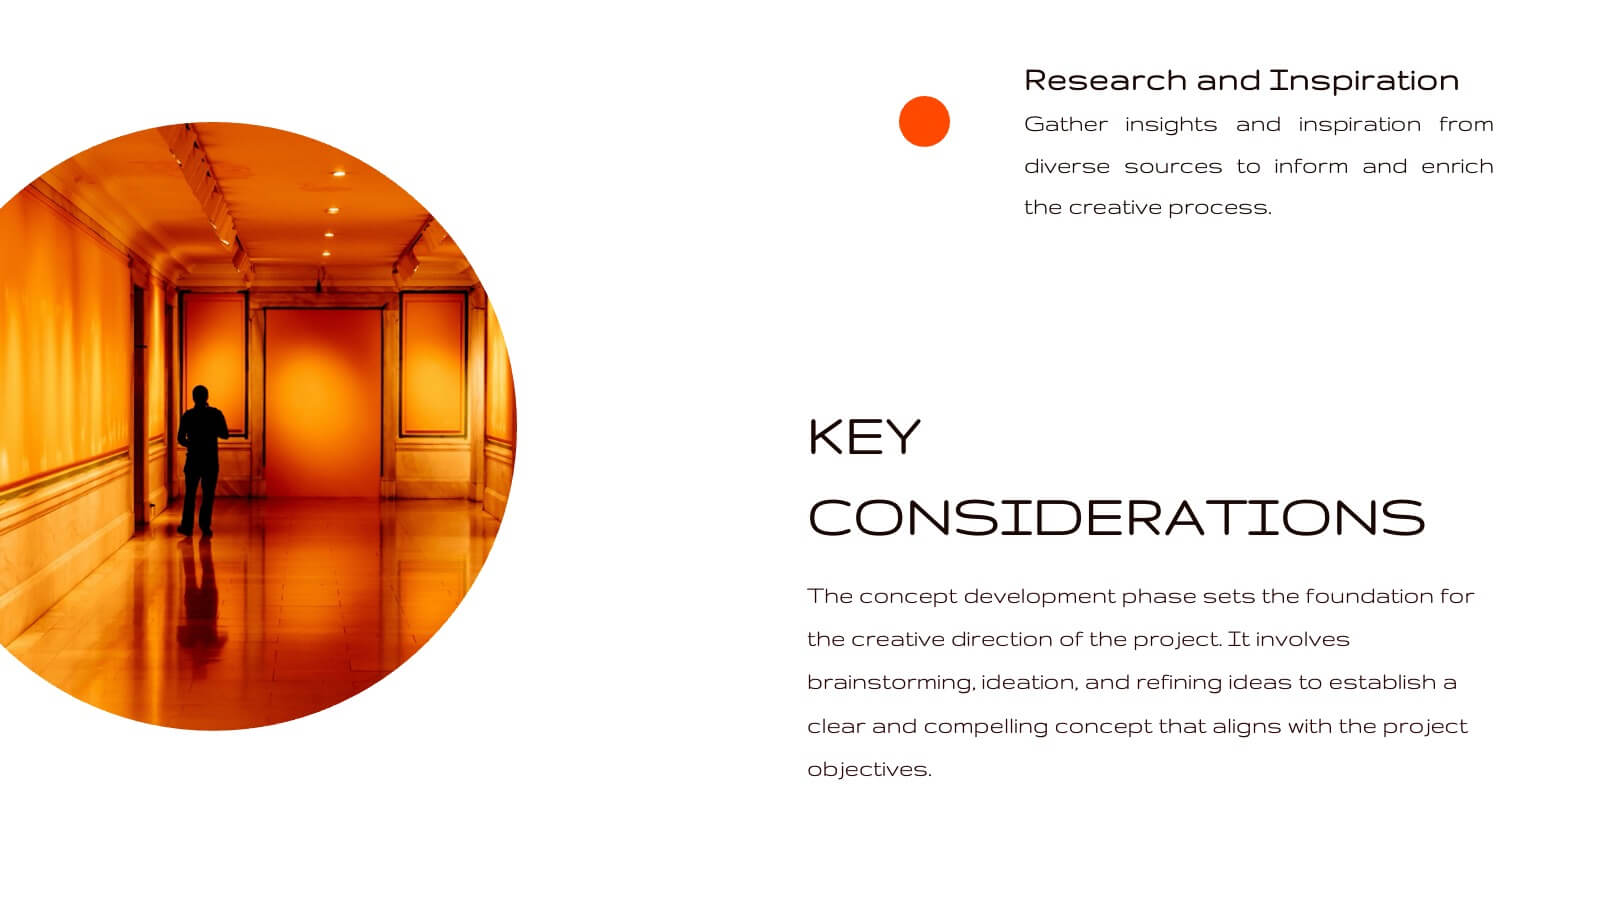
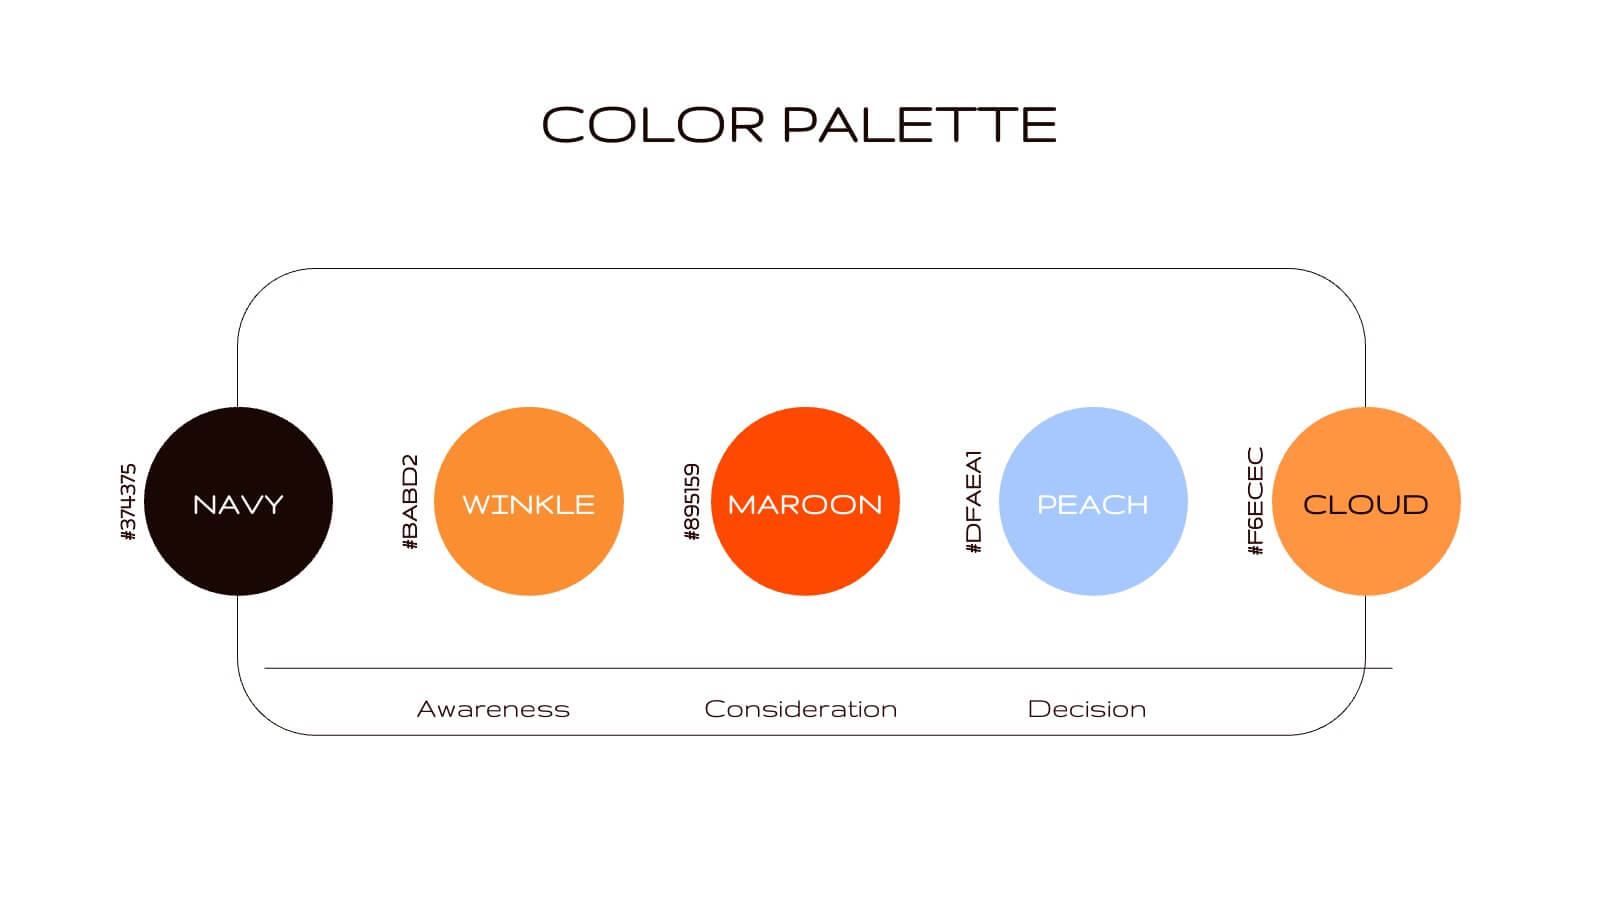
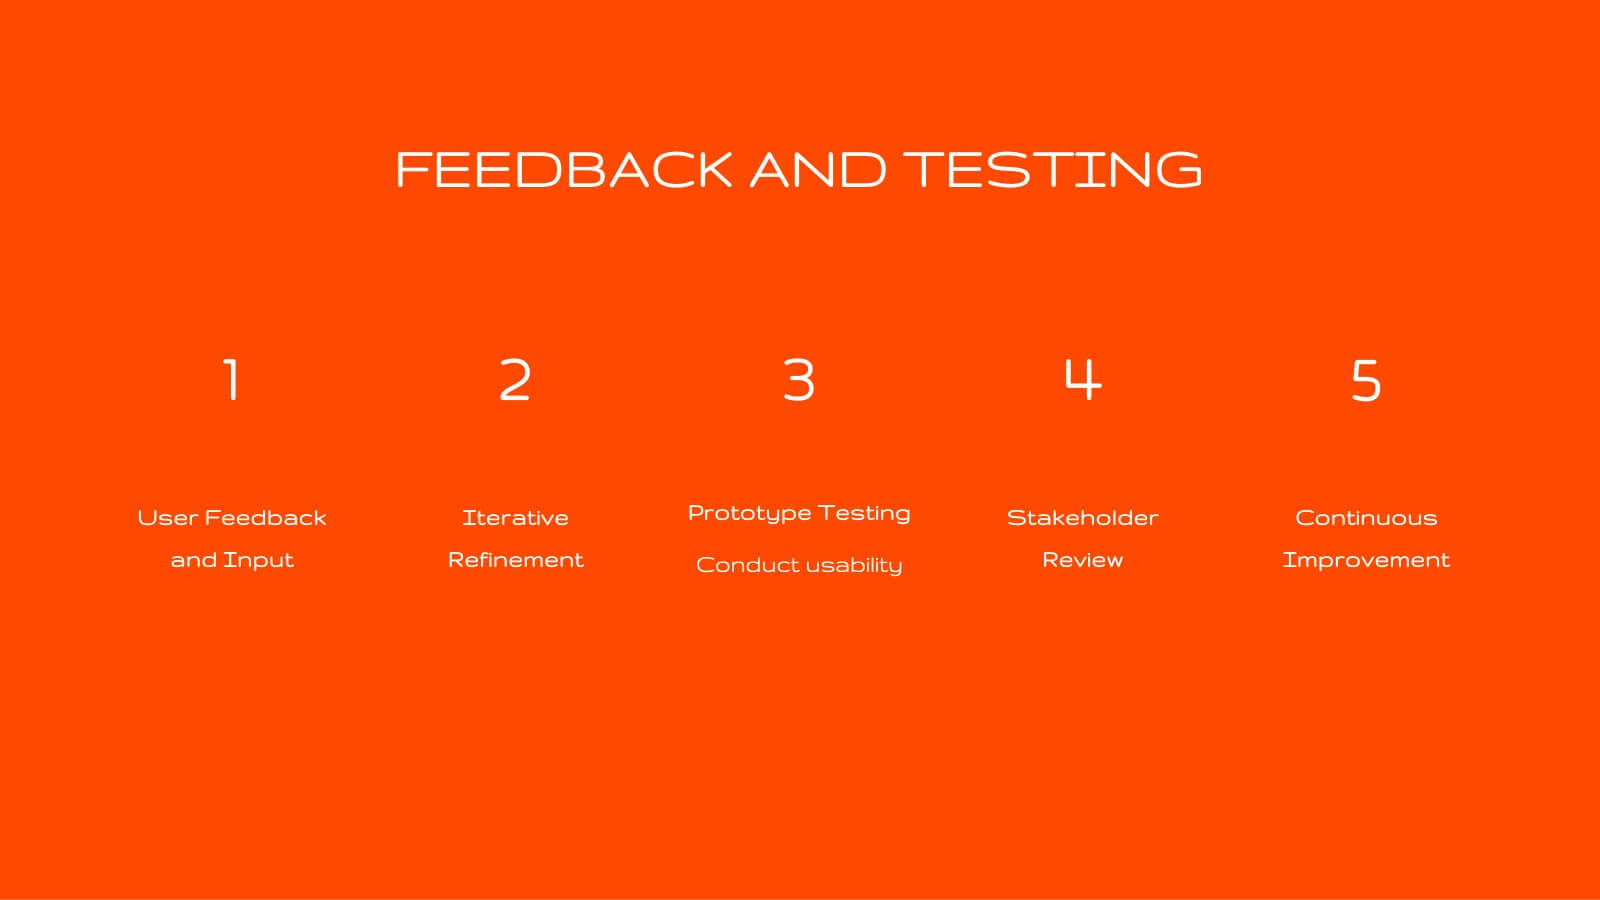
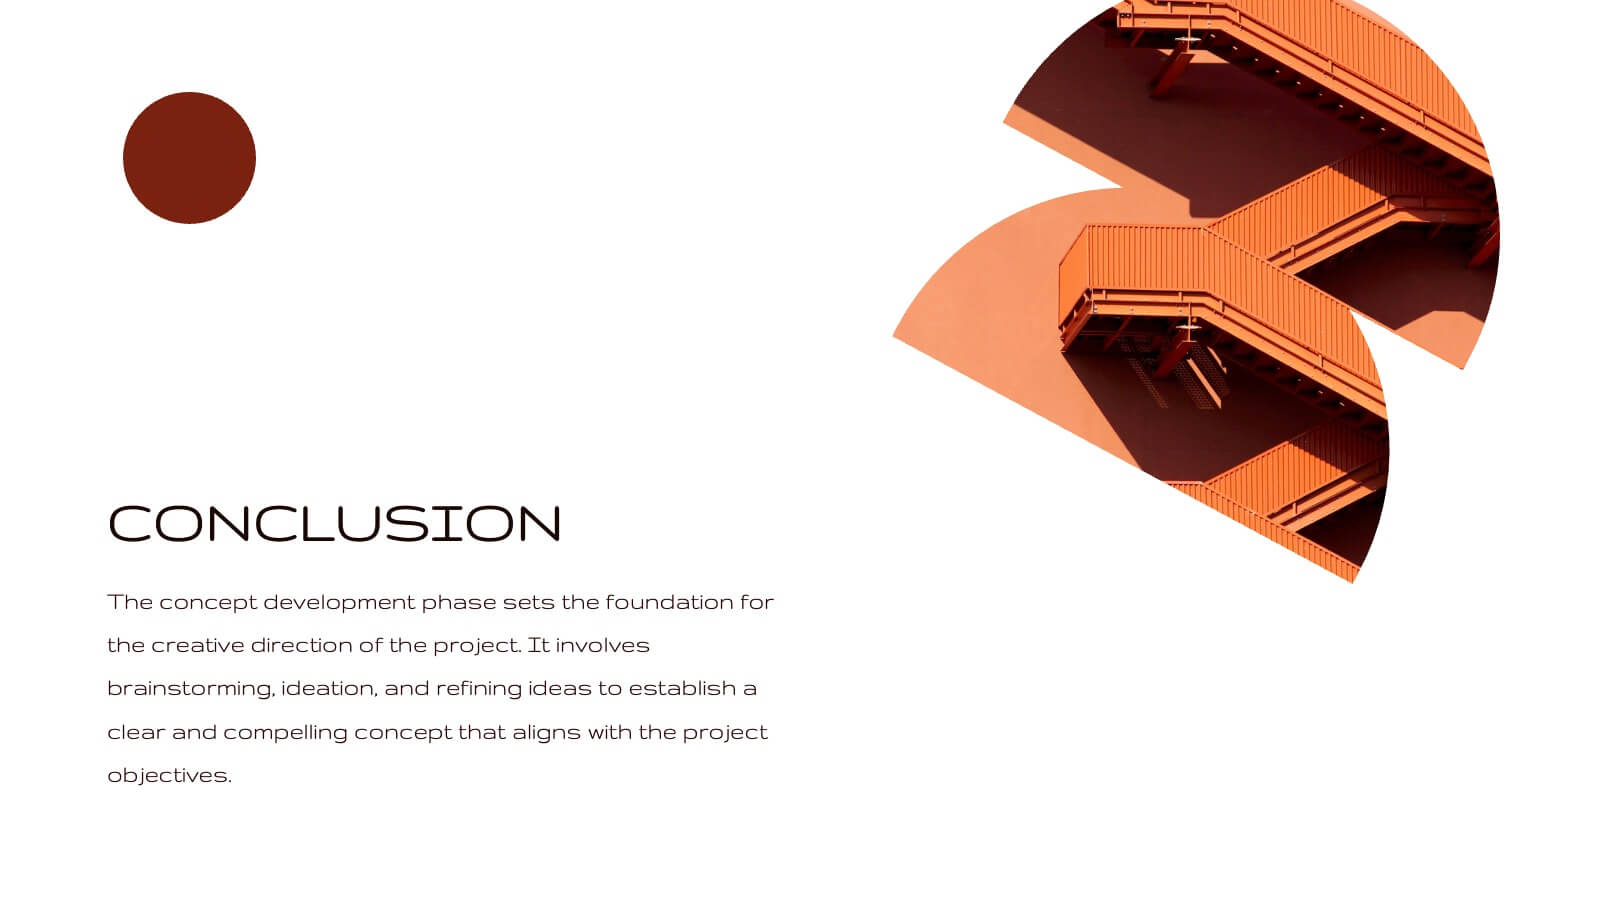
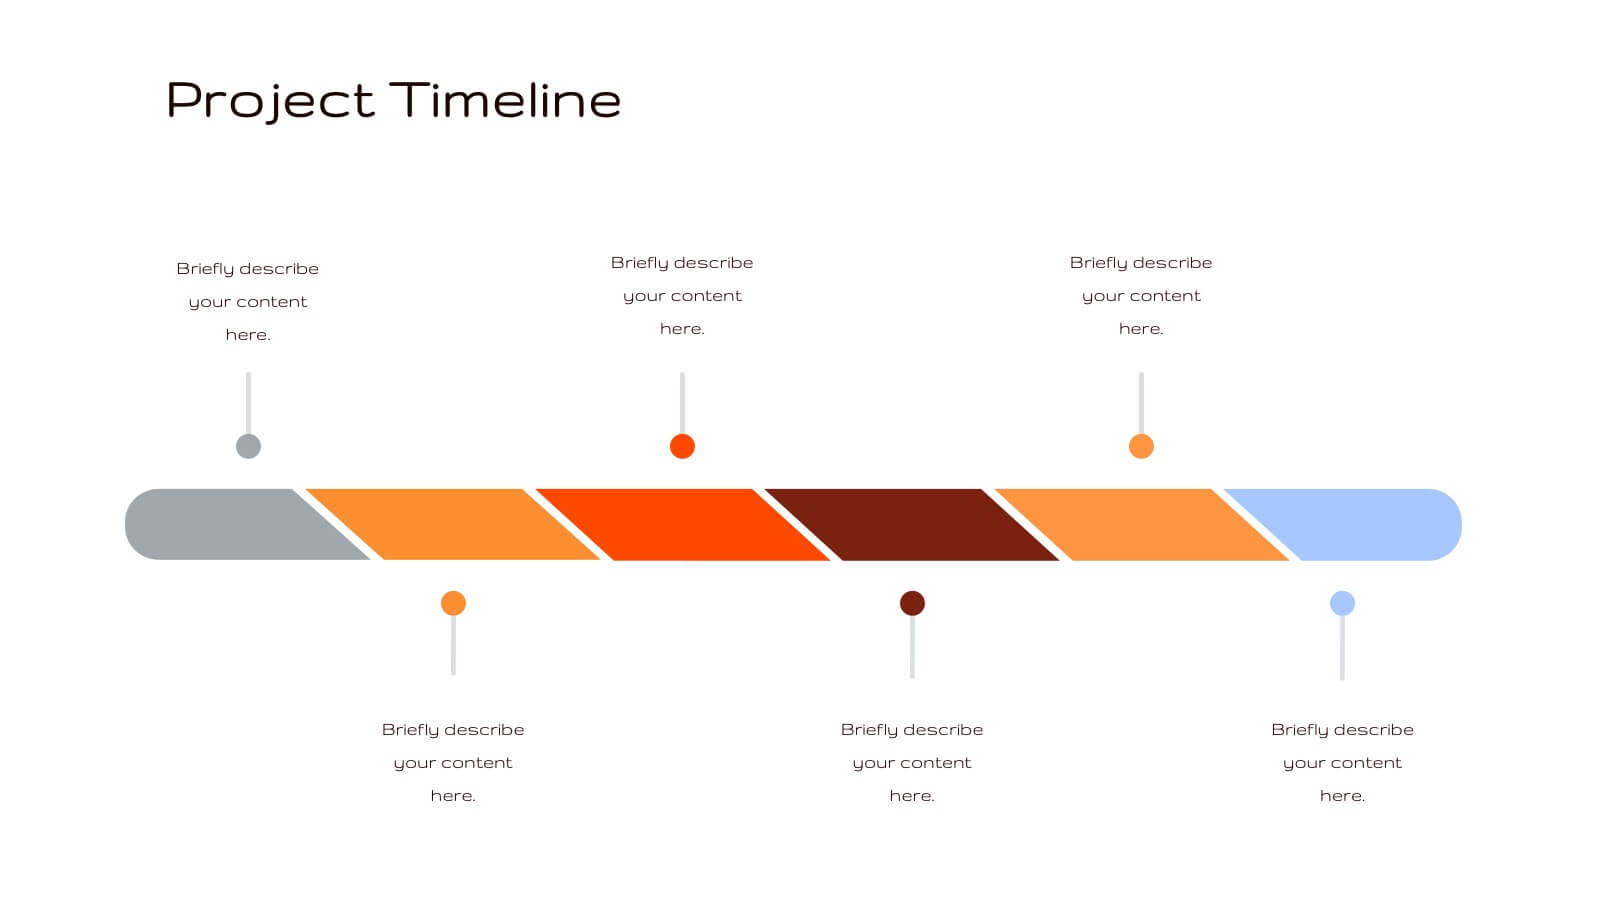
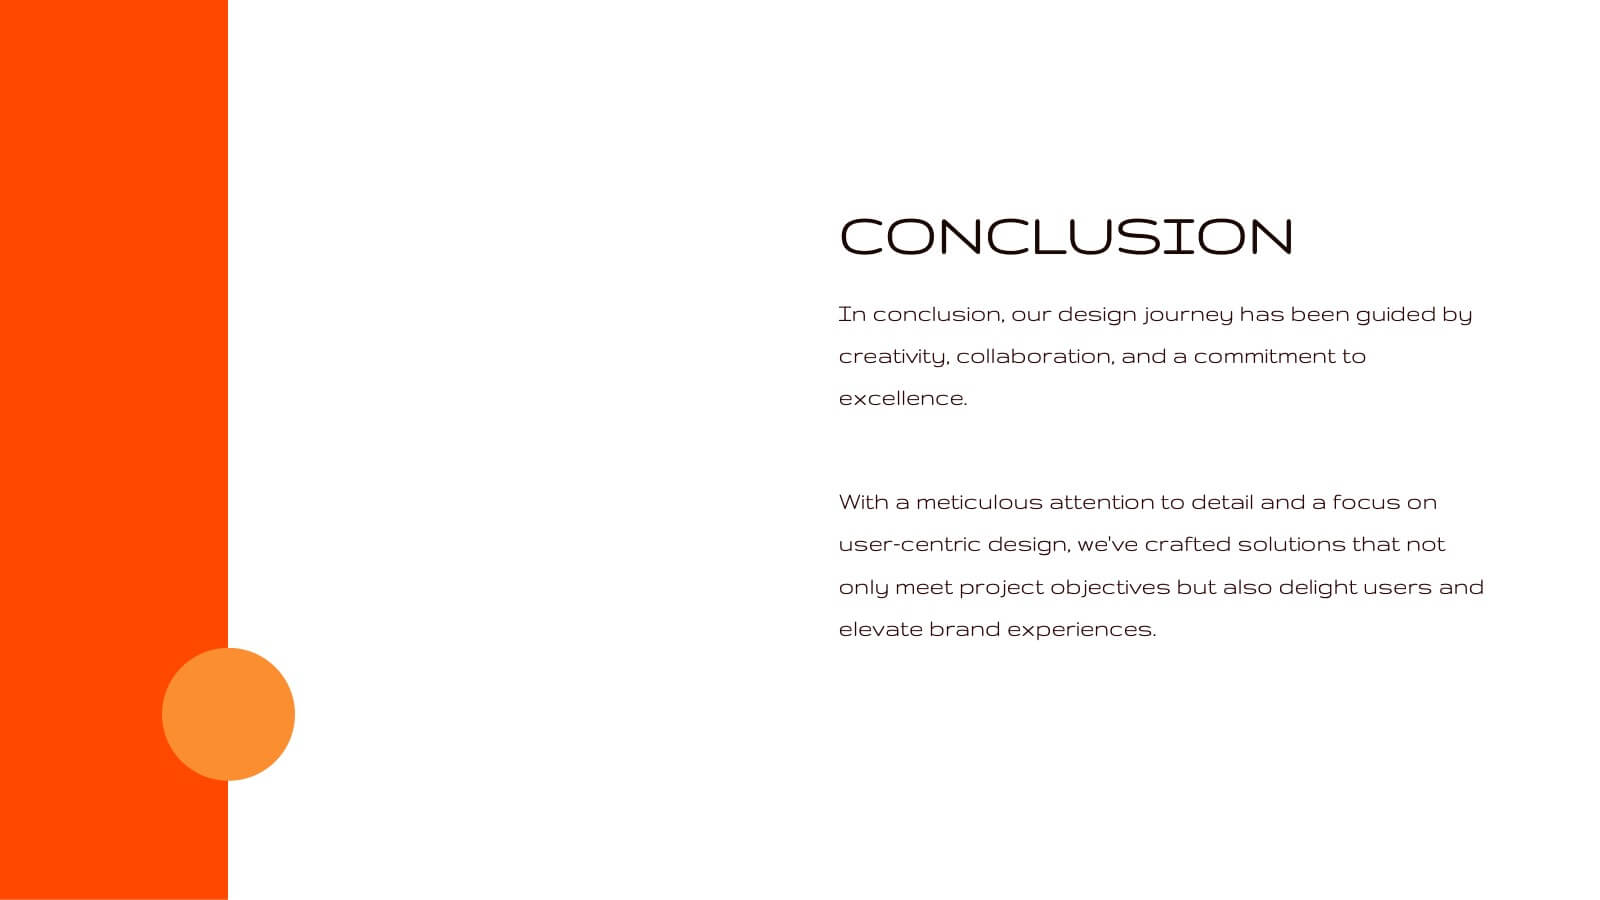
Radiance Creative Design Report Presentation
Bring your design ideas to life with this vibrant, engaging presentation template. Ideal for showcasing creative processes, concept development, and project timelines, it features a striking color palette and clean layout. This template is designed to captivate your audience and clearly communicate your design vision. Compatible with PowerPoint, Keynote, and Google Slides, it’s perfect for any platform.


5 slides
Investor-Ready Business Pitch Plan Presentation
Make your business roadmap stand out with this dynamic visual journey, perfect for impressing investors from the first slide. This infographic-style pitch deck helps clearly outline your business strategy across five milestones, using vibrant colors and icons for easy comprehension. Fully compatible with PowerPoint, Keynote, and Google Slides.


5 slides
Fitness Trainings Infographics
Fitness Training refers to structured physical activities or exercises designed to improve and maintain physical fitness, overall health, and athletic performance. Using these infographic templates, you can effectively educate your audience about different fitness training techniques, inspire them to adopt a healthy and active lifestyle, and provide them with practical tips and guidance for their fitness journey. These are designed to showcase various fitness training concepts, techniques, and tips. Whether you're a fitness instructor, personal trainer, or fitness enthusiast, this template is a valuable resource to educate and motivate your audience about fitness training.


26 slides
Poseidon Sales Pitch Deck Template Presentation
Unleash your persuasive power with the Poseidon Sales Pitch Deck template! This sleek and modern deck is designed to elevate your pitch, making your business the undeniable choice for potential clients or investors. With a compelling company overview and a clear problem statement, this template sets the stage for presenting your solution as the ultimate answer to your market’s challenges. The deck includes essential slides like competitive landscape analysis, revenue models, and marketing strategies to give your pitch a comprehensive edge. The visually appealing design combined with well-organized sections ensures your message is clear, concise, and impactful. Customize it to fit your brand identity and make your unique selling proposition stand out. Perfect for startups, established businesses, or anyone looking to make a powerful impression, this template is compatible with PowerPoint, Keynote, and Google Slides. Take your pitch to the next level and close those deals with confidence!