


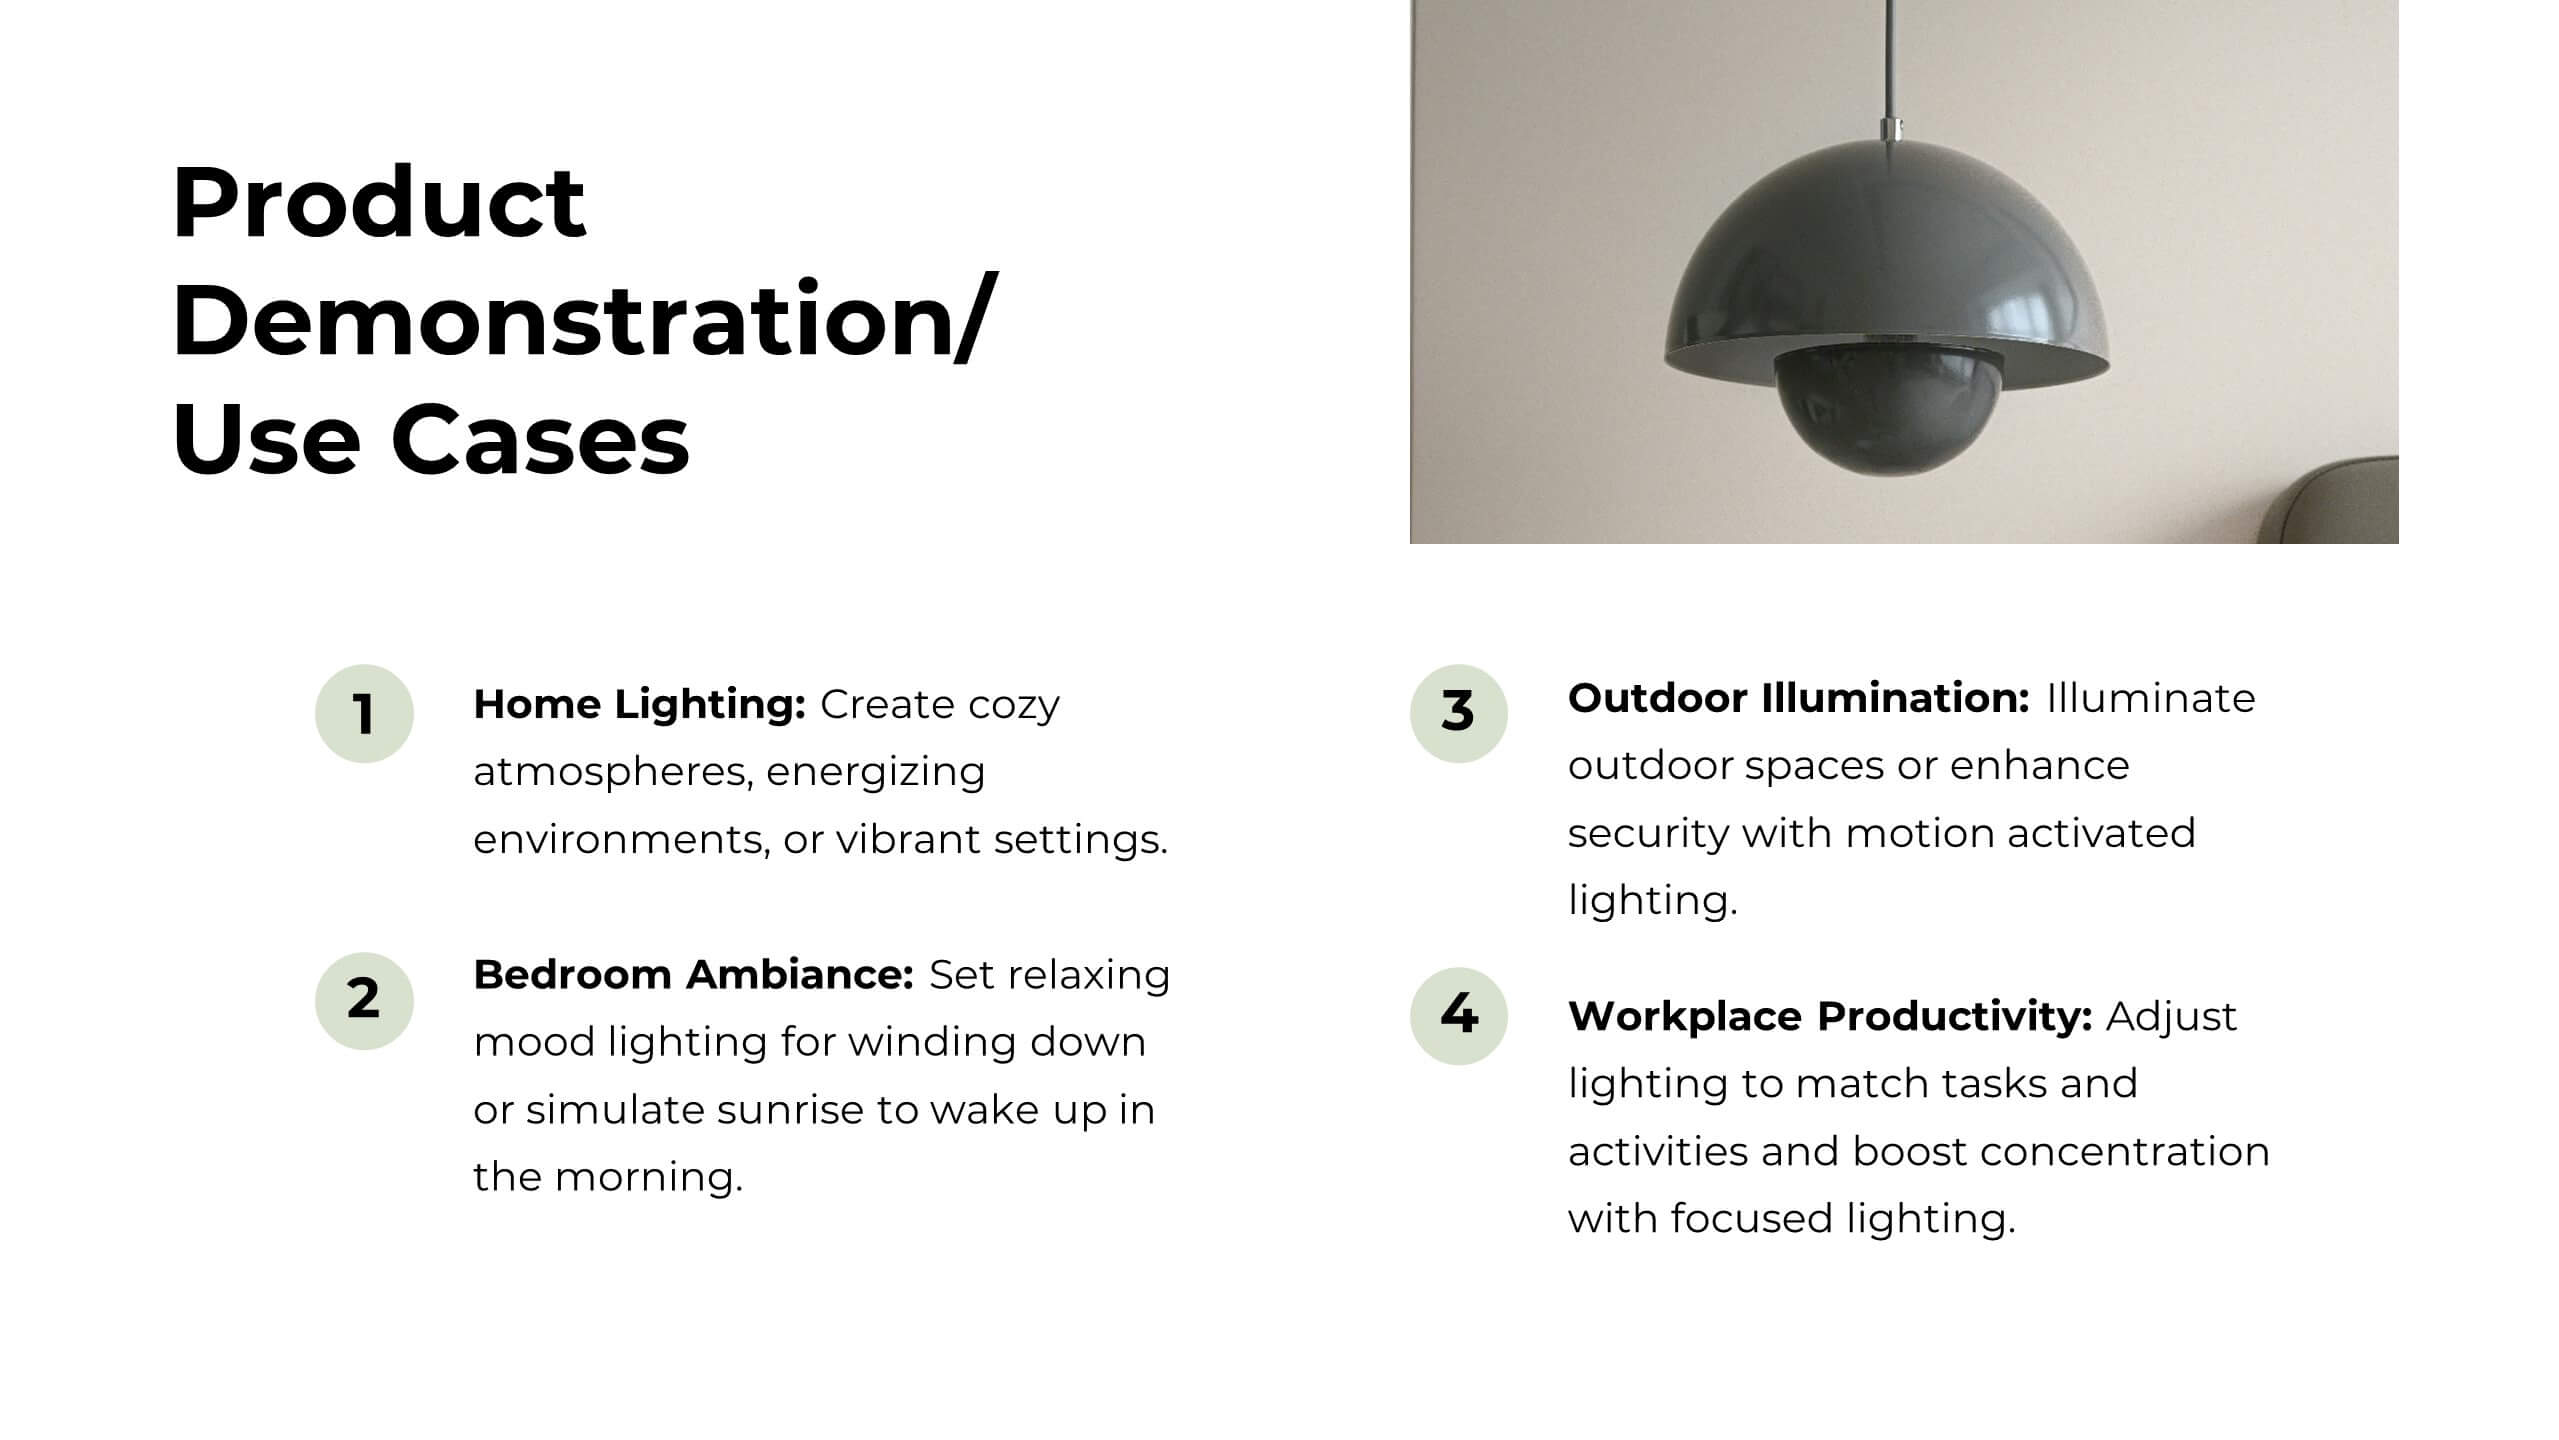
Features
- 21 Unique slides
- Fully editable and easy to edit in Microsoft Powerpoint, Keynote and Google Slides
- 16:9 widescreen layout
- Clean and professional designs
- Export to JPG, PDF or send by email


Do you have any questions?
Recommend


4 slides
Digital Education and Online Learning Tools Presentation
Bring your audience straight into the world of modern learning with a clear, engaging layout that highlights essential digital tools and online teaching methods. This presentation breaks down key platforms, features, and benefits in a simple visual flow that’s easy to follow. Fully compatible with PowerPoint, Keynote, and Google Slides.


6 slides
Strategic Business Planning Presentation
Bring your ideas to life with a slide design that makes strategic planning feel bold, focused, and easy to follow. This presentation walks through key business objectives, priorities, and action steps using clean visuals and intuitive layouts. Perfect for teams presenting strategy, goals, and long-term planning. Fully compatible with PowerPoint, Keynote, and Google Slides.


4 slides
New Hire Orientation Program Presentation
Set new hires up for success with a structured onboarding journey. This New Hire Orientation Program template visually represents key onboarding steps, ensuring clarity and consistency. Ideal for HR professionals and managers. Fully editable and compatible with PowerPoint, Keynote, and Google Slides for seamless customization.


4 slides
Harvey Ball Chart Business Analysis
Simplify your data-driven storytelling with this Harvey Ball chart slide—perfect for consultants, analysts, and strategy teams. Visualize percentage-based insights across four categories using clean, easy-to-read circular progress visuals. Fully editable in PowerPoint, Keynote, and Google Slides to match your branding and message.


8 slides
Data-Driven Feedback Analysis
Break down insights with precision using this Data-Driven Feedback Analysis presentation. Designed to showcase key points in a logical flow, this layout uses labeled segments (A–D) to categorize findings, highlight action items, and visualize patterns. Ideal for reports, audits, and feedback reviews. Fully editable in PowerPoint, Keynote, and Google Slides.


5 slides
Business Advantages and Benefits Presentation
Showcase your company's strengths with this modern Business Advantages and Benefits Presentation. Featuring a sleek puzzle-style design, this slide is perfect for illustrating interconnected benefits, core features, or success factors. Ideal for business proposals, team briefings, and client meetings, the layout is fully customizable in PowerPoint, Keynote, or Google Slides to match your brand colors and message.


5 slides
Cybersecurity Protocols and Threat Response Presentation
Visualize your security framework with the Cybersecurity Protocols and Threat Response presentation slide. Featuring a central lock icon surrounded by four quadrant-based callouts and symbolic icons (e.g., fingerprint, shield, malware), it’s ideal for outlining access controls, incident response, and threat monitoring strategies. Fully editable in PowerPoint, Keynote, and Google Slides.


5 slides
Buyer Journey Infographic Presentation
Understanding how buyers move from awareness to action becomes effortless with this clean, visual presentation. It guides you through each stage, helping you explain behaviors, insights, and touchpoints with clarity. Easy to customize and fully compatible with PowerPoint, Keynote, and Google Slides.

20 slides
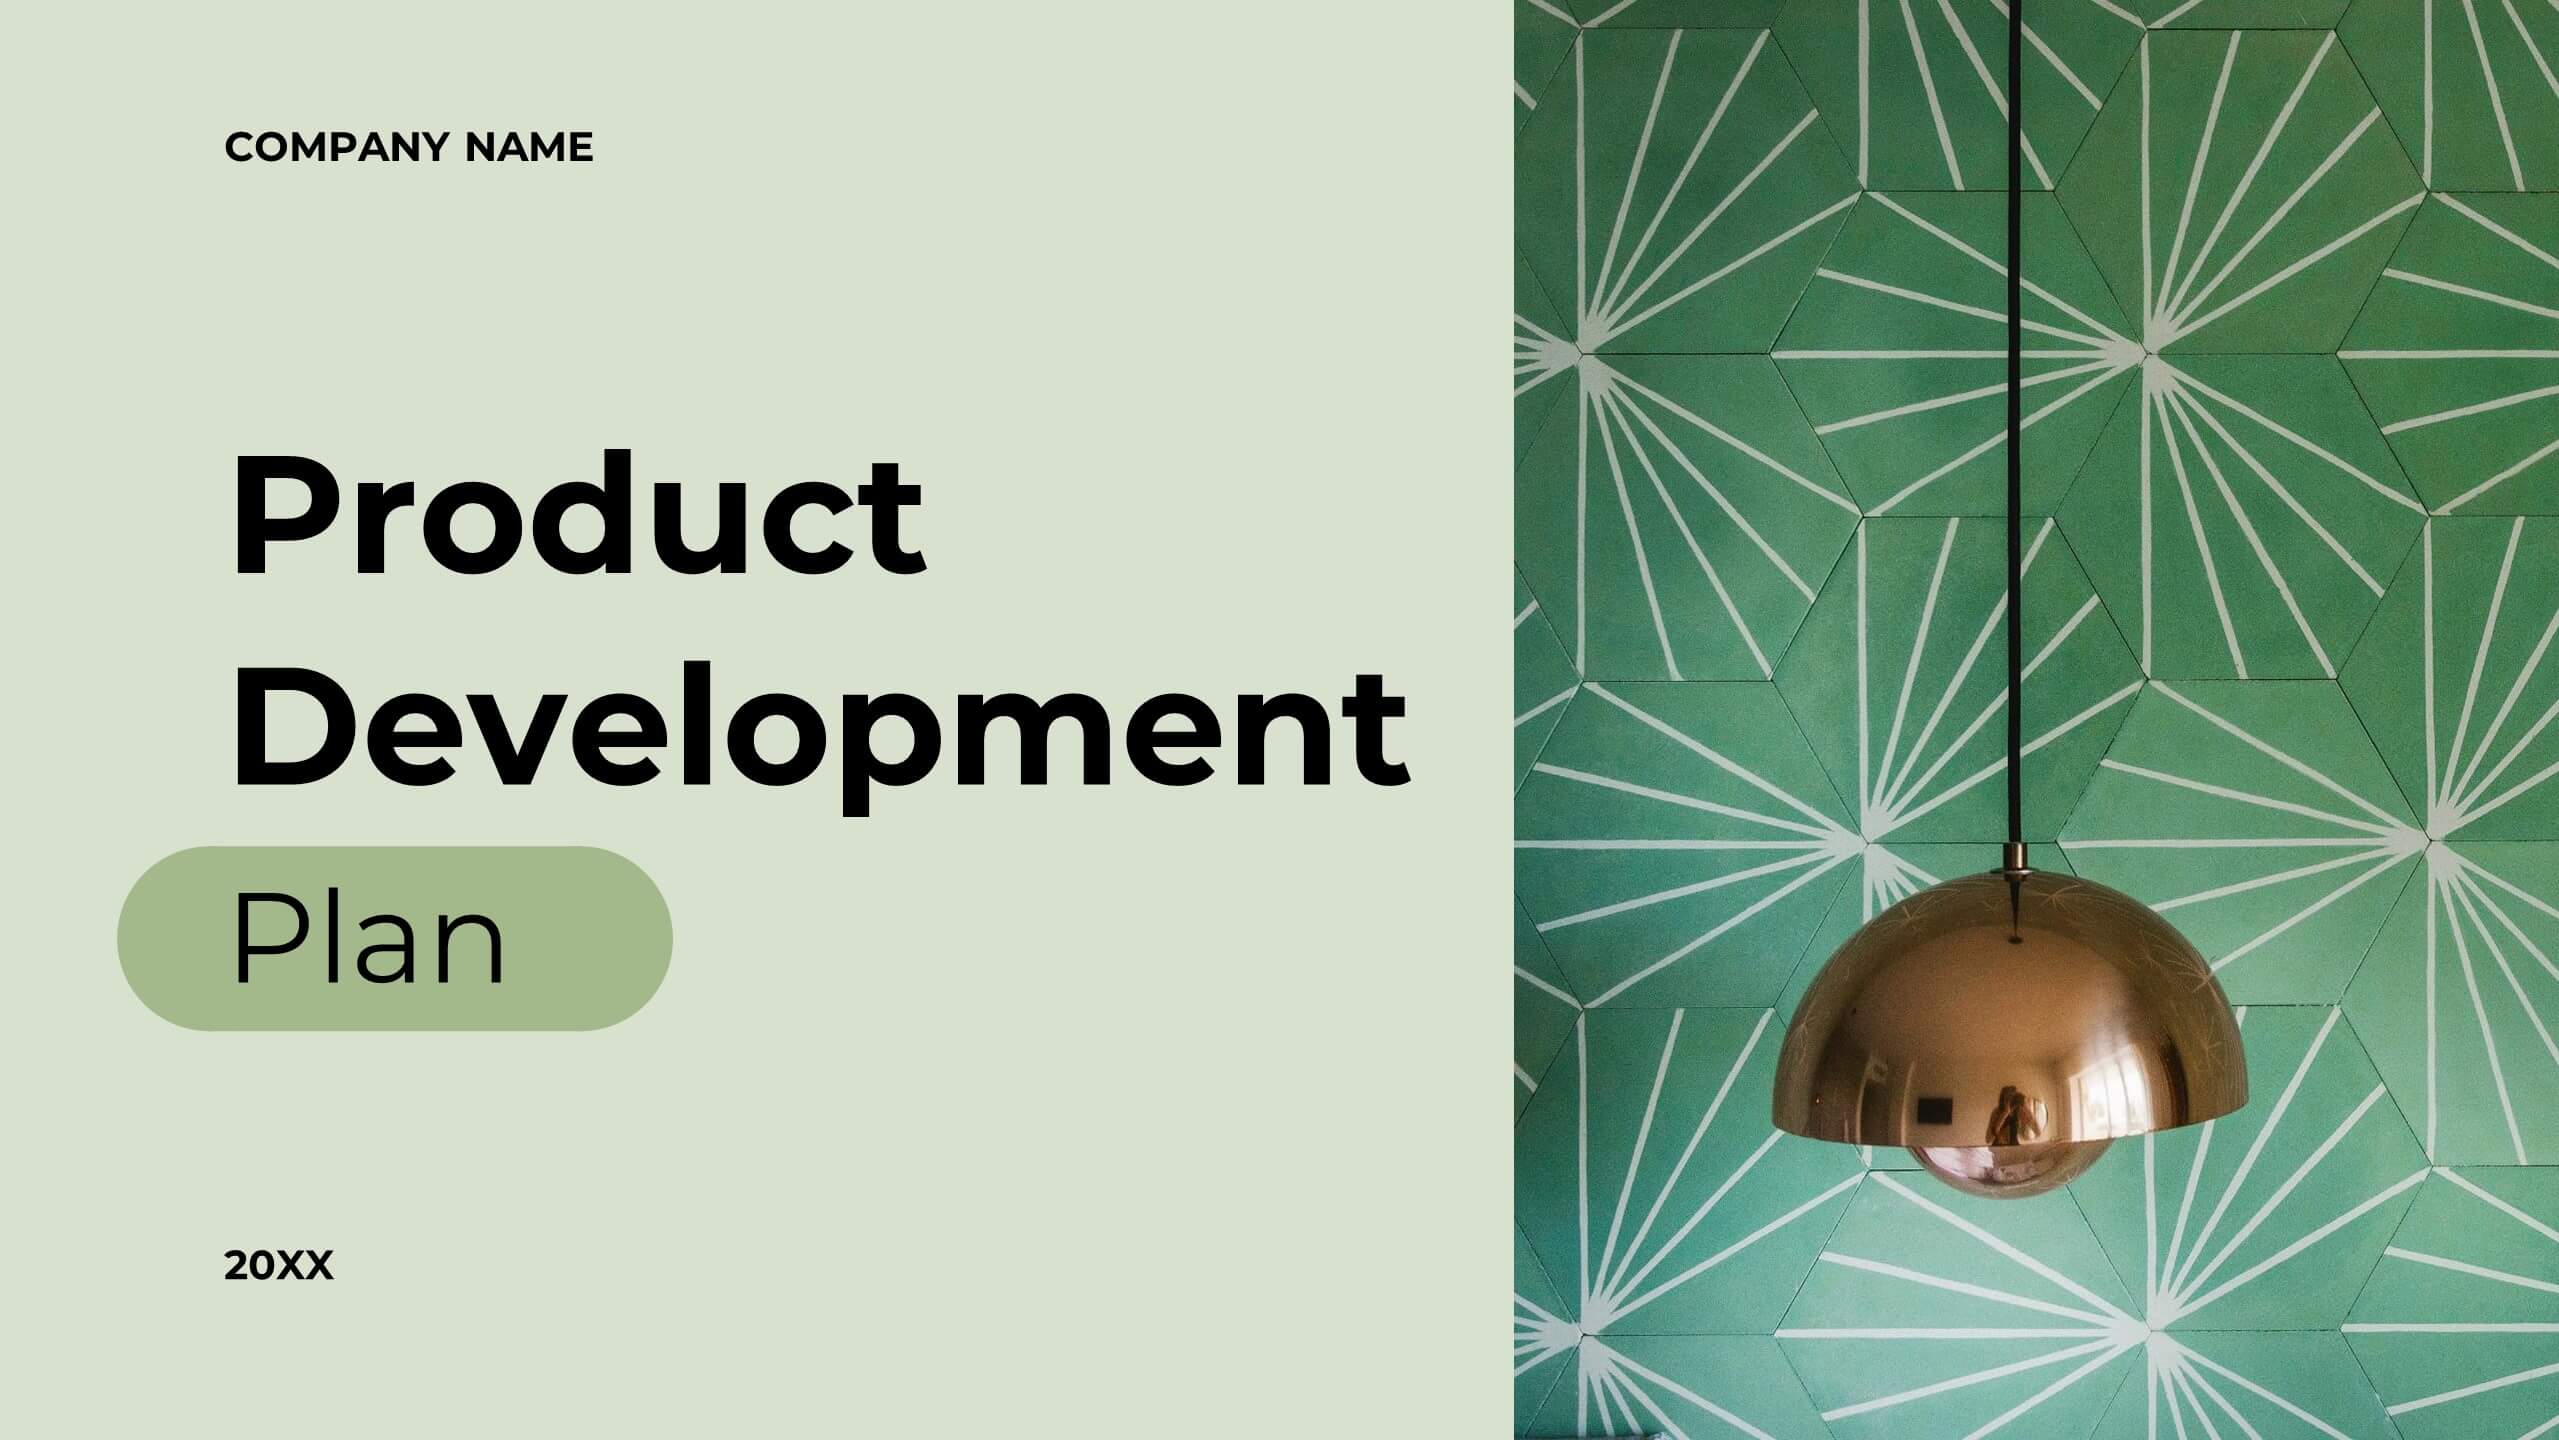
Glint Product Launch Presentation
Develop your product with confidence using this detailed product development plan template! Perfect for outlining features, market analysis, and competitive advantages. Ensure your team's efforts are aligned and maximize the impact of your product launch. Compatible with PowerPoint, Keynote, and Google Slides, it’s your ideal companion for successful product development.


3 slides
Business Report Summary Slides Presentation
Kick off your report with a slide that feels clean, modern, and effortlessly clear. This presentation helps you summarize key insights, highlight performance updates, and present essential findings in a structured, visual format. It’s ideal for monthly reviews, strategy reports, and stakeholder updates. Fully compatible with PowerPoint, Keynote, and Google Slides.


5 slides
Organizational Decision Support System Presentation
Visually showcase team alignment and consensus using the Organizational Decision Support System slide. This layout features a row of team icons paired with "Yes"/"No" speech bubbles, making it perfect for illustrating decision outcomes, vote breakdowns, or approval processes. Easily editable in PowerPoint, Keynote, and Google Slides.


20 slides
Chordstream Professional Portfolio Showcase Presentation
The Portfolio Presentation Template offers a modern and creative design, perfect for showcasing your projects, philosophy, and services. With 20 customizable slides, it includes sections for project highlights, pricing, client testimonials, and contact information. Compatible with PowerPoint, Keynote, and Google Slides, this template ensures professional impact for creatives.


2 slides
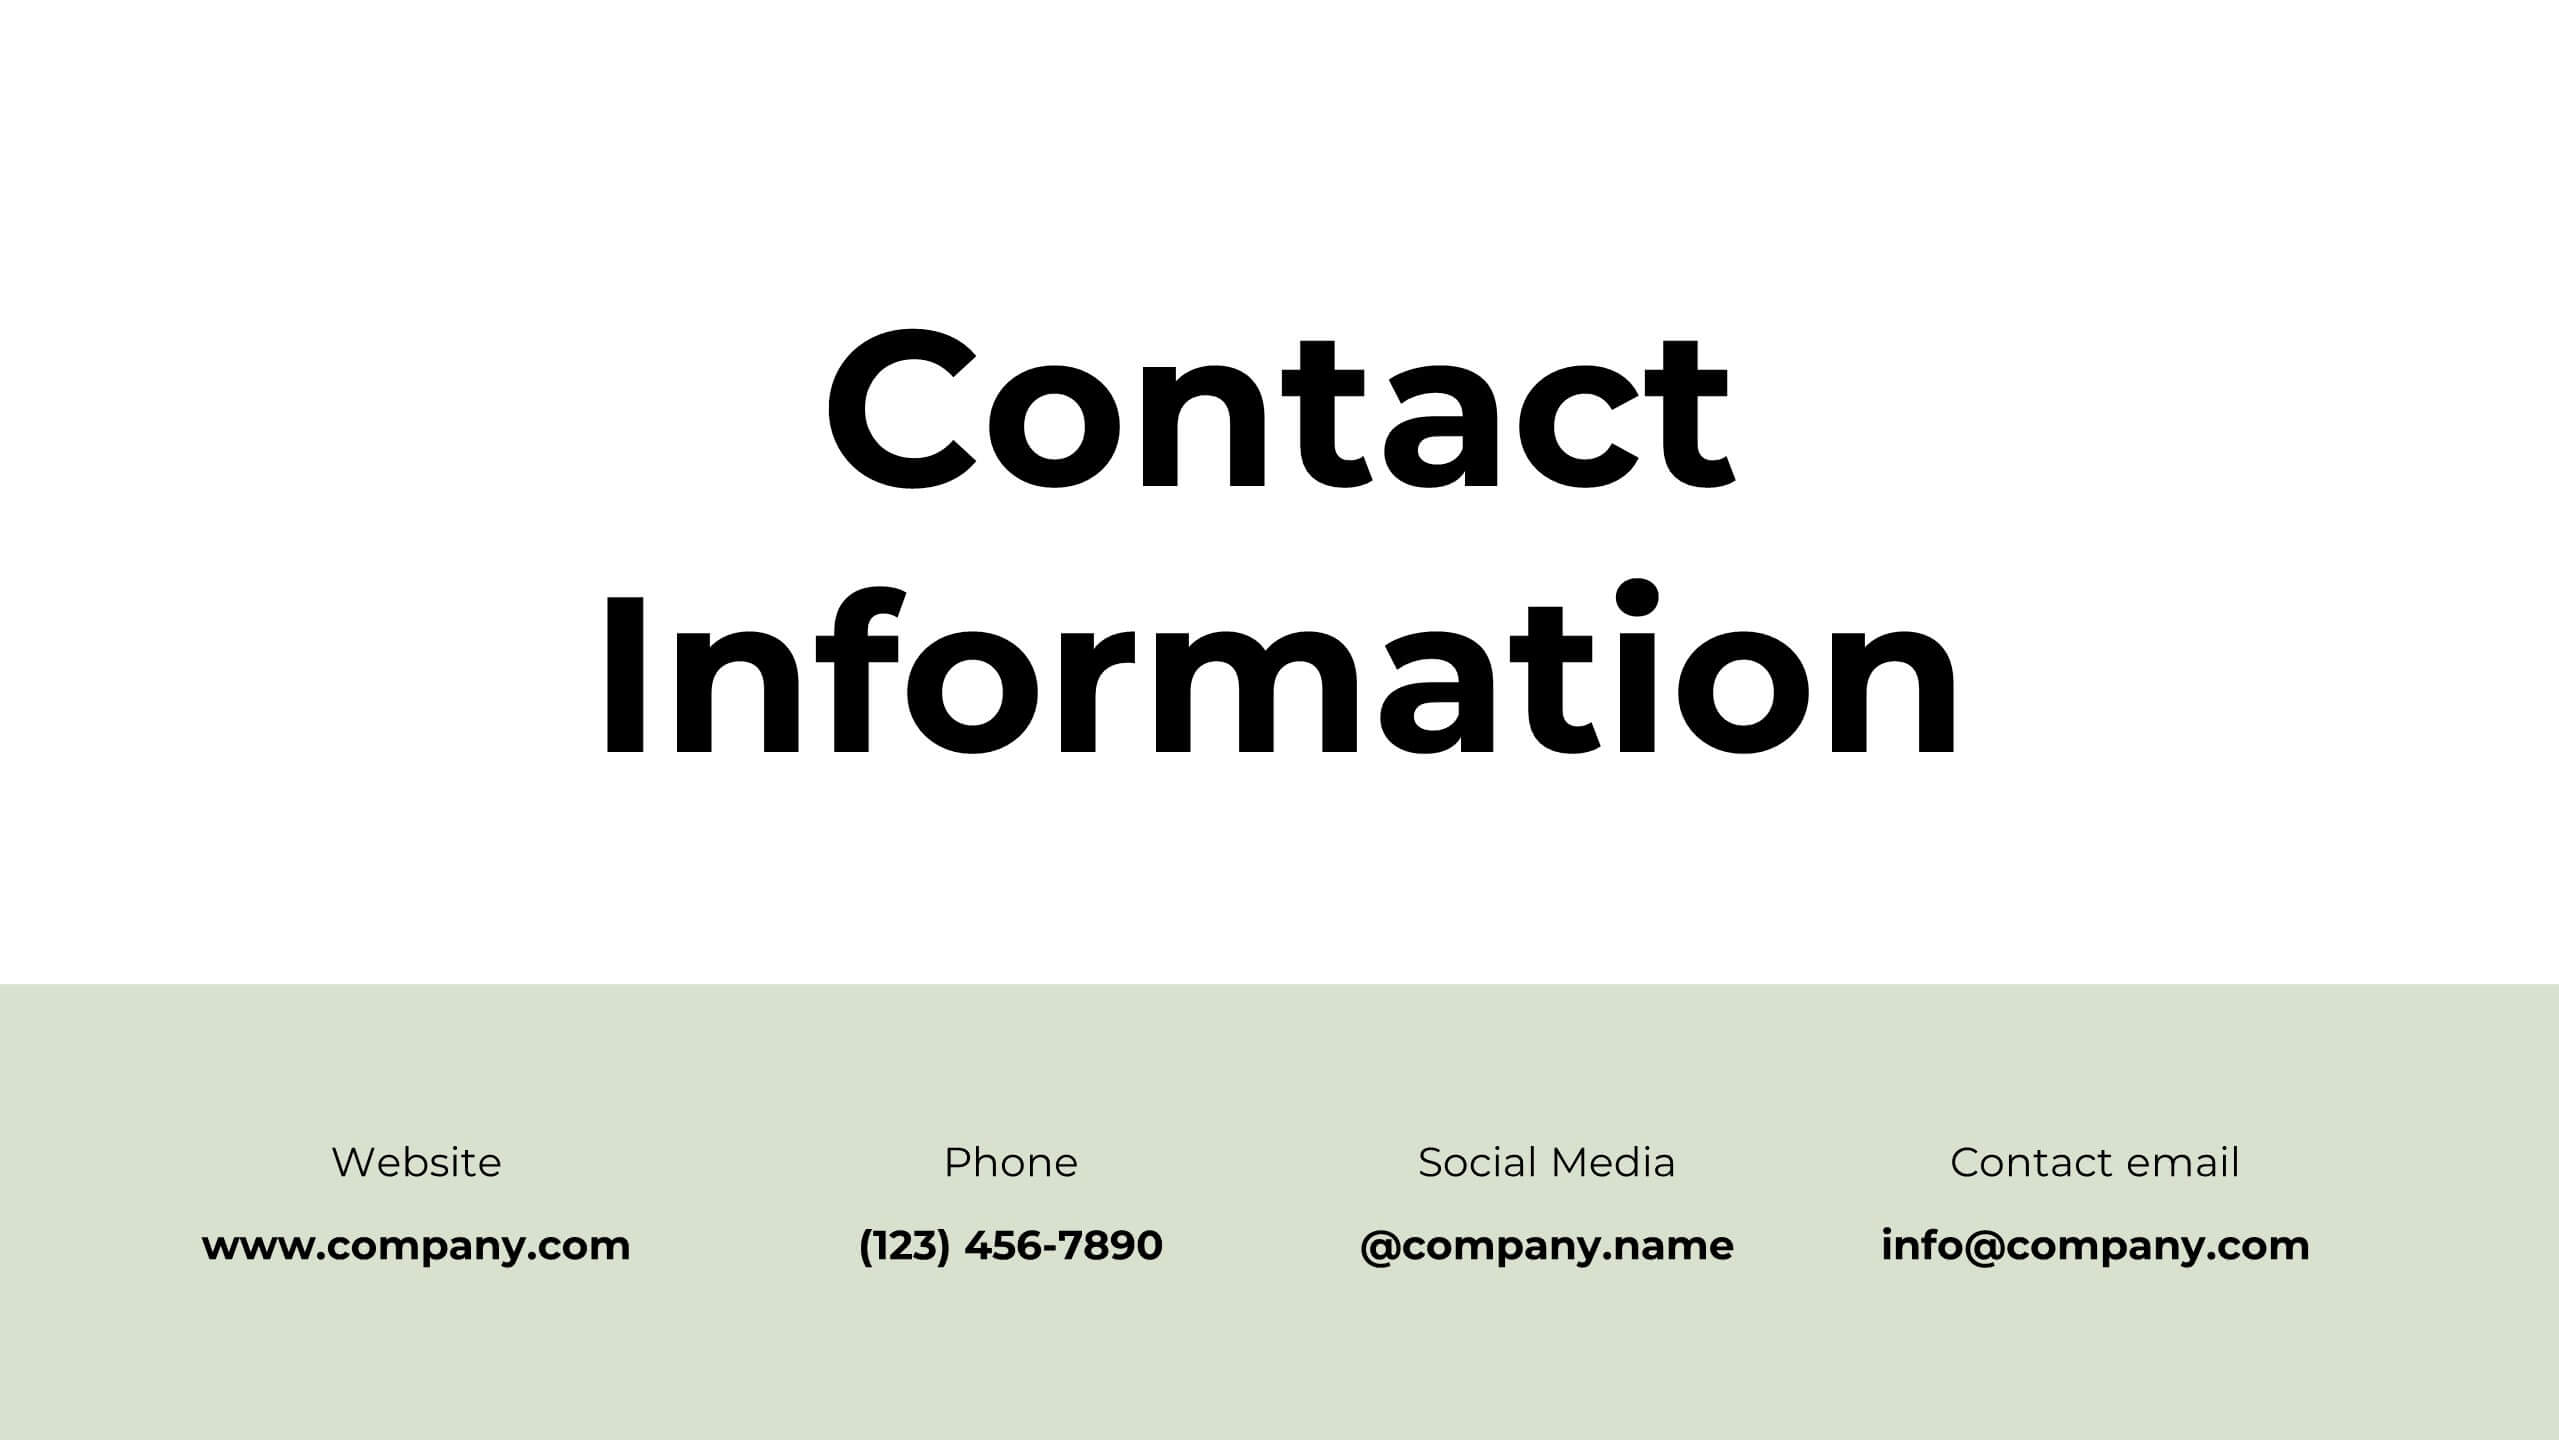
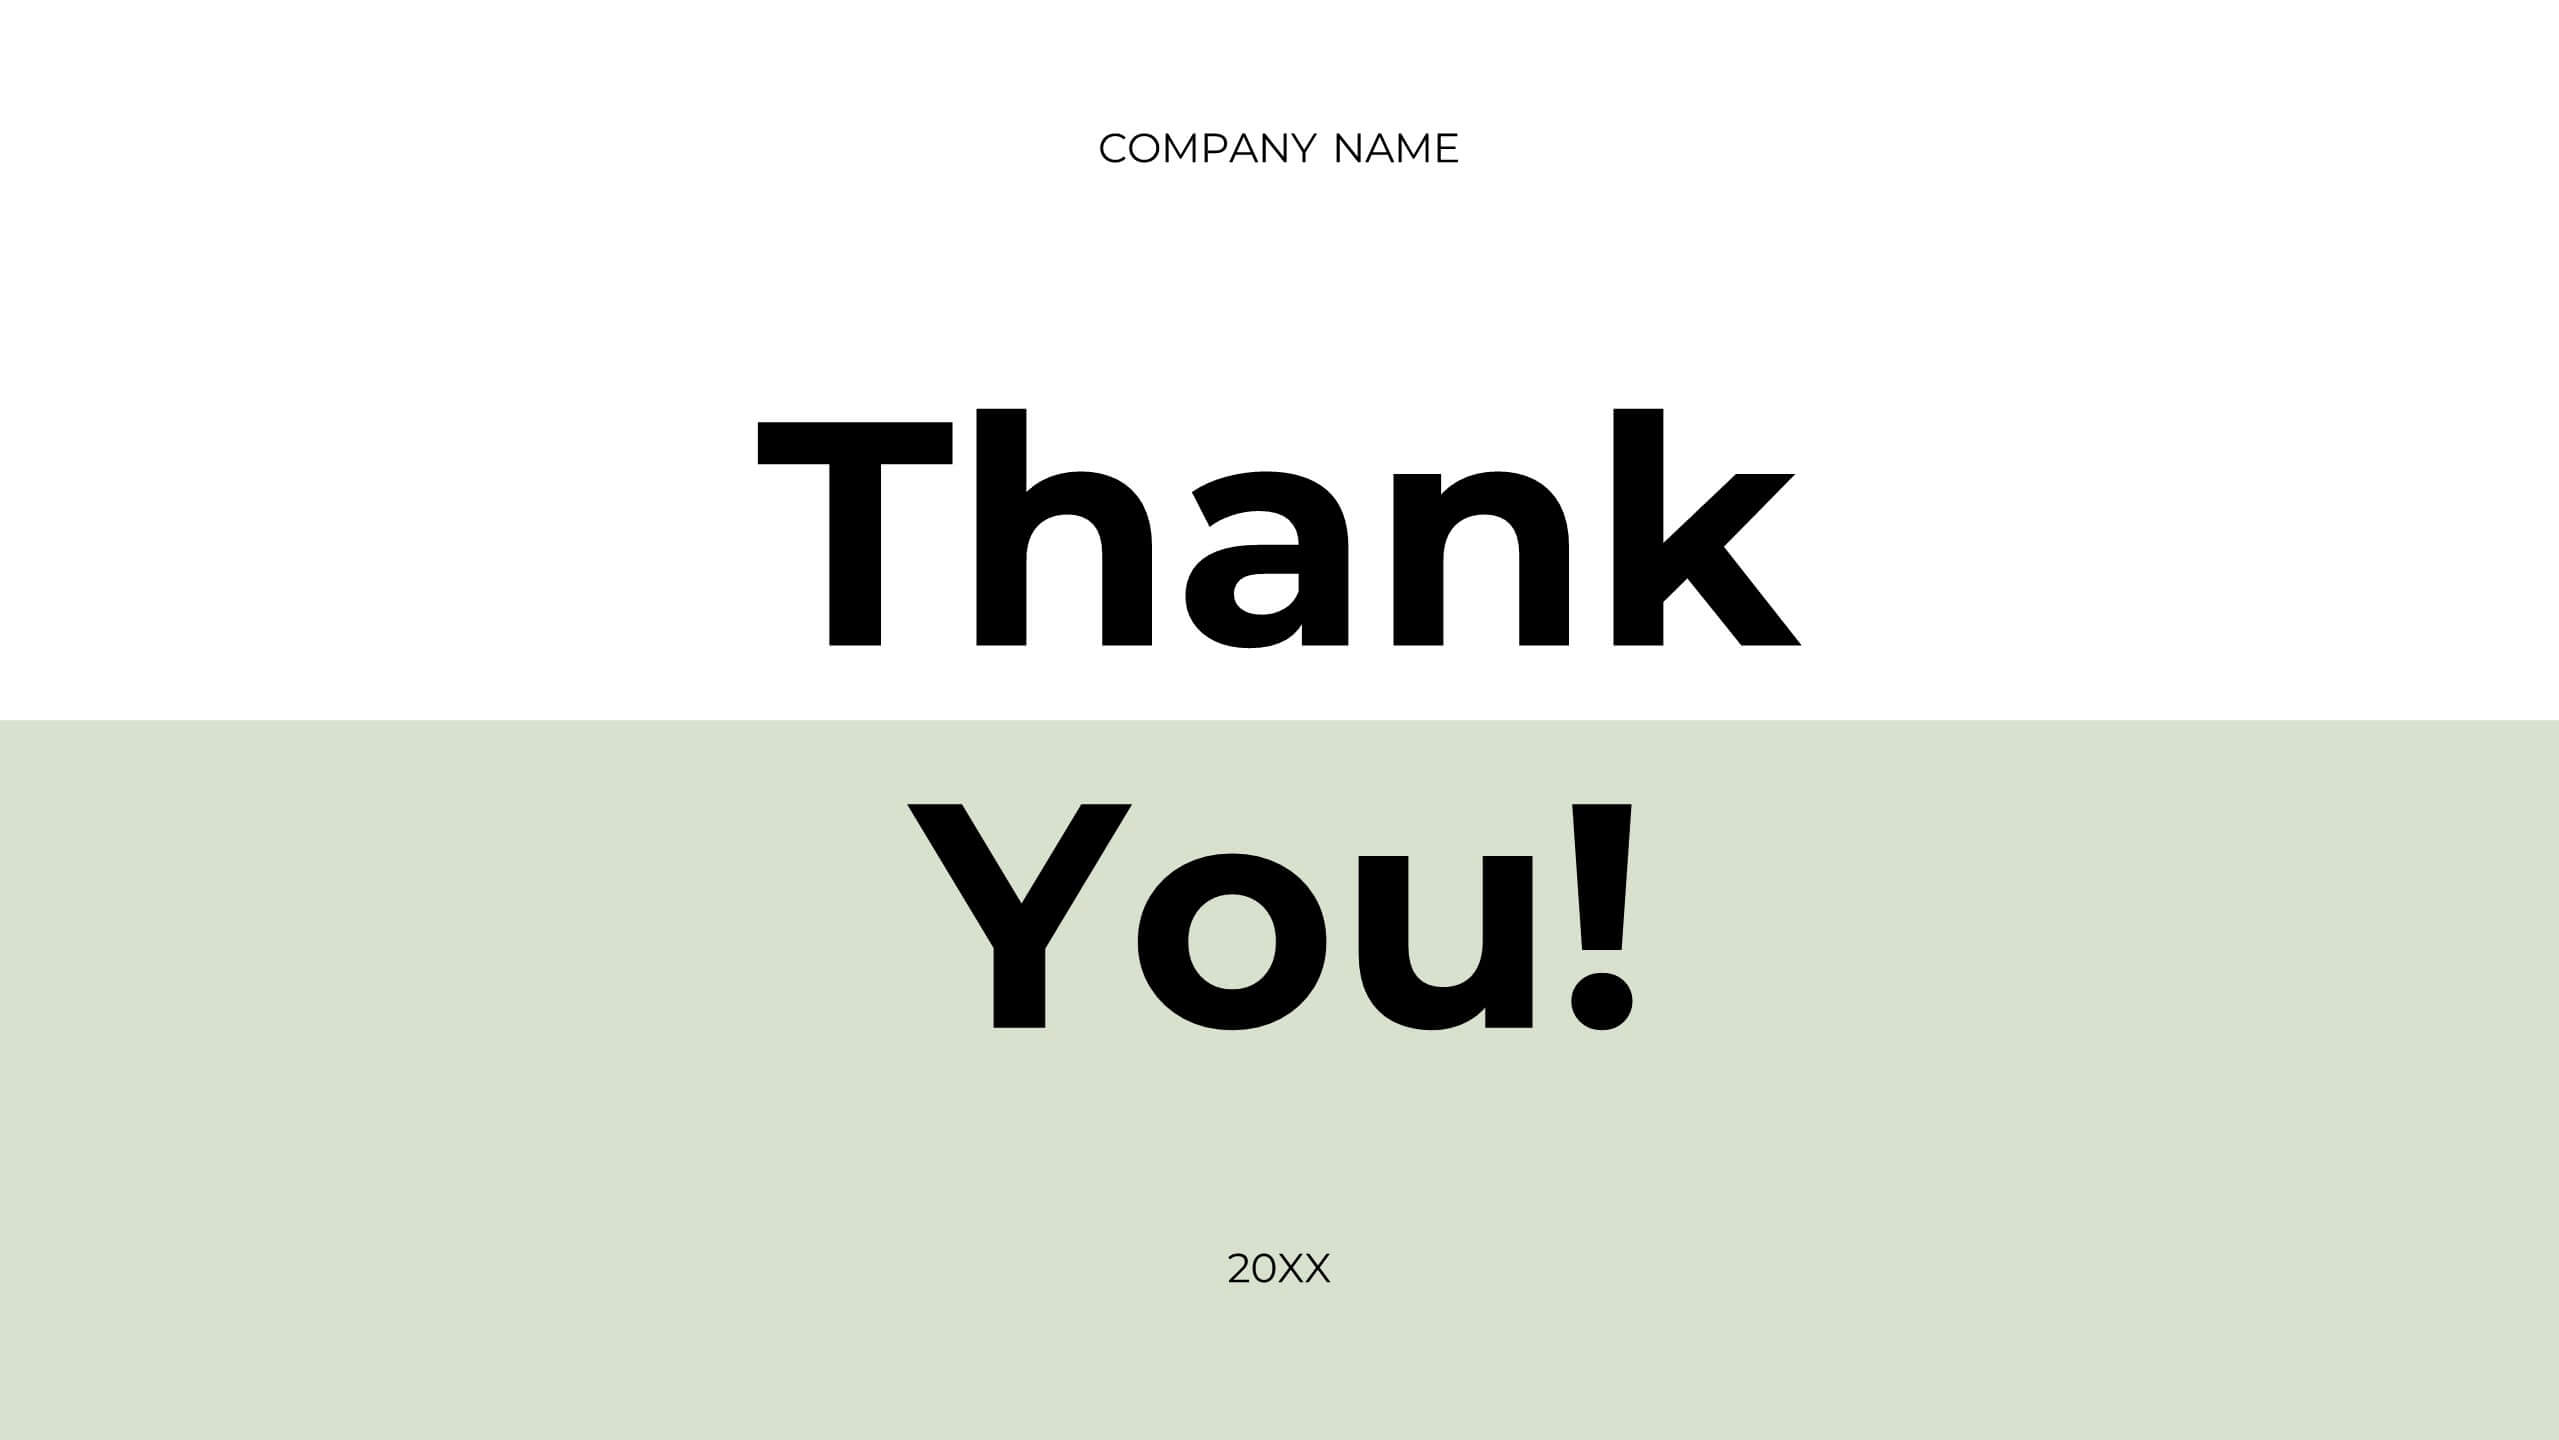
End Slide with Contact and Gratitude Message Presentation
Say goodbye with impact and leave a lasting impression! This clean, modern slide is perfect for ending presentations with a clear contact section and a heartfelt thank-you message. Ideal for client decks, proposals, or reports. Fully compatible with PowerPoint, Keynote, and Google Slides for easy editing and customization.


6 slides
Stock Market Investment and Analysis Presentation
Showcase your market insights with this dynamic zigzag arrow diagram—perfect for highlighting bullish vs. bearish trends, financial analysis, and investment milestones. The slide features a split-path layout with icons and editable text areas to clearly compare strategies or illustrate turning points. Fully customizable in PowerPoint, Keynote, and Google Slides.


20 slides
Galaxion Marketing Proposal Presentation
This Marketing Proposal Presentation template offers a comprehensive structure to showcase your strategies, goals, and financial plans effectively. Covering key sections such as objectives, budget breakdown, and timeline, it's perfect for making a strong impression. Fully customizable and compatible with PowerPoint, Keynote, and Google Slides for seamless adaptation to your needs.


2 slides
Creative Work Portfolio Collection Presentation
Present your projects with impact using the Creative Work Portfolio Collection Presentation. Designed for photographers, artists, and creators, this layout highlights visuals while leaving space for thoughtful captions or project notes. Easily editable and fully compatible with Canva, PowerPoint, Keynote, and Google Slides to match your brand and showcase your style.


6 slides
Business Growth Metrics Butterfly Chart
Highlight performance patterns and opportunities with the Business Growth Metrics Butterfly Chart Presentation. This engaging layout uses mirrored radial segments to present six growth indicators—ideal for tracking progress across two categories, departments, or timeframes. The butterfly-shaped curves draw the viewer’s attention to the center, making comparisons intuitive and visually balanced. Fully customizable in PowerPoint, Keynote, and Google Slides, this template is perfect for showcasing KPI trends, sales metrics, or marketing performance.