


Features
- 5 Unique slides
- Fully editable and easy to edit in Microsoft Powerpoint, Keynote and Google Slides
- 16:9 widescreen layout
- Clean and professional designs
- Export to JPG, PDF or send by email


Do you have any questions?
Recommend


10 slides
Hospital Services Overview Presentation
Bring your healthcare message to life with a clean, modern layout that makes complex hospital services easy to understand. This presentation helps you outline key departments, care processes, and essential service details with clarity and confidence. Designed for smooth communication in medical settings, it works seamlessly in PowerPoint, Keynote, and Google Slides.


6 slides
Business Decision Venn Diagram Presentation
Make complex decision-making simple and visually impactful with this Business Decision Venn Diagram Presentation. Featuring a bold triangular layout with six segmented areas, this slide is ideal for presenting overlapping factors, interconnected strategies, or priority zones. Perfect for business planning, competitive analysis, or project evaluation. Fully editable in PowerPoint, Keynote, and Google Slides for seamless integration into your presentations.


5 slides
Business Model Canvas and Strategy Presentation
Visualize your entire business model in one clean, structured slide. This presentation template breaks down key areas—Partners, Activities, Value Propositions, Customers, Channels, Costs, and Revenue—into a color-coded layout for strategic clarity. Perfect for startups, consultants, or internal strategy teams. Fully editable in PowerPoint, Keynote, and Google Slides.


12 slides
SMART Goal Setting Presentation
Achieve clarity and focus with this SMART Goal Setting Presentation template. Featuring a visually engaging target and color-coded SMART framework, this slide helps break down objectives into Specific, Measurable, Attainable, Relevant, and Timely components. Perfect for business planning, project management, and personal development. Compatible with PowerPoint, Keynote, and Google Slides.


5 slides
Coffee Tasting Infographics
Coffee Tasting, also known as coffee cupping, is the process of evaluating and appreciating the flavors, aromas, and characteristics of different coffee beans. These infographic templates are designed to educate participants about the art of coffee tasting. The captivating visuals will empower your audience to appreciate the flavors and nuances of different coffee varieties. Whether you're hosting a coffee tasting event or sharing information with coffee enthusiasts, this template will help you deliver an engaging and visually appealing presentation that celebrates the joy of coffee tasting. Compatible with Powerpoint, Keynote, and Google Slides.


7 slides
Agriculture Infographics Presentation Template
Our Agriculture Infographic template is a great way to present your information about the structure, process and procedures of agricultural. This template includes a set of slides with illustrations and charts that will help you make an eye-catching presentation in just minutes. This template has been designed for use in PowerPoint, and is well-suited for both personal and business use. This infographic template is a perfect choice for presenting the statistical data about agriculture, such as product and service, market share and revenue, production levels and other information.


10 slides
Project Budget Breakdown Presentation
The "Project Budget Breakdown Presentation" template offers a clear and efficient way to visualize budget allocations within a project. It uses a visually appealing color scheme that highlights four different budget segments, each represented by a different color to ensure quick readability and easy understanding. The template allows you to illustrate percentages and corresponding financial values, making it straightforward for stakeholders to grasp budget allocations at a glance. This template is highly beneficial for project managers, financial analysts, and business executives who need to present and discuss budgetary details clearly and concisely in project meetings or budget reviews. It is adaptable for use in various industries, including construction, IT, marketing, and research development, supporting effective budget management and transparency.


4 slides
Step-by-Step 30-60-90 Milestones Presentation
Present clear onboarding or strategic progressions with the Step-by-Step 30-60-90 Milestones Presentation. This layout is ideal for showcasing phased plans, goal tracking, and employee integration milestones over time. Each segment highlights a distinct 30-, 60-, and 90-day focus, helping visualize stepwise achievement clearly. Fully editable in PowerPoint, Keynote, and Google Slides.


6 slides
Construction Company Infographics
Construct a clear and compelling presentation for your Construction Company with our customizable infographic template. This template is fully compatible with popular presentation software like PowerPoint, Keynote, and Google Slides, allowing you to easily tailor it to showcase various aspects of your construction business. The Construction Company infographic template offers a visually engaging platform to highlight your company's services, projects, team, and achievements. Whether you're a construction company owner, project manager, or marketing professional, this template provides a user-friendly canvas to create informative presentations and promotional materials. Elevate your construction company's profile with this SEO-optimized Construction Company infographic template, thoughtfully designed for clarity and ease of use. Customize it to showcase your company's portfolio, expertise, safety measures, and client testimonials, ensuring you make a lasting impression on your audience. Start crafting your personalized infographic today to showcase your construction company effectively.


5 slides
Agile Scrum Task Board Workflow Presentation
Simplify your Agile process with this task board workflow diagram. Clearly outline backlog, sprint planning, task execution, and delivery steps in a visually engaging format. Perfect for Agile teams, project managers, or software developers. Fully customizable in PowerPoint, Keynote, and Google Slides to fit your sprint and scrum documentation needs.


6 slides
Personal and Business Insurance Plans Presentation
Compare and Present Insurance Options effortlessly with this Personal and Business Insurance Plans Presentation template. Designed to clearly illustrate different insurance plans, this slide helps in comparing coverage options, benefits, and key features for both personal and business policies. Ideal for insurance agencies, financial consultants, and corporate presentations, this template is fully customizable and compatible with PowerPoint, Keynote, and Google Slides for seamless editing.


7 slides
Asia Population Infographic Presentation
An Asia Map infographic is a visual representation of the Asian continent, highlighting its geographic features, population, culture, history, and other relevant information. Use this template as a graphic representation of Asia that combines text, data, and images in a visually appealing and informative way. This template can be used as a political or physical maps, regional map, thematic maps, or a combination of these. They may also include charts, graphs, illustrations, photographs, or other visual elements to convey information effectively. This template is completely customizable.


26 slides
Customer Service Bold Presentation
Step into a world where every interaction is more than a service; it's an experience, artfully portrayed in a dynamic series highlighting the essence of customer relations. This vibrant presentation is a bold statement in customer service excellence, where each slide is a burst of sunshine in hues of optimism, communicating the core principles of attentiveness and care. The visuals are a striking blend of modern design and functional aesthetics, spotlighting the human touch that underlies the digital interactions of today's customer-centric landscapes. From the empathetic smiles of service agents to the infographic elucidation of response strategies, the narrative captures the spirit of connection between brand and consumer. It's a testament to the seamless melding of efficiency and warmth, showcasing the art of turning every customer journey into a tale of satisfaction and loyalty. This is the celebration of customer service—not just as a duty, but as a craft, where every detail contributes to a masterpiece of memorable experiences.


4 slides
Personal Finance and Money Management Presentation
Effectively present Personal Finance and Money Management insights with this clean and professional slide template. Designed with a minimalist stopwatch infographic, this template helps visualize key financial principles like budgeting, saving, and investing. Fully customizable with editable text, colors, and icons, it’s perfect for business reports, financial workshops, or personal finance presentations. Compatible with PowerPoint, Keynote, and Google Slides for seamless editing.


23 slides
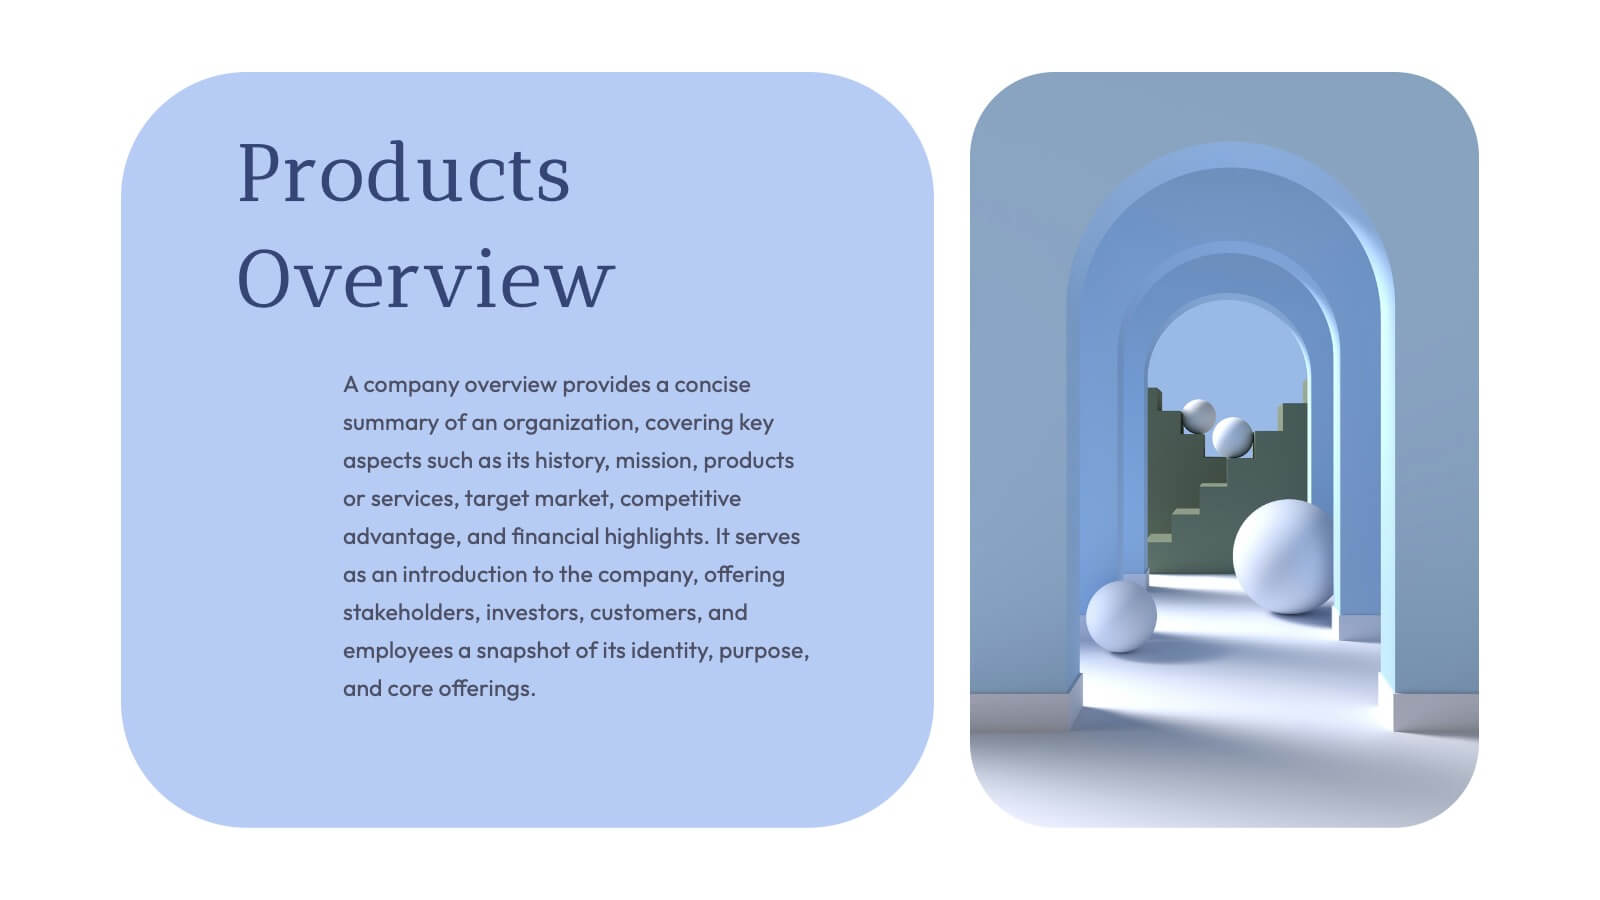
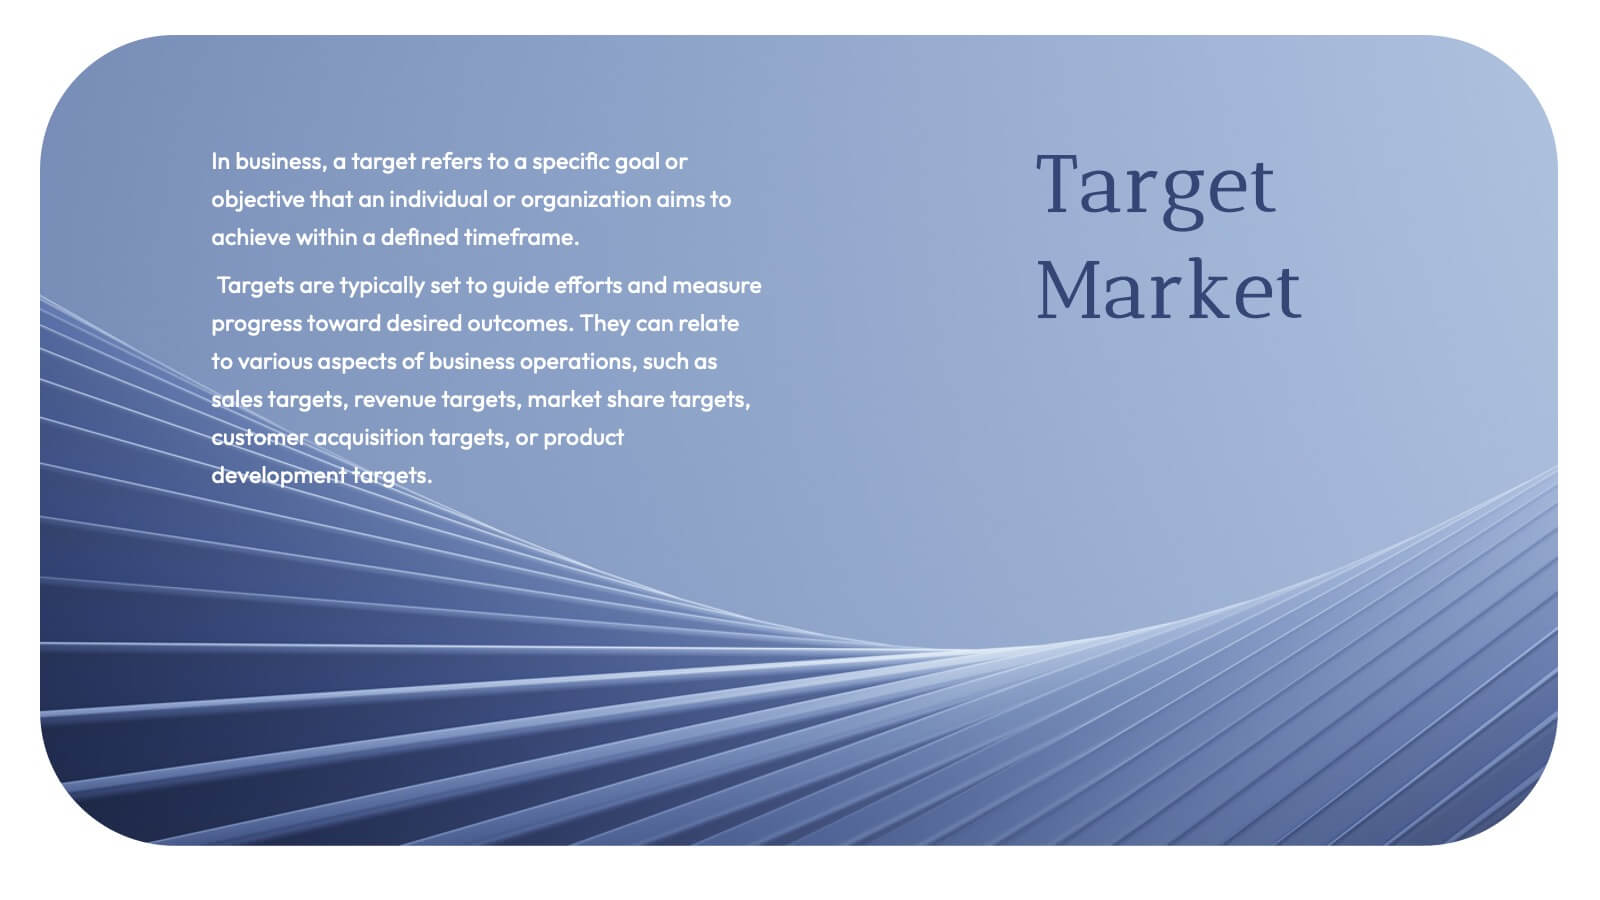
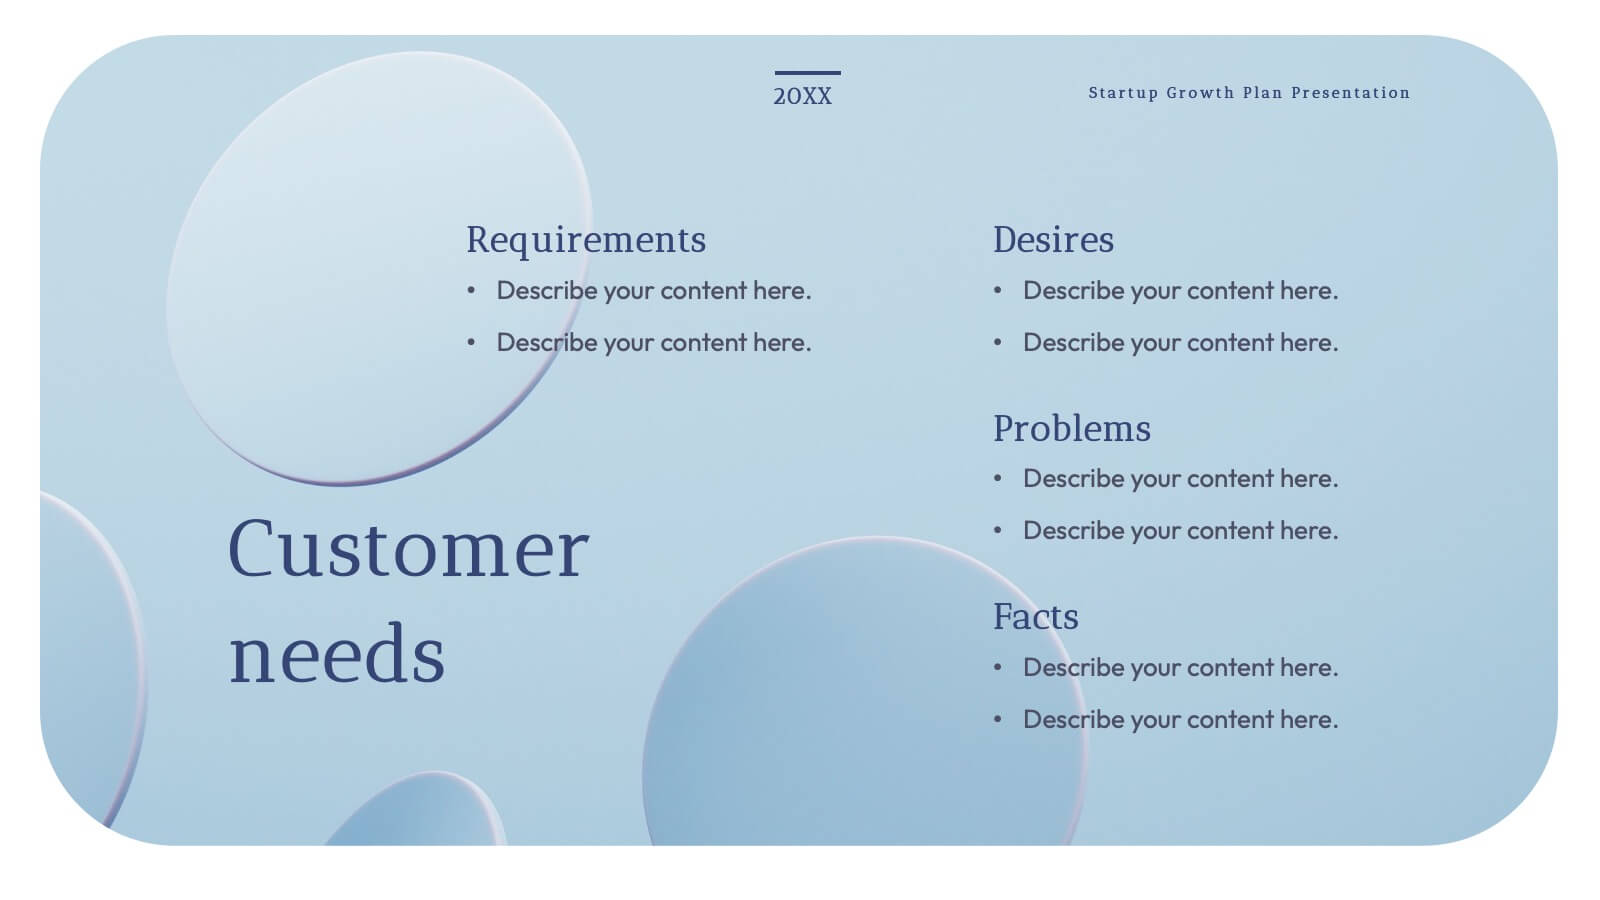
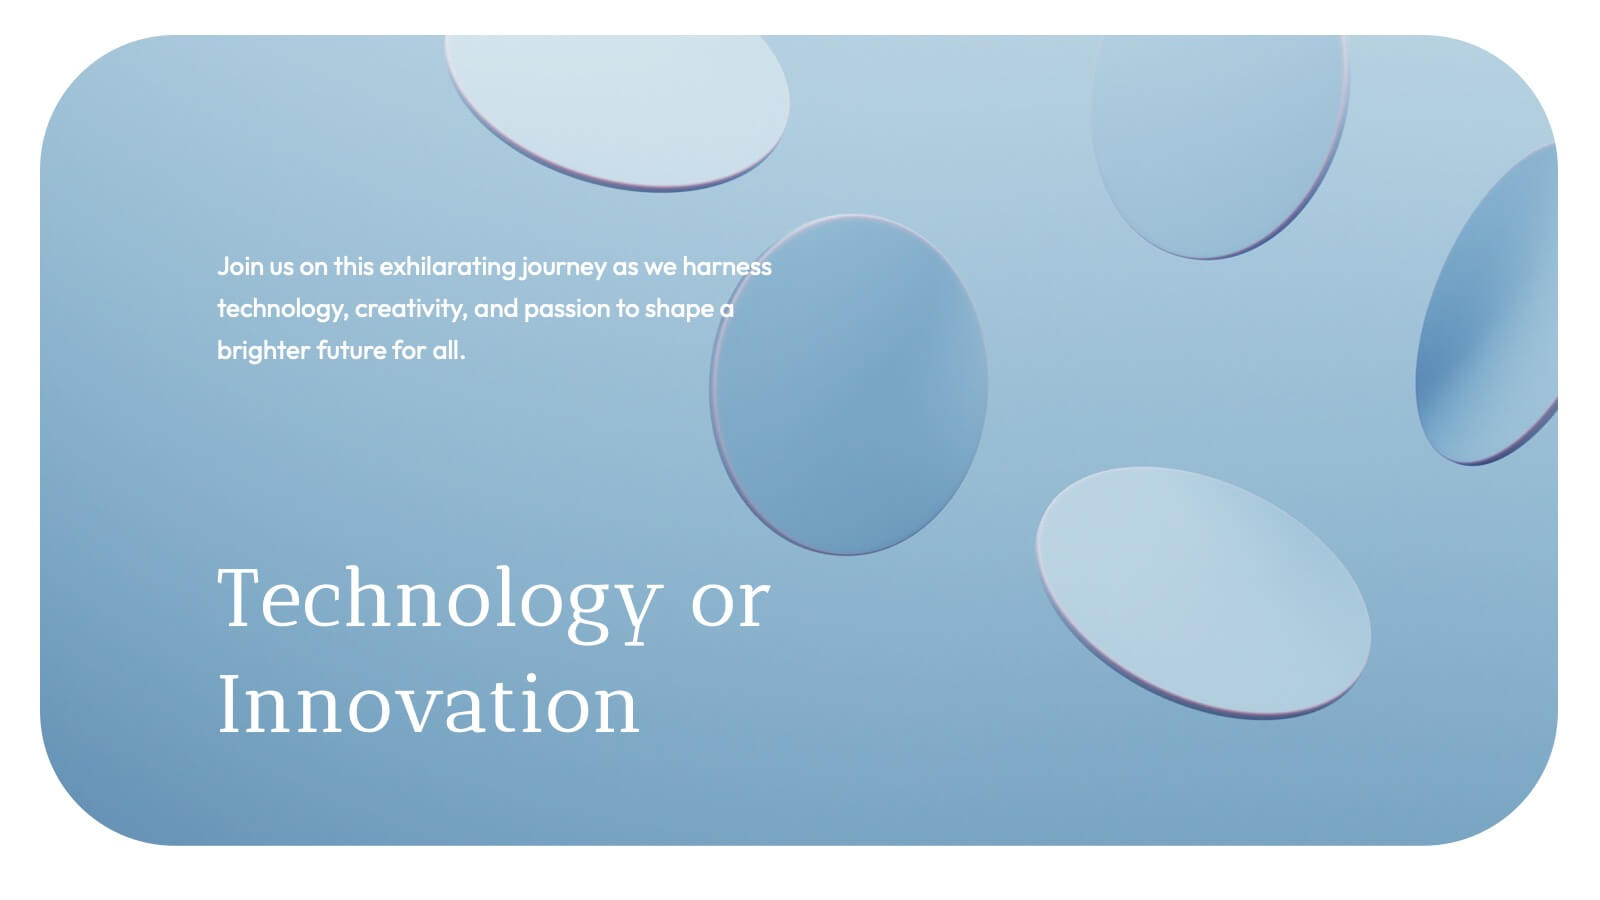
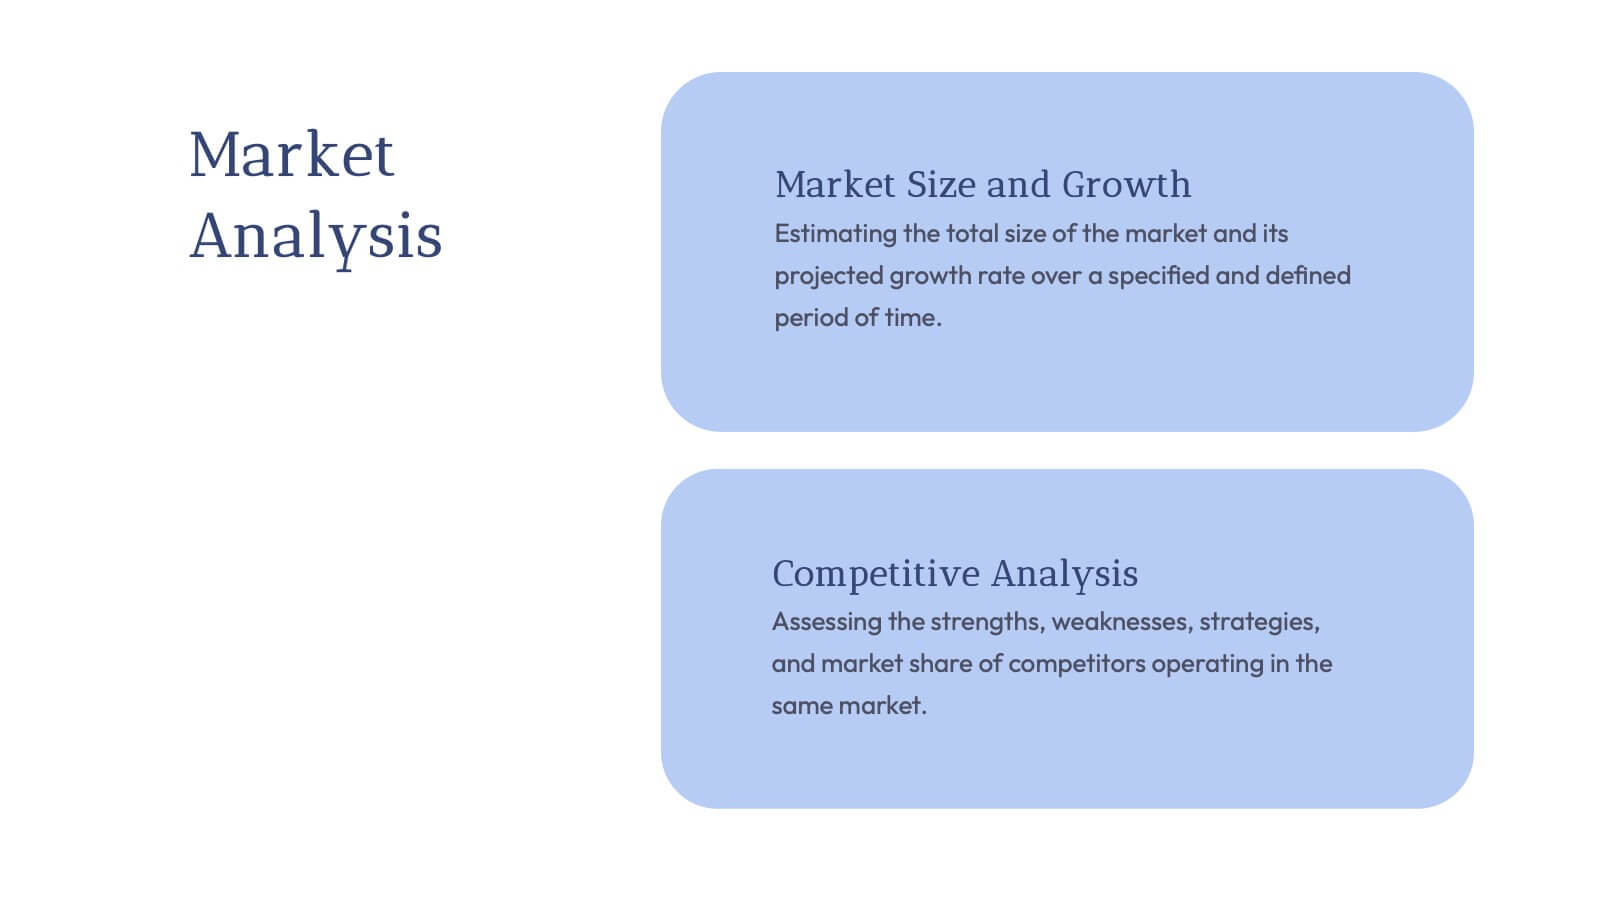
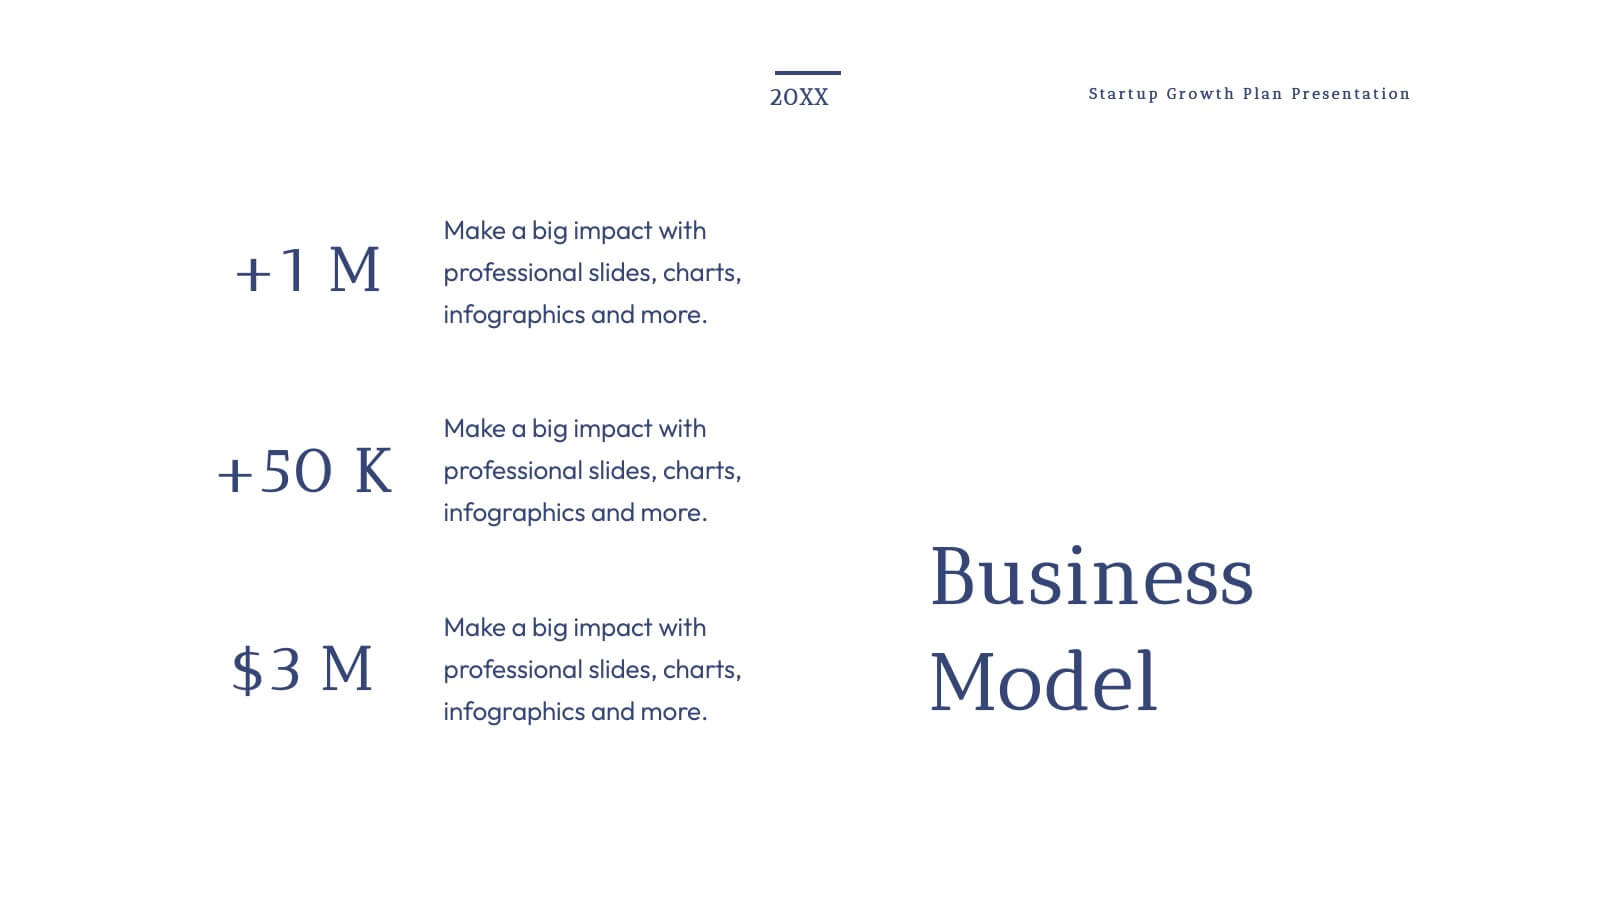
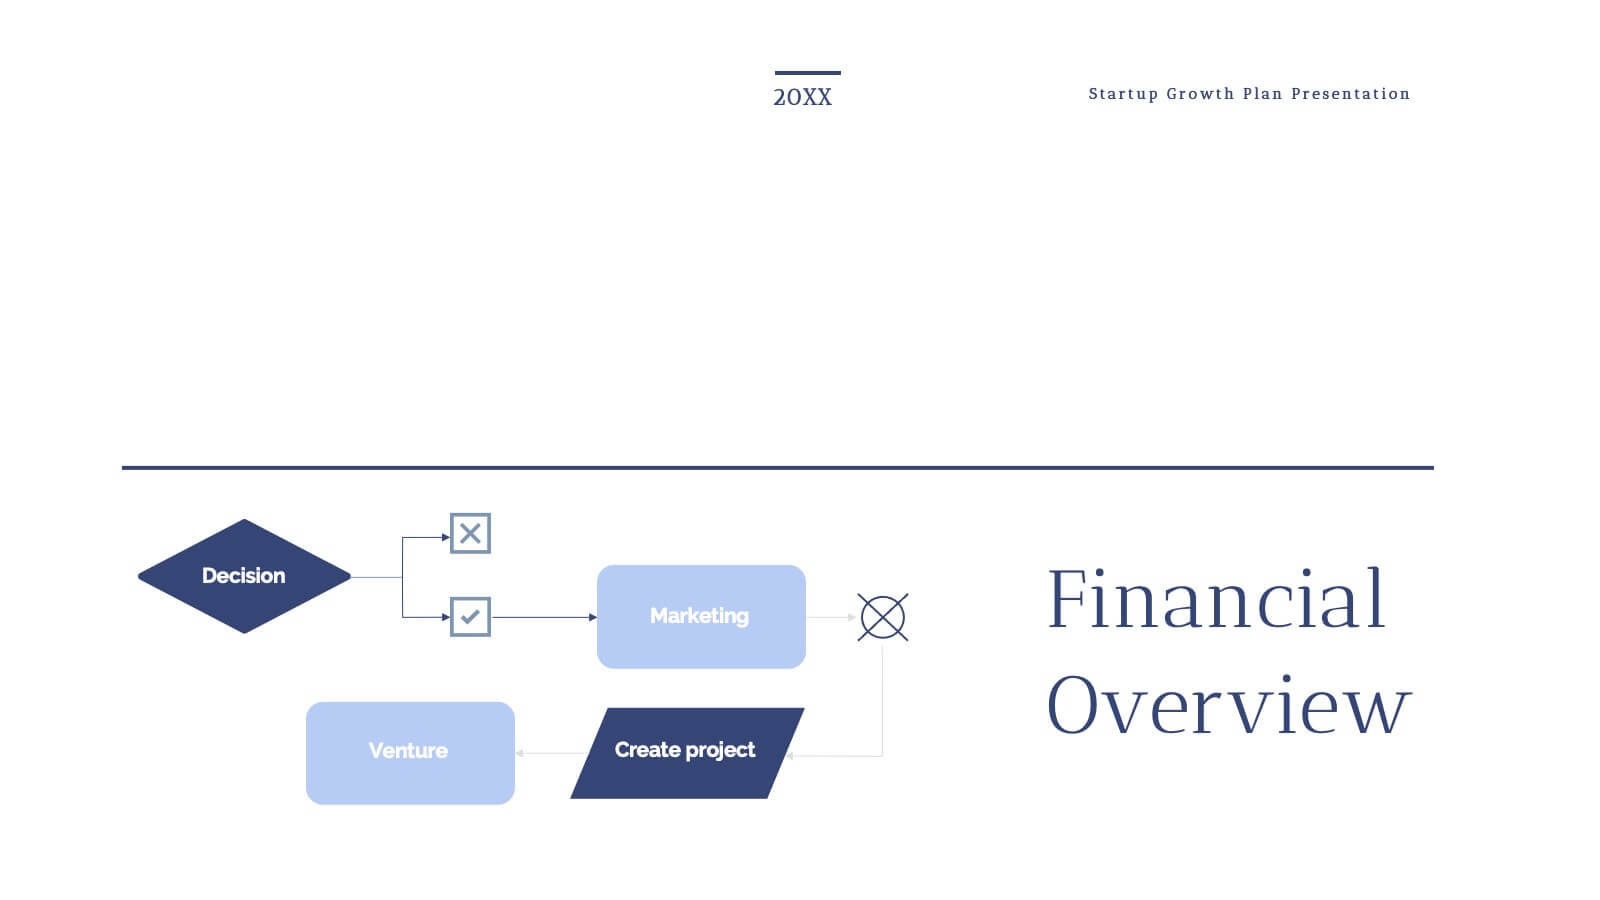
Grecian Startup Growth Plan Presentation
Elevate your pitch with this stunning Grecian-inspired presentation template, perfect for outlining your startup's growth plan! Showcase your business strategy, revenue projections, and scaling opportunities with a clean, elegant design that grabs attention. Impress investors and stakeholders with every slide. Compatible with PowerPoint, Keynote, and Google Slides for seamless customization.


6 slides
Geographic Asia Overview Template Presentation
Discover insights across Asia with a clean, professional layout that brings your regional data to life. Perfect for showcasing demographics, market distribution, or geographic highlights, this visual map design ensures clarity and impact in every slide. Fully compatible with PowerPoint, Keynote, and Google Slides for effortless editing and presentation.


5 slides
Process Improvement Cycle Mapping Presentation
Illustrate continuous growth and optimization with this modern process improvement cycle template. Featuring a dynamic circular flow design, it’s ideal for showcasing iterative strategies, workflow enhancements, or business development stages. Fully editable in Canva, PowerPoint, and Google Slides, it ensures clarity and professionalism in mapping each step toward better performance.