


Features
- 6 Unique slides
- Fully editable and easy to edit in Microsoft Powerpoint, Keynote and Google Slides
- 16:9 widescreen layout
- Clean and professional designs
- Export to JPG, PDF or send by email


Do you have any questions?
Recommend


6 slides
South America Biome Map Infographics
Explore our adaptable South America Biome Map infographic template, a powerful resource for visualizing the diverse ecosystems found across the South American continent. This template is fully compatible with popular presentation software such as PowerPoint, Keynote, and Google Slides, enabling you to easily customize it to suit your specific needs. The South America Biome Map infographic template serves as a flexible canvas for illustrating information about various biomes, including rainforests, grasslands, deserts, and more. Whether you're an educator, environmental enthusiast, or simply intrigued by South America's ecology, this template offers an intuitive platform to create informative presentations and educational materials. Impress your audience with this SEO-optimized South America Biome Map infographic template, expertly designed for clarity and user-friendliness. Customize it to showcase the unique features and biodiversity of South America's biomes, making it an invaluable tool for your projects and presentations. Get started on crafting your personalized infographic today!


4 slides
Digital Course Creation Flow Presentation
Guide your audience through the steps of building a digital course with this clear and modern flowchart layout. Designed to simplify complex processes, this visual template is ideal for educators, instructional designers, or online coaches. Fully compatible with PowerPoint, Keynote, and Google Slides for easy customization and seamless use.


7 slides
Property Market Forecast and Trends Presentation
Present your real estate insights clearly with this Property Market Forecast and Trends Presentation. Featuring a central isometric house graphic surrounded by six editable segments, this layout is perfect for highlighting key indicators like market trends, pricing shifts, and investment zones. Use the icons and color-coded areas to enhance clarity. Ideal for housing reports and investor decks. Fully compatible with PowerPoint, Canva, Keynote, and Google Slides.


6 slides
North America Market Map Infographic
North America is the third largest continent in the world and home to over 50 countries, with a population of over 400 million. This infographic template is designed to show you where each country is located within North America, as well as its population, annual GDP per capita, and other important data points that make it unique. This template is the perfect tool for navigating the international market. This infographic map allows you to get a bird's eye view of how your business is performing across the region, and what areas need more attention. Fully customizable and compatible with Powerpoint, Keynote, and Google Slides.


5 slides
Business Introduction and Company Profile Presentation
Introduce your business with precision and clarity using this company profile layout. Highlight your mission, vision, and key insights alongside sleek visuals and structured content. Perfect for new client onboarding, internal briefings, or stakeholder presentations. Fully editable in PowerPoint, Keynote, and Google Slides for seamless, professional customization.


4 slides
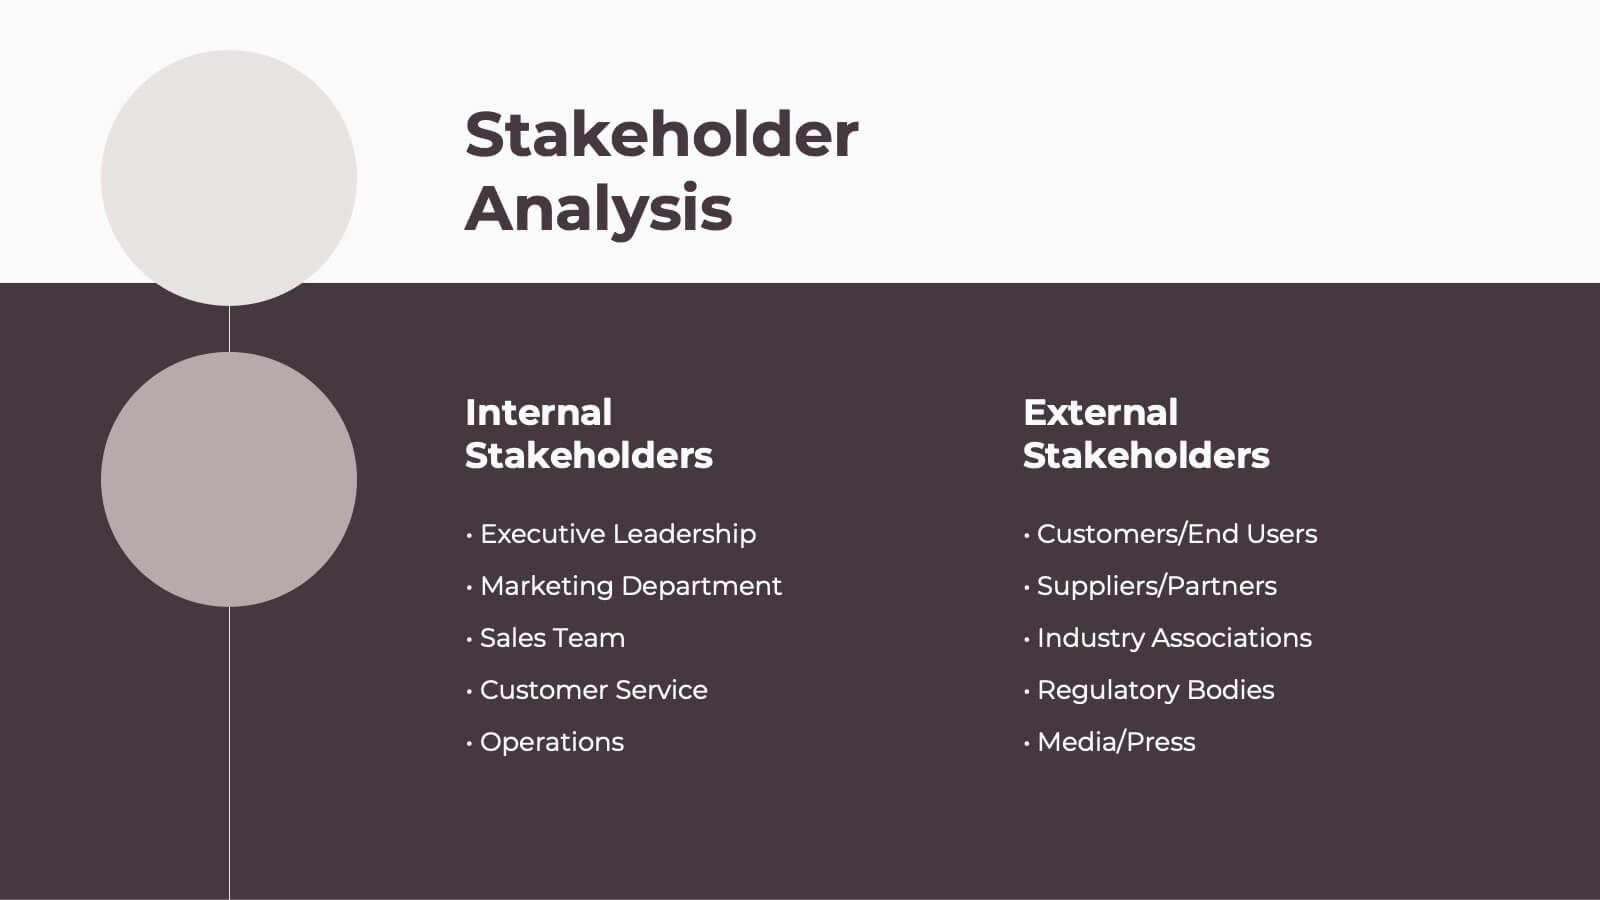
Stakeholder Analysis Template for Projects Presentation
Turn complex stakeholder relationships into clear, actionable insights with this dynamic and modern quadrant design. Ideal for visualizing influence, communication strategies, and engagement priorities, it helps teams build stronger collaboration frameworks. Fully editable and compatible with PowerPoint, Keynote, and Google Slides for effortless professional use.


4 slides
Science Lab Results and Data Analysis Presentation
Visualize lab data with clarity using this science-themed infographic. Featuring test tubes in a rack, it’s ideal for presenting experimental results, sample comparisons, or analysis summaries. Each tube aligns with icons and key points for easy interpretation. Fully customizable in PowerPoint, Keynote, and Google Slides to match your findings.


6 slides
Cause-and-Effect Chain Using Fishbone Diagram Presentation
Break down complex issues step by step with the Cause-and-Effect Chain Using Fishbone Diagram Presentation. Ideal for project managers, analysts, or educators, this template helps you visually map out relationships between causes and outcomes. Fully editable in Canva, PowerPoint, and Google Slides for seamless integration into your workflow.


5 slides
Scalability Metrics for Business Growth Presentation
Visualize business growth stages with this tiered pyramid-style slide. Each layer highlights key performance metrics with editable percentage labels, perfect for scaling strategies or KPI reports. Simple, structured, and impactful—ideal for business planning, team briefings, or investor updates. Fully customizable in PowerPoint, Keynote, and Google Slides for seamless editing.


21 slides
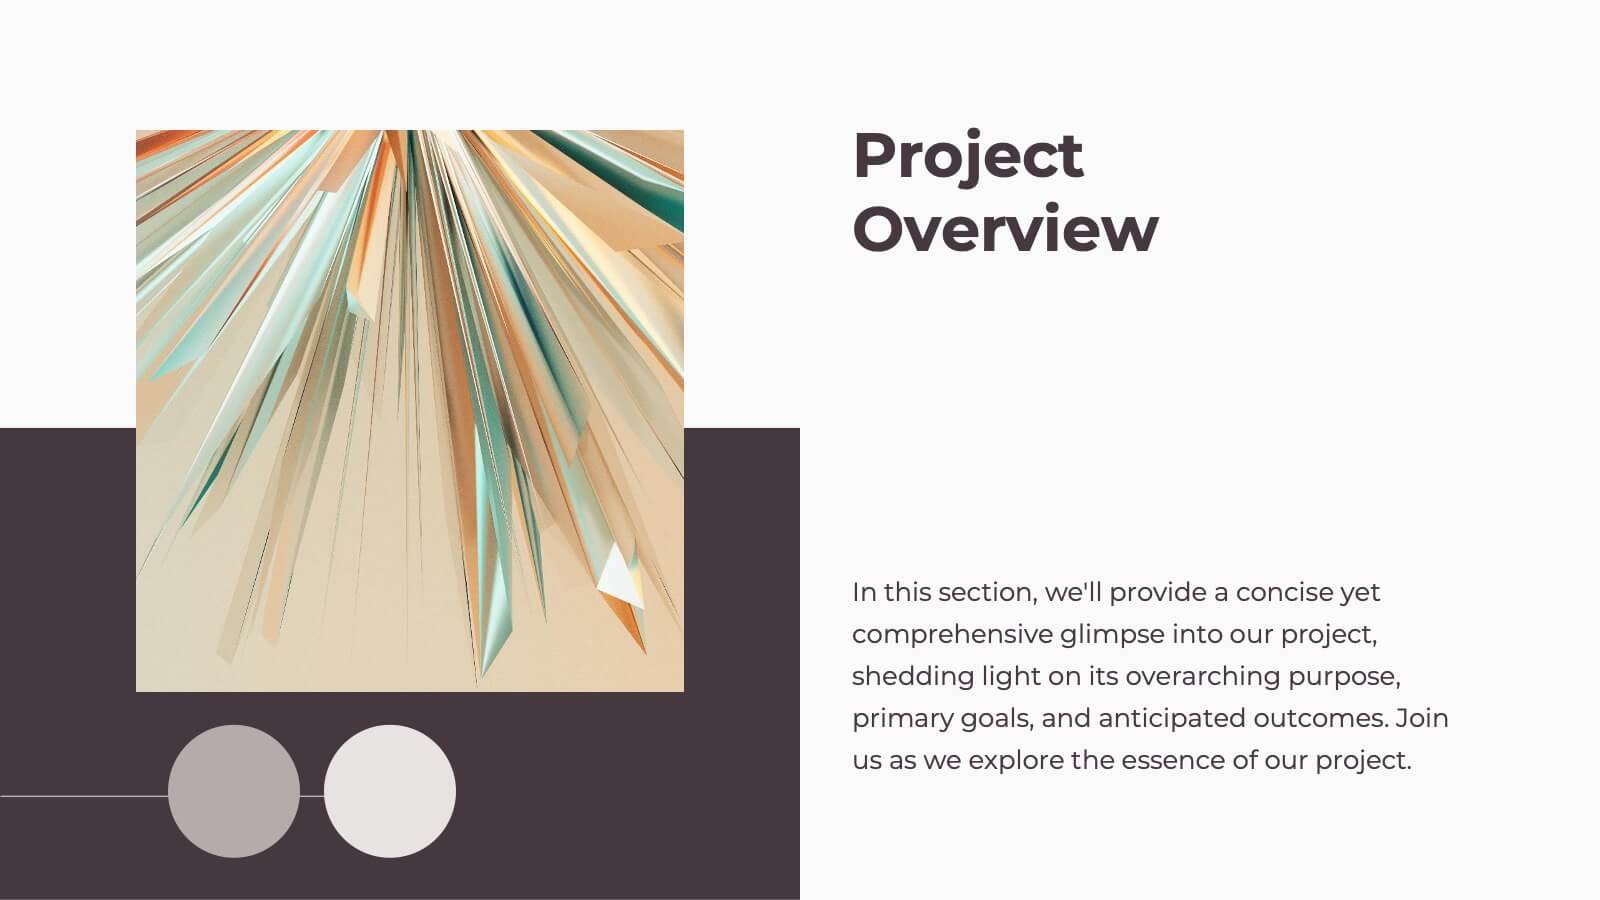
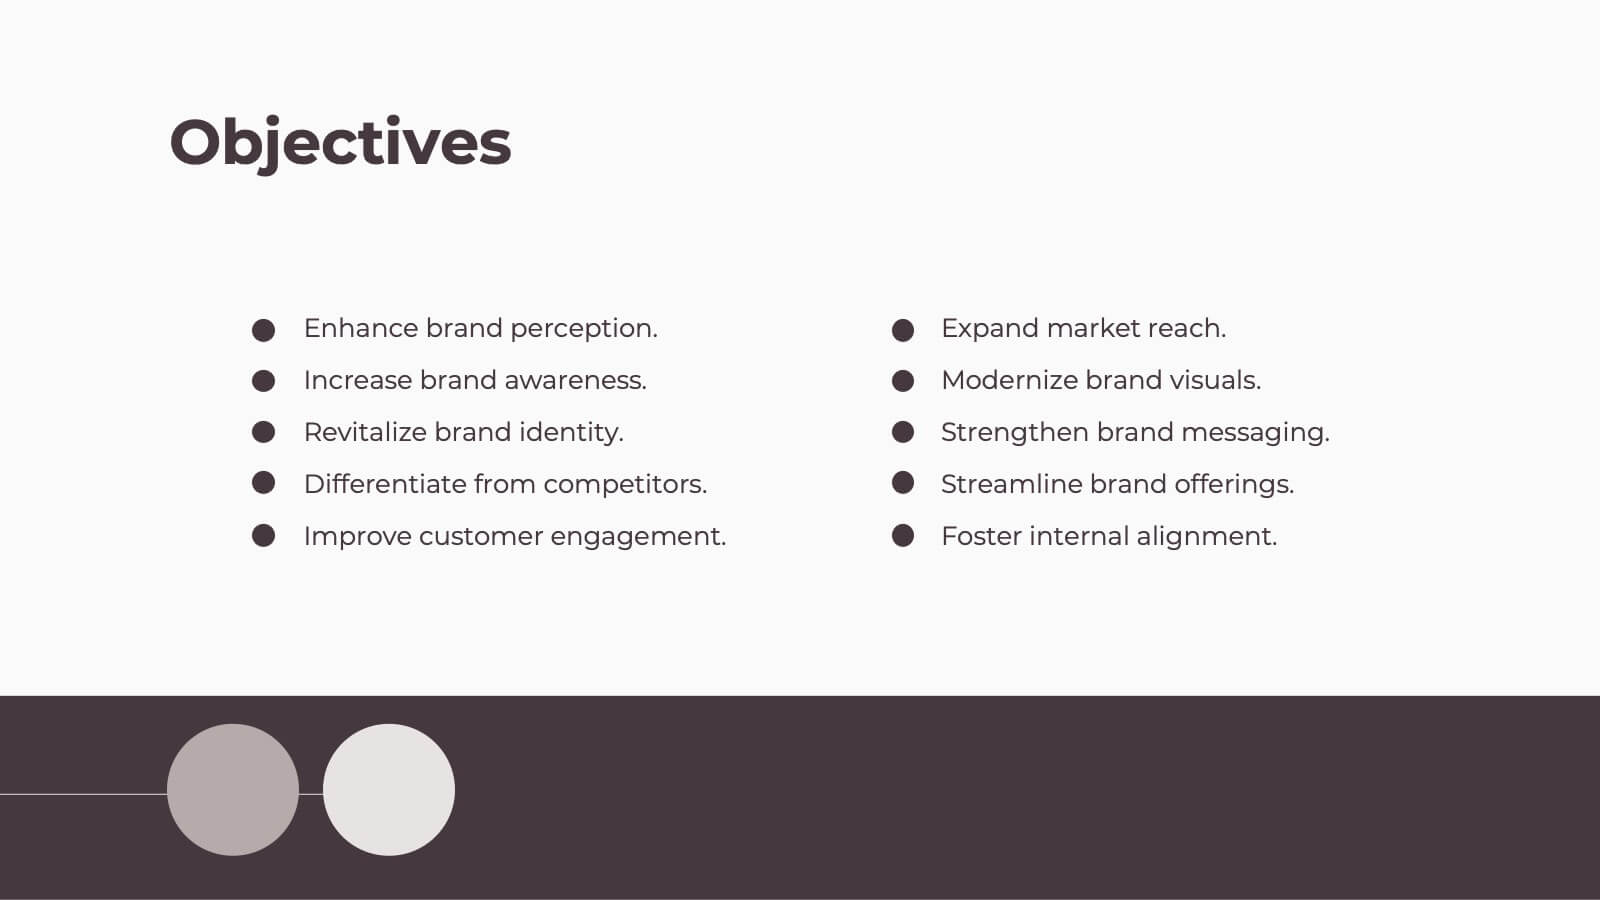
Spectrum Project Timeline Presentation
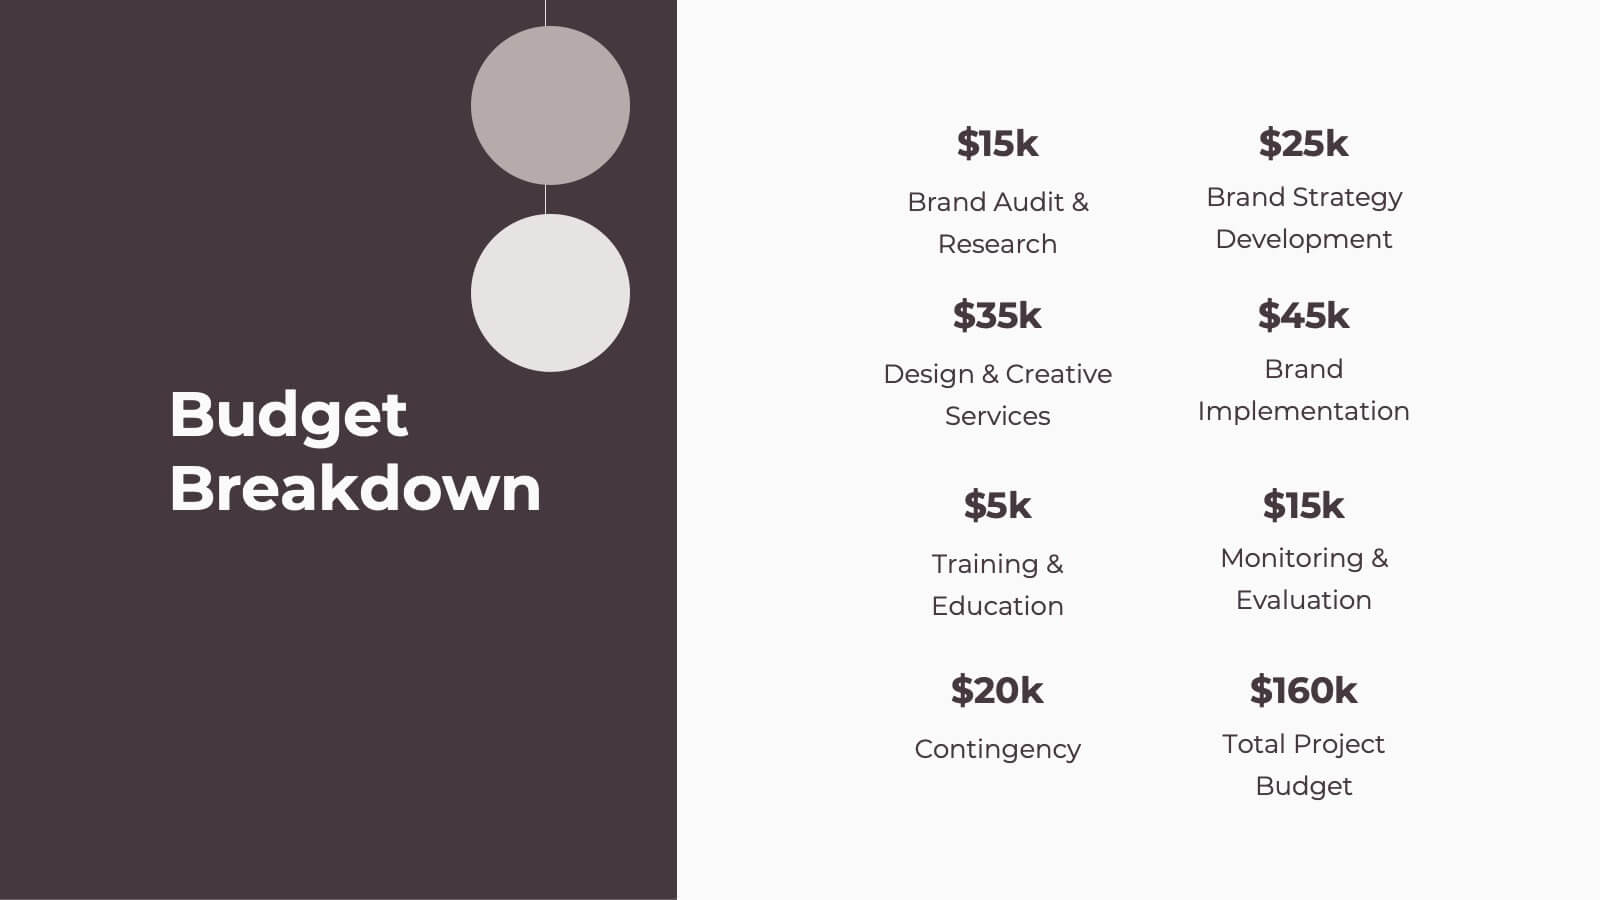
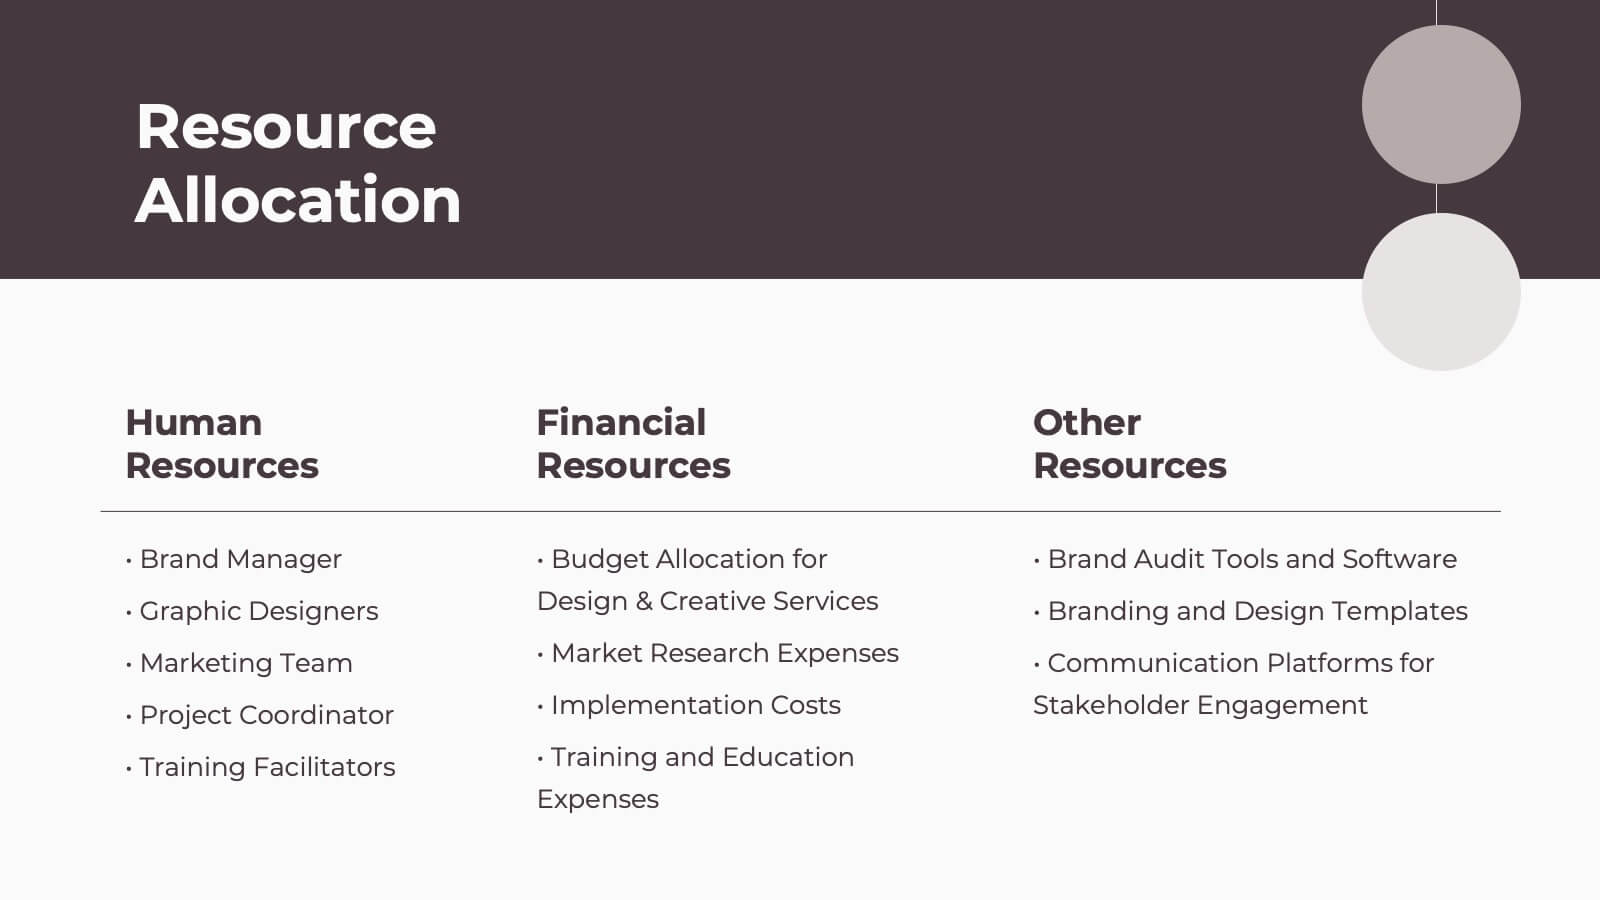
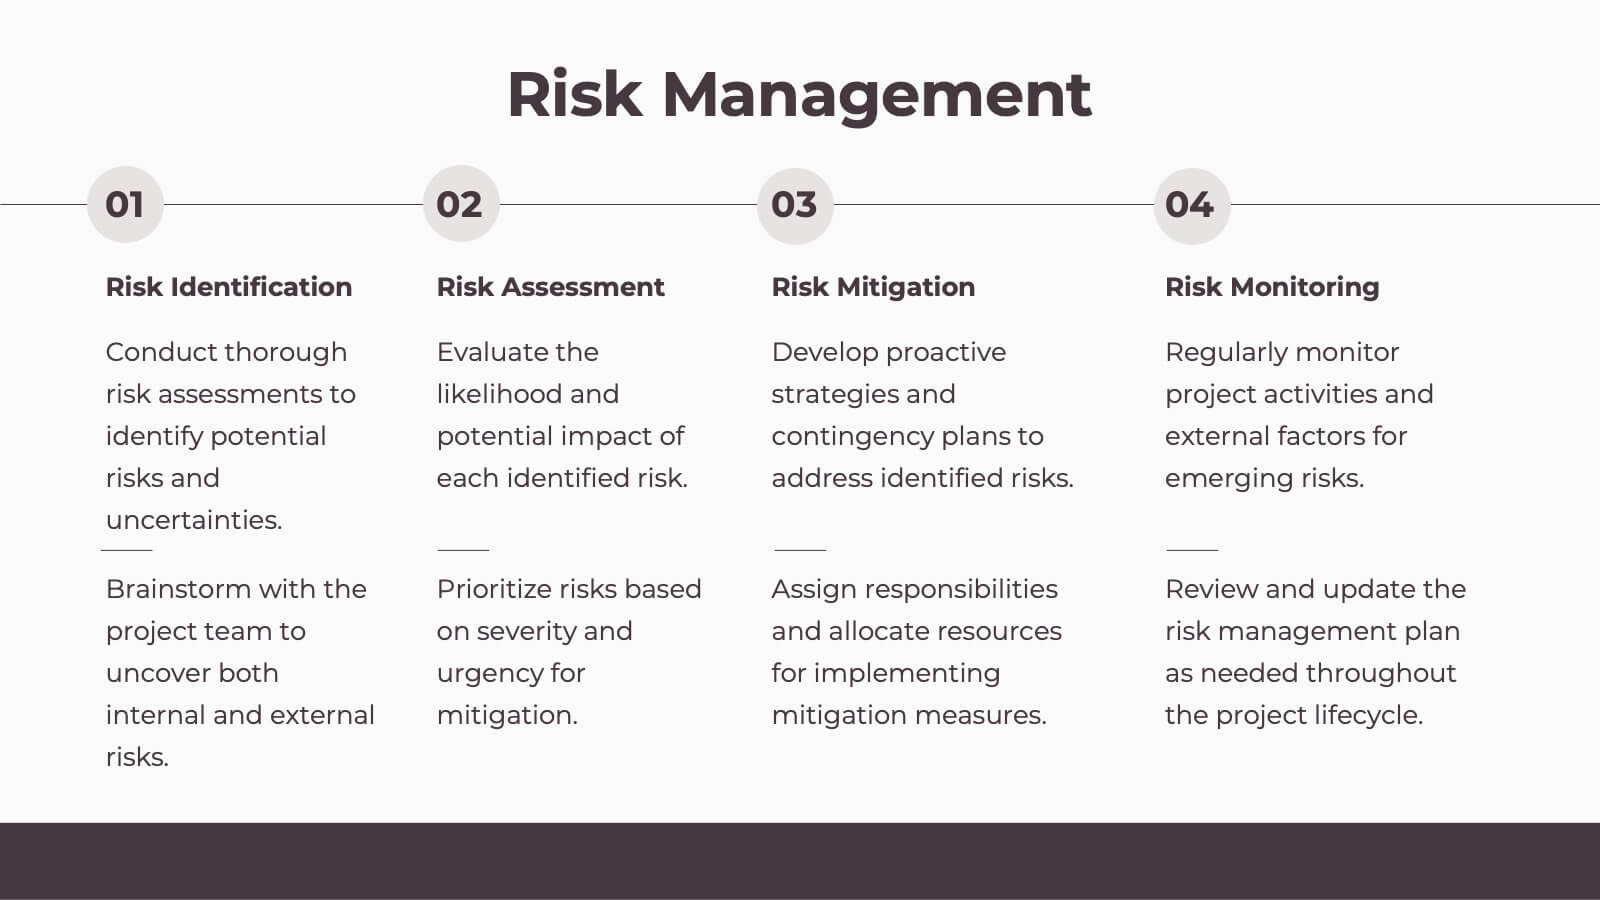
Plan and execute your projects with precision using this detailed project plan template! Perfect for outlining objectives, timelines, and resource allocation. Ideal for project managers and teams aiming to ensure successful project delivery. Compatible with PowerPoint, Keynote, and Google Slides, this template keeps your project organized, clear, and on track. Ensure project success!


7 slides
Empathy Map Marketing Infographics
Gain deeper customer insights with our Empathy Map Marketing Infographic, ideal for marketing teams, product developers, and customer experience strategists. This infographic is a visual tool designed to help you understand your customers' experiences and perspectives. Our Empathy Map Marketing Infographic outlines a clear framework to map out what customers say, think, do, and feel. It's crafted to assist teams in building a customer-centric approach by examining various aspects of the customer journey. With sections dedicated to customer thoughts, emotions, actions, and pain points, you can tailor your marketing strategies to better address customer needs and enhance engagement. This SEO-optimized infographic ensures your marketing plans resonate with your target audience. Implement our infographic in your marketing workshops to foster an empathetic understanding of your customers, driving more personalized and effective marketing campaigns.


4 slides
Communication Model and Channels Presentation
Illustrate how your messages move through various channels using this clean, visual communication model slide. Ideal for team briefings, marketing workflows, or internal training, it simplifies how information is shared across platforms. Fully editable in Canva, PowerPoint, and Google Slides for seamless customization to match your branding and messaging goals.


6 slides
Organizational Structure Overview Presentation
Map out your team’s structure with clarity using this simple organizational chart template. Ideal for showcasing departments, reporting lines, or team roles, it helps stakeholders quickly understand who’s who and how responsibilities are divided. Perfect for internal meetings, onboarding decks, or company overviews. Works with PowerPoint, Keynote, and Google Slides.


5 slides
Political Campaign Result Infographics
A Political Campaign is an organized effort by an individual or group to promote or oppose a political candidate, cause, or policy. Our vertical Infographic is a graphical representation of the outcome of a political campaign presented in a vertical layout. This template includes charts, diagrams, and tables that provide an easy-to-understand analysis of election results. This can be used to showcase the distribution of votes across different regions, the percentage of votes garnered by each candidate, and other relevant information that provides a comprehensive overview of the election outcome.


6 slides
Strategic Objective Planning Presentation
Present your Strategic Objective Planning with this powerful, chess-themed presentation template. Highlight competitive strategies, goal alignment, and decision-making with visually engaging chess piece graphics. Ideal for corporate strategy, business planning, and leadership presentations. Compatible with PowerPoint, Keynote, and Google Slides.


4 slides
Meetings Agenda Slide Presentation
Make every meeting feel purposeful with a clean layout that highlights topics, timing, and key discussion points effortlessly. This presentation helps teams stay aligned, organized, and ready to follow the flow of the session. Perfect for planning or reporting. Fully compatible with PowerPoint, Keynote, and Google Slides.


7 slides
KPI Software Dashboard Infographic
Maximize the effectiveness of your performance analysis with our KPI Software Dashboard infographic, optimized for use in Powerpoint, Keynote, and Google Slides. This dynamic infographic is an indispensable tool for business analysts, project managers, and data-driven professionals seeking to present key performance indicators (KPIs) in an insightful and engaging manner. Our KPI Software Dashboard infographic offers a clear, visual representation of critical data points that influence business decisions. With its diverse array of charts, graphs, and meters, it provides an at-a-glance overview of company performance across various metrics. The design is tailored to enhance readability and comprehension, allowing your audience to quickly grasp complex data trends and patterns. Whether you're reviewing sales figures, monitoring customer satisfaction, or tracking project progress, this infographic is designed to streamline the presentation of your data. The compatibility with popular presentation platforms ensures a smooth integration into your slide deck, making it a breeze to communicate the insights that matter. Utilize this infographic to turn your KPI data into compelling narratives that drive strategic business actions.