


Features
- 5 Unique slides
- Fully editable and easy to edit in Microsoft Powerpoint, Keynote and Google Slides
- 16:9 widescreen layout
- Clean and professional designs
- Export to JPG, PDF or send by email


Do you have any questions?
Recommend


7 slides
Oceania Countries Map Infographic
Set sail on an informative voyage across the enchanting islands of Oceania with our meticulously crafted map infographic. Dressed in the pristine shades of white, the vastness of blue, the lushness of green, and the richness of gold, our template encapsulates the beauty and diversity of Oceania's countries. Outfitted with pinpoint infographics, emblematic icons, and island-specific image placeholders, it offers a holistic view of this unique region. Expertly configured for Powerpoint, Keynote, or Google Slides. An essential compass for educators, geographers, or businesses exploring the Oceania market. Journey with knowledge; let each slide be a revelation of Oceania's splendors.
20 slides
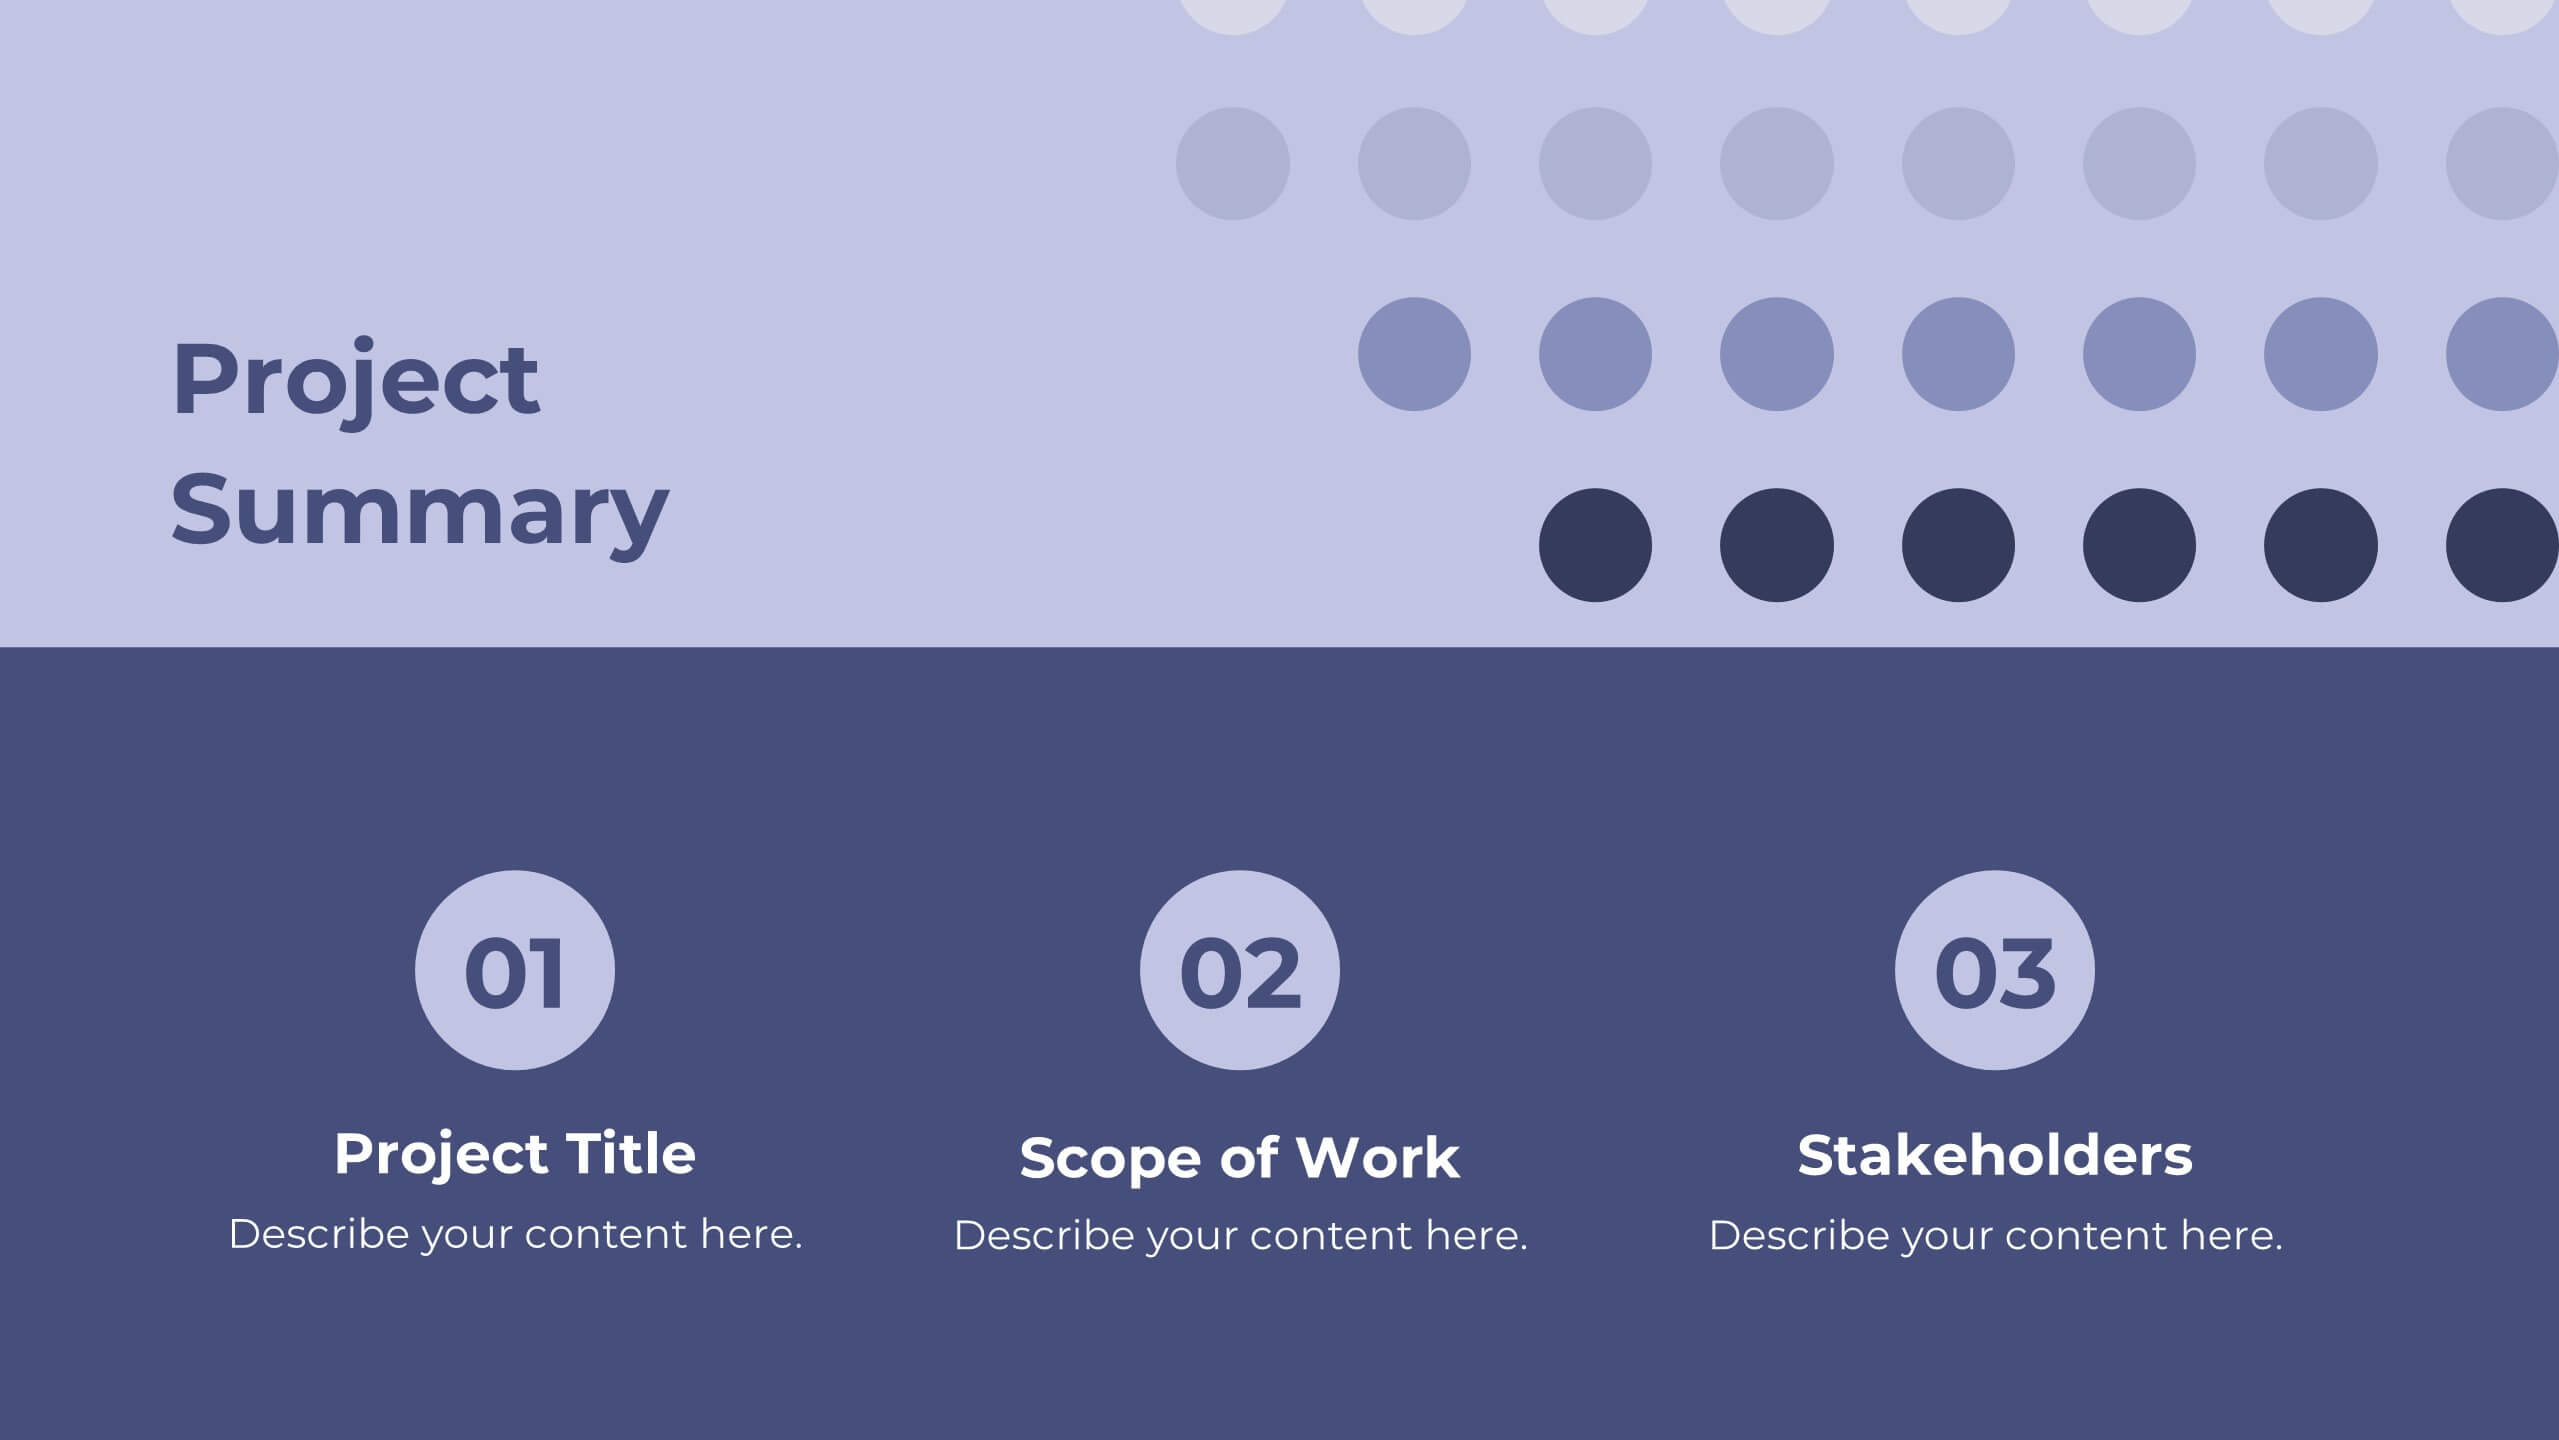
Labyrinth Project Proposal Presentation
Present your project proposal with this clean and professional template! Covering sections such as objectives, scope of work, timeline, and budget breakdown, it helps you convey your plan clearly and effectively. Fully customizable and compatible with PowerPoint, Keynote, and Google Slides, it’s perfect for delivering impactful proposals to clients.


4 slides
Insurance Market Trends
Track and present evolving market dynamics with this Insurance Market Trends presentation. Featuring clean, multi-point visual elements, this slide set is perfect for analysts, consultants, and insurance professionals aiming to highlight growth segments, percentages, or trend categories. Fully editable in PowerPoint, Keynote, and Google Slides.


5 slides
Phone and Laptop Mockup Slides Presentation
Bring your content to life with a sleek, modern slide that showcases your product or message beside a clean laptop-and-phone mockup. This presentation focuses on illustrating comparisons, app designs, or digital concepts in a polished, professional way. Ideal for tech pitches or product overviews, and fully compatible with PowerPoint, Keynote, and Google Slides.


7 slides
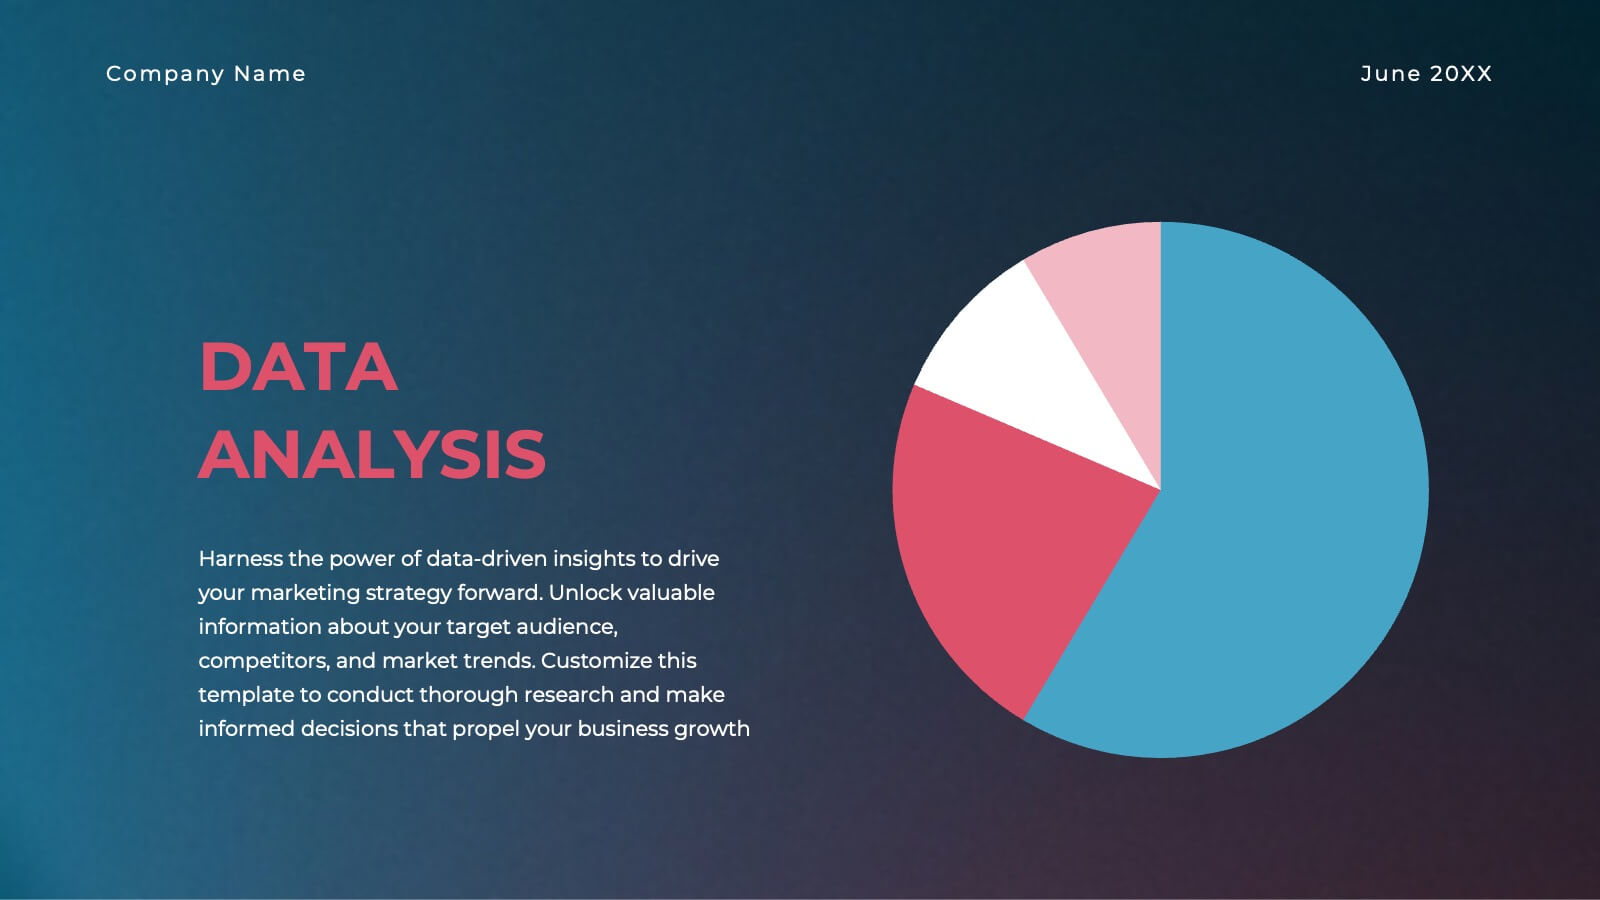
SEO Infographic Presentation Template
SEO stands for “search engine optimization.” In simple terms, it's the process of improving your site to increase its visibility when people search for products or services related to your business in Google and other search engines. Learn more about SEO with this clean template, including how to optimize your pages and how search engines work. This template will inform you how keywords and phrases drive search engine results, how they affect rankings, and what steps to take to achieve higher rankings. This template comes packed with fun illustrations, and can be used as a great presentation.


26 slides
Modern Company Profile Striped Presentation
Present your company with style, our modern company profile presentation, is the perfect template to showcase your business in a contemporary and stylish way. This template combines professionalism with a touch of flair and striped elements, making it ideal for modern businesses looking to make a lasting impression. Ideal for tech startups, creative agencies, or a professional service firms, this presentation will help you convey your company's professionalism. Fully customizable and compatible with Powerpoint, Keynote, and Google Slides. This makes it easy for potential clients, partners, and investors to reach out!


7 slides
Relationship Communication Infographic
A Relationship Communication Infographic is a visual representation of key concepts and strategies related to effective communication in relationships. This template can be used to provide practical tips and advice for improving communication skills, resolving conflicts, and building stronger, healthier relationships. This infographic can be a helpful resource for individuals seeking to improve their communication skills and build stronger, more fulfilling relationships. This template is compatible with Powerpoint, Keynote and Google Slides making it easily customizable to fit your needs.

22 slides
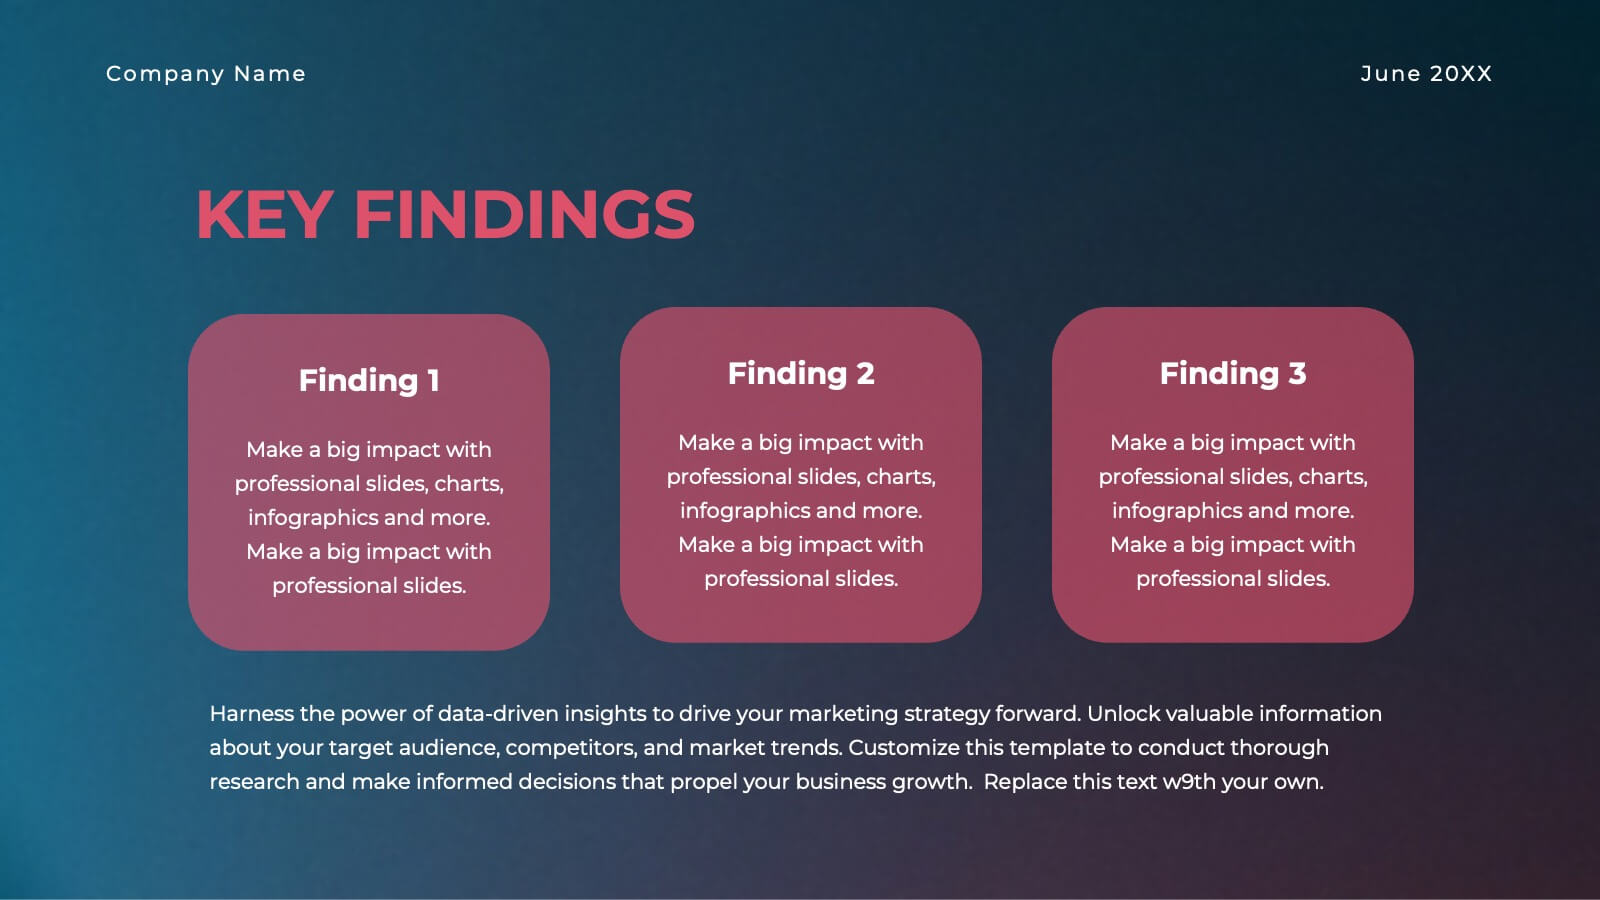
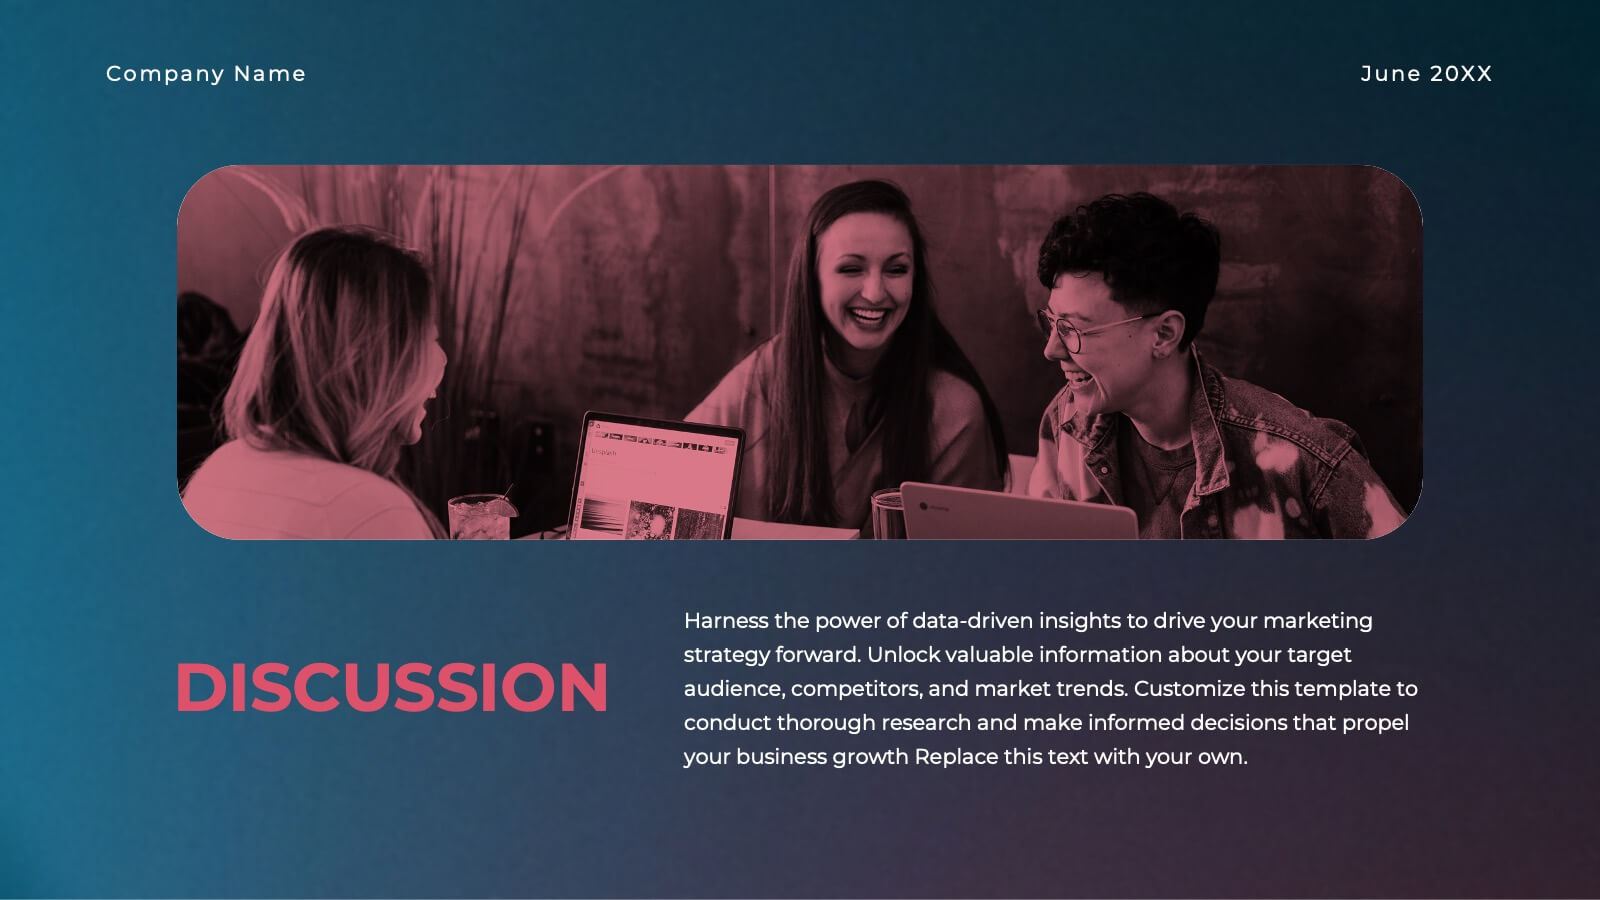
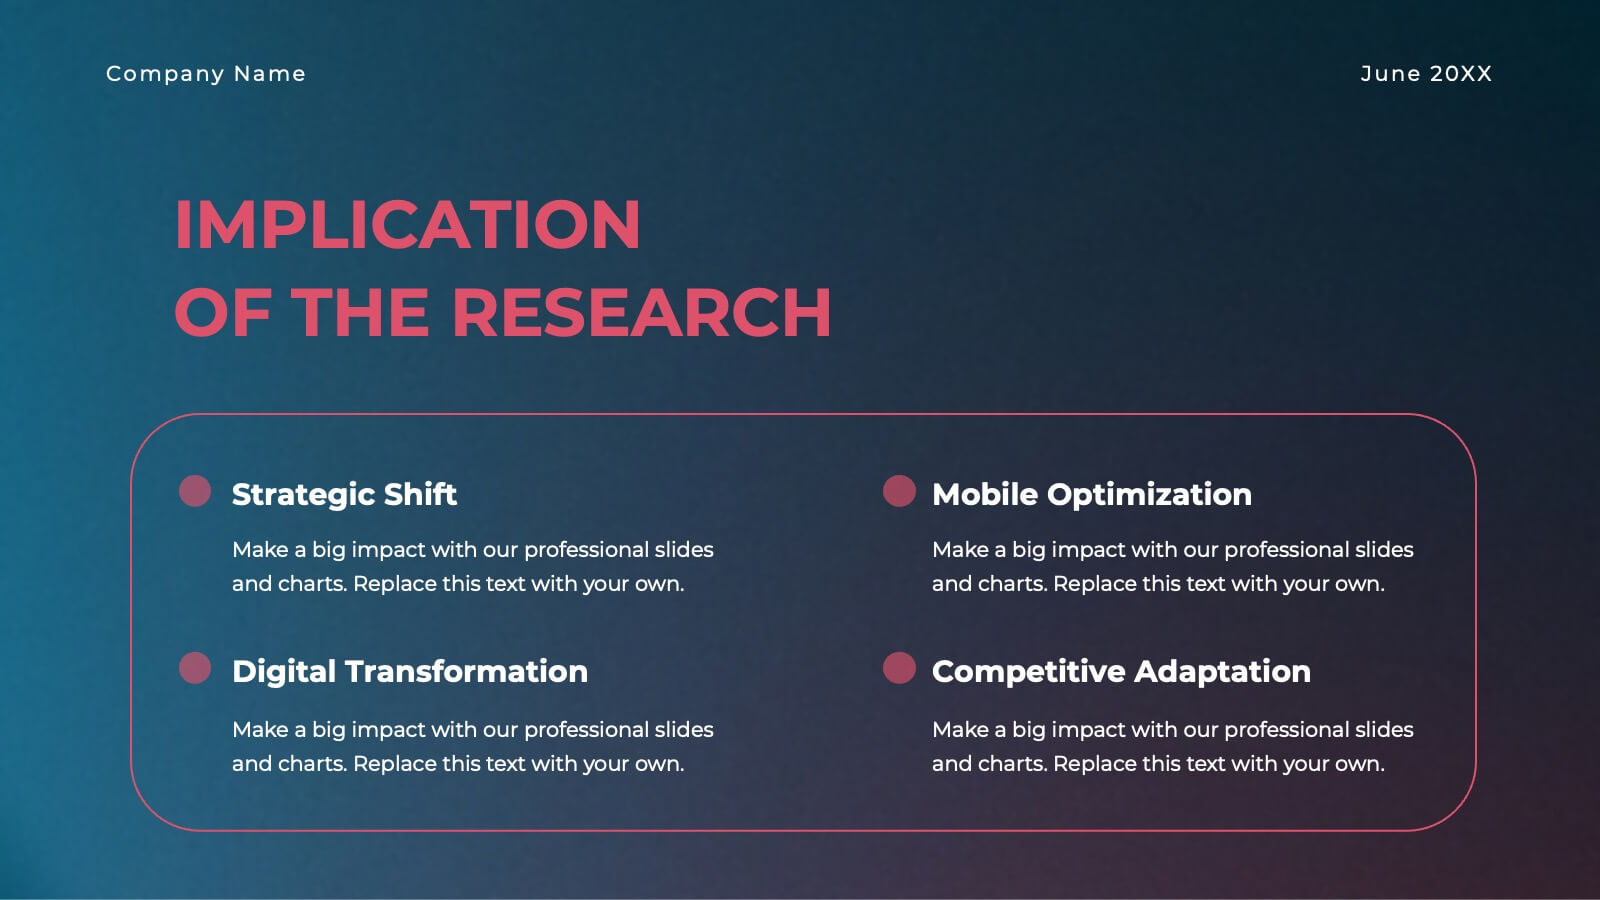
Gold Research Proposal Presentation
Present your research with impact using this sleek and modern research proposal template! Featuring sections for objectives, data collection, analysis, key findings, and recommendations, this template helps organize your research clearly and professionally. Fully customizable and compatible with PowerPoint, Keynote, and Google Slides, it's ideal for any research presentation.


10 slides
Strategic Business Action Plan Presentation
Create a roadmap for success with the Strategic Business Action Plan presentation. This well-structured template provides a clear, step-by-step framework for executing business strategies, making it ideal for corporate teams, entrepreneurs, and business consultants. Its modern design ensures effective communication of key goals and objectives. Fully customizable and compatible with PowerPoint, Keynote, and Google Slides.


7 slides
Vacations Travel Infographic
Are you ready to embark on a journey around the world? Our Vacations Travel Infographic is your ultimate guide to thrilling destinations, exotic experiences, and memorable adventures. Whether you're a passionate traveler seeking new horizons or an explorer at heart, this infographic is designed to ignite your wanderlust and set your vacation dreams on fire. Compatible with Powerpoint, Keynote, and Google Slides. Dive into the world of travel with this vivid infographic that sparks excitement and eagerness to discover what lies beyond. This template is not just a visual delight, it's a roadmap to your dream vacation!


7 slides
Home Office Scenes Infographic
Dive into the intricacies of the home office environment with our office scenes infographic. Rendered in a sophisticated palette of white and dark blue, this infographic offers an insightful visual exploration of today's work-from-home culture. With detailed icons and illustrative graphics, the design brings to life various scenarios and components of a home office. The layout is geared towards offering practical insights to its viewers. This template is perfect for remote work advocates, and any company transitioning to a hybrid work model. Compatible with PowerPoint, Keynote, and Google Slides this ensures seamless integration into your presentations.


4 slides
Wheel of Progress Planning Tool Presentation
Visualize goals, track development stages, or outline key initiatives with the Wheel of Progress Planning Tool Presentation. This dynamic circular design divides progress into four customizable quadrants (A–D), perfect for strategic planning, KPI tracking, or team milestone updates. Each segment features editable labels and supporting descriptions. Ideal for PowerPoint, Keynote, and Google Slides.


10 slides
Risk Evaluation and Control Measures Presentation
Showcase your strategy for minimizing business risks with the Risk Evaluation and Control Measures Presentation. This upward arrow layout helps illustrate progressive risk management stages—from identification to control. Ideal for business continuity plans, audits, and compliance reporting. Fully customizable in Canva, PowerPoint, Keynote, and Google Slides.


6 slides
Digital Education and E-Learning Trends Presentation
Present modern educational insights with clarity using this well-structured slide focused on digital learning trends. Featuring an icon-based circular layout around a graduate figure and six editable titles, it's ideal for showcasing online learning strategies, tech tools, and training programs. Designed to keep your content concise and visually engaging, this layout is perfect for educators, institutions, and e-learning professionals. Fully customizable in PowerPoint, Keynote, and Google Slides.


5 slides
Africa Country Borders Presentation
Bring geography to life with a clean, modern map design that highlights country boundaries and key regions across Africa. Perfect for showcasing regional data, market analysis, or project coverage, this layout ensures clarity and precision. Fully compatible with PowerPoint, Keynote, and Google Slides for easy customization and use.


6 slides
Preventative Healthcare and Fitness Presentation
Promote wellness and proactive care with this colorful and clean slide layout. Featuring a clipboard-style design with stacked icons and aligned descriptions from A to E, it’s perfect for presenting fitness tips, health programs, or preventative strategies. The vibrant sections help guide viewers through key points at a glance. Fully editable and compatible with PowerPoint, Keynote, and Google Slides.


5 slides
Construction Budgeting and Resource Allocation Presentation
Visualize your construction budget layer by layer with the Construction Budgeting and Resource Allocation Presentation. This pyramid-style infographic breaks down costs and resources—from materials and labor to safety infrastructure—making it easy to communicate project allocations. Fully editable in PowerPoint, Keynote, and Google Slides.