


Features
- 10 Unique slides
- Fully editable and easy to edit in Microsoft Powerpoint, Keynote and Google Slides
- 16:9 widescreen layout
- Clean and professional designs
- Export to JPG, PDF or send by email


Do you have any questions?
Recommend


6 slides
Modern Business Strategy Presentation
Bring your ideas to life with a sleek, forward-thinking presentation designed to communicate business growth and strategic planning. Ideal for outlining goals, performance steps, and innovation roadmaps, this clean and modern layout ensures every concept stands out. Fully compatible with PowerPoint, Keynote, and Google Slides for easy customization.


4 slides
Fleet and Delivery Operations Overview Presentation
Kick your logistics story into motion with a clean, easy-to-follow layout designed to showcase routes, deliveries, and operational steps with clarity. This slide helps teams communicate fleet performance, delivery processes, and workflow improvements in a simple, visual way. Fully compatible with PowerPoint, Keynote, and Google Slides.


4 slides
Veterinary Care and Health Tips Presentation
Keep your audience engaged with this clean, friendly infographic layout perfect for sharing animal care advice and clinic insights. Ideal for veterinarians or pet health professionals, it helps communicate tips, services, and best practices clearly. Fully editable and compatible with PowerPoint, Keynote, and Google Slides for easy customization.


6 slides
Corporate Performance Annual Report
Present key business metrics with precision using this Corporate Performance Annual Report slide. Designed with progress bars and intuitive icons, this layout clearly communicates departmental or project-based performance. Ideal for year-end reviews, board meetings, and investor updates. Fully editable in PowerPoint, Keynote, and Google Slides.


7 slides
Editable Gantt Timeline Presentation
Stay on top of your project deadlines with this Editable Gantt Timeline Presentation. Designed with a clean monthly layout and six task rows, it makes scheduling and tracking progress simple. Customize task names, durations, and icons easily. Perfect for PowerPoint, Keynote, or Google Slides for professional project planning.


5 slides
Team Roles and Collaboration Flow Presentation
Visualize how your team works together using the Team Roles and Collaboration Flow Presentation. This slide layout is designed to showcase key roles, responsibilities, and communication paths across sequential stages. Ideal for project managers, HR professionals, and team leads who need to define workflows clearly. Fully customizable in PowerPoint, Keynote, Canva, and Google Slides.


23 slides
Meteor New Product Proposal Presentation
The Meteor New Product Proposal template is the perfect tool for presenting your innovative ideas in a bold and professional manner. With its striking yellow and black color scheme, this template grabs attention while maintaining a clean and modern aesthetic. It’s designed to help you effectively communicate your product’s potential, covering key aspects such as problem statement, solution, market opportunity, competitive landscape, and unique selling proposition. The template also includes sections for financials, growth projections, and risk analysis, ensuring that every critical detail is covered. Ideal for startups, product managers, and marketers, this template is fully compatible with PowerPoint, Keynote, and Google Slides, making it easy to customize and present on any platform. Impress investors, stakeholders, or team members with a comprehensive and visually compelling proposal that highlights the strengths and opportunities of your new product.


8 slides
Financial Growth Planning Presentation
Plan and track financial success with this Financial Growth Planning template. This visually engaging slide features a stepwise roadmap with hexagonal icons, helping you outline budgeting, investments, and financial milestones in a clear and structured format. Perfect for financial analysts, business strategists, and executives, this slide is fully editable and compatible with PowerPoint, Keynote, and Google Slides.


19 slides
Prism Design Strategy Proposal Presentation
Bring your design strategy to life with this modern and stylish presentation template! Perfect for showcasing your design concepts, processes, and elements, this template ensures that your ideas are communicated effectively. With a sleek layout for design briefs, mood boards, prototypes, and project timelines, it's the ideal tool for creative professionals. Customize it easily in PowerPoint, Keynote, or Google Slides to make a lasting impression on your audience.


10 slides
Data Security and Privacy Measures Presentation
Illustrate your protection protocols clearly with the Data Security and Privacy Measures presentation slide. Featuring a smartphone icon secured with lock, shield, and magnifying glass elements, this layout is ideal for communicating encryption policies, access controls, and compliance steps. Fully editable in PowerPoint, Keynote, and Google Slides.


6 slides
Timeline Planning with Gantt Layout Presentation
Organize your schedules clearly with this Timeline Planning with Gantt Layout presentation. Designed for efficient project tracking, this template breaks down tasks across phases and months, using a clean horizontal bar layout. Perfect for teams, planners, and managers. Fully editable in Canva, PowerPoint, and Google Slides to suit any workflow.


4 slides
Attention-Interest-Desire-Action Sales Strategy Presentation
Highlight each phase of your sales journey with this clean and modern AIDA model layout. Designed for clarity, it uses bold semicircle visuals and directional arrows to guide your audience from capturing attention to driving action. Perfect for sales teams, marketers, and consultants. Fully editable in PowerPoint, Keynote, and Google Slides.


22 slides
Shield Digital Agency Strategy Plan Presentation
Embark on a journey to elevate your digital agency with this comprehensive and sleek presentation template! Perfect for showcasing your agency’s strengths, strategies, and successes, this template covers everything from market analysis to client testimonials. It’s designed to make your agency’s strategy plan stand out. Compatible with PowerPoint, Keynote, and Google Slides for seamless use.


7 slides
Social Media Management Infographic Presentation
Social media is an important part of any business, which is why you need the right tools to stay organized, save time, and boost your productivity. With the template you can design a fun infographic for your presentations, blog posts and social media posts. This is a great way to present Social Media Management topics including: marketing strategy, content creation, engagement, and growth. This template is compatible with Keynote, PowerPoint and Google Slides, so you can customize it in seconds. Download this template, and show your audience how social media can help their business grow!
20 slides
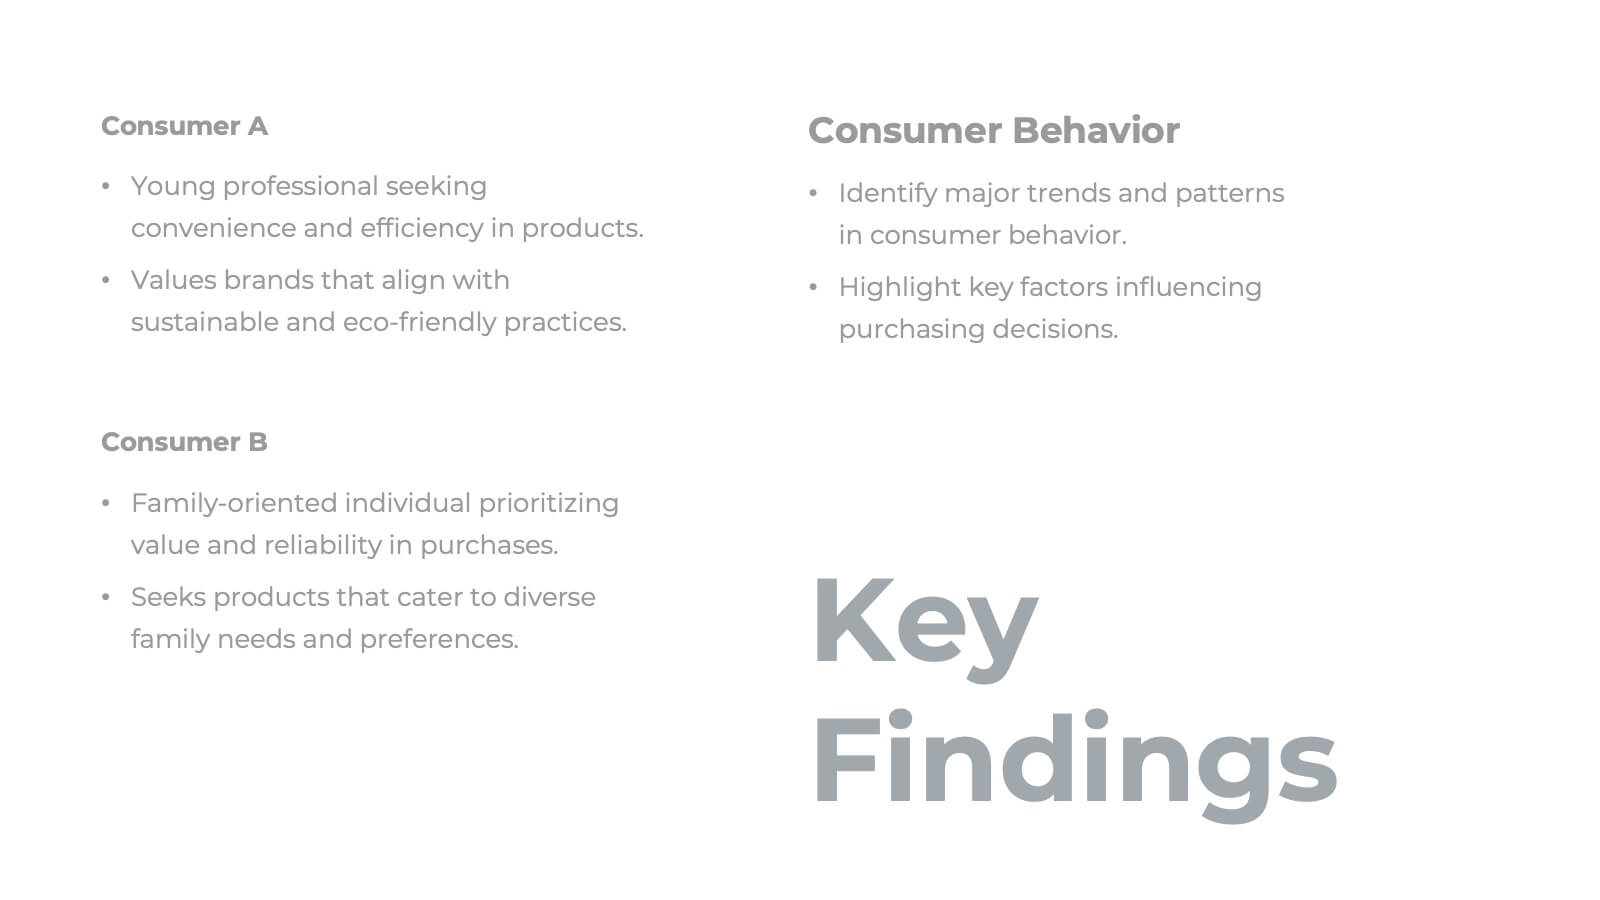
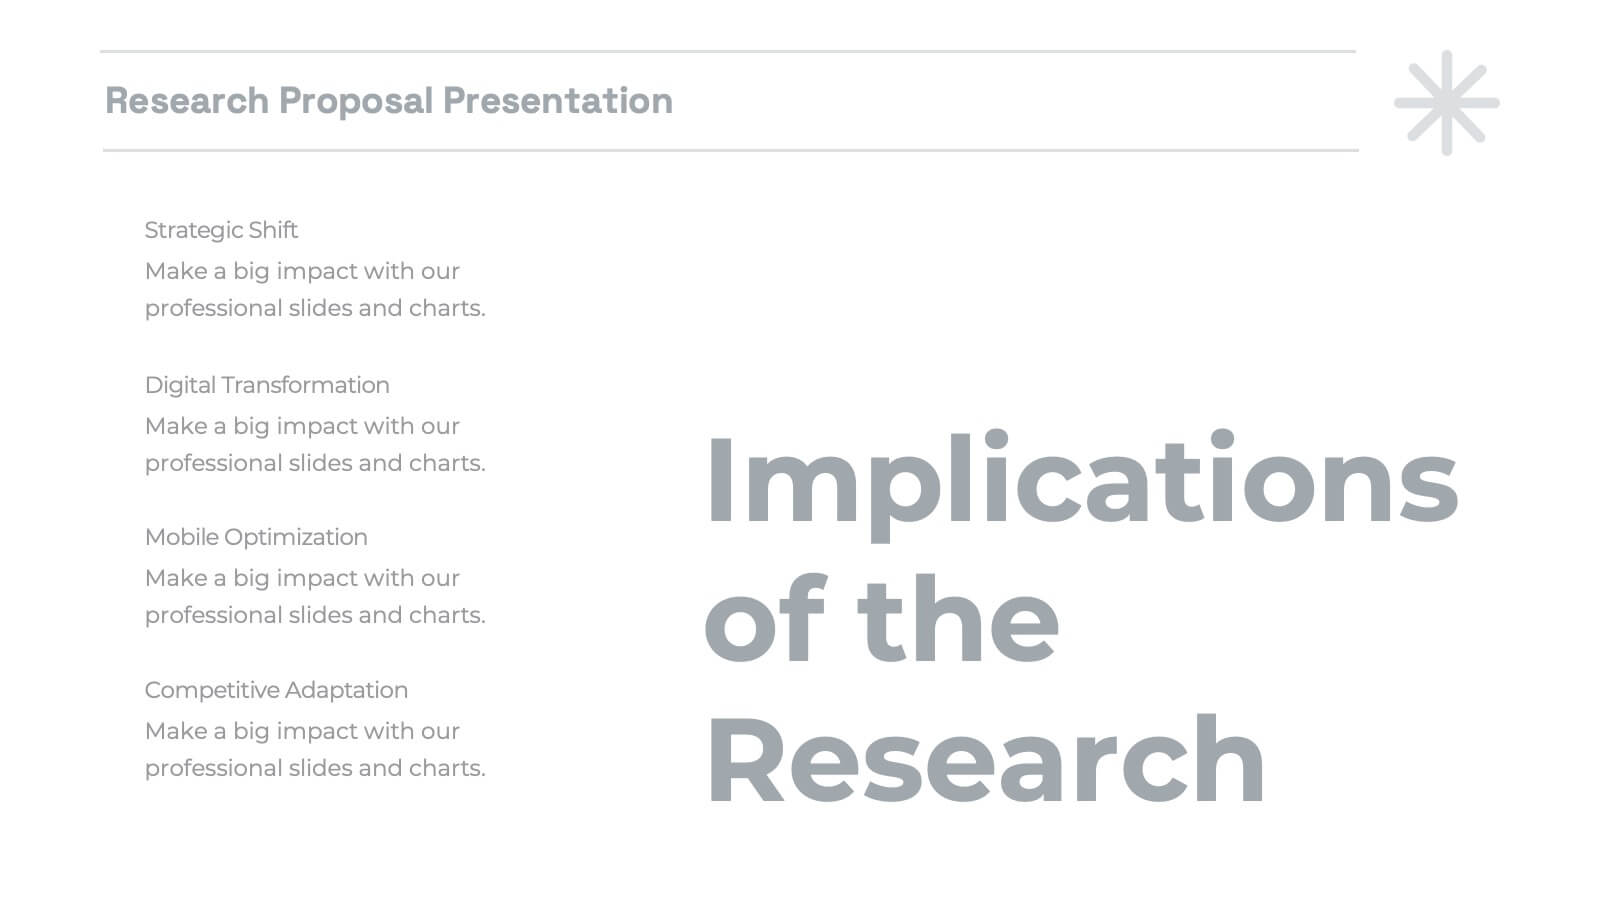
Malachite Research Proposal Presentation
Present your research findings with clarity and professionalism using this structured research presentation template! Covering all essential elements, from research objectives and methodology to key findings and implications, this template ensures your work is communicated effectively. It's perfect for academic, corporate, or scientific presentations. Compatible with PowerPoint, Keynote, and Google Slides, it's versatile and ready for your next project.


5 slides
Business Opportunity in Europe Map Presentation
Identify key growth areas across Europe with this clean, data-driven presentation. Highlight business potential using country-based color coding and progress indicators. Perfect for market analysis, investment pitches, or strategic expansion reports. Fully editable and compatible with PowerPoint, Keynote, and Google Slides for effortless customization and professional presentation delivery.


5 slides
The History of Beer Infographics
Beer has a long and fascinating history that dates back thousands of years, throughout its history beer has played a significant role in social, cultural, and economic contexts. These engaging infographics take viewers on a journey through the fascinating history of beer. It provides a comprehensive overview of the origins, evolution, and cultural significance of beer throughout different eras and regions. This visual resource is perfect for beer enthusiasts, historians, and anyone interested in the cultural and historical aspects of this beloved beverage. Compatible with Powerpoint, Keynote, and Google Slides.